The Power of Requests in a Redistribution Game: An Experimental Study

1
ITCS Abba Ballini, via Tirandi 3, 25128 Brescia, Italy
2
IIS Luigi Einaudi, via F.lli Sirani 1, 25032 Chiari (BS), Italy
3
Institució Catalana de Recerca i Estudis Avançats (ICREA), Passeig de Lluís Companys, 23, 08010 Barcelona, Spain
4
Department of Economics, Universitat Pompeu Fabra, Ramon Trias Fargas 25-27, 08005 Barcelona, Spain
*
Author to whom correspondence should be addressed.
Games 2019, 10(3), 27; https://doi.org/10.3390/g10030027
Submission received: 27 March 2019
/
Revised: 15 May 2019
/
Accepted: 11 June 2019
/
Published: 1 July 2019
(This article belongs to the Special Issue Social Norms and Games)
Abstract
:In most situations of voluntary contribution people are willing to give at the beginning, however contribution rates decay over time. In a new setup we introduce non-enforceable sharing rules, as requests, in a repeated redistribution game (called tip pooling). Three experimental treatments differ by the requested amount of sharing of privately known random endowments (tips), with one player never receiving any endowment. Using a hurdle model, we find no significant difference in free riding between the three sharing rules, but strong differences in positive contributions which, however, are lower than the rules prescribe. Furthermore, the average positive contribution remains stable over time, while free riding tends to increase.
1. Introduction
Rules in the form of requests regulate many organizational situations, such as management policies in business organizations, international regulations at the global level, or more concretely tip pooling in restaurants and cafés. In some cases, like in social dilemmas, these rules intend to make more salient an outcome where everyone benefits from coordination. In others, like in redistribution situations, only a minority may benefit from the coordination and most may see their material payoffs decrease, including those abiding by the rule.
Enforcement of these rules is sometimes difficult or impossible. Yet, some follow rules despite any extrinsic incentive to do so. In ethical theory, non-consequential motives of this sort are called deontological [1,2]. Many rules are internalized as social norms, like “you should not lie”, or “do your fair share” [3,4], or are compounded with consequences to motivate behavior beyond the maximization of one’s payoffs [5,6]. Others are explicitly formulated by an external institution and reminded to those having to take individual decisions. These rules are especially important in managerial and organizational contexts.
Our question is whether the power of requests can solve the problem of decay of contribution in redistribution games. We create an experimental setting where an external and explicitly non-enforceable rule asks subjects to share part of their material payoffs in order to reach a more equal distribution of resources. Depending on the experimental treatment, the rule demands different levels of contribution. Moreover, we create two sources of payoff asymmetry within groups of four interacting for 42 rounds: (1) one player never receives any endowment throughout the whole experiment; (2) each of the other three players receives a random endowment drawn independently from a known interval. This way we can observe whether the rule-induced contributions help to create a more equal distribution among all players and whether they remain constant (i.e., there is a constant price for sharing) or they vary as a proportion of the initial payoff (i.e., we see a proportional sharing factor).
More specifically, we implement a repeated redistribution game in the laboratory that we will call the Tip Pooling Game (TPG), because it mimics a few aspects of tip pooling in restaurants.1 Each player is assigned the role of either a “waiter” or a “cook” in a restaurant, which is maintained throughout the session. Waiters receive random endowments (“tips”), whereas the cook never receives any. In each round (“day”), after receiving their tips privately (the amounts are not known to others), waiters can decide how much to put in a common pot. Before deciding how much to contribute, all players are reminded of the rule of the restaurant, which in our case is one of three options: (R1) to share what they want, (R2) to share at least half of their tips, or (R3) to share all of their tips. It is also clearly stated that neither control nor punishment can be exerted on their behavior. Finally, group memberships, individual tips and contributions are kept anonymous throughout the entire experiment. Every seven days, the total amount contributed by waiters is shared equally between all players (waiters and cook). Thus, the game is a constant-sum game, unlike in a standard public game, in which contributions are socially efficient.
If waiters were rational agents, there would be no reason to share their tips. As opposed to public good games, where sharing can produce a socially optimal outcome, our game includes in the group a cook who never receives any tip and, therefore, can never contribute anything to the common pot. Since shared contributions are not increased in any manner as in a typical public good game, waiters cannot expect any monetary gain from sharing. In fact they are guaranteed to incur a monetary loss (see blog by Al Roth [10] for a current discussion on legal rules of tip pooling and related literature).2
On the other hand, there are three ethical reasons for subjects to share. First, they may share because it would increase the payoffs of the cook, in agreement with social preference theories (see, e.g., [12]). Second, they may share in order to be fair towards the other waiters who share. Third, they may share simply because they want to respect the rule stated by the experimenter.
Not surprisingly, our results show that waiters did not always share when asked, thus they did not strictly comply with the non-enforceable rules. More specifically, the rules did not affect the number of zero contributions significantly and an important proportion of subjects chose not to share under any of the rules. On the other hand, rules prescribing more equity resulted in more equitable redistribution: waiters shared 13% of their tips when free to share what they wanted, 19% when required to share at least half, and 31% when required to share everything. Furthermore, the rules seem to have weakened the decrease in sharing over time commonly observed in public goods experiments. Thus, we can say with confidence that non-enforced rules prescribing more equity resulted in a fairer redistribution of monetary payoffs. In all treatments, contributing waiters gave more in absolute terms when they received higher tips. However, the opposite holds about relative sharing, with the rich (i.e., those receiving higher tips in a given day) sharing relatively less than the poor (i.e., those receiving lower tips in a given day).3
A first implication of the results is that prescribing equity with a non-enforceable rule does not necessarily produce it, since the great majority do not fully comply with it. In a restaurant, for instance, tip pooling without visibility of the tips is affected by free riding and the equitable redistribution of tips a manager envisions might never happen, with the cook especially ending up disadvantaged. Research should further investigate the conditions under which a population of individuals chooses to follow a non-enforceable rule at the expense of their material payoff. For this purpose, a laboratory study seems a necessary first step, since the non-observability of tips in the field reduces the possibility of measuring contributions. Since we see a lot of non-compliance with the rule, but still significant differences of behavior between the different treatments, we believe that the experimenter demand effect (in this case complete compliance with the rule) is neglectable in our study.
A second implication is connected to the mechanism design literature, in which it is assumed that citizens in a democracy will free ride and evade taxes whenever they benefit from this [14]. Indeed, governments invest considerable resources in enforcing tax payment and decrease the probabilistic cost of tax evasion. According to our results, reminding citizens explicitly of their duties can be a complementary way to make them pay more taxes. Of course, simply stating a rule will not defeat evasion, but each extra contribution collected this way may cost fewer resources to the government than uncovering and prosting tax dodgers. Not only, it may foster internal motivation and avoid crowding out from tax compliance [15].
Game Theory has made relevant contributions to the understanding of social norms and value-oriented rationality (see for example [16,17] for the emergence of social norms), but there has been little experimental work testing how explicit non-enforceable rules may affect people’s choices. To date, experimental evidence of social behavior in the laboratory is about social norms that remain implicit or are designed with a social gain that results from coordination and motivates participants to behave in a non-opportunistic manner (e.g., [5,18,19]). Kessler and Leider [19] is an interesting example: They implemented non-enforceable norms in the form of “handshake agreements”. Players could choose whether to accept an agreement or not, and the type of agreement, before each turn of a double dictator game, two public good games, or a Bertrand game. Matching and role assignment were random at every round. In their setting, the handshake agreement was always part of the optimal contract, people chose it more than 80% of the times and some stopped using the contract in later rounds, possibly because they were aware they were not going to honor it. In our setting, on the contrary, players could not agree on a rule and none of the rules were advantageous for the waiters.
We hope that this emerging literature will invite researchers to further study the tradeoffs between non-enforceable rules and material payoffs.
2. Game
We call the game we propose Tip Pooling Game (TPG), which is a redistribution game. First n players are randomly divided in k cooks and n − k waiters (their roles) working in a restaurant. Then waiters receive private and non-verifiable random endowments t (tips) uniformly distributed in the interval [0, T], where T is the maximum tip. Cooks, on the contrary, never receive any tip. In each round d (day), after receiving their tips privately, waiters can decide how much to share with others, by allocating part or all of their money (the contribution c) to a common pool (the pot). Every 7 rounds (a week) the content of the common pot gets split in n equal parts and each player receives (and is informed about) her total share of the pot during this period. This means that the return R of player i on day d is:
where t and c are both zero for cooks, since they never receive any tip nor make any contribution. At the beginning of the game, and each day before contributions are made, all players are reminded of the rule of the restaurant set by the manager. The same non-abstract wording we used here was used also in the instructions for subjects. Further details on the rules of the game are given in the Experimental Design section and the Appendix A.
Note that, in a one-shot game, waiters have no material incentive to contribute to the common pot, because possible contributions come from n − k players (waiters) but are split among n players (waiters + cooks) and the content of the pot is not increased by a multiplying factor. In other words, TPG is a pure redistribution game. A rational agent driven only by her material payoffs will, therefore, never contribute anything to the common pot. Immaterial incentives, and thus social preferences (see e.g., [12,20]), on the contrary, may arise from the waiters’ concern for the cooks, or from the existence of a sharing rule.
Given the random nature of the endowments and the long time horizon implemented in our experimental design, a risk neutral agent with no social preferences would not need to share her endowment. However, risk sharing among risk-averse waiters could constitute an incentive to contribute. Our experiment thus intertwines distributional choices with intertemporal risk and assumes risk neutrality. Given that subjects receive information over time from other subjects, this also affects their choices. Therefore, a model including all these components would require introducing EUT (Expected Utility Theory) or Non-Expected Utility models such as Rank Dependent Utility (RDU) with learning. Harrison [21] (section D) combines a discussion of risky lottery choices with social preference choices in a one-shot game. In section C of the same paper, on the other hand, he discusses intertemporal choices with lotteries, but in an individual decision-making context. In the present paper, we give a careful descriptive analysis of behavior over time and individual mean contributions in the results section, also using a hurdle model as an alternative to a descriptive model including the different components just discussed.
The game simulates some basic features of the tip-pooling practice in a restaurant, where waiters, at the end of the day, put all the tips received from customers in a common pot, and the content is split evenly between all the workers once a week. This context is useful to make salient the presence of a sharing rule for which, like in a restaurant, no control on its compliance can be exerted for practical reasons.
Unlike in a restaurant, players in the lab experiment can take advantage of full anonymity, waiters are not required to perform any work to gain tips, and cooks do not provide any service. It is well established that interacting with other players increases contributions [22]. Sharing rules are also supposed to increase contributions, so avoiding anonymity would confound. Similarly, there is evidence that increased effort results in higher tips [23,24,25] and that this relationship is moderated by the random effect of customers’ personality and choices. In the present experiment we chose to replicate only the latter random effect—that way allowing contributions to depend only on tips and the rule of the restaurant. We did not eliminate variability in tips and kept them private to each player, because otherwise waiters could compute their expected return and decide to punish others’ free riding, yet another confound.
Finally, TPG can be considered a special case of an asymmetric public good game (PGG) in which one of the players never receives any endowment and the multiplicative factor of the resources allocated to the common pool is not greater than 1 (i.e., sharing does not produce an increase in collective wealth), while in a usual PGG the multiplicative factor is always greater than 1 (i.e., sharing produces an increase in collective wealth). More formally, in public good games each of n players can invest resources ti from their endowment ei in a public good that is shared by everyone, player i receives back from the common pool in round d:
where m is a multiplicative factor and m/n is the total per-unit value. In the current implementation of TPG, for waiter i and round d, the share she gets back from the common pool is:
The per-unit value m/N is 1/4 and the actual m = 3/4 is smaller than one; hence sharing is collectively and individually disadvantageous for waiters, as already pointed out.
3. Experimental Design
The LEEX (Laboratori d’Economia Experimental) in the Department of Economics and Business at UPF (University Pompeu Fabra), Barcelona, Spain served as the experimental setting. This laboratory contains 20 computers, connected by an internal network to a master computer. The experiment was programmed using the software zTree [26], version 2.1.6.
Participants were recruited via ORSEE [27], the electronic online database of the Department of Economics, which consists of undergraduate students enrolled at UPF in different faculties. In the present study, 96 volunteers participated, 32 for each of 3 experimental conditions. The sample included 35 females and 61 males, enrolled between 2000 and 2005 in the faculties of Economics and Business Science, Law, Translation and Interpretation, Media Studies, Political Science, Engineering, Humanities, and Biology. Instructions (see Appendix A) were read aloud at the beginning of the experiment and questions were answered in private.
The experiment implemented the Tip Pooling Game (TPG) on groups of four players, one of which was a cook. The roles of cook or waiter were assigned randomly to players and did not change during the whole experiment. Individual players did not know other players’ roles, nor which players were members of their group. We ran six sessions with four independent groups each. In two sessions participants were free to share how much they wanted (R1, our control treatment), in other two they were requested to share at least half of their tips (R2) and in the remaining two they were required to share all of their tips (R3). The precise phrasing of the sharing rules was:
- (R1)
- “The rule of the restaurant is that each waiter can choose how much they wish to put in the common pot.”
- (R2)
- “The rule of the restaurant is that each waiter puts at least half of their tips in the common pot.”
- (R3)
- “The rule of the restaurant is that each waiter puts all their tips in the common pot.”
Rules implemented by the experimenter could potentially induce experimenter demand effects. Nonetheless, the question is how subjects react to such rules in the first period and over time.4 The sharing rule specific to each group was stated in the instructions and reported on the computer screen at the beginning of each round. It was clearly specified to everybody that no control was going to be exerted over the sharing behavior and that both tips and contributions were going to remain private information to each player. In the instructions this reads: “You will not be told what the other members will receive and choose to share. Neither will you be told who the other members of your group are.” However, the experimenter could know what each subject had done, as it is typical in lab experiments.5
In each session a group interacted for 42 periods (days). Waiters received tips (integers) varying randomly between 0 and 30 ECU (experimental currency units), with each of the 31 values having equal probability of being drawn, and had to specify the amount (between 0 and the received tip-amount) they wanted to give to the “pot” in each period. Since all received tips were recorded, we were able to see whether they behaved differently when they received smaller tips or bigger tips, and also to study the variations in contribution over time. Typically, in Public Good Games or redistribution games players suffer from others’ free riding and respond by sharing less and less over time [32]. Meanwhile, cooks were provided with hypothetical tips and asked to make hypothetical choices, i.e., to report how much they would have shared had they been waiters. The main reason for these choices was to make the cooks’ behavior and function indistinguishable from that of waiters so that nobody could identify them by looking around the room. Cooks were not monetarily incentivized (no tips were received), so we will not report the cooks’ behavior.
Every 7 rounds (a week or period), players were reminded about their own tips, their own contributions to the common pool, and their own resulting share of the common pool for each period. They were also informed about their overall gain up until the current round. This information was displayed in a history table. Note that the players’ own return from the common pool was the only indirect available information on others’ behavior. Group membership and individual contributions of others were kept anonymous throughout the entire game. For each round and each waiter, the computer program stored contributions and earnings.
At the end of the experiment, players were paid in private the total sum earned during the experiment. Each ECU earned was multiplied by 0.025 euros.6 Thereafter, the participants were thanked and dismissed. The total duration of the experiment was about 90 min and the average earning was 11.74 euros.
4. Results
The process that generated tips was purely random and the integer amounts varied between 0 and 30, with an expected average tip of about 15 ECU, the same for all 3 sharing rules, for each group and for each 6-week period. While the expected contribution of a player driven only by her material payoffs is zero as discussed above, the average expected contribution of a player sharing all her tips is thus 15. All analyses presented below were conducted in Stata, version 15.
4.1. Mean Contributions Across Subjects Over Time
Result 1:
Mean contributions decrease over time. There are significant differences across sharing rules, with contributions increasing for increasing rule requests.
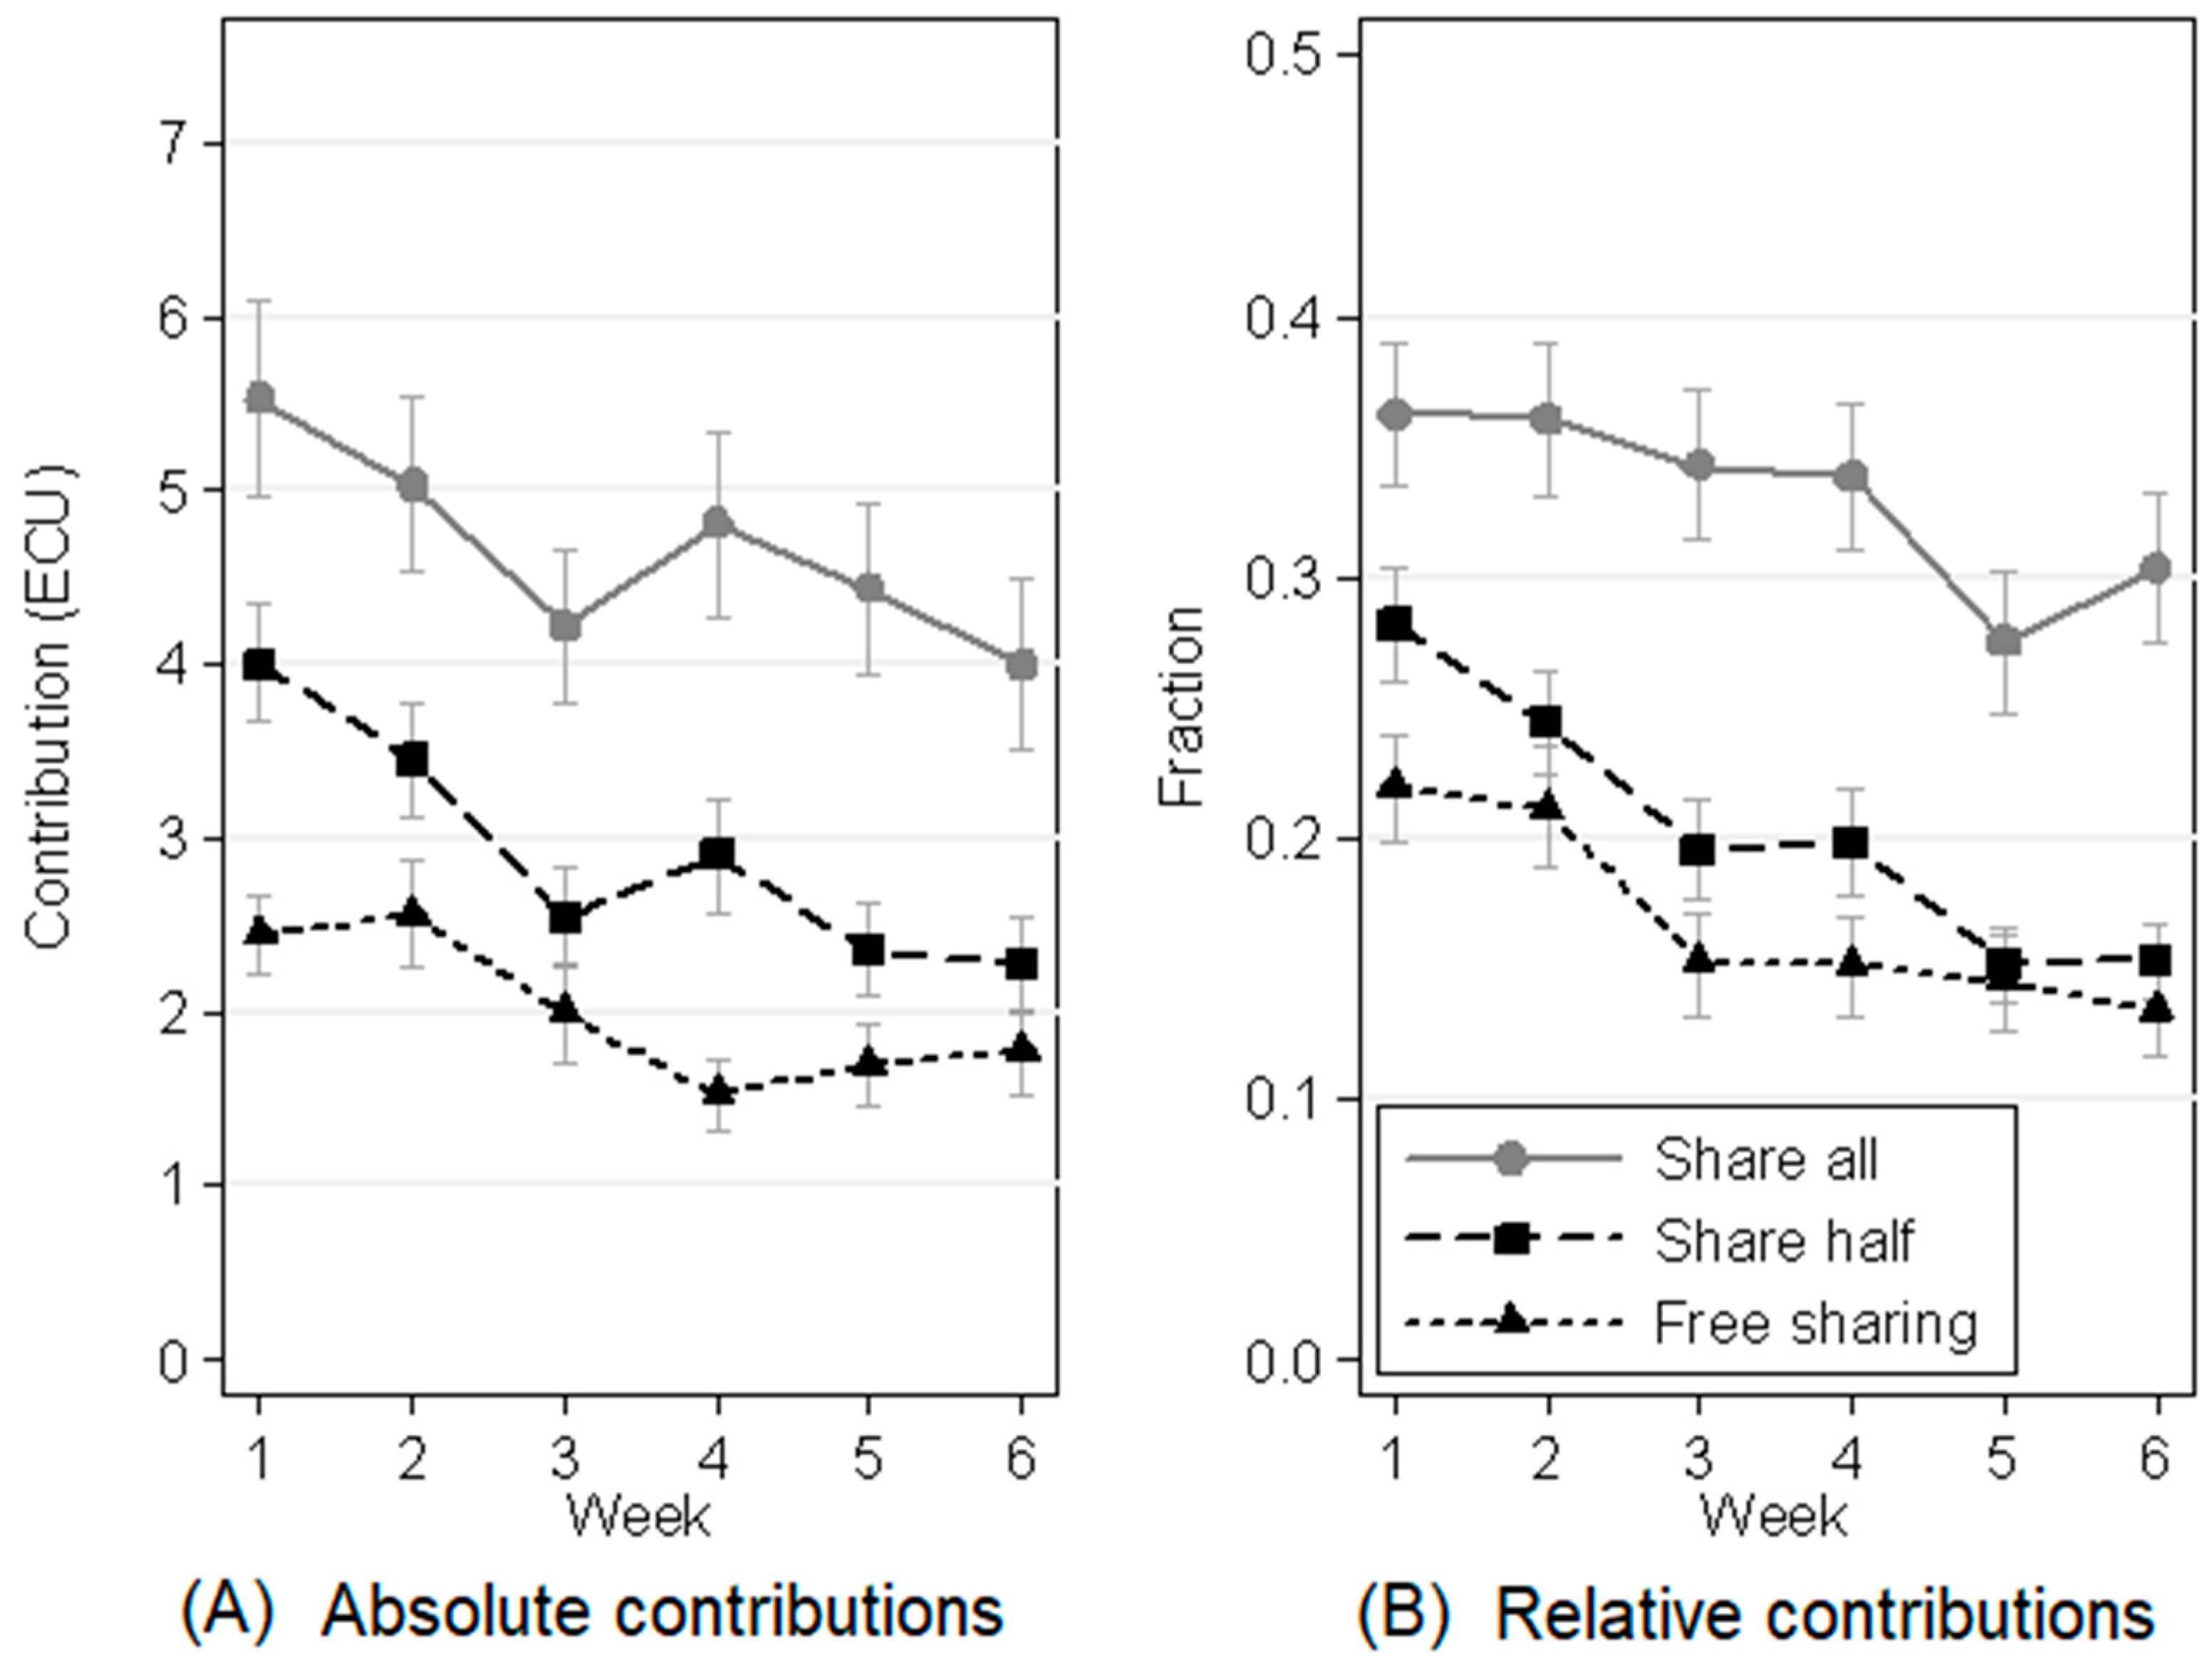
Figure 1A shows waiters’ observed mean contributions by week under the different sharing rules. There was an overall decrease in contribution, common to all sharing rules, from an average of 3.99 the first week to 2.68 the last week, significantly more than zero but much lower than the expected contribution of 15. There was also a clear difference between the three sharing rules: The mean contribution was 2.00 = 13% for Free Sharing (R1, triangles), 2.92 = 19% for Share Half (R2, squares) and 4.67 = 31% for Share All (R3, circles). Thus, Share Half increased contribution by 46% over Free Sharing, while Share All caused an increase of 134% over Free Sharing and 60% over Share Half. We will discuss the significance of the results below, using a hurdle model.
Figure 1B shows the same data as Figure 1A but in relative terms, i.e., contributions were divided by the tip received by each participant at each round. Rounds with tips of 0 were excluded, to avoid arbitrary scoring decisions, such as considering them 0% contribution or 100% contribution rounds. The pattern of relative contributions is consistent with that of absolute contributions, both across rules and over time.
Both tips and contributions were integers and there was an inflation of zero contributions, which were 44% of the total. Hurdle models, commonly employed to describe zero-inflated count data in Health Economics, seem the best choice to analyze our data and their use has been already advocated for dealing with the high percentage of zero contributions collected in experimental games, mainly public goods and dictator games [34]. The basic idea of the hurdle model we use is that waiters’ decisions can be decomposed in two processes: the first process is binary and one chooses whether to share or not (the hurdle is crossed if waiters decide to share); then for non-zero contributions the second process determines how much gets shared. The first process can be represented with a binomial probability model (here we use a random-effects logistic regression for panel data), the second with a count model for positive contributions (we choose a random-effects Poisson regression for panel data). The two steps of the hurdle model can be estimated separately and still give consistent estimates [35]. We will see below that separating the zero contributions from the positive contributions reveals how the decrease in contribution over time shown in Figure 1 is driven by the increase in waiters deciding to share nothing, while those who shared did not seem to decrease the amounts they contributed.
Result 2a:
Zero contribution rates increase over time for all sharing rules, being steeper for Free Sharing and Share Half than for Share All.
Result 2b:
Positive contribution rates are constant over time and ordered according to the sharing rules. Yet, sharing requests are far from being met.
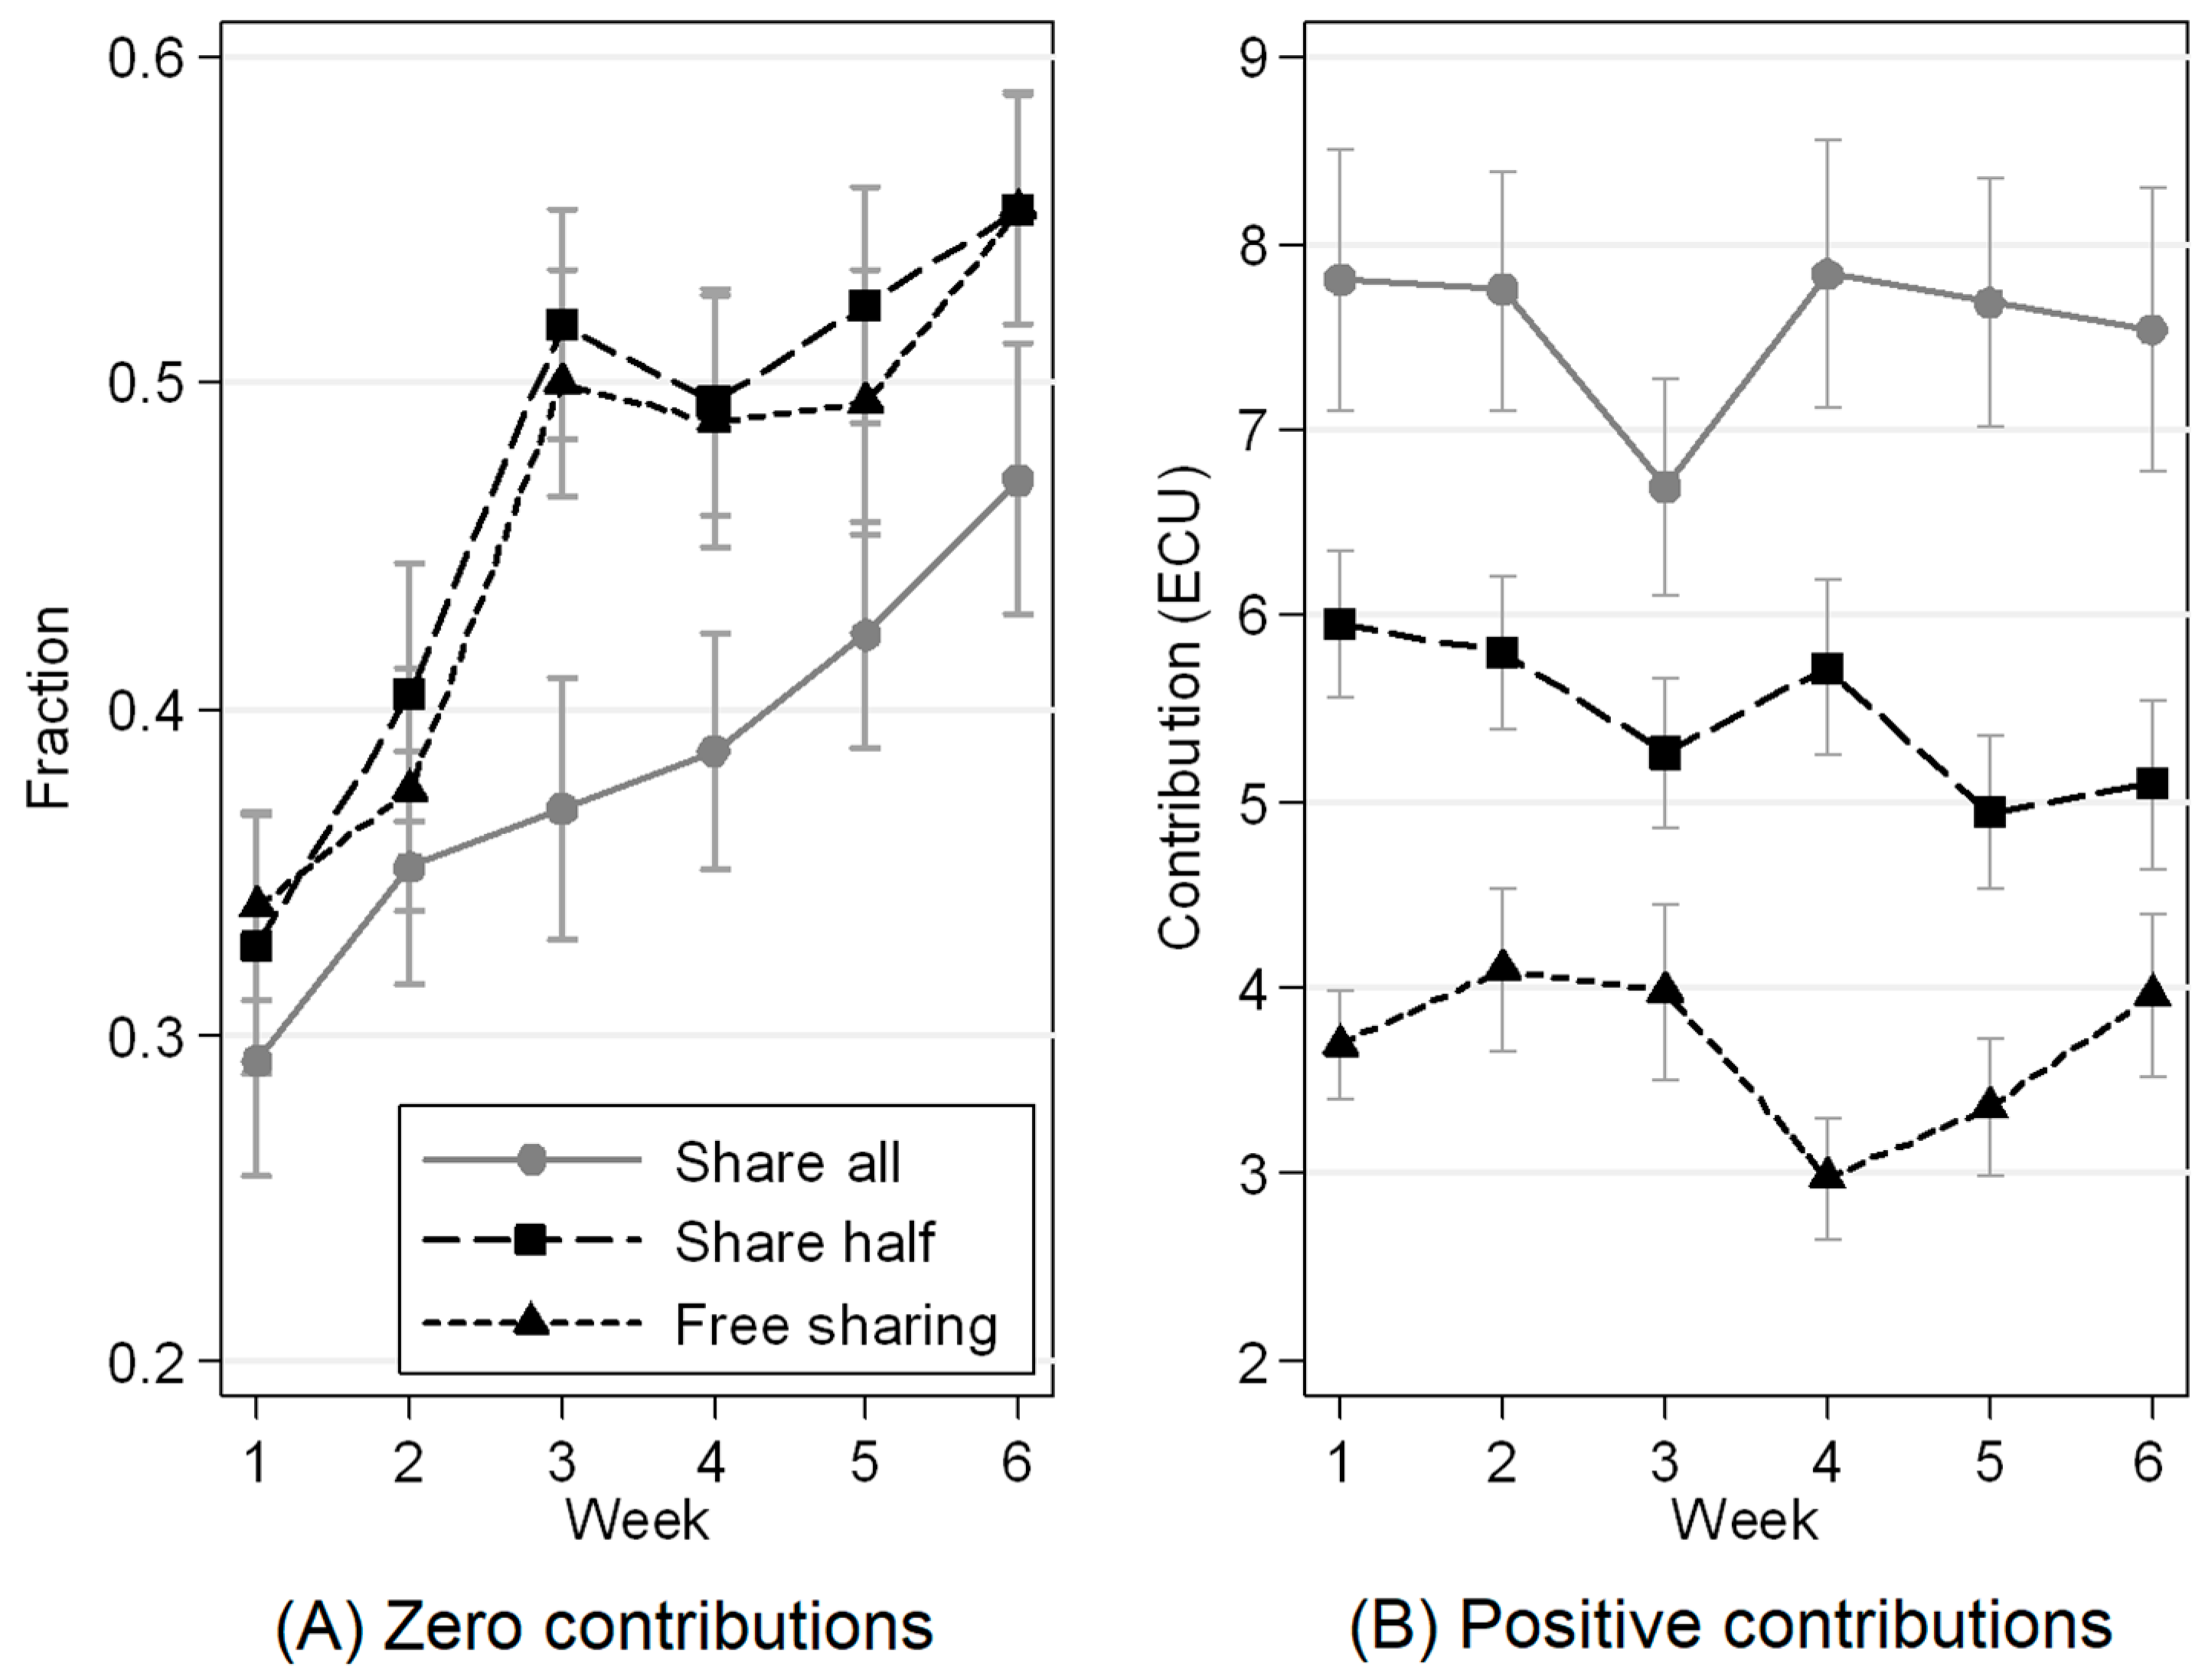
Count data are known to be Poisson-like and in fact the frequency distribution of our data is bound at zero with a long positive tail, a mode at 0 ECU, the median at 1, the mean at 5.67 and the variance at 29.51. Figure 2 displays the same observed means reported in Figure 1A, but split in zero and positive contributions. Splitting the waiters’ data allows us to observe the different effects of sharing rule and time separately on the two processes modeled by the hurdle model. Zero contributions increased with time, from 32% of all contributions in the first week to 53% in the last, while there were no clear differences among sharing rules (see Table 1A). On the contrary, positive contributions remained fairly constant over time but showed differences across sharing rules: Mean contributions were 3.69 ECU = 23% for Free Sharing, 5.51 = 35% for Share Half and 7.55 = 48% for Share All. Thus, for positive contributions, Share Half increased contribution by 49% over Free Sharing, while Share All caused an increase of 105% over Free Sharing and 37% over Share Half.
This pattern of results is confirmed by both components of the hurdle model (see Table 1). The logistic regression on zero contributions suggests that sharing rules did not significantly affect the likelihood of contributing nothing, while there was a significant increase in zero contributions over time: the odds of a zero contribution increased by a factor of 1.48% every week, starting from an estimated probability of 36% for the first week and up to 56% for the last week, in good agreement with the data. The Poisson regression on positive contributions shows a significant change of contribution across sharing rules but not over time: by exponentiating the coefficients, we can see that waiters in Share Half contributed on average 1.42 ECU more than in Free Sharing, while in Share All they contributed 3.23 ECU more than in Free Sharing. The estimated mean of the non-zero contributions go from 3.83 ECU in Free Sharing to 7.06 in Share All, again in good agreement with the data. In both the logistic and the Poisson regression, errors were clustered respecting the hierarchical structure of the data (multiple observations per waiter and 3 waiters per group) and tips were controlled for.
4.2. Relationship between Contribution and Tips
The hurdle model considers tips implicitly (tips are the exposure variable of the Poisson regression). To study the relation between contribution and tips explicitly, we present the results of three linear regressions for panel data on zero contributions, absolute positive and relative positive contributions (see Figure 3 below and Table A1 in Appendix B for the regression table).
Result 3a:
Zero contribution rates decrease with increasing tips.
Plotting zero contributions against tips shows clear trends (see Figure 3A and Table A1). For all rules, zero contributions are more likely for lower tips (the poor in a given day) than for higher tips (the rich in a given day). The estimated probability of zero contributions decreases from 54% when tips are 1 ECU to 37% when tips are 30 ECU, in good agreement with the data. While the effect of rules is not significant, Share All tends to decrease the probability of zero contributions compared to the other rules: Estimated means are 46% for Free Sharing and Share Half combined against 38% for Share All.
Result 3b:
Positive absolute contributions increase with increasing tips, while positive relative contributions decrease with increasing tips.
As opposed to the downward trend for zeros, the correlation between tips and absolute positive contributions is significantly positive and Share All significantly increases contribution compared to the other rules (see Table A1). Waiters contribute an estimated average of 0.65 ECU when receiving 1 ECU and 6.13 ECU when receiving 30 ECU, while estimates across rules suggest an average contribution of 2.47 ECU in Free Sharing and Share Half combined against 4.65 ECU in Share All. Estimated means are lower than the observed means but show the same trends.
The same downward trend seen for zeros, on the other hand, is seen also for relative contributions. according to the estimated means, waiters share on average 30% of a 1 ECU tip but only 18% of a 30 ECU tip (Figure 3B and Table A1), suggesting that while higher tips make it less likely that waiters contribute nothing, it also decreases the fraction of tip that will be contributed. Across rules, the estimated average contribution is 19% in Free Sharing and Share Half combined against 33% in Share All. From Figure 3B it also appears that the differences in contributions between Share Half and Share All may arise at higher tips.7
4.3. Results about Individual Contributions
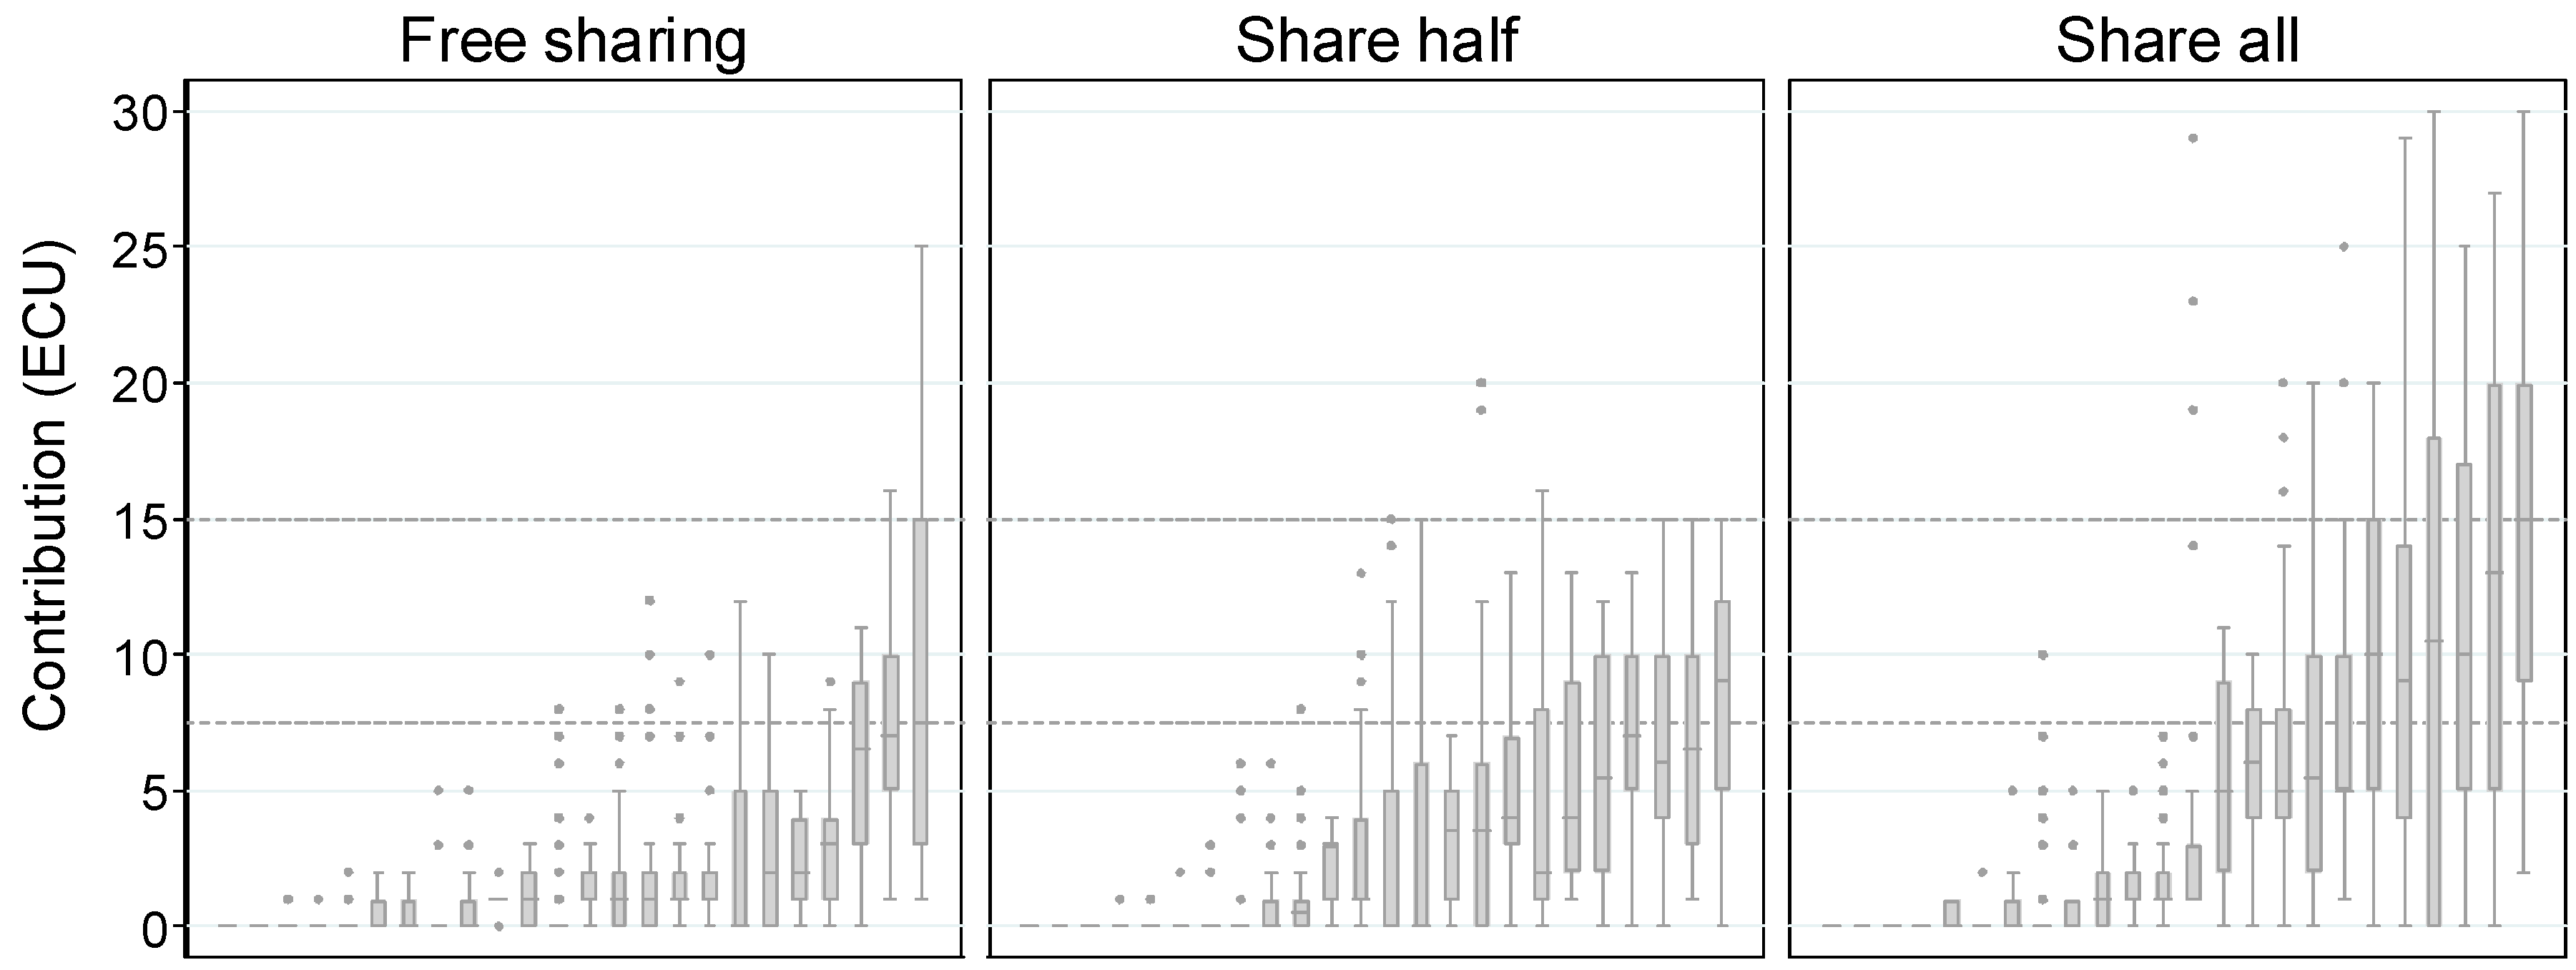
In this section we report on individual differences. Figure 4 shows the distribution of contributions for each subject with boxplots, divided by treatment and ordered by mean contribution within each treatment.8 In Figure A1 (Appendix B) we show the same boxplots, but clustered by group and Figure A2 (Appendix B) reports relative sharing over time for each individual, excluding choices made after receiving zero as tip. We see that individual contributions varied strongly across subjects within the different treatments. In Share All, giving half was often reached, while in Share Half, giving half seemed to represent an upper bound.
Result 4:
There are more waiters contributing 50% or more of their tips when the sharing rule is more demanding than when the rule demands less.
The number of individuals contributing on average 50% or more presents a strong statistical difference across sharing rules according to a Kruskal–Wallis test (χ2(2) = 74.14, p < 0.001). In Free Sharing only 2 waiters out of 24 shared half or more (7.5 ECU or more on average) and only 3 shared ¼ or more (3.75 ECU or more on average). In Share Half only 2 waiters shared half or more, but there were 9 who shared ¼ or more. Lastly, in Share All the number of waiters sharing half or more went up to 7 and the number of those who shared ¼ or more reached 12. For Share Half the 50% reference point seemed to work more as an upper bound (on average) than a lower bound as suggested by the rule. This circumstance makes the use of Share Half for practical purposes much less appealing than Share All, where contributing half or more is observed much more often (see Figure 4 and the figures in Appendix B).
Result 5:
The number of individuals contributing nothing most of the times did not seem to vary across sharing rules, while the number of those contributing nothing varied more consistently, being higher for more demanding rules.
The number of waiters contributing zero 75% of the times or over was fairly independent from the sharing rule (7/24 in Free Sharing, 8/24 in Share Half and 6/24 in Share All), while the number contributing zero rarely (25% of the times or less), which is 9/24, 11/24 and 14/24 respectively, showed a mild increase with more demanding sharing rules.
On the contrary, the number of waiters contributing all their tips at least 10% of the time were 9/24 in Share All and only 4/48 in the other 2 rules combined. Finally, those contributing half or more at least 10% of the time were 13/24 in Share All, 9/24 in Share Half and 7/24 in Free Sharing. Thus, in general, the rules affected sharing but full compliance with the rule was uncommon.
Next, we will focus on contributions made in the very first day and the first week, when players had no information about others’ behavior.
Result 6:
Full compliance with the rule in the first day or in the first week was far from complete, but fairly stable across rules.
On the first day, full compliance with the rule was chosen by 3/24 waiters in Share All and 5/24 in Share Half, while in Free Sharing 6/24 shared at least half. There is no significant difference in full compliance between the different sharing rules (Kruskal–Wallis χ2(2) = 1.22, p = 0.54). These results show that full compliance (Share All and Share Half) was adopted by a minority of waiters in the first day and that a similar number of individuals shared at least half in Free Sharing and Share Half. In the first week (so before players got any feedback on others’ contributions) waiters fully complying with the rule at least once were 7/24 in Share All and 13/24 in Share Half, while 11/24 shared half at least once in Free Sharing.
The comparison between Free Sharing and Share Half can help disentangle rule compliance from a possible experimenter demand effect). Since in both treatments the number of waiters contributing at least half was very similar and since this sharing behavior was not indicated by a rule in one of the two treatments, one can imagine that sharing originated either by waiters’ personal considerations (e.g., fairness), or that they felt an implicit expectation from the experimenter’s side that they would have to share. Either way, contributions in Free Sharing and Share Half diverged significantly in the following weeks, suggesting that the effect of the rule gained importance over time.
5. Comparison with Public Good Data
Contributions in public good games vary substantially according to group size, number of periods, anonymity, communication, punishments, multiplicative factor m, and per-unit value m/n. Ceteris paribus: group size is of minor importance if m is kept constant [32]; contributions decrease over periods; knowing others’ identity, communication, and the possibility to punish others all increase cooperation [22,32,36]; finally greater per-unit values increase contribution [37,38], but the key factor seems to be m rather than m/n [32].
We should then compare Tip Pooling with similar public goods repeated games with complete anonymity, no communication or punishment mechanisms, and similar multiplicative factors m. Since we could not find any public good game with m < 1, we expect contributions to be lower in Tip Pooling and our best comparison are four games taken from [36,37,38] with n = 4, 10 and 40, d = 10, and m = 1.2. The average contribution was about 20%, decreasing roughly from 40% in the first round to 5% in the last one.
Tip Pooling, having n = 3 waiters, d = 42 and m = 0.75, resulted in an average contribution of 23%, decreasing from 29% to 20% across all sharing rules. In the free sharing condition, the average contribution was 17%, decreasing from 22% to 14%, the full request set-up it was on average 31%. The results above suggest that players in Tip Pooling surprisingly shared on average approximately the same amount as players in comparable public goods games. Contributions were lower at the beginning but also decreased very little over periods: yet more encouraging evidence of the effectiveness of unenforced rules.
6. Conclusions
The experiment demonstrates that the explicit presence of a sharing rule is able to influence behavior toward a fairer collective outcome and offsets personal material self-interest, at least for some individuals. Participants instructed to contribute at least half of their tips shared more (19%) than when no level of sharing was required (13%). Similarly, those reminded to contribute all their tips shared more (31%) than those reminded to contribute at least half (19%).
When no level of sharing is imposed, the main reason to share is fairness towards the cook and the other waiters who share. Therefore, the doubling in sharing observed under the “Share All” rule can be explained by some waiters respecting a deontological obligation defined in the introduction as following a norm.
Although our results indicate that rules are not strictly followed, this evidence is of significant practical relevance for restaurants and institutions in general, where it is often difficult or expensive to control compliance to rules and norms. It shows that it is still worth stating explicit rules because they have some value beyond their punishment and some power to influence behavior, particularly if they are perceived as fair or ethical [39]. These authors argue that, as long as taxes and politics are perceived to be fair and legitimate, citizens are willing to be honest beyond any value maximization calculation.
When left free to decide how much to share, our participants shared 13% and not nothing as would be expected if they were maximizing only their material payoffs. That is good news for whoever does not wish to impose rules of sharing and still expects positive contributions, or when crowding out is a concern. On the other hand, when asked to contribute everything, participants shared only 31% of what they received. This could be considered bad news if compared to full contribution, but also good news because the rule caused a dramatic increase in contributions, 2 ½ higher than when the requested contribution was not quantified.
The results of the experiment give also some insight on how different sharing rules may promote fairer outcomes even though it does not suppress free riding (zero contributions). The average free riding was 44%, was independent from the different sharing rules, and increased over time from 32% in the first week to 53% in the last.
Moreover, zero contributions were less likely at higher tips (for the “rich”). In a somewhat opposite direction, the percentage of tip contributed was higher for lower tips (for the “poor”), but at the same time the effect of a sharing rule was more apparent at higher absolute tips than lower tips.
Finally, despite the increase in free riding, non-zero contributions remained sustained throughout the 42 rounds. In other words, the effect of the rule on positive contribution proved to survive over time almost intact until the end of the experiment. These results are interesting in light of those obtained in public good games, where dramatic decay in contributions is usually observed. More experiments with (non) enforceable rules should be tested in different contexts.
Author Contributions
Conceptualization, R.P., R.N. and M.L.M.; Data curation, R.P.; Formal analysis, R.P. and R.N.; Funding acquisition, R.N.; Investigation, R.P. and R.N.; Methodology, R.P. and R.N.; Software, R.P.; Supervision, M.L.M.; Visualization, R.P., R.N.; Writing—Original draft, R.P.; Writing—Review & editing, R.P. and R.N.
Funding
R.N.’s and M.L.M.’s grants SEJ2005-08391, ECO2014-56154-P of the Spanish Ministry of Education.
Acknowledgments
R.N. and M.L.M. thank the Spanish Ministry of Education; Generalitat de Catalunya, and Barcelona Graduate School of Economics. R.P. thanks the hospitality of Universitat Pompeu Fabra during his stay when this study was conducted. Finally, we thank James Andreoni, Elena Bertoglio, Antonio Cabrales, Gary Charness, Irina Cojuharenco, Simon Gächter, Jaume Garcia, Glenn Harrison, Robin Hogarth, Eric Johnson, Thijs van Rens, and Elke Weber and two anonymous referees for many valuable comments.
Conflicts of Interest
The authors declare no conflict of interest.
Appendix A
Instructions
Thank you for participating in this experiment. The instructions are the same for all the participants.
From now on, until the end of the experiment, you are not allowed to communicate with each other. If you have a question, raise your hand and one of the instructors will answer it in private. Please, do not ask aloud.
The Situation
You are a waiter in a restaurant downtown, where two other waiters and a cook work.
The first night, the new owner of the restaurant explains to you how to do your job and how to behave with customers.
Then he tells you the rule of the restaurant is that all the waiters put their tips in a common pot and, at the end of each week, the accumulated tips are split evenly between the waiters and the cook, since all of them contribute with their work to customers’ satisfaction. Since control over the sharing behavior is almost impossible, the amount of tips put into the pot by each waiter is based on their honesty.
The Experiment
You and the other participants will be split randomly in groups of four. During the entire experiment you will belong to the same group. Each group will constitute three waiters and one cook. Each member will be randomly assigned the role of waiter or cook, which will remain the same throughout the entire experiment.
This experiment lasts six weeks (or sessions). In each week there are seven days (or periods). In total you will have to make 42 decisions, i.e., you will have to decide how much of your tips (tokens) you will share with the other members of your group.
If you are a waiter
At the beginning of each day, you will receive a tip, whose amount will be a random number of tokens comprised between 0 and 30. All possible numbers are equally likely and vary from person to person.
At the end of each day, you will have to decide how much of your tip you wish to put in the common pot.
If you are a cook
You will never receive any real endowment during the six weeks. Nonetheless, you will be asked to imagine what amount of your tip you would share were you a waiter. At the beginning of each day, you will receive a hypothetical tip, chosen randomly by the computer as for the waiters (members 1, 2, and 3).
Then you will be asked to make a hypothetical decision, i.e., to decide how many of these tokens you would share with the other members of your group. Your decision will not affect your earnings nor others’ ones.
For all members
At the end of each week, i.e., after seven days, each member of your group will receive one-quarter of all the tips the three waiters will have put in the common pot during the period. Since the cook will never receive any real tip during the 42 days, their only gain will be their part of the shared tips.
If you are a waiter:
Your earnings = your part of the common pot + the tips you didn’t share.
If you are a cook:
Your earnings = your part of the common pot.
Public and private information
At the end of each day you will not receive any information. On the contrary, at the end of each period, you will be told the following:
- the number of tokens you received at each day,
- the number of tokens you shared at each day,
- the number of tokens you received back from the common pot,
- the sum of your earnings at each day,
- the number of tokens accumulated since the beginning of the experiment.
You will not be told what the other members will receive and choose to share. Neither will you be told who the other members of your group are.
Questionnaire
At the end of the last period you will be asked to fill in a questionnaire.
You will also be provided with a blank sheet, where you can write additional comments while you will be waiting for the others to make their decisions. For instance, you could explain how you will have made your decision, what you will be thinking, feeling, and so on.
Payment
At the end of the experiment, you will be paid 2.5 eurocents for each token you have earned in each of the 42 rounds (so for example 10 tokens are 25 eurocents). You will be paid privately and in cash.
If you have any questions before we start the first period, please raise your hand and one of the instructors will answer it in private. Please, do not ask aloud.
Thank you for your attention and participation.
Appendix B
Table 1 in main text shows the results of the hurdle model, representing the evolution of zero and positive contribution over time. Table A1 below and Figure 3 in main text report linear trends showing the relationship between tips and contributions.

Table A1.
Linear regressions. A. Proportion of waiters’ zero contributions for different tip amounts. B. Waiters’ absolute positive contributions for different tip amounts. C. Waiters’ relative positive contributions for different tip amounts.
Table A1.
Linear regressions. A. Proportion of waiters’ zero contributions for different tip amounts. B. Waiters’ absolute positive contributions for different tip amounts. C. Waiters’ relative positive contributions for different tip amounts.
| LINEAR TRENDS | |||
|---|---|---|---|
| A. Zero Contributions | B. Positive Contributions | C. Relative Contributions | |
| Rule | |||
| Free Sharing | (reference) | (reference) | (reference) |
| Share Half | 1.12 (1.19) | 0.956 (0.908) | 0.035 (0.065) |
| Share All | 0.497 (0.405) | 2.66 (1.13) ** | 0.162 (0.072) ** |
| Tip | 0.943 (0.014) *** | 0.189 (0.036) *** | −0.004 (0.001) *** |
| Constant | 1.96 (1.19) | −0.826 (0.623) | 0.229 (0.045) *** |
| χ2 | 16.21 *** | 27.84 *** | 31.48 *** |
Robust standard errors. * significant at 10%; ** significant at 5%; *** significant at 1%.
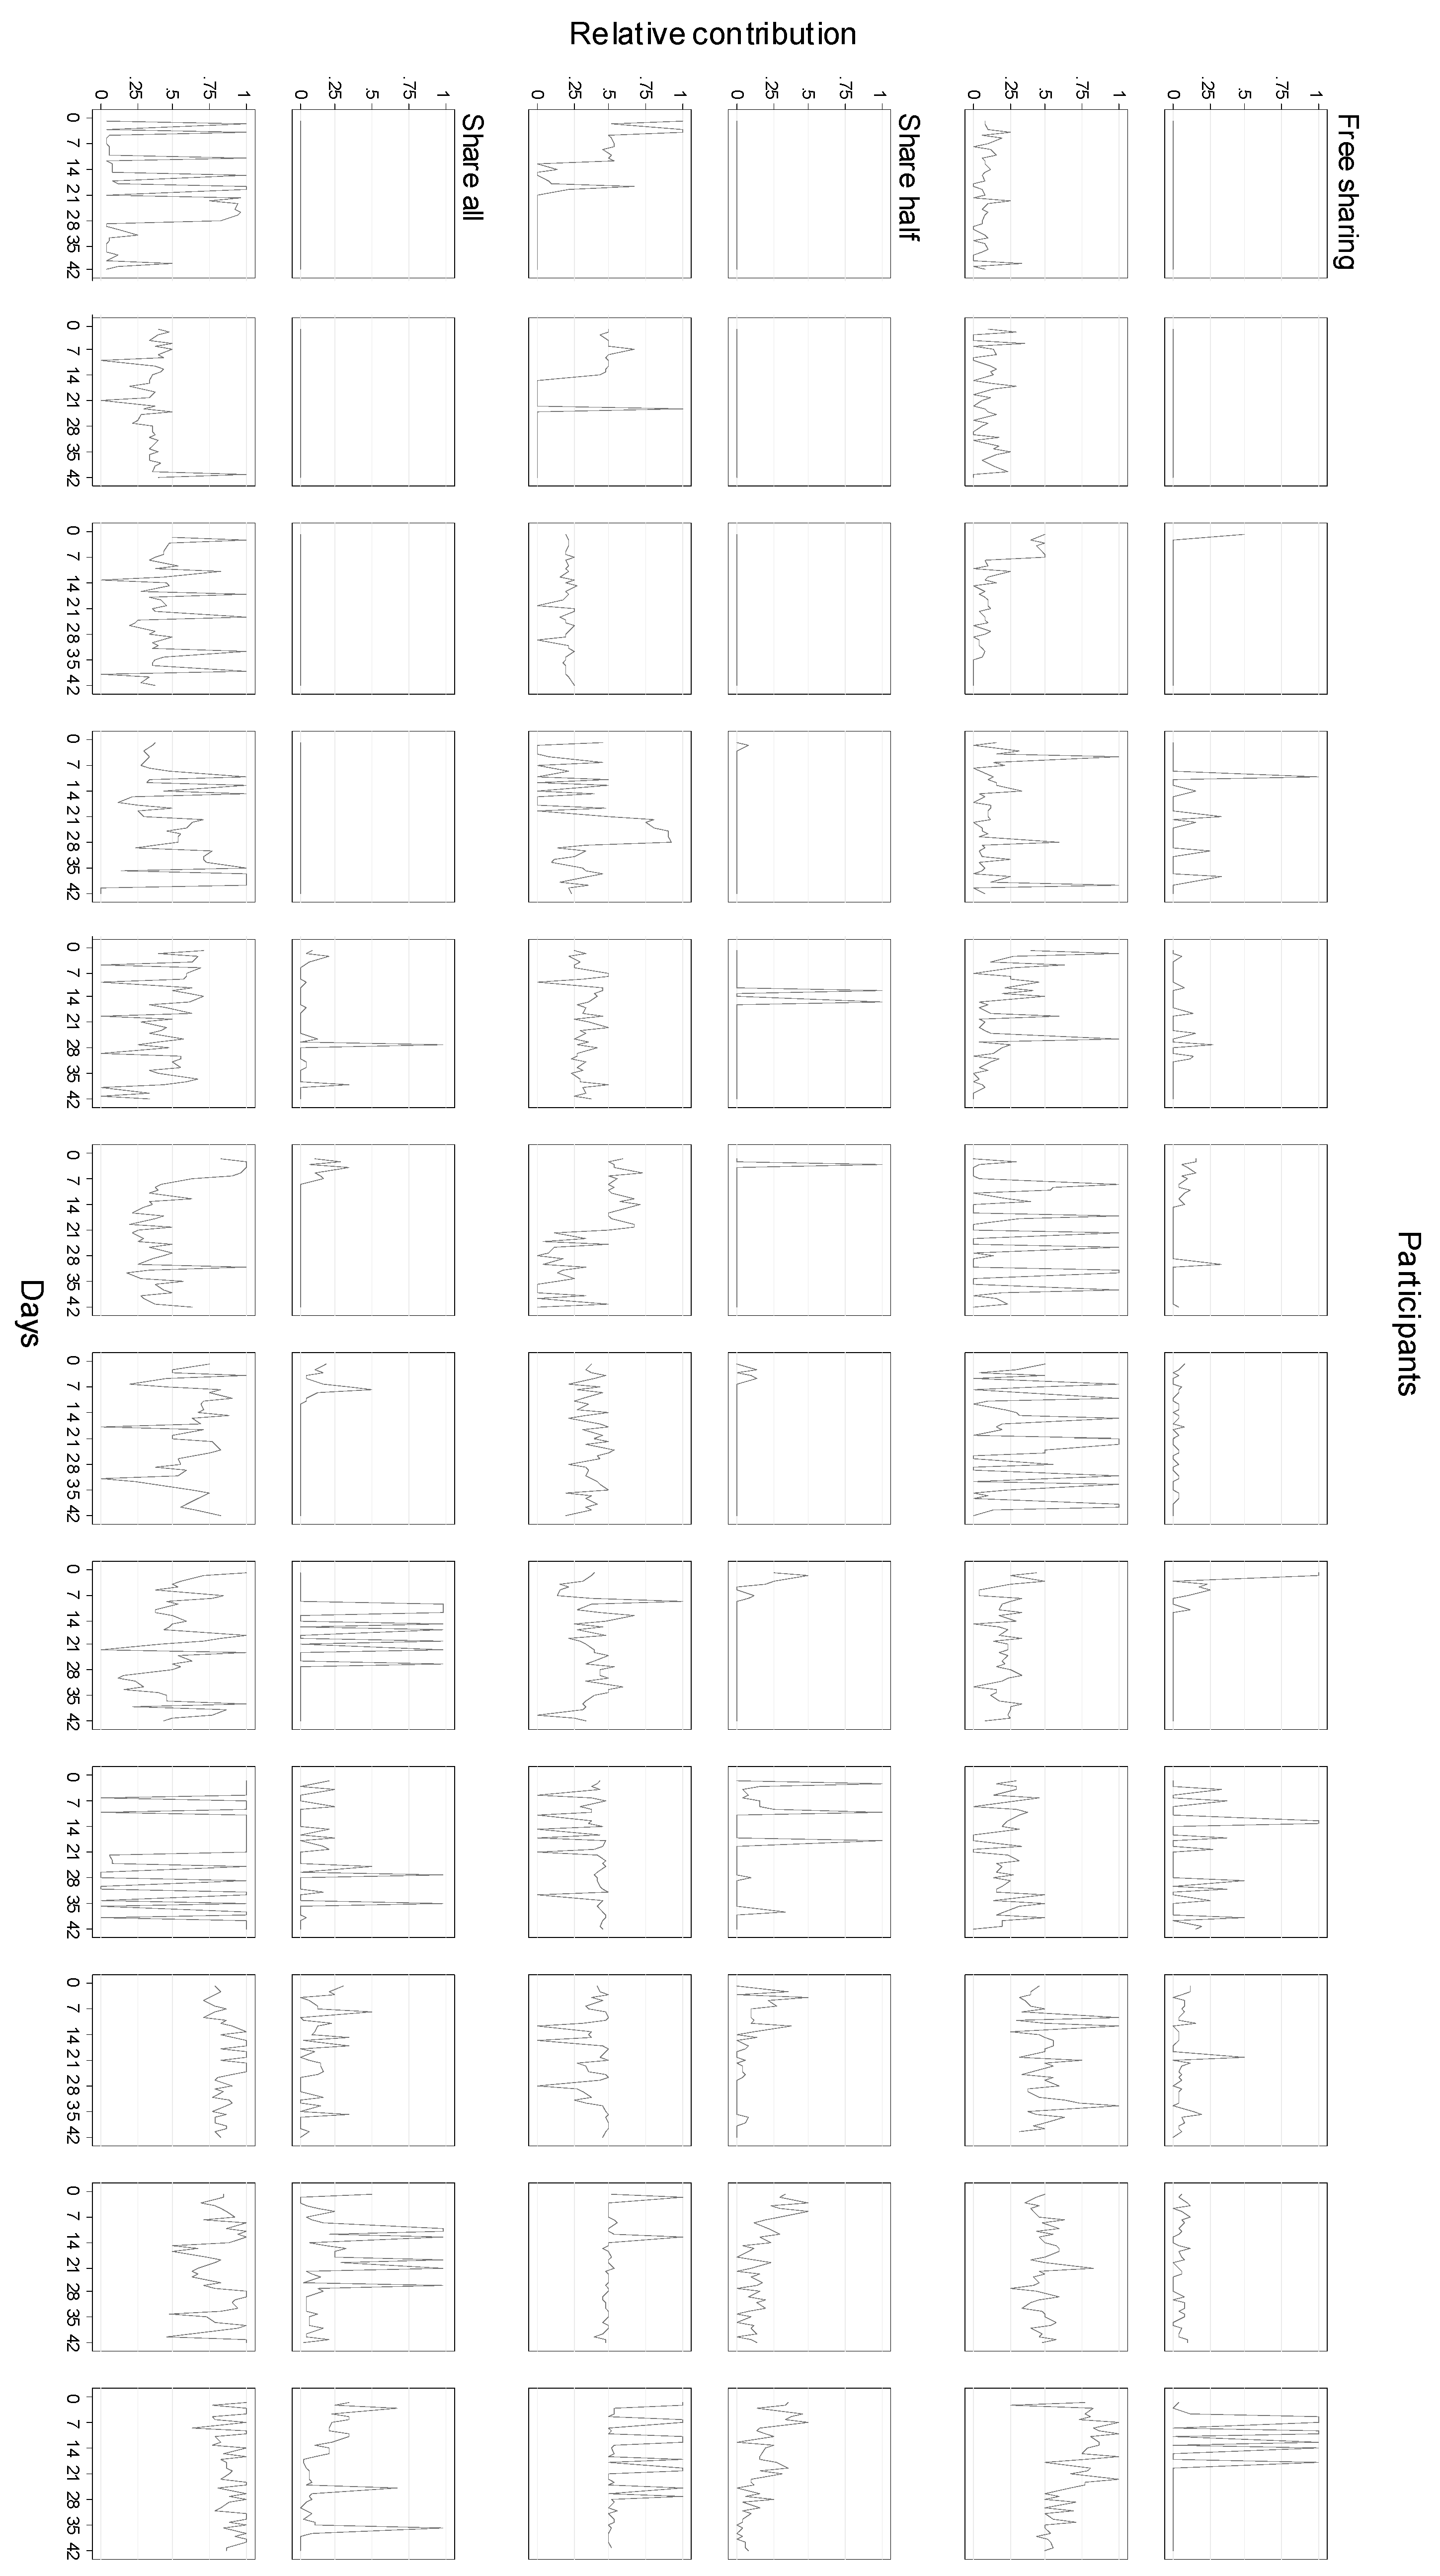
Figure 4 in main text shows boxplots of individual waiters’ contributions under the three different sharing rules. Figure A1 and Figure A2 below report the same individual contributions, highlighting different details: the first figure clusters the individuals by group (each group included three waiters, shown, and a cook, not shown); the second represents waiters’ relative contribution by day, keeping individuals ordered as in Figure 4.
Figure A1.
Boxplots for each participant within each group and treatment, with Free Sharing in the first row, Share Half in the second row and Share All in the third. The groups are ordered within a treatment according to the mean contribution per group. Within a group, individual contributions are also ordered by mean contribution.
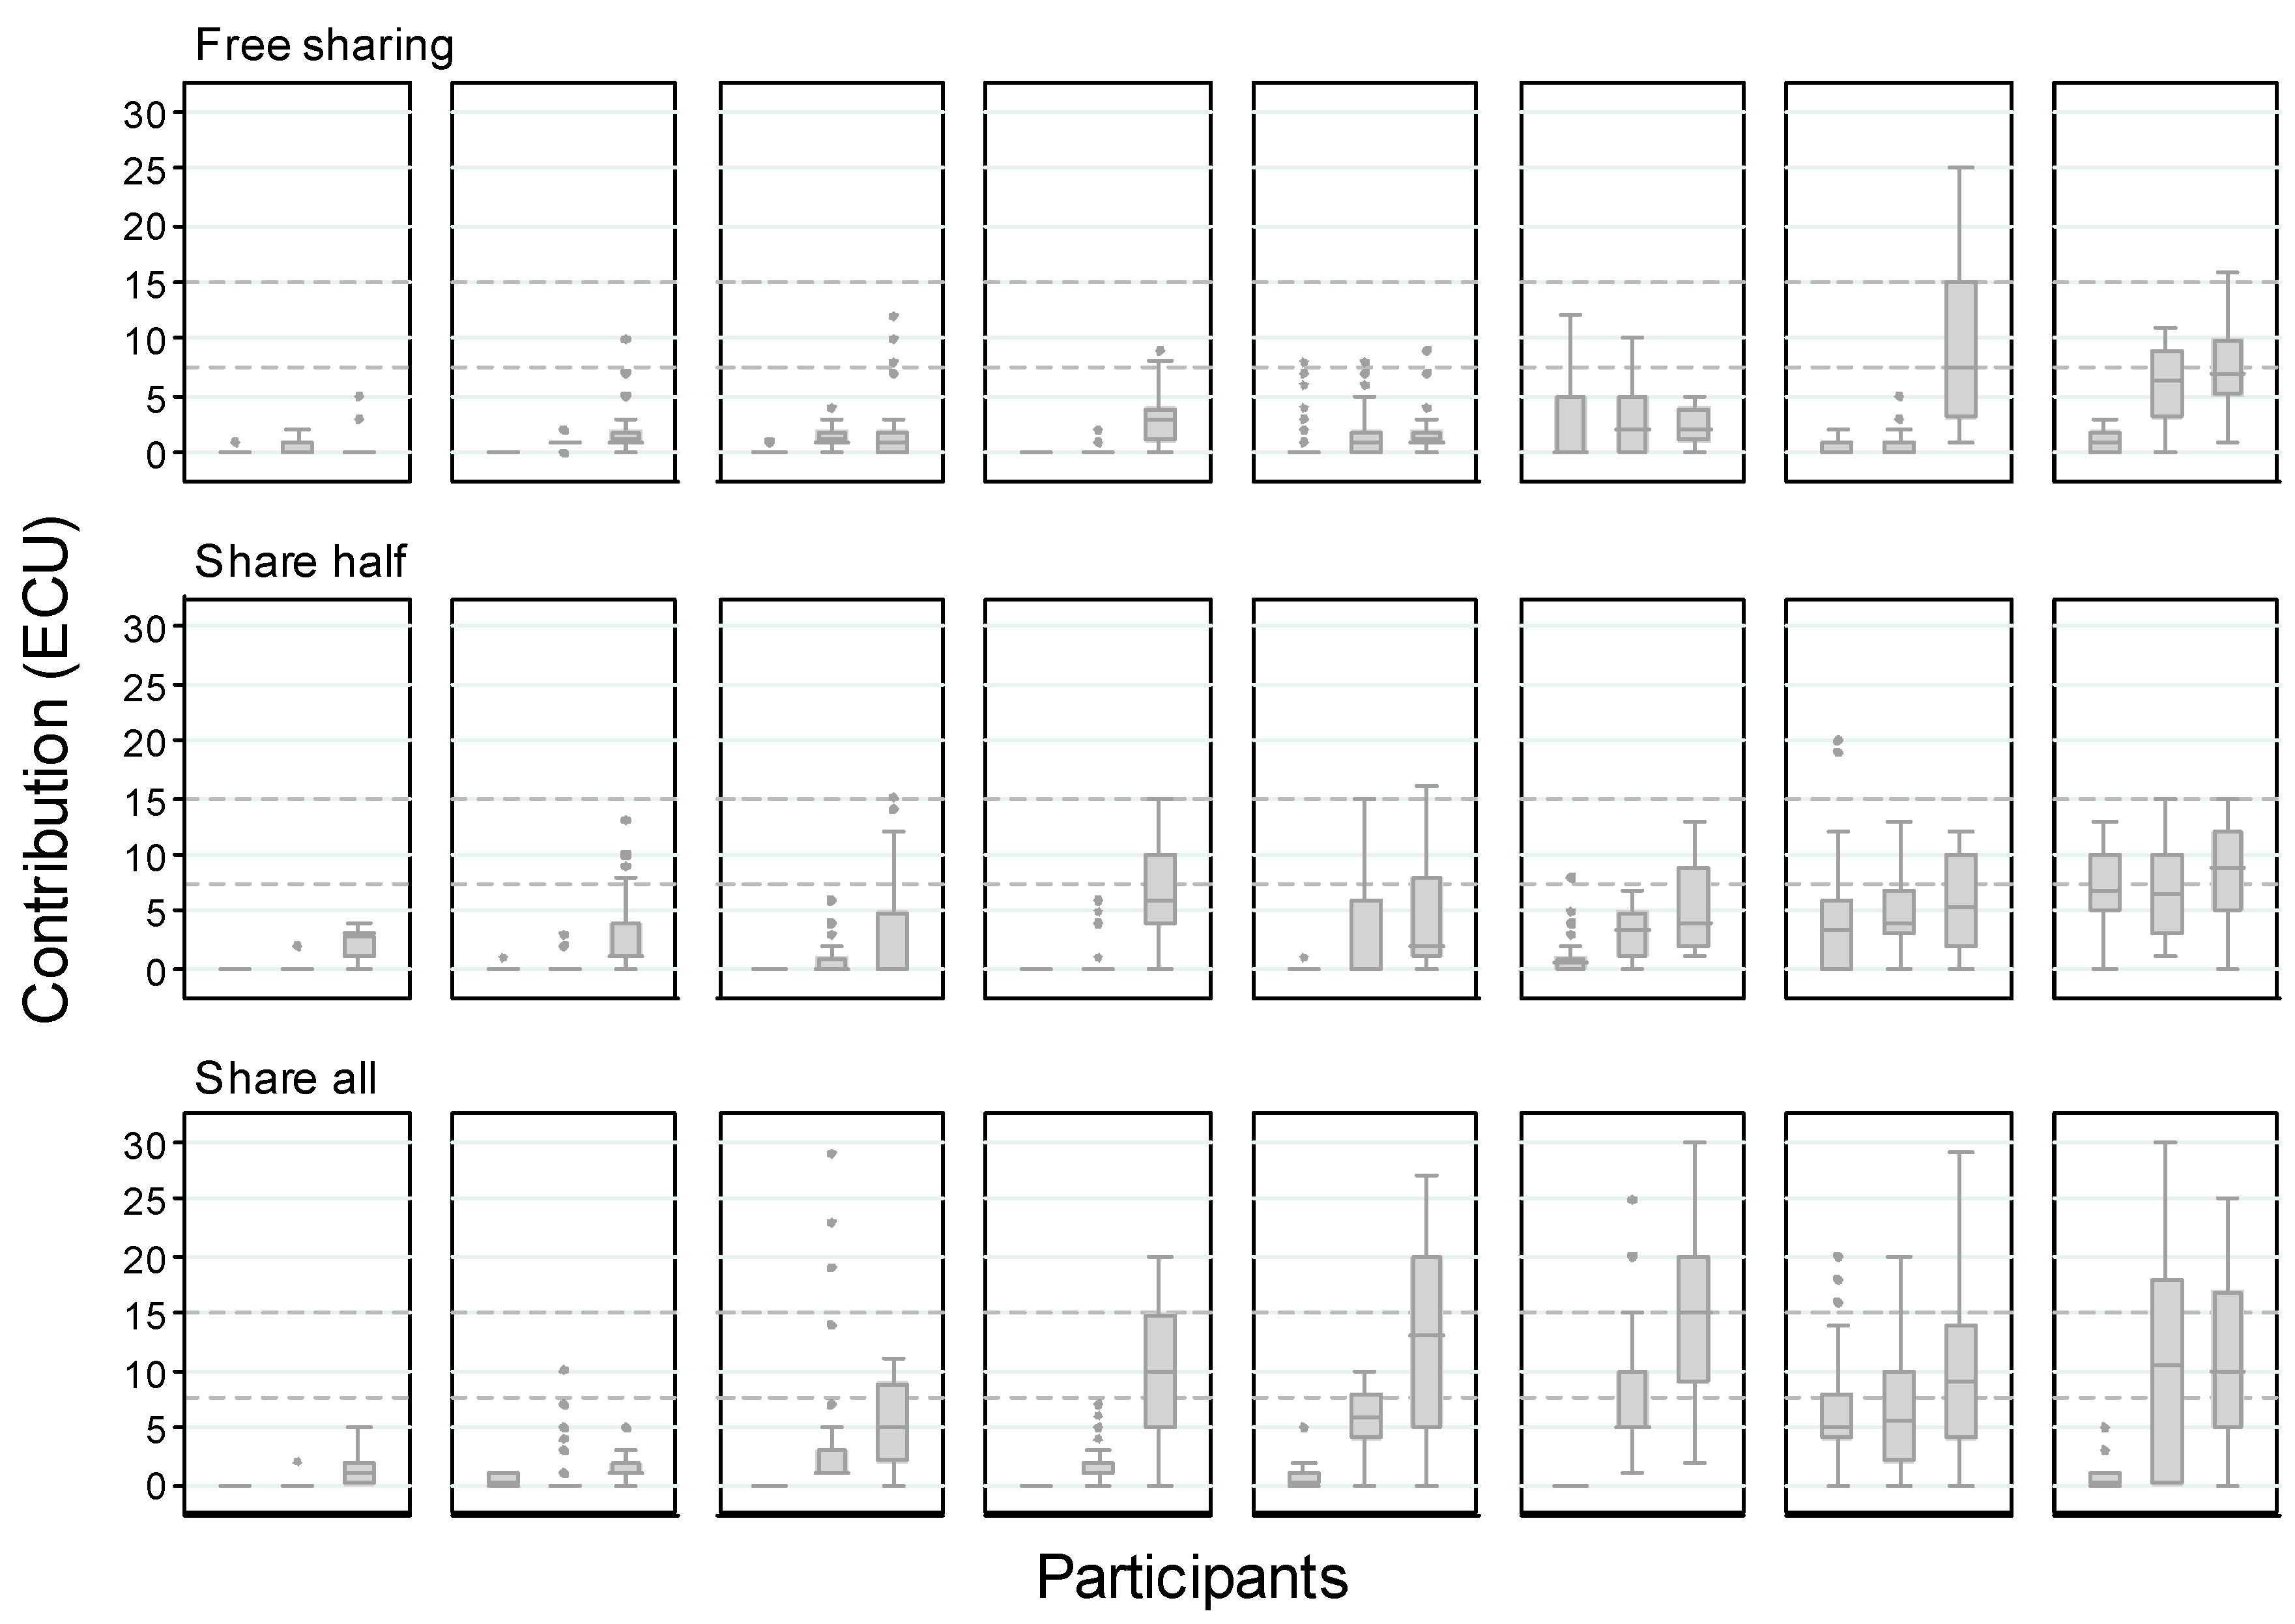
Figure A2.
Each graph plots a waiter’s relative contribution over the 42 days. The first two rows belong to Free Sharing rule, the third and fourth row to Share Half and the last two rows to Share all. Groups are ordered according to their mean contributions. Within a group, participants within each sharing rule are ordered according to their mean contribution.
References
- Alexander, L.; Moore, M. Deontological ethics. In The Stanford Encyclopedia of Philosophy; Zalta, E.N., Ed.; Metaphysics Research Lab, Stanford University: Stanford, CA, USA, 2016. [Google Scholar]
- Singer, A.E.; Lysonski, S.; Singer, M.; Hayes, D. Ethical myopia: The case of “framing” by framing. J. Bus. Ethics 1991, 10, 29–36. [Google Scholar] [CrossRef]
- Sen, A.K. Rational Fools: A Critique of the Behavioral Foundations of Economic Theory. Philos. Public Aff. 1977, 6, 317–344. [Google Scholar]
- Rose-Ackerman, S. Charitable Giving and “Excessive” Fundraising. Q. J. Econ. 1982, 97, 193–212. [Google Scholar] [CrossRef]
- Brandts, J.; Charness, G. Truth or consequences: An experiment. Manag. Sci. 2003, 49, 116–130. [Google Scholar] [CrossRef]
- Gneezy, U. Deception: The Role of Consequences. Am. Econ. Rev. 2005, 95, 384–394. [Google Scholar] [CrossRef] [Green Version]
- Azar, O.H. The Social Norm of Tipping: A Review 1. J. Appl. Soc. Psychol. 2007, 37, 380–402. [Google Scholar] [CrossRef]
- Lynn, M. Tipping in Restaurants and Around the Globe: An Interdisciplinary Review. In Handbook of contemporary behavioral economics: Foundations and developments; Altman, M., Ed.; ME Sharpe: Armonk, NY, USA, 2006; pp. 626–643. [Google Scholar]
- Roe, S.J. Restaurant Service Employees Motivation and Organizational Commitment: Shared Gratuity versus Independent Gratuity Environments; University of Nevada: Las Vegas, NV, USA, 2012. [Google Scholar]
- Roth, A. Tips, Tip Pooling, and Tip Credits. Available online: http://marketdesigner.blogspot.com/2011/01/tips-tip-pooling-and-tip-credits.html (accessed on 19 April 2019).
- Younkins, A.L. Starbucks Case Tips the Scales: Changing California Law to Allow Supervisory Employees Their Fair Share of the Tips. Available online: https://ssrn.com/abstract=1415002 (accessed on 10 May 2016). [CrossRef]
- Fehr, E.; Schmidt, K.M. Theories of Fairness and Reciprocity: Evidence and Economic Applications. Available online: https://ssrn.com/abstract=255223 (accessed on 10 February 2019).
- Bicchieri, C.; Dimant, E.; Sonderegger, S. It’s Not a Lie if You Believe It: Lying and Belief Distortion under Norm-Uncertainty. Available online: https://ssrn.com/abstract=3326146 (accessed on 10 February 2019).
- Allingham, M.G.; Sandmo, A. Income tax evasion: A theoretical analysis. J. Public Econ. 1972, 1, 323–338. [Google Scholar] [CrossRef]
- Feld, L.P.; Frey, B.S. Trust breeds trust: How taxpayers are treated. Econ. Gov. 2002, 3, 87–99. [Google Scholar] [CrossRef] [Green Version]
- Voss, T. Game-theoretical Perspective on the Emergence of Social Norms. In Social Norms; Hechter, M., Opp, K.-D., Eds.; Russell Sage Foundation: New York, NY, USA, 2001; pp. 105–136. [Google Scholar]
- Bicchieri, C. Norms in the Wild: How to Diagnose, Measure, and Change Social Norms; Oxford University Press: New York, NY, USA, 2016. [Google Scholar]
- Ho, T.-H.; Weigelt, K. Trust Building Among Strangers. Manag. Sci. 2005, 51, 519–530. [Google Scholar] [CrossRef] [Green Version]
- Kessler, J.B.; Leider, S. Norms and Contracting. Manag. Sci. 2012, 58, 62–77. [Google Scholar] [CrossRef] [Green Version]
- Bolton, G.E.; Ockenfels, A. ERC: A theory of equity, reciprocity, and competition. Am. Econ. Rev. 2000, 90, 166–193. [Google Scholar] [CrossRef]
- Harrison, G.W. The Methodologies of Behavioral Econometrics. In Contemporary Philosophy and Social Science: An Interdisciplinary Dialogue; Nagatsu, M., Ruzzene, A., Eds.; Bloomsbury: London, UK, 2019. [Google Scholar]
- Ledyard, J.O. Public Goods: A Survey of Experimental Research; California Institute of Technology: Pasadena, CA, USA, 1994. [Google Scholar]
- Azar, O.H. The implications of tipping for economics and management. Int. J. Soc. Econ. 2003, 30, 1084–1094. [Google Scholar] [CrossRef]
- Azar, O.H. What sustains social norms and how they evolve?: The case of tipping. J. Econ. Behav. Organ. 2004, 54, 49–64. [Google Scholar] [CrossRef]
- Barkan, R.; Erev, I.; Zinger, E.; Tzach, M. Tip policy, visibility and quality of service in cafes. Tour. Econ. 2004, 10, 449–464. [Google Scholar] [CrossRef]
- Fischbacher, U. Z-Tree: Zurich toolbox for ready-made economic experiments. Exp. Econ. 2007, 10, 171–178. [Google Scholar] [CrossRef]
- Greiner, B. An Online Recruitment System for Economic Experiments. Available online: https://mpra.ub.uni-muenchen.de/13513/ (accessed on 10 May 2015).
- De Quidt, J.; Haushofer, J.; Roth, C. Measuring and Bounding Experimenter Demand. Am. Econ. Rev. 2018, 108, 3266–3302. [Google Scholar] [CrossRef] [Green Version]
- Zizzo, D.J. Experimenter demand effects in economic experiments. Exp. Econ. 2010, 13, 75–98. [Google Scholar] [CrossRef]
- Davis, D.D.; Holt, C.A. Experimental Economics; Princeton University Press: Princeton, NJ, USA, 1993. [Google Scholar]
- Hoffman, E.; McCabe, K.; Shachat, K.; Smith, V. Preferences, property rights, and anonymity in bargaining games. Games Econ. Behav. 1994, 7, 346–380. [Google Scholar] [CrossRef]
- Janssen, M.; Ahn, T.K. Adaptation vs. Anticipation in Public Good Games. In Proceedings of the Annual Meeting of the American Political Science Association, Philadelphia Marriott Hotel, Philadelphia, PA, USA, 28 August 2003. [Google Scholar]
- Roth, A.; Prasnikar, V.; Okuno-Fujiwara, M.; Zamir, S. Bargaining and Market Behavior in Jerusalem, Ljubljana, Pittsburgh, and Tokyo: An Experimental Study. Am. Econ. Rev. 1991, 81, 1068–1095. [Google Scholar]
- Botelho, A.; Harrison, G.W.; Pinto, L.M.C.; Rutström, E.E. Testing static game theory with dynamic experiments: a case study of public goods. Games Econ. Behav. 2009, 67, 253–265. [Google Scholar] [CrossRef]
- McDowell, A. From the Help Desk: Hurdle Models. Stata J. Promot. Commun. Stat. Stata. 2003, 3, 178–184. [Google Scholar] [CrossRef]
- Fehr, E.; Gächter, S. Cooperation and punishment in public goods experiments. Am. Econ. Rev. 2000, 90, 980–994. [Google Scholar] [CrossRef]
- Isaac, R.M.; Walker, J.M. Group size effects in public goods provision: The voluntary contributions mechanism. Q. J. Econ. 1988, 103, 179–199. [Google Scholar] [CrossRef]
- Isaac, R.M.; Walker, J.M.; Williams, A.W. Group size and the voluntary provision of public goods. Experimental evidence utilizing large groups. J. Public Econ. 1994, 54, 1–36. [Google Scholar] [CrossRef]
- Feld, L.P.; Frey, B.S. Tax compliance as the result of a psychological tax contract: The role of incentives and responsive regulation. Law Policy 2007, 29, 102–120. [Google Scholar] [CrossRef]
| 1 | Most literature related to tipping typically studies the behavior of the tipper, i.e., the client in a restaurant (see, e.g., [7]). Lynn [8] presents empirical research on the determinants and predictors of restaurant tipping and of national differences in tipping habits. Furthermore, the behavioral data is discussed in the light of economic theory and welfare analysis. Roe [9] studies different gratuity sharing arrangements and discusses the effects of these arrangements. We are not aware of any lab tip pooling experiments. |
| 2 | Tip-pooling is an important economic phenomenon: “In 2008, a San Diego trial court slapped Starbucks Corporation with a $100 million judgment for violation of California’s tip sharing laws” [11]. |
| 3 | Since we did not elicit believes nor vary the information structure about each other’s sharing we are not able to analyze the reasons behind the behavior of a subject, in particular how believes influence sharing. For related literature, see [13]. |
| 4 | According to de Quidt and colleagues [28] our rule implication falls under the category “strong demand effect” with the phrase in every period “the rule of the restaurant is … “, similar to “We (experimenters) expect that participants who are shown these instructions will invest more/less in the project than they normally would” as in de Quidt et al. [28]. Zizzo [29] writes along these lines that Davis and Holt [30] (p. 26) “do not see a problem with EDE (Experimenter Demand Effect) if ‘explicit suggestion’ is a treatment variable. This is accurate if identifying an EDE is the objective of the experiment.” In our case, we especially want to see the difference in behavior with different request rules. |
| 5 | A way to avoid experimenter demand effect is using anonymity towards the experimenter in a double-blind procedure [31], which was not implemented in our study. |
| 6 | Subjects knew the exchange rate in advance. We used an artificial currency in case of later replications in other countries with different currencies. This makes comparisons between different data sets more workable (see discussion on currency effects in [33]). However, this could have produced confounds due to money illusion, meaning that high artificial nominal amounts could have reduced misbehavior or, at the opposite, by encouraging gambling behavior [30]. However, these effects should be small as payoffs are quite low in each round. |
| 7 | This effect might be driven by the way relative contributions are computed, combined with the choice of subjects to treat their tips as integers and not as rational numbers. Excluding the choices following a tip of zero (which do not leave subjects any choice but contributing zero), the lowest possible contribution is 1 ECU, which is the 100% of a 1 ECU tip, the 50% of a 2 ECU tip, the 33.3% of a 3 ECU tip, the 25% of a 4 ECU tip and so on. As a result, subjects have more limited choices for lower tips than for higher tips. Therefore it is more difficult to reveal subjects’ preferences with accuracy when tips are low (mainly between 1 and 5 ECU). |
| 8 | A boxplot provides a summary of a distribution: the box represents the interquartile range of variation (IQR, from the 25th to the 75th percentile, named Q1 and Q3 respectively) and the line within the box is the median (Q2); the lower whisker extends to Q1 − 1.5·IQR and the higher one to Q2 + 1.5·IQR. The black dots are suspected outliers, data points falling outside the two whiskers. |
Figure 1.
Absolute and relative contribution over time. Waiters’ observed contribution under different sharing rules over time (each week contains 7 rounds). Mean contribution under Free sharing (R1, triangles), under Share Half (R2, squares) and under Share All (R3, circles). Standard error bars in gray. (A) Absolute contributions are sensitive to sharing rules and show an overall decrease over time. (B) Relative contributions show the same trends.

Figure 2.
Zero and positive absolute contribution over time. Effect of time on the three sharing rules: Free sharing (R1, triangles), Share Half (R2, squares) and Share All (R3, circles). Standard error bars in gray. (A) Waiters’ relative frequency of zero contributions were 44% of the total and the percentage increased with time. (B) Waiters’ non-zero contributions in ECU varied across sharing rule but not over time.

Figure 3.
Linear trends. Free Sharing: Black triangles, short-dashed lines; Share Half: Dark gray squares, long-dashed lines; Share All: Light gray circles, solid line. (A) The probability of a waiter contributing nothing was higher for low tips than for high tips. (B) The mean fraction of positive tip contributed by waiters was higher for low tips than for high tips.

Figure 4.
Individuals. Each bar shows the boxplot of a participant. Within each treatment, individuals are ordered by their mean contribution. The upper horizontal dashed line marks the average endowment over 42 periods (15 ECU, that corresponds to contributing everything on average). The lower dashed line marks half of the average endowment (7.5 ECU, corresponding to contributing half of the endowment on average).

Table 1.
Hurdle model. A. Panel data random-effects logistic regression on waiters’ zero contributions over time. B. Panel data random-effects Poisson regression on waiters’ positive contributions over time.
Table 1.
Hurdle model. A. Panel data random-effects logistic regression on waiters’ zero contributions over time. B. Panel data random-effects Poisson regression on waiters’ positive contributions over time.
| A. Zero Contributions | B. Positive Contributions | |
|---|---|---|
| Rule | ||
| Free Sharing | (reference) | (reference) |
| Share Half | 1.14 (1.24) | 0.317 (0.091) ** |
| Share All | 0.490 (0.413) | 0.613 (0.103) *** |
| Week | 1.48 (0.132) *** | −0.037 (0.015) * |
| Tip | (exposure) | |
| Constant | 0.206 (0.128) * | −1.30 (0.094) *** |
| χ2(3) | 19.97 *** | 1372.9 *** |
Robust standard errors in parentheses. * significant at 10%; ** significant at 5%; *** significant at 1%.
© 2019 by the authors. Licensee MDPI, Basel, Switzerland. This article is an open access article distributed under the terms and conditions of the Creative Commons Attribution (CC BY) license (http://creativecommons.org/licenses/by/4.0/).
Share and Cite
MDPI and ACS Style
Pedersini, R.; Nagel, R.; Le Menestrel, M. The Power of Requests in a Redistribution Game: An Experimental Study. Games 2019, 10, 27. https://doi.org/10.3390/g10030027
AMA Style
Pedersini R, Nagel R, Le Menestrel M. The Power of Requests in a Redistribution Game: An Experimental Study. Games. 2019; 10(3):27. https://doi.org/10.3390/g10030027
Chicago/Turabian StylePedersini, Riccardo, Rosemarie Nagel, and Marc Le Menestrel. 2019. "The Power of Requests in a Redistribution Game: An Experimental Study" Games 10, no. 3: 27. https://doi.org/10.3390/g10030027
Note that from the first issue of 2016, this journal uses article numbers instead of page numbers. See further details here.