Computational Behavioral Models for Public Goods Games on Social Networks


1
Faculty of Business and Economics, University of Lausanne, 1015 Lausanne, Switzerland
2
Grupo Interdisciplinar de Sistemas Complejos (GISC), Departamento de Matematicás, Universidad Carlos III de Madrid, 28911 Leganés, Madrid, Spain
*
Author to whom correspondence should be addressed.
Games 2019, 10(3), 35; https://doi.org/10.3390/g10030035
Submission received: 11 June 2019
/
Revised: 19 August 2019
/
Accepted: 29 August 2019
/
Published: 2 September 2019
(This article belongs to the Special Issue Behavioral Game Theory: Theory and Experiments)
Abstract
:Cooperation is a fundamental aspect of well-organized societies and public good games are a useful metaphor for modeling cooperative behavior in the presence of strong incentives to free ride. Usually, social agents interact to play a public good game through network structures. Here, we use social network structures and computational agent rules inspired by recent experimental work in order to develop models of agent behavior playing public goods games. The results of our numerical simulations based on a couple of simple models show that agents behave in a manner qualitatively similar to what has been observed experimentally. Computational models such as those presented here are very useful to interpret observed behavior and to enhance computationally the limited variation that is possible in the experimental domain. By assuming a priori reasonable individual behaviors, the easiness of running simulations could also facilitate exploration prior to any experimental work in order to vary and estimate a number of key parameters that would be very difficult, if not impossible, to change during the actual experiment.
1. Introduction
Circumstances that require cooperation to be achieved crop up in many places in society. International challenges such as global climate change and natural resources exploitation clearly show that cooperation and self-restraint would be the successful strategies to apply but often these are thwarted by selfish behavior and short-term view, as we can see from the difficulty to establish quotas and, above all, to respect them, when there is not a clear way to measure who does what, as in fishing or CO2 emissions. In game theory, this kind of collective-action situation is modeled through public goods games (PGG) [1,2,3]. PGGs are multi-player games in which N agents have the choice to voluntarily contribute to a common pool that will be enjoyed by all and will have an added value for each agent through a multiplication factor , i.e., before sharing the total contribution among the players, the quantity contributed in the common pool is multiplied by r. This represents the fact that the realization of the public good has an added value for the whole community. In laboratory work, the surplus is provided by the experimenter. The temptation for an agent is to free-ride on the contribution of others and give little or nothing to the common pool. Of course, if enough agents think in this way the public good will not be realized. Indeed, according to game theory based on rational optimizing agents, the dominant individual strategy in not to contribute and the unique Nash equilibrium corresponds to zero contribution from each agent implying no public good provision at all.
However, despite the gloomy predictions of the theory, it appears that people often do contribute to some extent when faced to situations that can be interpreted as PGGs, both in real-life as well as in controlled laboratory experiments, even though this fails to maximize personal income. This has been seen in a host of experiments that have been performed in the last two decades. The are too many to be listed, but we mention some references from which further work can be found [3,4,5,6,7,8]. The common observation in most experiments is that subjects do contribute about 50% of their endowment at the beginning. However, contributions go down when play is repeated as people start to free-ride but they never reach zero on average, final values being around 10–20%. Actually, when devices such as costly punishment of the free-riders or rewards for contributing are allowed, the contribution level may raise again to higher levels [4,5]. However, it is also known that punishment can harm efficiency in the presence of counter-punishment as cooperators are less willing to punish free-riders in this case [9].
All this is common knowledge by now but there is still disagreement about the interpretation of the observations. Some researchers think that human behavior is inherently pro-social and that people take into account the welfare of others, to some extent at least, when making their decisions [4,10]. In this case, some form of conditional cooperation seems to be the main motivation behind the steady reduction of contributions that is observed when the interaction is repeated. However, other interpretations are also possible. For instance, in a series of experiments, Burton-Chellew et al. [6,7,8] challenged the previous interpretation, suggesting that mere payoff-based learning may also explain the results. However, this position seems much too simple when information about people’s actions are available to all members of the group. More sophisticated strategies are likely to be at work in this case, including other-regarding ones.
Theoretical approaches based on evolutionary game theory using replicator dynamics [11] show that full defection is the attractor state of the dynamics, similarly to standard Nash equilibrium approaches, unless there are positive incentives rewarding reputation, or negative ones such as punishing non-contributors at a cost for the punisher. On the numerical simulation side, there have been several studies in the last ten years (e.g., see [12,13,14], and [15,16] for two recent reviews). Since PGGs take place in groups and thus have a social dimension, most of these computer models assume that there is a population of agents that interact between them according to a social network of contacts. The network can be a complex network model (see, e.g., [17]) such a Barábasi–Albert model, a model of social network as we assume here, or an actual social network. Bipartite networks have also been suggested in which a set of vertices represents agents and another set of vertices represents groups. Edges link agents with their respective group but neither agents nor groups possess direct links between themselves [14,18]. However, we do not discuss the bipartite representation further in this work. In general, to understand the evolution of the strategies in the network, numerical simulations of replicator dynamics have been used [15]. However, the results of these studies do confirm that there is no contribution in the long term and in the average, until a critical value of the multiplication factor is reached. This critical value is between two and four and depends on the particular micro-update rule used in the replicator dynamics [13]. Beyond this threshold, full cooperation is obtained at a rate that depends on the network structure and on the particular payoff-proportional micro update rule used. These models and the corresponding simulations are very useful to set the stage and to understand the main aspects of the complex system dynamics. However, the decision rules are homogeneous and stereotyped and far removed from the behavioral rules that agents actually seem to use in laboratory experiments. Furthermore, for simplicity and mathematical convenience, the agents are either full cooperators or full defectors, while in experiments they are usually characterized by the amount they contribute, which is a continuous or, more frequently, an integer variable between zero and a maximum value. Because of these simplifications, the results do not show the full range of behaviors that are seen in experiments with human participants.
On the other hand, experiments may be limited in several ways, especially large-scale ones: they are expensive to carry out and there can be serious logistic issues if they are performed in an open web-based platform outside the controlled environment of the laboratory. Moreover, key parameters must be chosen with care as changing them often requires running a new experiment, which involves spending more money and time. Numerical simulation models, used in conjunction with experiments, are useful in relieving some of these limitations and in suggesting important parameters and settings without having to test all of them in the laboratory. They can also help in extending the scope of the experiment itself by exploring larger populations and untried parameter combinations.
As a first step toward an understanding of the behavioral strategies of agents when playing a PGG in a social network of contacts, in the present work, we would like to start bridging the gap between models and empirical observations. We do this by exploring a simple model which assumes a minimal information on the part of the agents in a way that can be set up in a laboratory experiment and that makes sense from the point of view of the experimenter. The information set can be richer, and one possible extension corresponding to many common experimental settings is also treated.
The article is organized as follows. We first describe the simpler model in the next section. This is followed by numerical simulation results and their discussion. Next, we introduce a slightly richer information set and a behavioral model using this information is numerically simulated. A final discussion and conclusions end the paper.
2. Payoff Satisfaction Model
In the present work, we chose to simulate a population represented as a social network model because this is often a natural way of implicitly forming groups of entities in a public goods dilemma situation. These population structures have attracted a lot of attention in the last decade, especially in the realm of two-person games, where the PGG is called the Prisoner’s Dilemma (PD). There is a large literature based on theory and extensive numerical simulations of the PD on networks, which, on the whole, indicate that significant cooperation levels may be achieved through network reciprocity that works through positive assortativity between cooperators, i.e., cooperators tend to interact with cooperators and to avoid defectors (see e.g., [19]). For reviews and further references of this kind of work, see, e.g., [20,21]. Recent research tested these predictions by means of targeted experiments with humans in the laboratory, in which the subjects were connected in specific network structures [22,23,24]. Surprisingly, these studies found that neither homogeneous nor heterogeneous network structures promote cooperation to a significant extent [23,24,25]. In spite of these somewhat mixed results, we keep a social network for the population in the following because it is a natural structure to consider and also because it makes it easy to add a coevolutionary dynamics of strategy and structure, an extension that is not explored here but that is left for future work.
Burton-Chellew and coworkers performed a series of laboratory experiments in the last few years in which they argued that there is no clear evidence for pro-social behavior in PGG games [6,7,8]. Rather, they suggested that a simpler interpretation is that subjects are essentially payoff-driven since results do not change significantly when extra information about other group members is provided, such as who contributed what and their respective gains. Beyond the fact that the previous explanations may fall short of the actual strategical behavior when richer information is provided, the first model we present here is inspired on these considerations and is one of the simplest possible: it assumes that agents only know their own decisions and their own earnings.
In our model, agents are connected through a social network that is generated according to the method described in [26], which linearly combines a distance-based component with a preferential attachment component linearly proportional to node’s degree and independent of space. The model is a growing one and, for each new incoming node, given a pre-established mean degree, the proportion of links to existing nodes that are made according to linear preferential attachment or according to a distance-based criterion is specified by a parameter such that for the network is purely spatial, while produces pure preferential attachment networks.
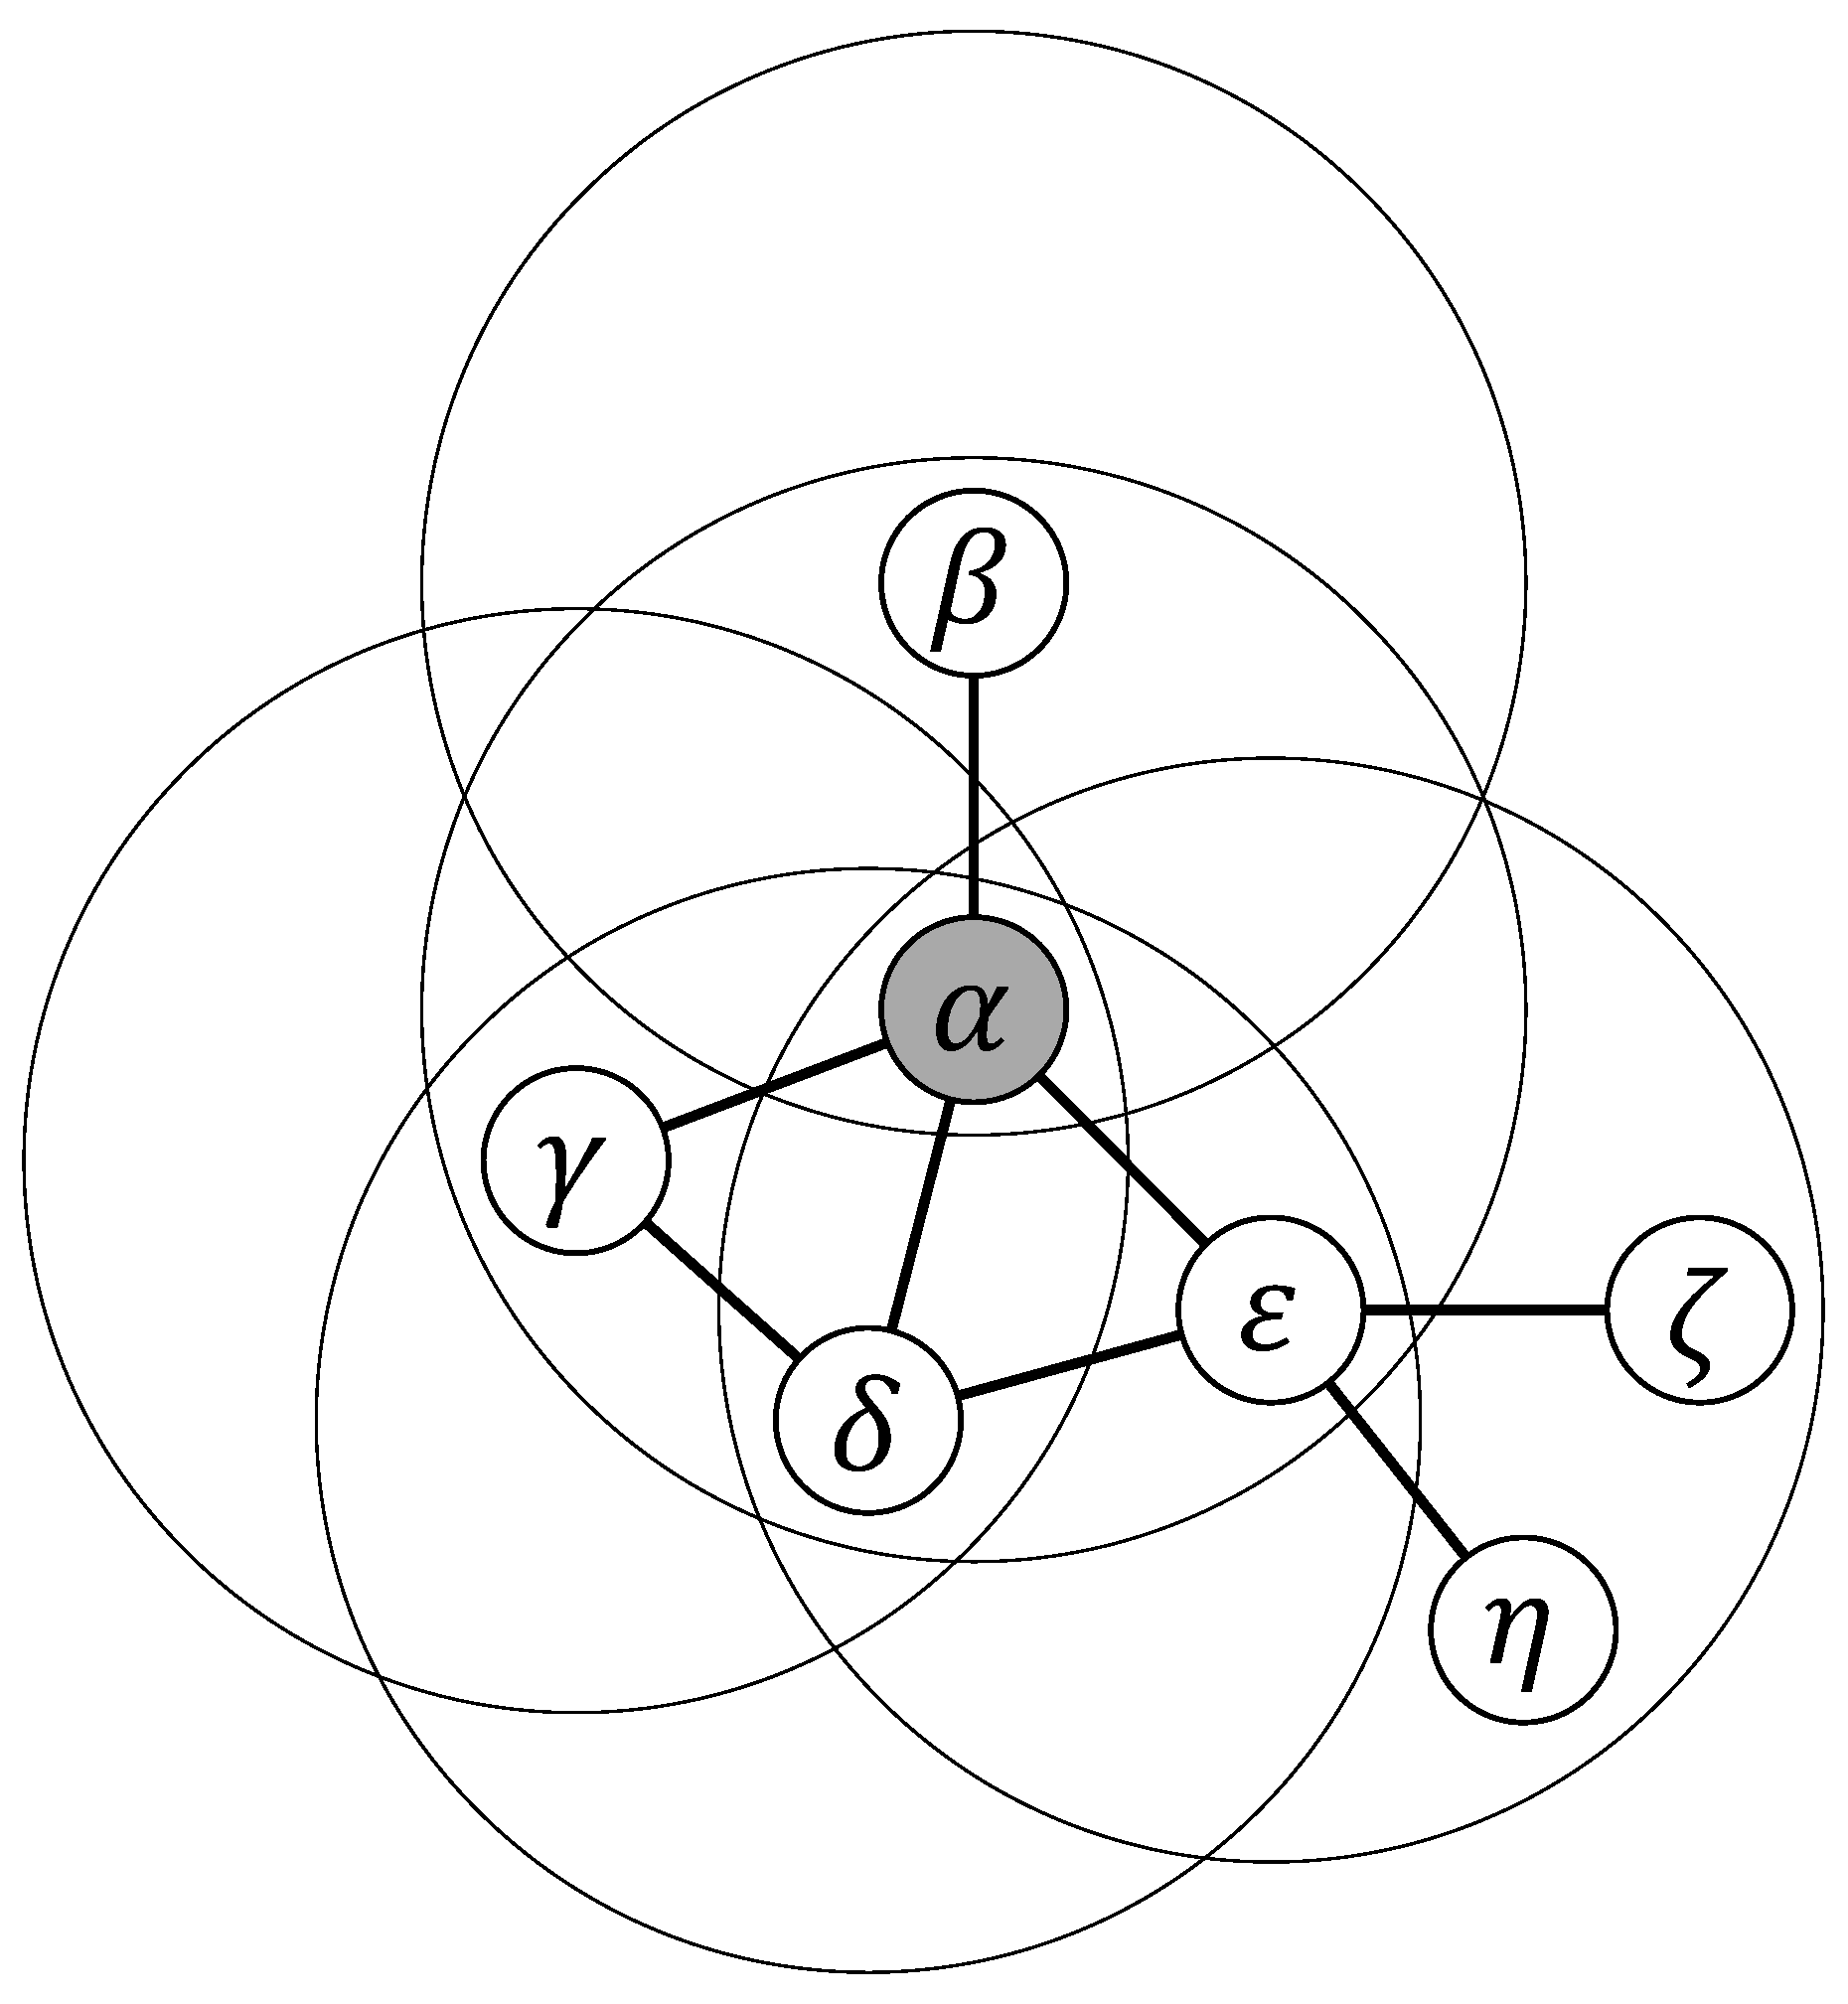
Each agent interacts with its first neighbors, forming a group in which it is the focal element, and also participates in all the groups that have each neighbor as the focal element (see also explanation in Figure 1). Thus, if the degree of agent i in the graph is k, then the number of groups in which it participates is .
The game is a standard linear PGG in which the sum of the contributions is multiplied by an enhancement factor and equally shared among the members of the group, irrespective of their individual contributions. Individuals are not allowed to punish free-riders or to reward cooperative individuals, which would be impossible anyway given that they are only informed about their own payoffs. The payoff of individual i is thus:
in which it is assumed that individual i’s contribution is the same in all g groups in which i participates. The first term represents the remaining part of the individual’s endowment after contribution, the second term is the total contribution of i in the g groups of which it is a member, and the last term is i’s return on investment after applying the enhancement factor r and sharing the total amount among all the participating agents whose group size is .
In the model, all agents set their contribution and compute their payoff in the first phase after having played in all their groups. The initial contribution is chosen randomly in the set of fractions , where 1.0 represents the total endowment contribution. At each round, a player has the same endowment of for each group in which it participates. This choice qualitatively emulates most experimental settings in which people are given an endowment, typically 20–40 tokens, and they must decide how many they want to contribute to the common pool. Once players have got their payoffs, they decide what to do next according to the following behavioral rules: if an agent gets a payoff at least equal to the total contribution it made in the groups to which it participates, then, with probability , it increases its contribution by , unless it is already at 1, or, with probability , it keeps the same contribution at the next stage. The noise on the agent adaptive move helps to avoid stereotyped behavior of the collection of agents. If the agent is unsatisfied, getting less than what it put in the common pool, then it will decrease its contribution by at the next time step, unless it was already 0, in which case it does not change. These rules conform a kind of elementary reinforcement learning process in the sense that decisions that lead to better payoffs are maintained or reinforced while those that lead to negative results are weakened. For the sake of clarity, the rules are expressed in Table 1.
In a variation of the above setting, satisfied individuals, instead of choosing whether to increase their contribution or keep the same one at the next stage with equal probability, may have a “personal” propensity for each action given by a random number between 0 and 1. We discuss results using both choices in the next section.
Although the behavioral adaptation rules just explained are extremely simple and certainly do not correspond in detail to the decision made by subjects in the laboratory, we see that they are already sufficient to induce an average population behavior that is qualitatively similar to what is observed in experiments in which people have the same amount of information, i.e., only their own contributions and individual gains.
3. Results
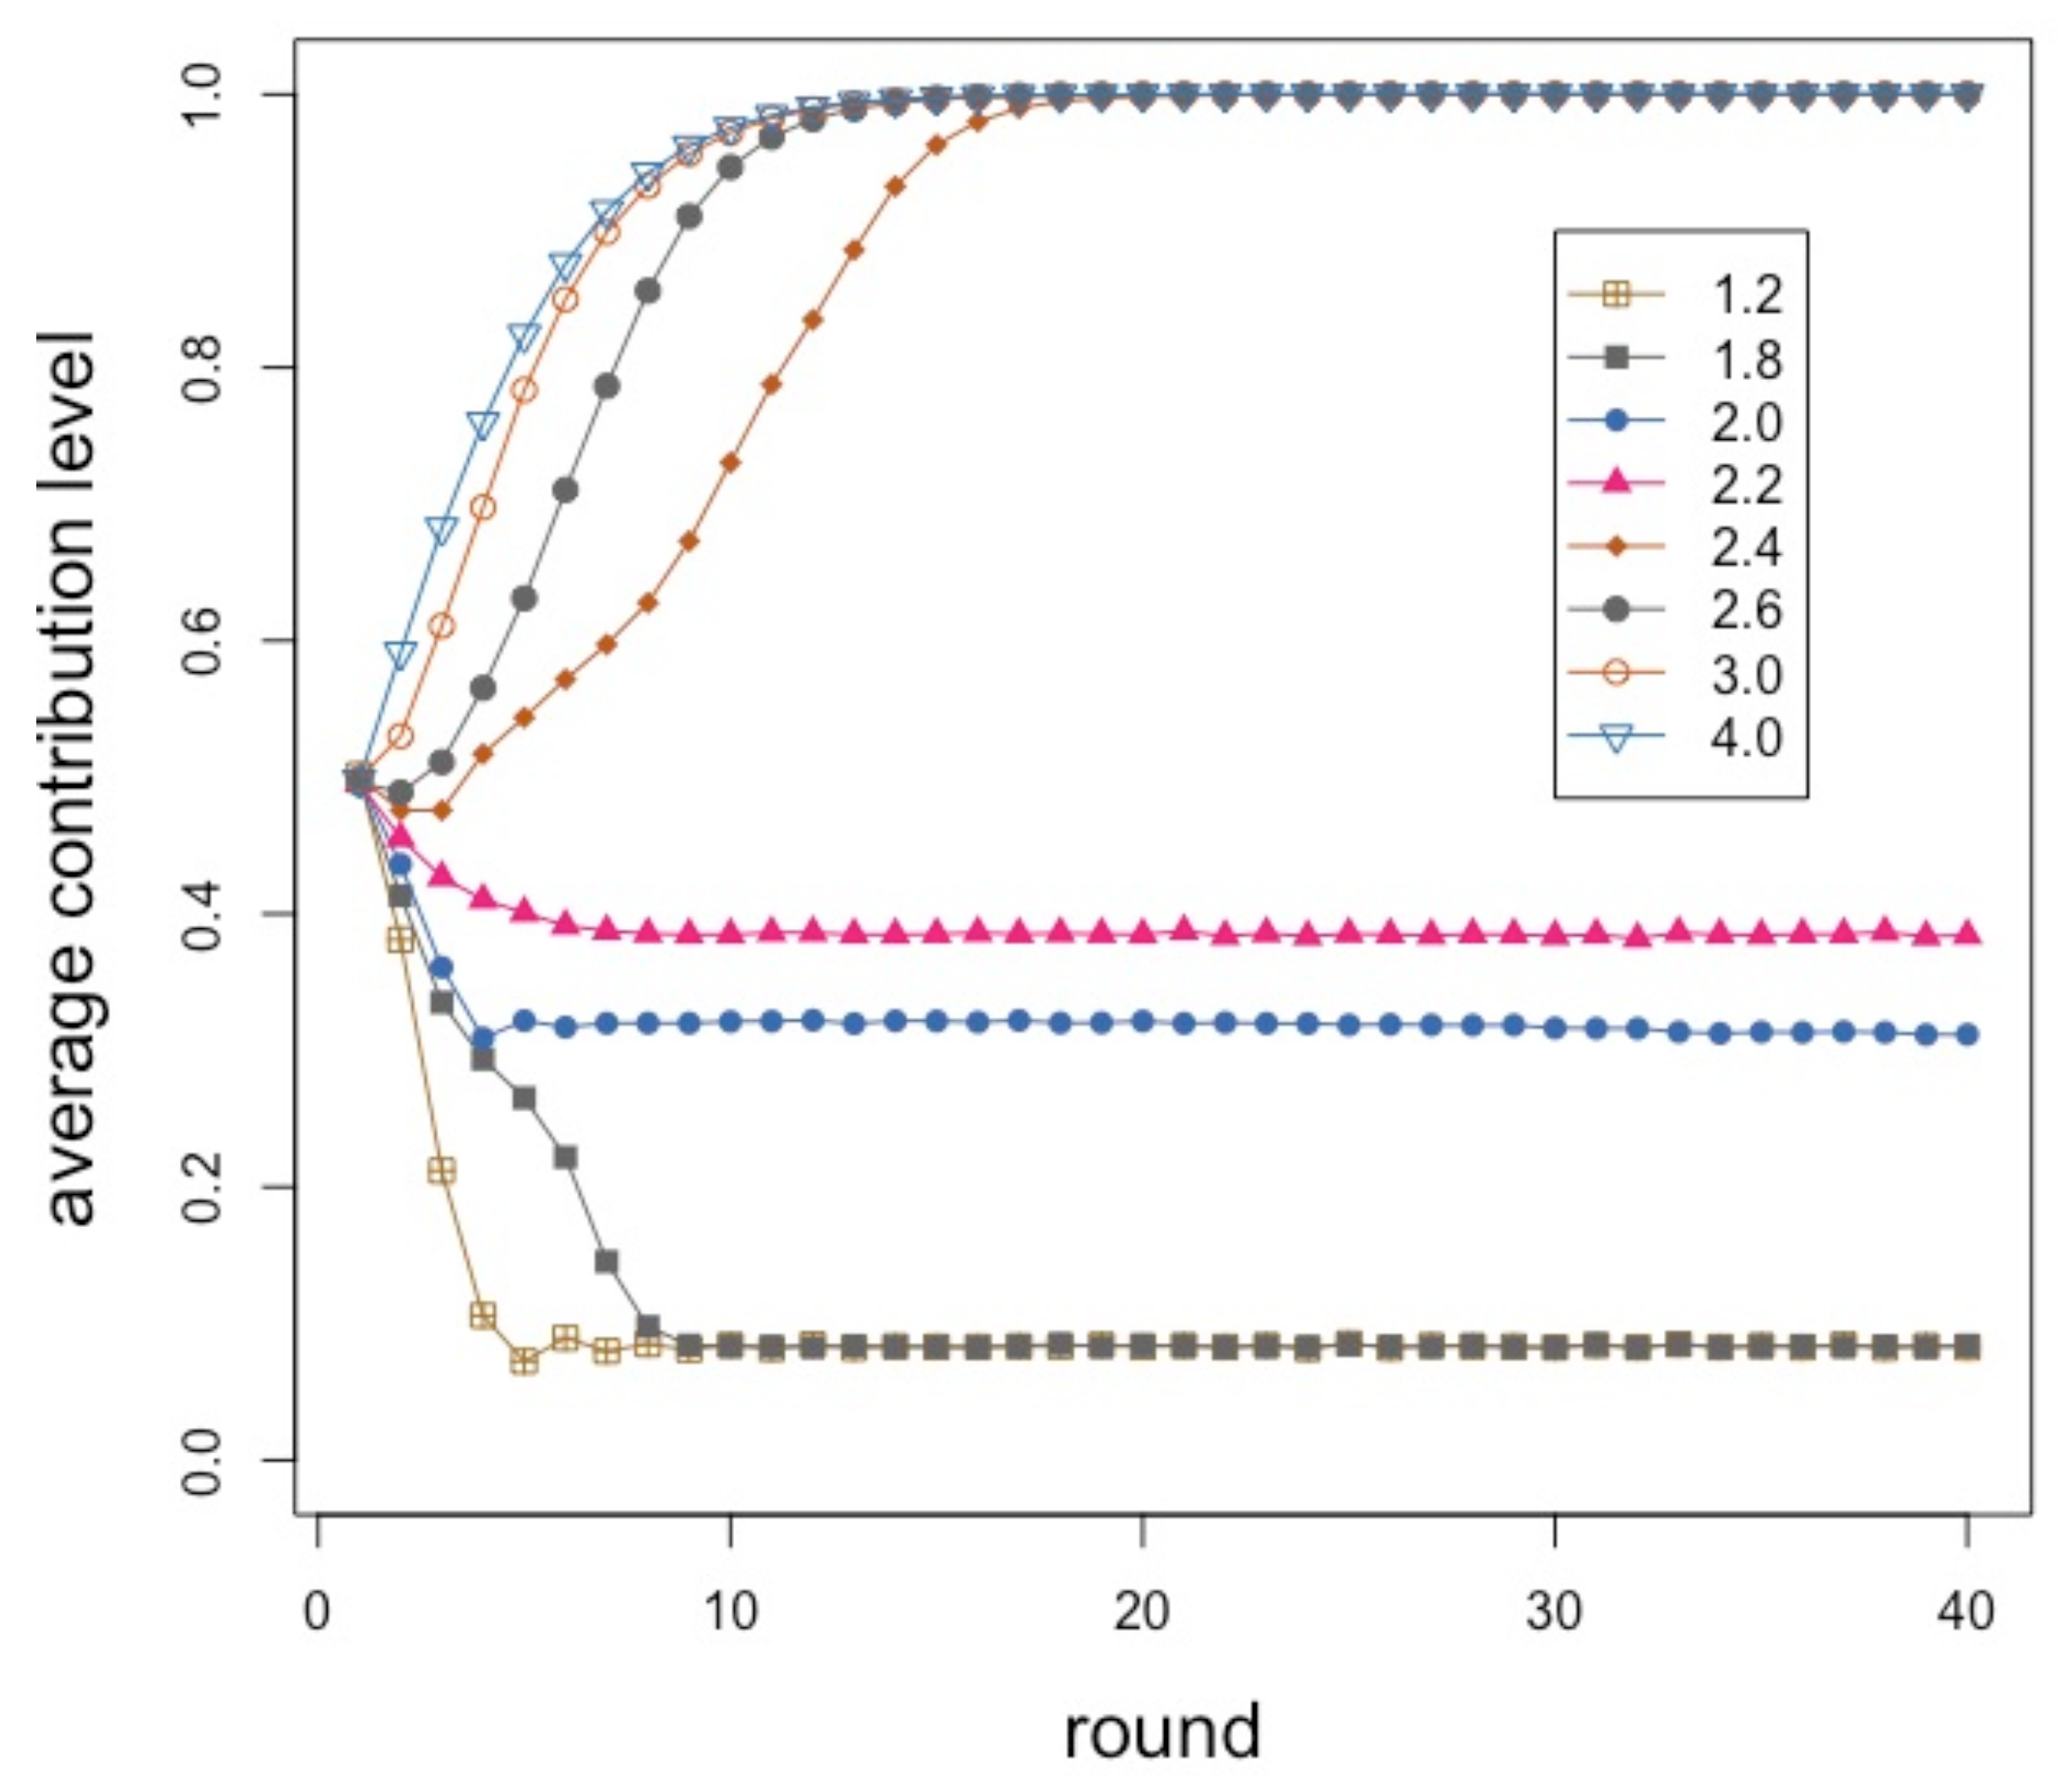
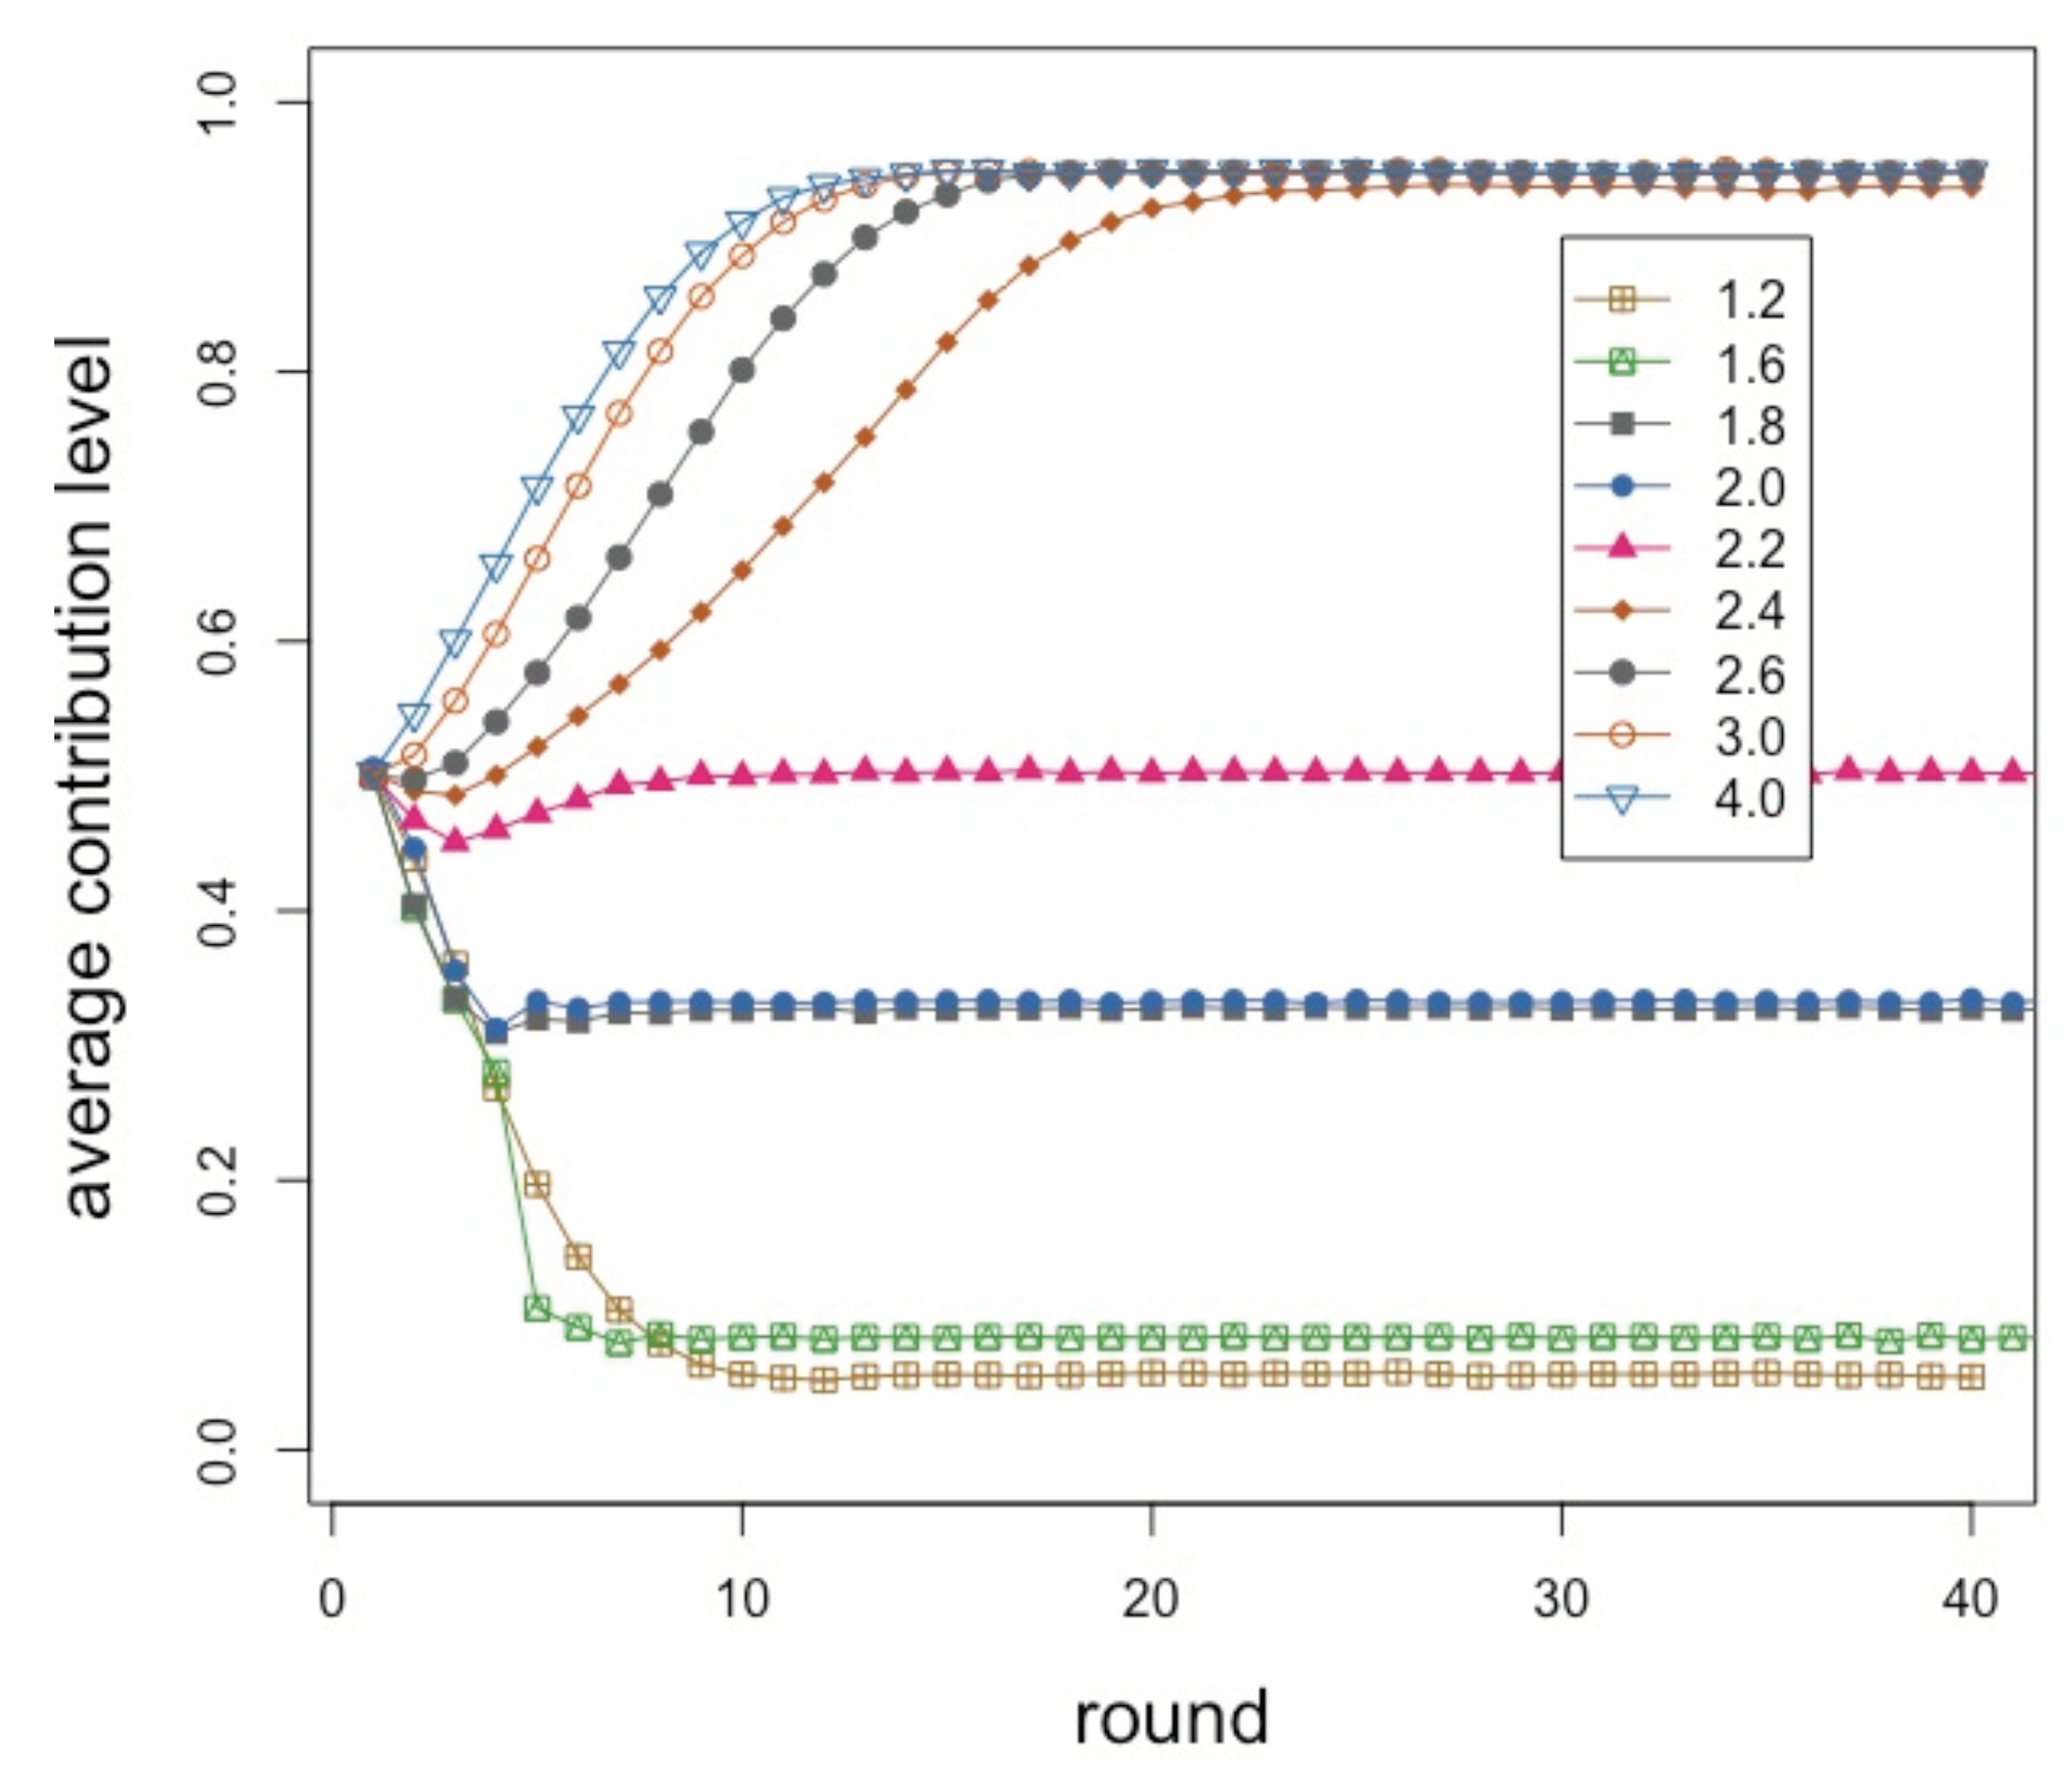
Figure 2 shows the average contribution during 40 interaction rounds for an enhancement factor r between and included in steps of . Some r values are redundant and are not shown for clarity. Each point of the curves is the average of 40 independent repetitions in each of which the initial random contributions of the players are re-initialized. The network structure remains the same throughout. The population size is 500 individuals connected in a social network of mean degree six built according to the model described in [26], giving a mean group size equal to seven and with an value of , which is known to produce networks that have similar statistical features to those found from empirical social network measurements [26].
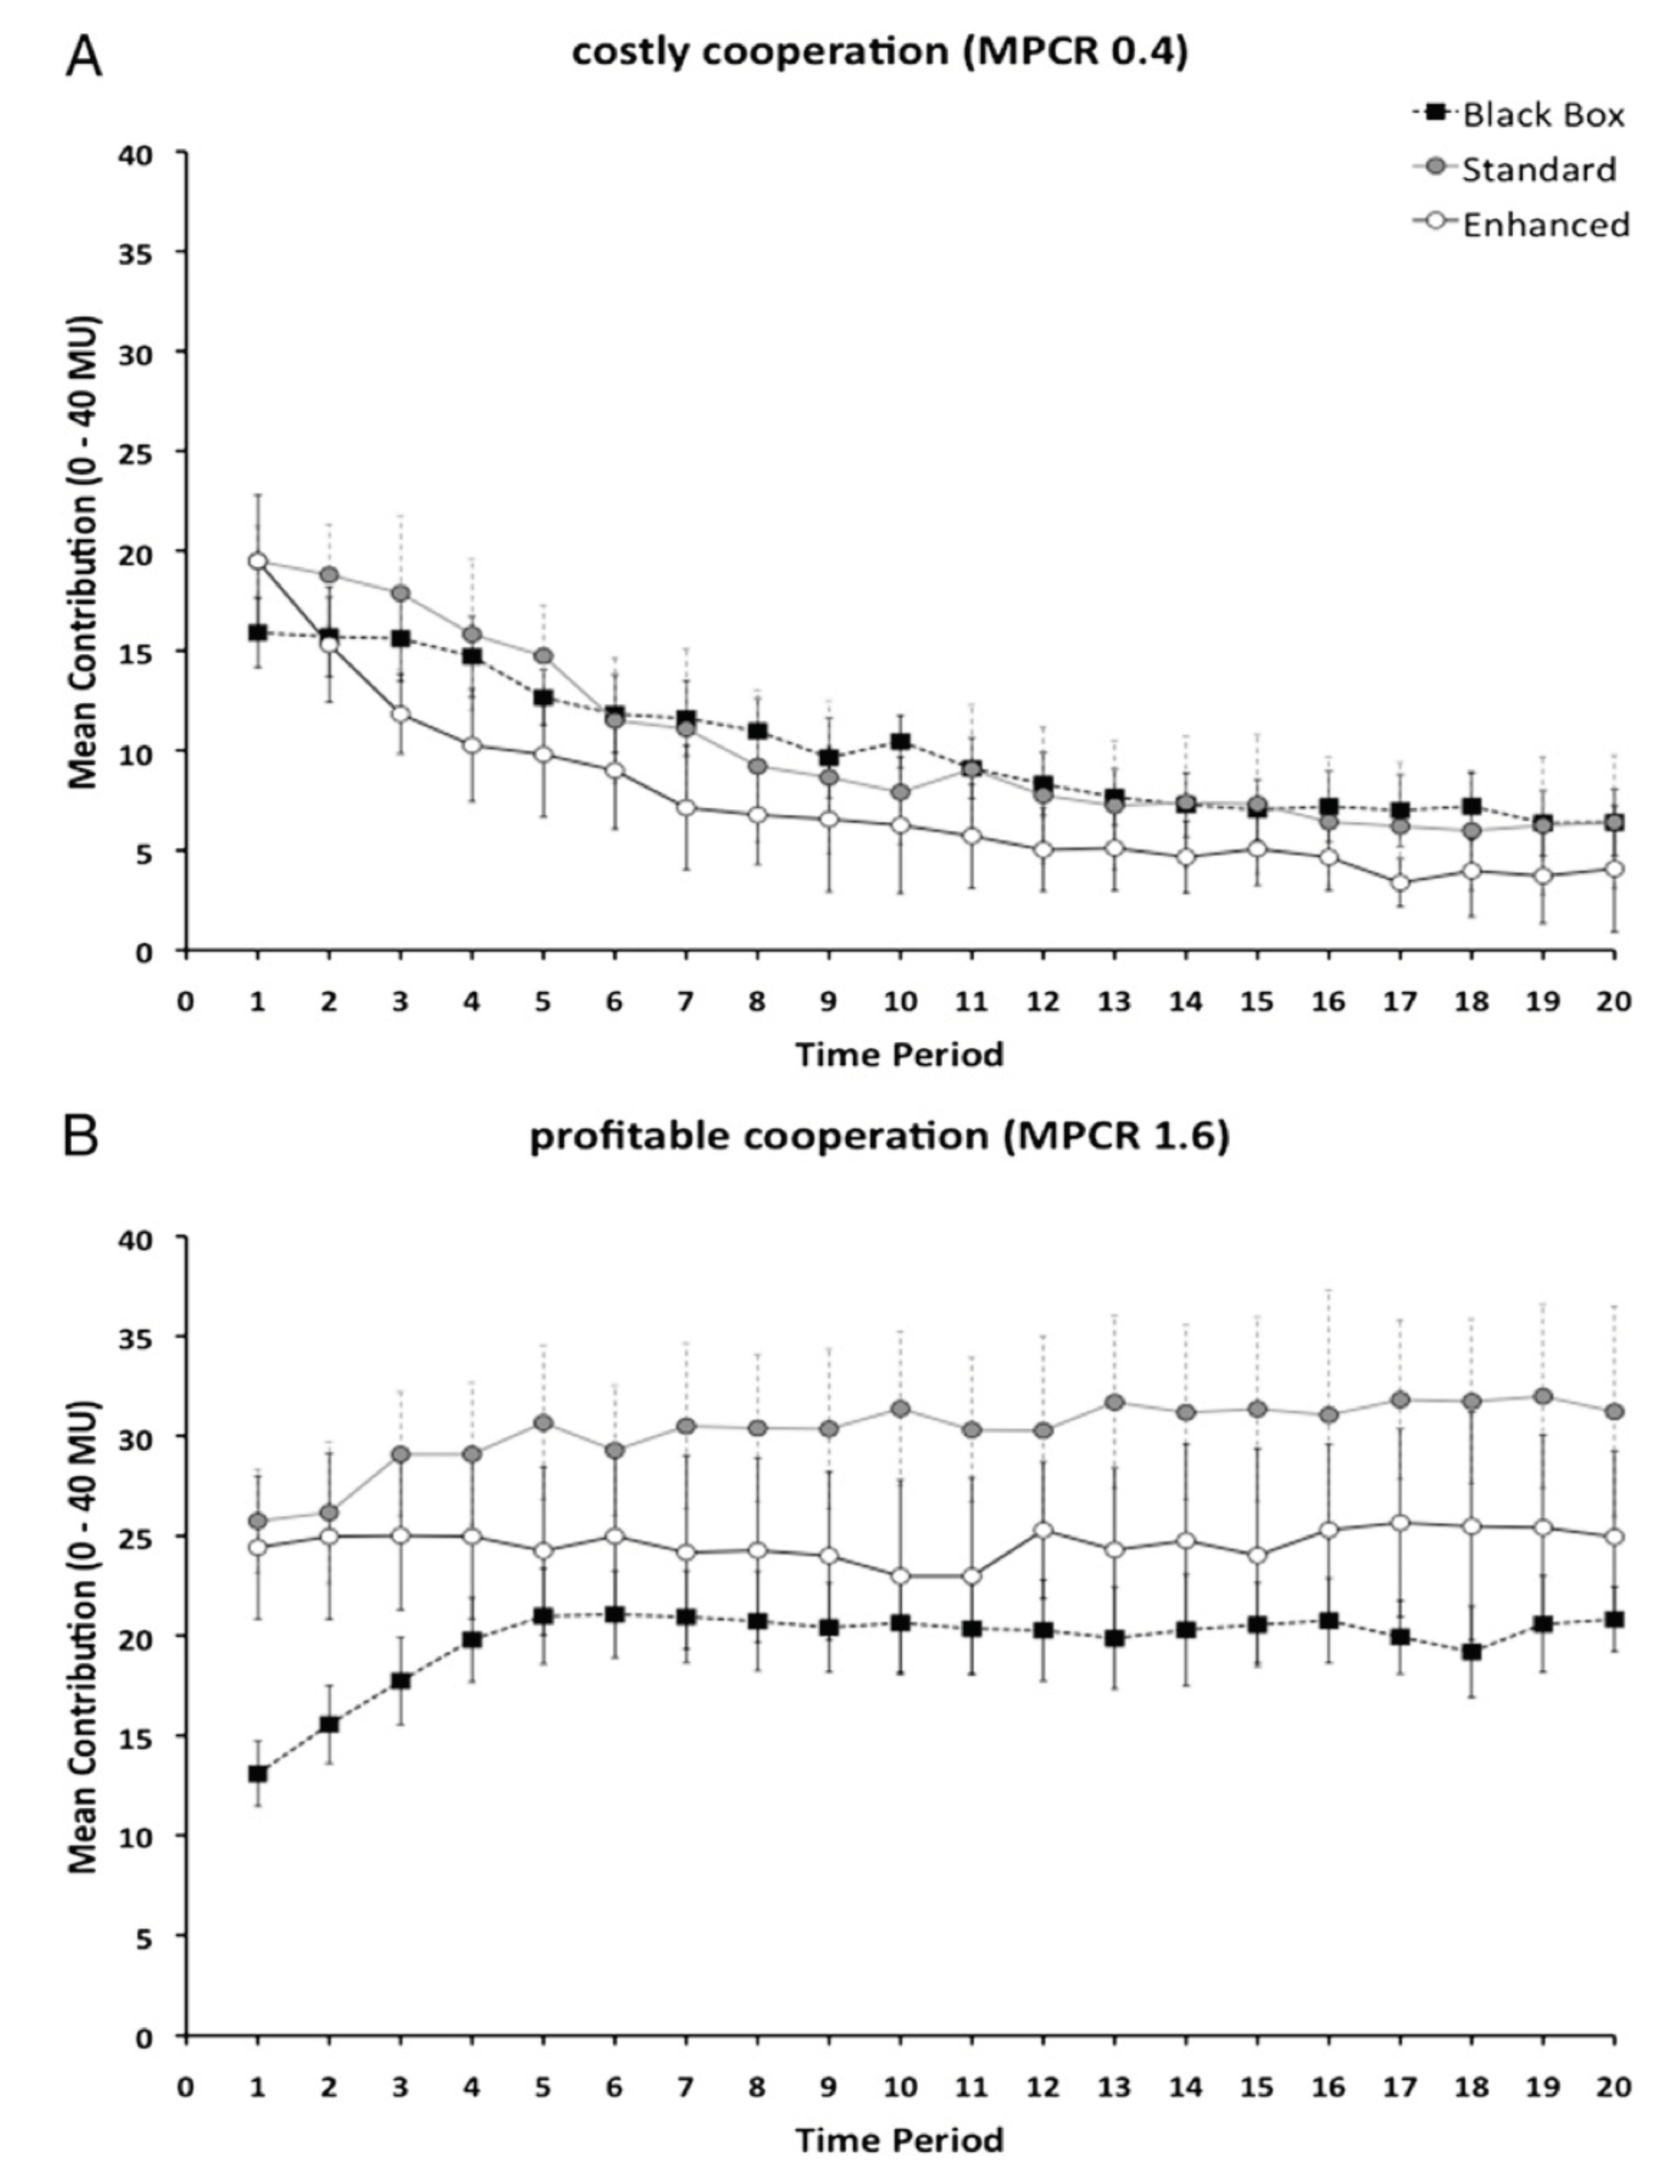
Initially, contributions are chosen randomly in the set . Therefore, in all cases, the average is about at time step zero. Here, this is the result of a mechanical process but it is also in line with results in experiments where subjects contribute about one-half of their endowment given that they still have no clue as to the consequences of their choices. Up to an r value of about , contributions decline smoothly, with a faster decay the lower r is. Again, this qualitatively also follows the trend found in experiments. However, the pseudo-equilibrium value stabilizes around and does not go to 0 as theory would tell us. This is fully in line with the experimental results in [6], which we reproduce in Figure 3 for ease of reference. Their upper image (Figure 3A) corresponds to a multiplication factor and the relevant curve is the one labeled “black box”.
Continuing with the numerically simulated results in Figure 2, we observe that above there is a sudden increase in average contribution, and for all the stable state tends to full contribution after a short transient. Burton-Chellew and West also published results for an enhancement factor (see Figure 3B, curve labeled “black box”). In this case, and after 20 rounds, contributions have raised to about while our model would converge to full contribution for this r value after about 15 steps. Clearly, we cannot pretend to fully reproduce their experimental results, given the simplifications that went into our model with respect to the more complicated and heterogeneous behavior of human subjects, and also the fact that their participants had an endowment of 40 tokens and could spend any integer quantity between 0 and 40. Moreover, participants formed groups of constant size four in [6] while our groups have on average seven members but the size can fluctuate in the network. Thus, although the goal of our model is not to reproduce any particular set of results, we can say that it correctly predicts the qualitative observed behavior and trends.
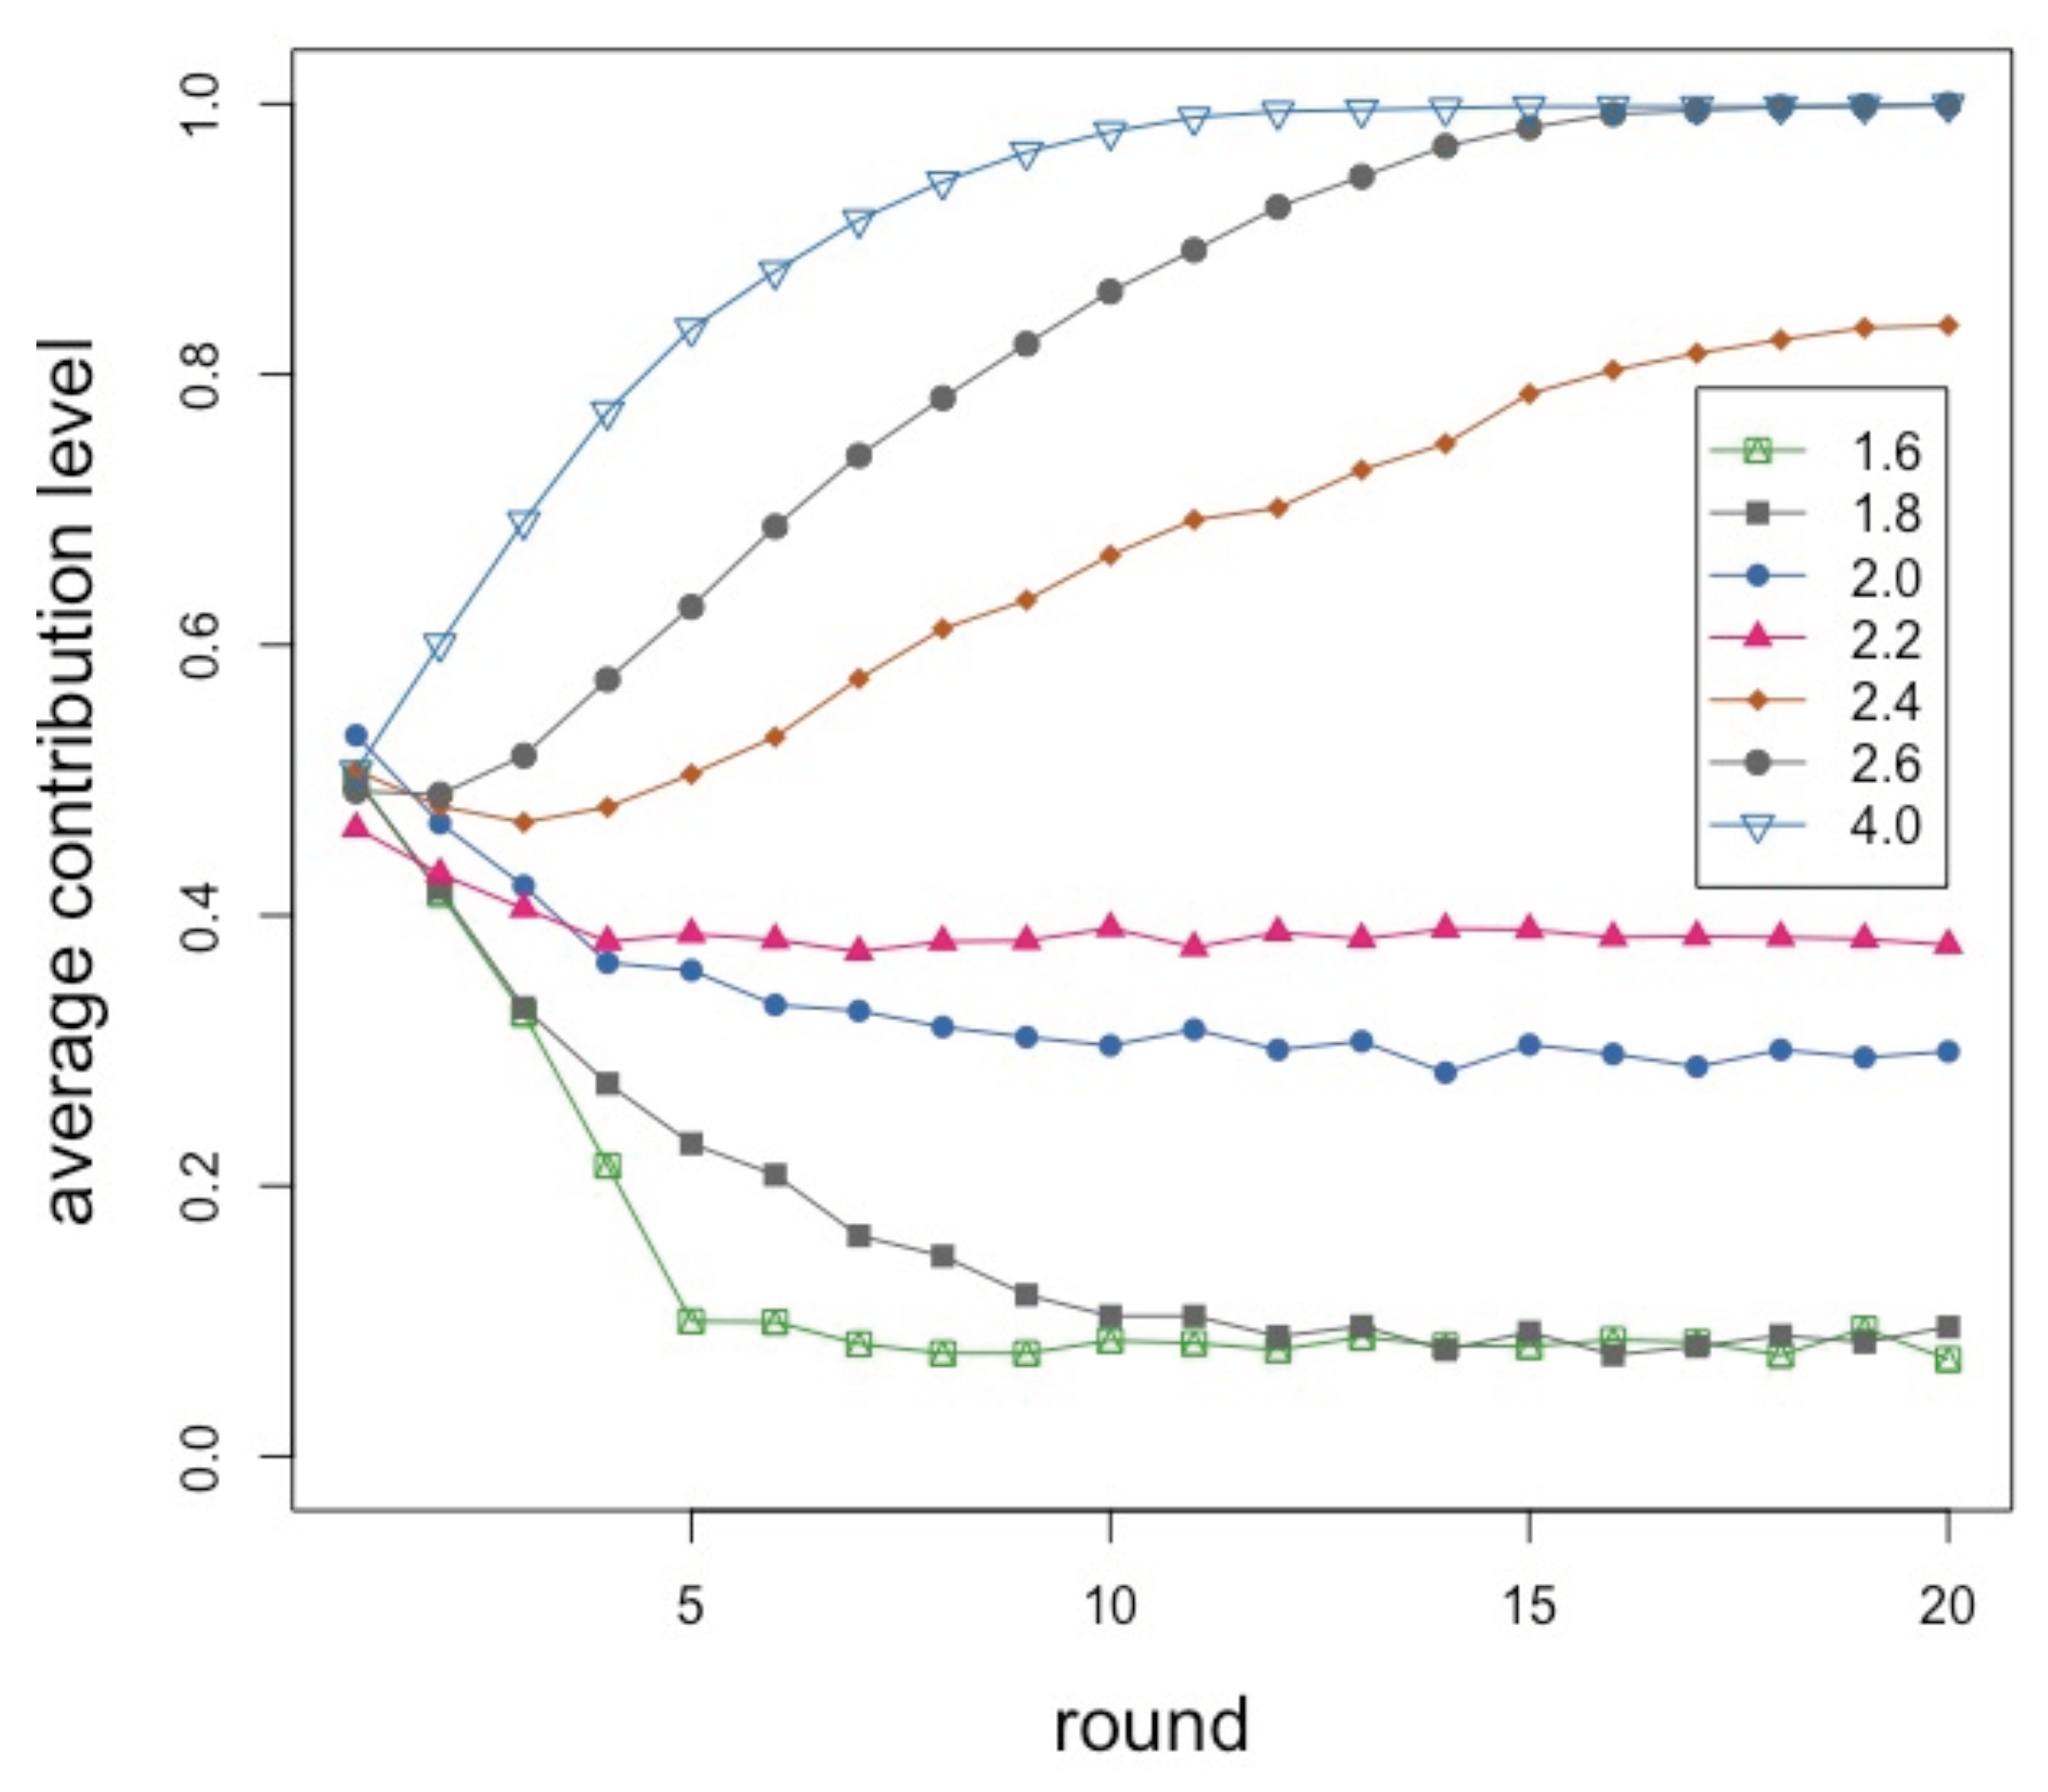
For the sake of completeness, we report in Figure 4 results for a smaller system with agents, which is the typical size of a laboratory experiment, such as the ones performed by [6], 20 rounds in each repetition, for 20 repetitions. We depict curves for several r values as specified in the inset. Despite the small size and a number of rounds reduced by half, the behavior is very similar to the larger system, the only difference being more fluctuations. This is encouraging since, while experiments with hundreds of participants are becoming possible using Amazon Mechanical Turk [27] or special-purpose web-based systems [28], they are difficult to carry out for various reasons. Indeed, from the above we can see that results on small-size systems may generalize to larger ones which is good news for experimenters. It is also worth mentioning that the “unit” amount of contribution was rather arbitrarily set to in our simulations but using the smaller granularity of does not change the nature of the results. In our tests, we only observed a lower average contribution below and a slower convergence to full contribution for ; otherwise, the phenomena show the same trends.
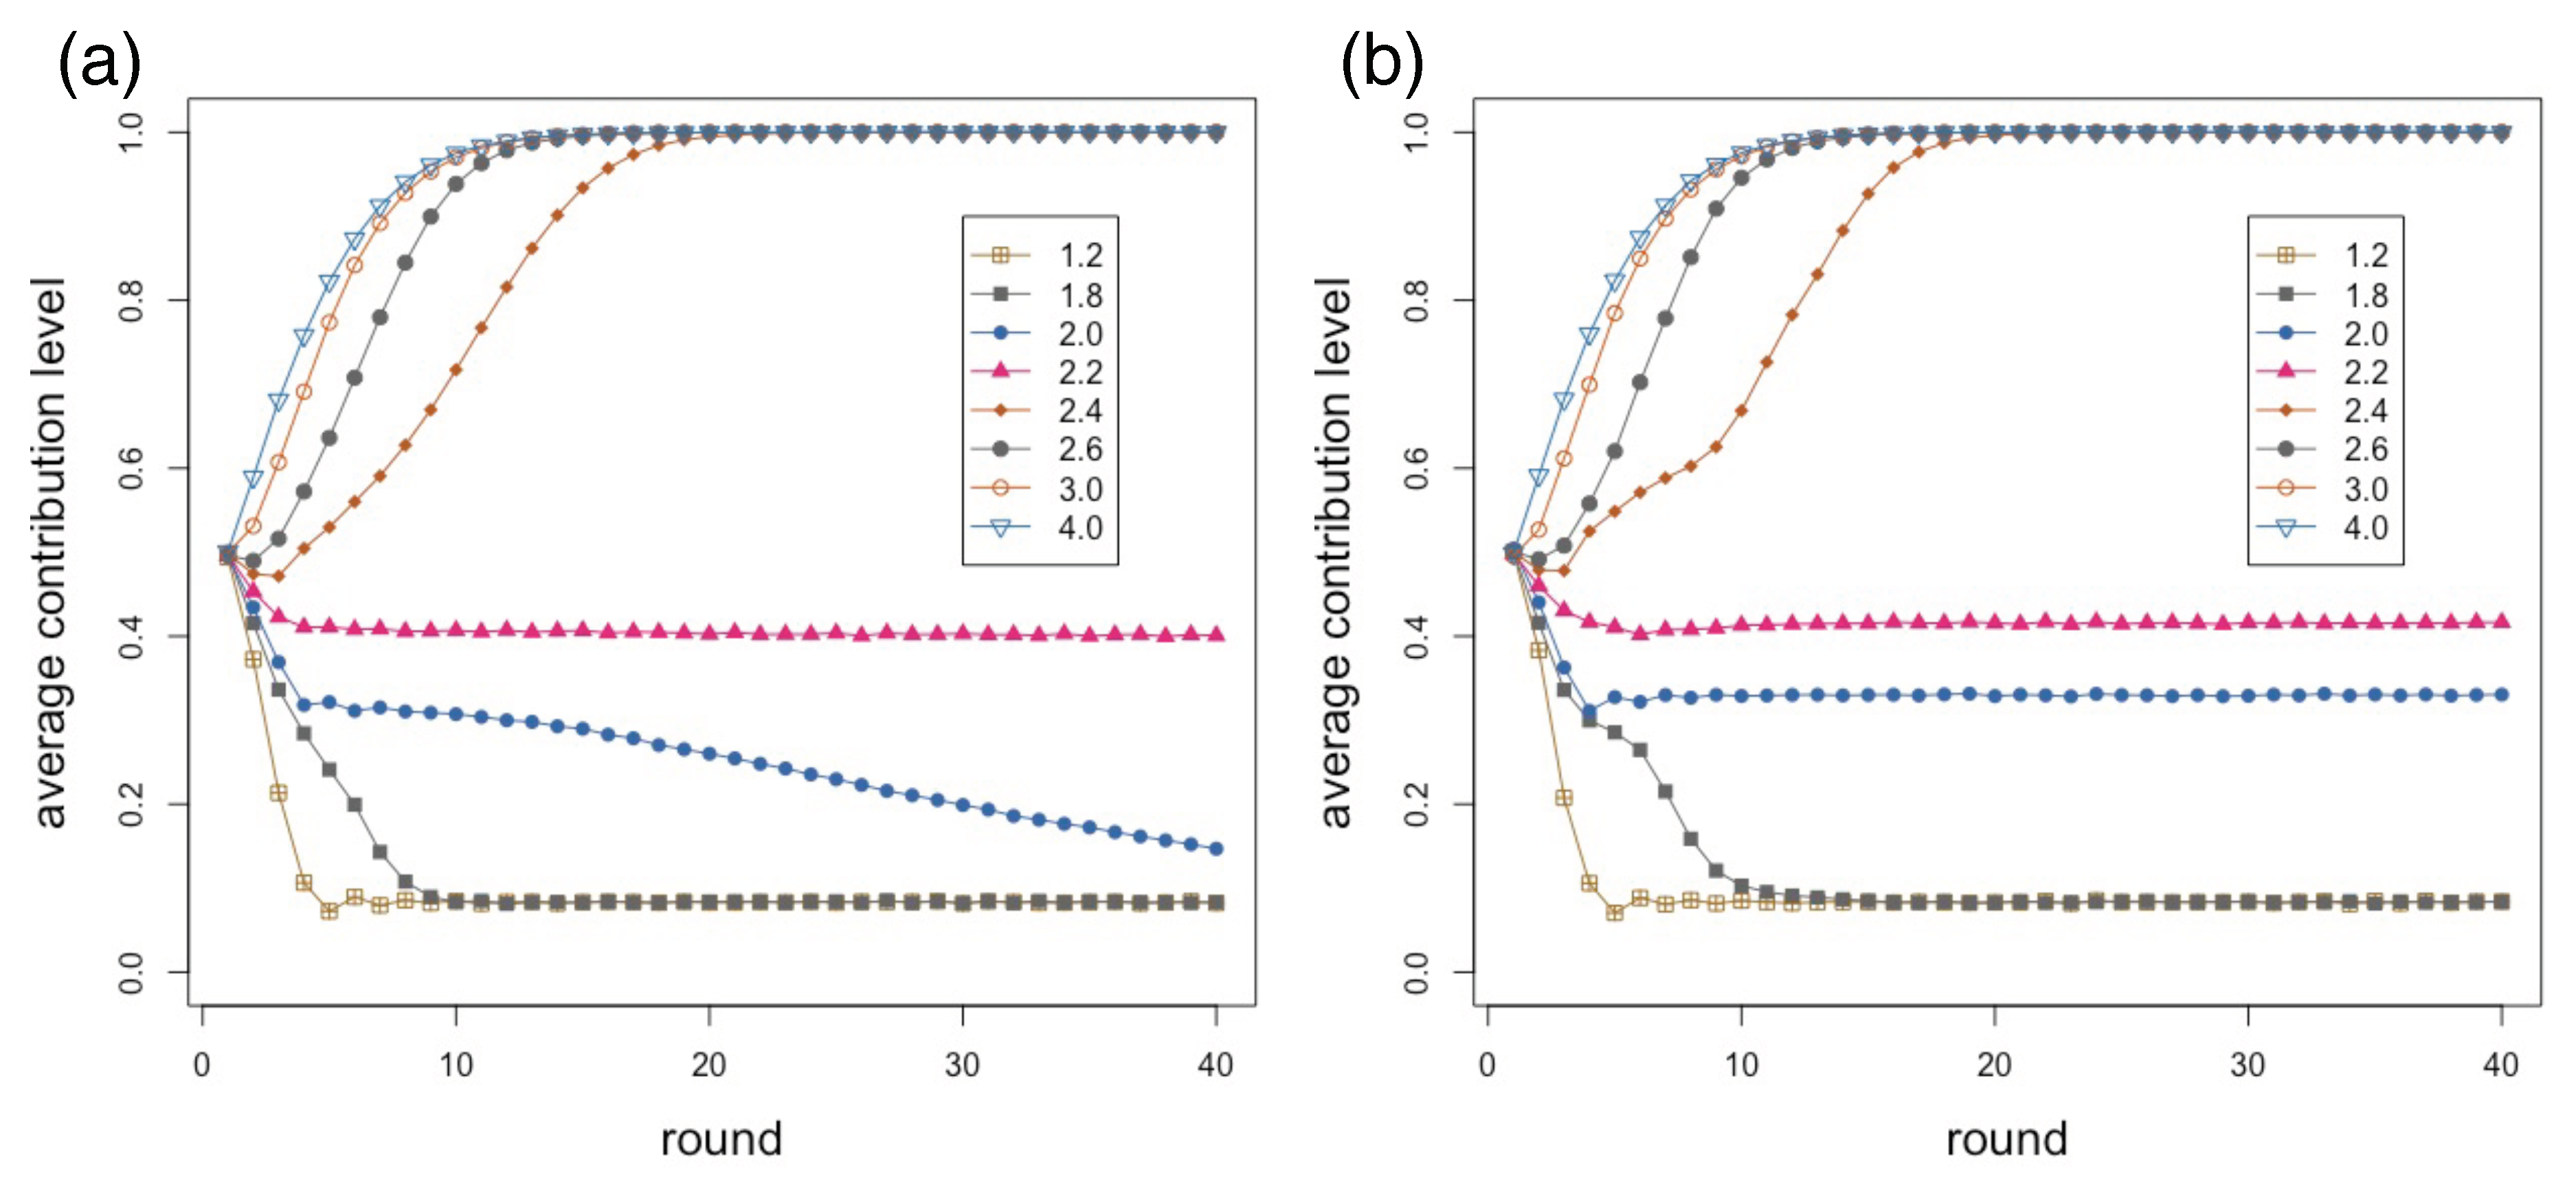
The results presented in Figure 2 are all for an value of in the building of the agents’ network. This is an average value that was found to lead to social network models with statistical features similar to those of some observed social networks when the role of geographical space is taken into account [26]. It is still interesting to study what happens when the extreme values of and are used in the network construction. A value of means that each new node only makes links to the closest existing nodes in the geographical space, while for each new link is made by preferential attachment, that is, proportional to degree, which leads to space-independent scale-free networks. The results are shown in the following Figure 5. Figure 5a corresponds to and Figure 5b is for . It is clearly seen that the behavior is very similar for low (less than 1.8) and high (more than 2.6) values of r. In between, however, it seems that contributions are slightly higher is the scale-free case (Figure 5b) where there are a few big groups and many small ones, with respect to the much more local and homogeneous purely spatial network (Figure 5a).
Another dimension that can be explored to some extent in the present model is the influence of the group size. This can be done simply by changing the mean degree of the agents’ network. As an example, Figure 6 shows the group size distribution for and average degree six. We have thus studied the cases with an average network degree of four, i.e., mean group size of five, and average degree 12, i.e., a mean group size of 13, both with . The results shown in Figure 7 are to be compared with those for average degree six in Figure 2. For average degree 12 cooperation increases slightly in the region of r = – with respect to degree four and six. However, the speed of convergence is a little slower with degree 12. Otherwise, the differences are minor, which leads us to conclude that the average group size has little effect, at least for the sizes studied here.
Finally, we comment on the model variation in which each agent has an individual propensity for keeping the same level of contribution or increasing it when its payoff is at least equal to its total contribution to all groups in which it is a member. The numerical simulation results are essentially the same as in the previous case, in which each agent when satisfied chooses with probability whether to keep its contribution the same or increment it and thus we do not report them to save space. The only difference is in the speed of convergence to quasi-equilibrium, which is slightly slower when agents each have a random chance between zero and one for each action. Since the system averages are the same in the long run, this explains why the long-run results are also the same.
4. Group Average-Based Model
In the previous sections, we study a model in which individuals only have access to their own decisions and earnings and know nothing about the behavior of the other members of the group to which they belong, nor about the other individuals in the whole social network. This can be a realistic enough hypothesis in situations in which communication is not direct but rather computer-mediated as in this case anonymity is often the rule. However, many PGG interactions take place among people or other entities that each can see who the other members of the group are and what they are doing. Indeed, in experimental work with human subjects the latter is the customary setting (see, e.g., [4]) and it is usually assumed that participants are aware of the rule games and, besides their own decisions and earnings, they also know the decisions of the other members of the group. In this case, it becomes possible to hypothesize that the observed decline in contribution is caused by conditional cooperation, whereby agents set their contribution in response to their own income and the income of the other members of the group [4,8].
Here, following the settings of a recent large-scale PGG experiment [28], we assume something simpler, i.e., any single player only has access to the mean contribution of her neighbors in the last run, in which case it is not possible to attribute a decline in contribution to any particular agent in one’s group. A simple first model can be constructed based on the available information by just “following the trend”. This kind of conformity has already been found to be an important rule is some contexts if followed by a portion of the population (see, e.g., [28,29,30,31]). We simulate this type behavior in the following way: if the contribution of an agent i is larger than the mean contribution of its neighbors , then in the next round the agent lowers its own contribution by a quantity that is randomly chosen in . Otherwise, if is less than , then the agent increases its contribution by a random amount in . If becomes less than 0 or larger than 1, it is made equal to 0 and 1, respectively. Finally, if , the contribution is left unchanged. The rule is summarized in Table 2.
In other words, individuals follow the trend of what their neighbors are doing by trying to get closer to the known average contribution of the latter. However, we do introduce some noise through the random choice of the correction to be made in order to avoid herd behavior and complete regression to the mean. This noise may be taken to represent errors or “trembles” in the decision process.
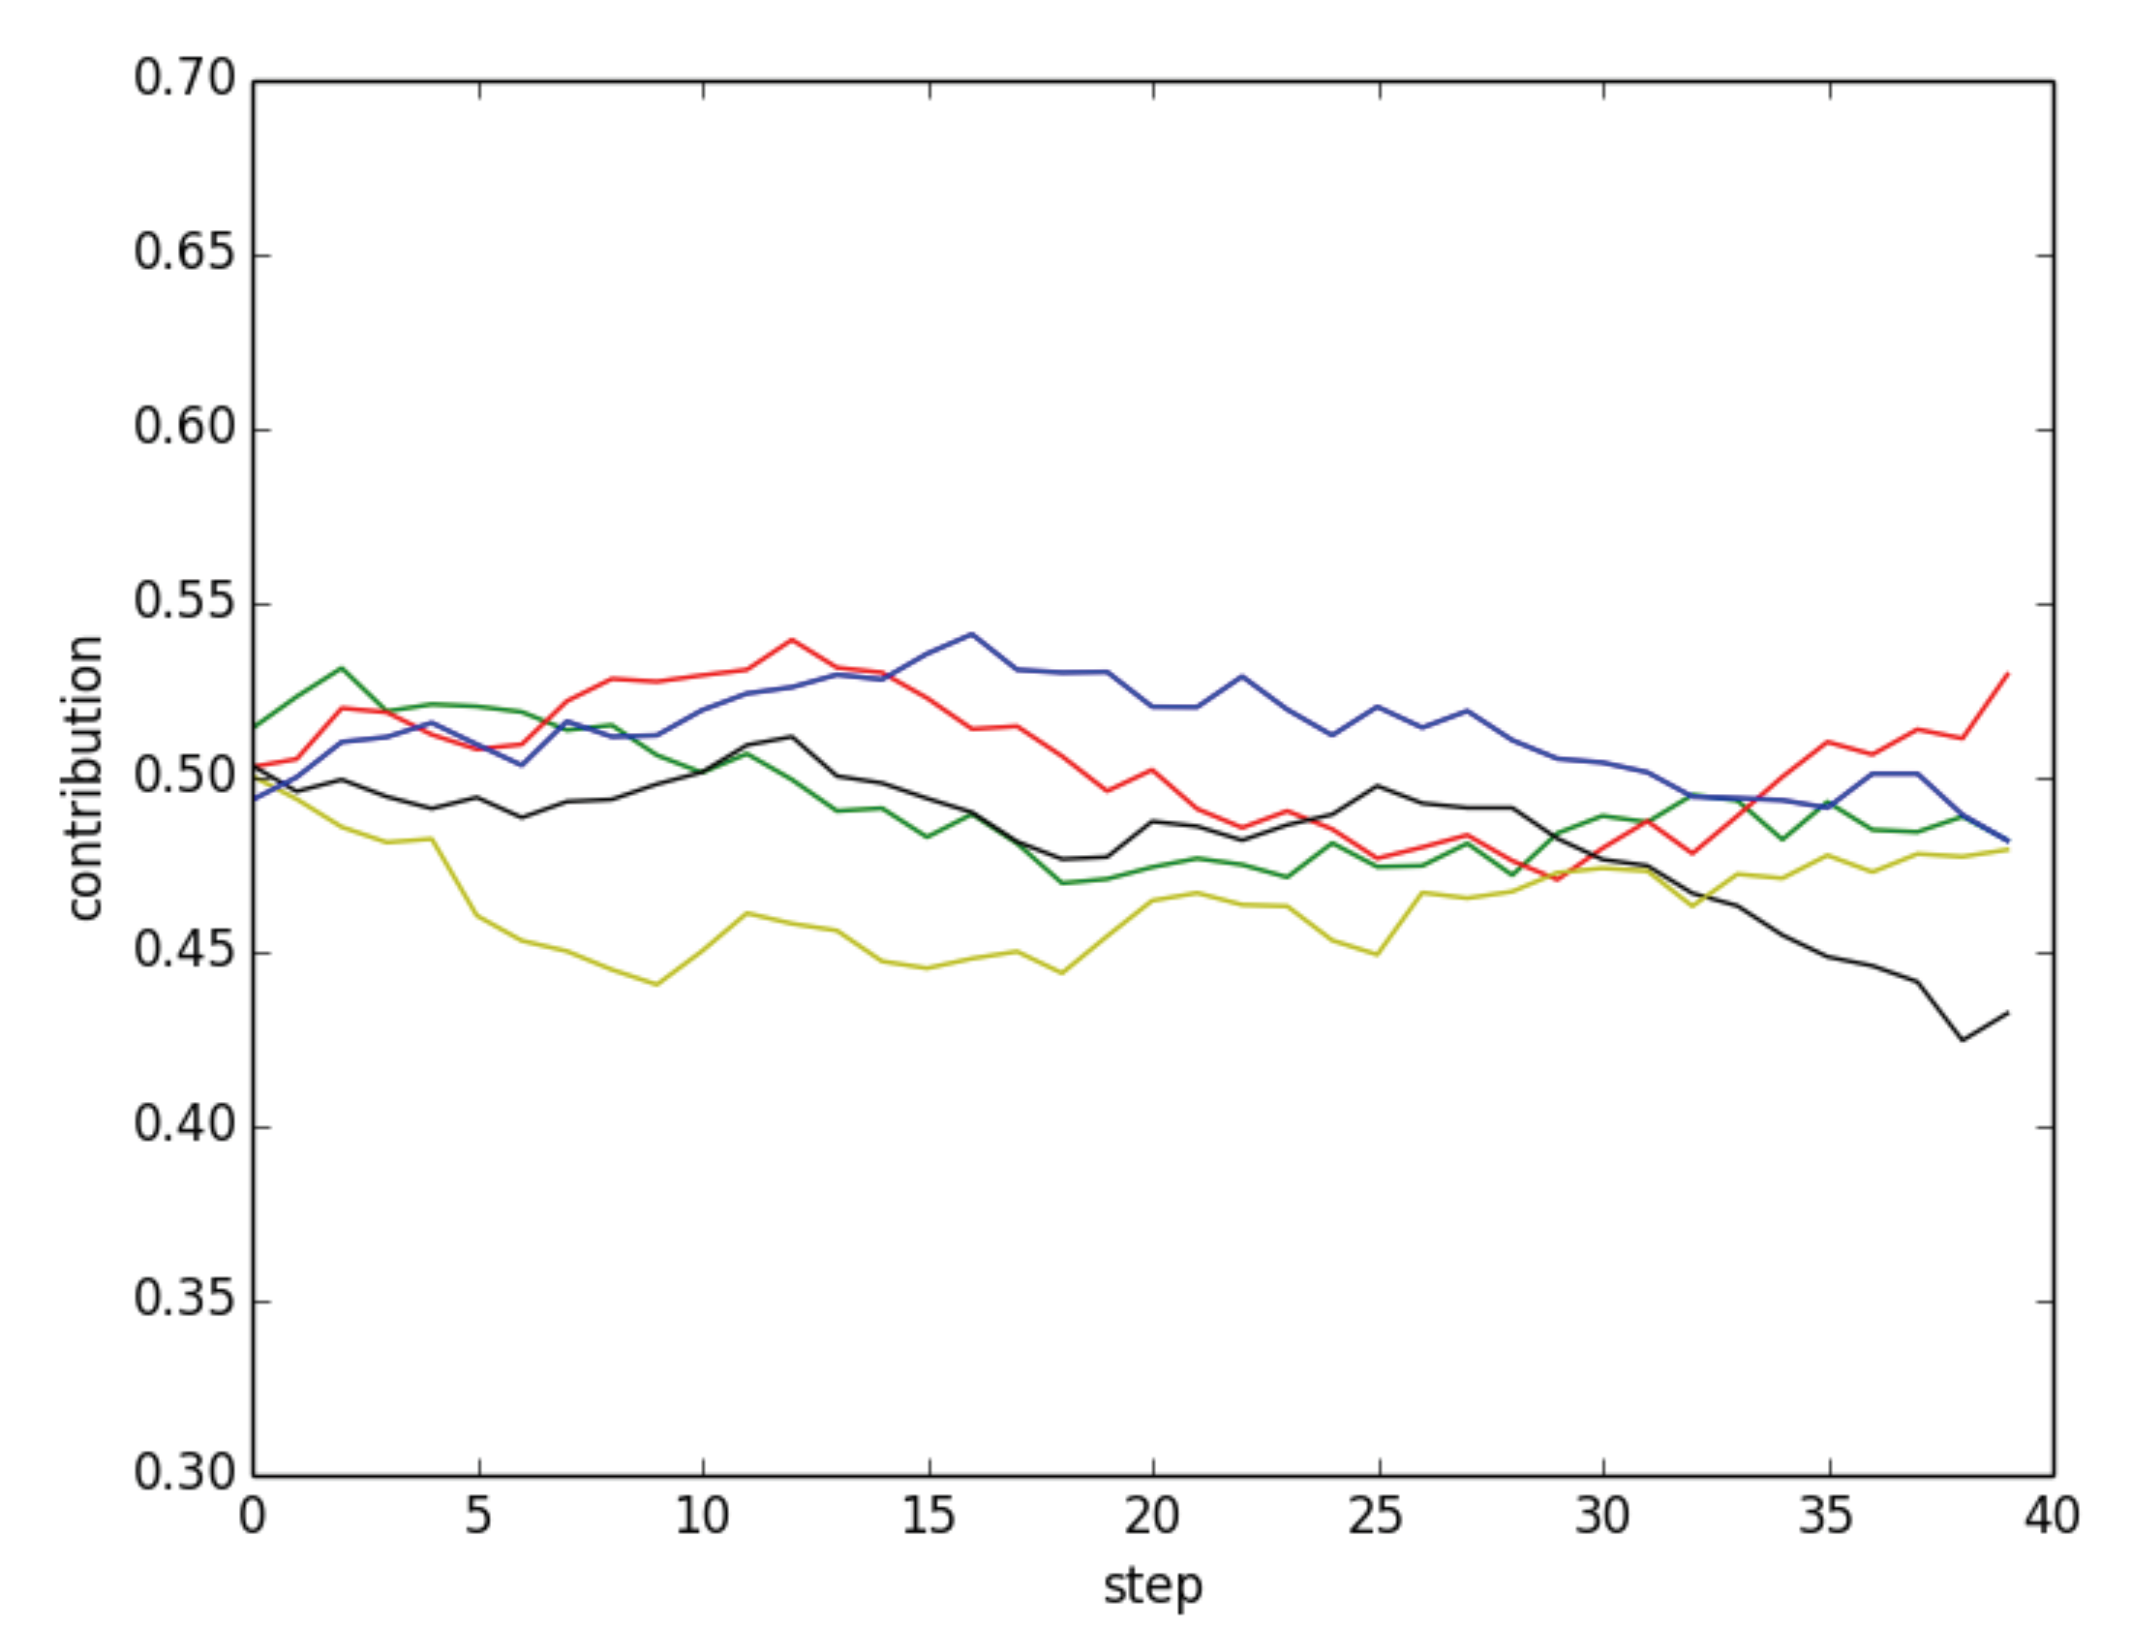
One consequence of this model is that the individual decisions do not take the payoff into account and are thus independent of the enhancement factor r. Furthermore, it does not make much sense to take the average value of many runs because, as the number of runs increases, the average gets closer and closer to the initial average contribution value and thus it hides any interesting behavior. Instead, in Figure 8, we show the results of a few typical simulations with the parameter set of Figure 2. In the figure, one can see that contributions in independent repetitions of the simulations fluctuate in a narrow band around the initial contribution values, thus ensuring a fair amount of cooperation.
Now, assuming that only the mean contribution of the neighbors is provided and not the own payoff of the individual is not realistic in a laboratory or real-life situation. Therefore, we tried to set up a model that combines these pieces of information in a simple manner. The model assumes that any agent, when deciding how much to contribute, randomly chooses between either following the mean as above, or setting the contribution in the next step as in the payoff satisfaction-based model of Section 2 with probability 1/2 each. This can be interpreted as having a dynamic population of players that is a random mix of two behavioral types with percentages equal to 0.5. Obviously, the fractions in the population could be different, or they could contemplate other types as well, but let us stick with the simpler model here.
The curves of Figure 9 have been obtained by running the above model and taking the averages of 40 independent repetitions of 40 interaction rounds each. The social network is of size , its mean degree is six, and the parameter is equal to 0.3 (see Section 2). The resulting behavior is essentially similar to the one corresponding to the payoff-only model (see Figure 2) for the same parameter values but cooperation establishes itself at slightly lower r values. Thanks to the presence of the payoff-based agents, the trend towards more contribution as r increases is respected. While the of agents in the average that are mean-following do not change the global behavior qualitatively, because of their noisy decisions, full cooperation is never achieved. A behavior that is qualitatively similar has been observed in a recent large-scale experiment in which the participants were given the same information [28].
5. Discussion and Conclusions
Our original motivations in developing the models presented in this work were related to the difficulties in trying to reconcile results of theoretical replicator dynamics based models of the simple PGG with the large number of observations that have been obtained in experimental work. Far from rejecting theoretical results, which provide us with a valuable rigorous general framework, we have argued that more flexible and behavior-inspired models are also needed if we want to reduce the gap between theoretical models and the results that have accumulated in experimental work.
Thus, we tried to design simple models of individual behavior that approximately mimic the actual behavior of subjects playing the PGG in the laboratory. Of course, the downside of this approach is that there can be a large number of individual behaviors, which also strongly depend on the amount of information that each agent receives about the members of her group. Inspired by recent experimental work by Burton-Chellew et al. [6,7,8], we started with a minimalist design in which agents are only informed about their own payoff after each round. The micro update rules thus reflect this situation in our model. Burton-Chellew at al. suggested that such a situation gives results that do not differ, in the statistical sense, from those in environments in which people are also informed about the contributions of the other members of the group, thus questioning the relevance of prosocial preferences or conditional cooperation [4,5]. Although we have a neutral position about the soundness of this argument, it seems to us a bit too simple outside the “payoff-only” experimental setting. Albeit, the results of simulating our model with only own’s payoff available fully confirm that the qualitative behavior of the population of players strongly resembles to what is observed experimentally and has the right behavior as a function of the enhancement factor, with the added advantage that large population sizes can be simulated, something that is very difficult to do in the laboratory or in the real world.
In the second part of our study we experimented with a different information set. Inspired by recent experimental large-scale work on the linear PGG [28], we designed two different models based on the fact that subjects know their own payoff after each round of play and also the average contribution of the other members of the group. It is still impossible for a given individual to know who did what in the group but the average is provided. In the first model individuals do not know (or ignore) their own payoff and are only aware of the mean contribution of the other group members and react to it. Following the observations made in [28], we assumed that people will try to bring their present contribution probabilistically closer to the mean, in a kind of conformist behavior. The results of single runs of the model show that a relatively high level of contribution to the common pool can be maintained. The multiplication factor does not play a role in this case.
In the second and more realistic model, we assumed that, statistically, half of the agents would choose the payoff-based rule of the payoff satisfaction model, and the other half would act as the mean-following agents just described. This amounts to having the same fractions of two types of players, or behaviors, in the population but single players are not hard-wired; they randomly choose their behavior with probability at each decision step. Here, we observe that behavior is similar to the first model based on own payoff only, with contributions going down (but not to zero) for medium enhancement factor values and increasing from there on but not to full cooperation due to the presence of half of the agents noisily following the mean.
Of course, one could imagine several other behavioral models, depending on the information available to the players. Here, we have tried to keep the system as simple as possible, following relevant results that have been published in the literature. In fact, experiments do show that, although heterogeneity in behavior is the rule, one can always abstract a few types whose mean behavior approximates the observed one. This is important as one cannot go back to completely idiosyncratic behavior under penalty of loosing any descriptive power.
In conclusion, simple models such as those presented here are very useful to interpret observed behavior and to enhance computationally the limited variation that is possible in the experimental domain. Conversely, by assuming a priori reasonable individual behaviors, the easiness by which simulations such as those described here can be run could also facilitate exploration prior to any experimental work in order to vary and estimate a number of key parameters that would be very difficult, if not impossible, to change during the actual experiment. In future work, we plan to more fully study the influence of the social network topology, including coevolutionary dynamics, communities of fully connected sets of agents, and other simple rule models based on different and richer information sets such as the distribution of contributions, reputational profiles and network structure beyond the first neighbors.
Author Contributions
Both authors conceived the study. M.T. wrote the code and ran computer simulations. Both authors performed data analysis, discussed the results, drew conclusions and wrote the manuscript.
Funding
This research was partially funded by the Ministerio de Economía y Competitividad of Spain under grant no. FJCI-2016-28276 (A.A.).
Conflicts of Interest
The authors declare no conflict of interest.
References
- Olson, M. The Logic of Collective Action: Public Goods and the Theory of Groups; Second printing with new preface and appendix; Harvard University Press: Cambridge, MA, USA, 2009; Volume 124. [Google Scholar]
- Hardin, G. The tragedy of the commons. Science 1968, 162, 1243–1248. [Google Scholar] [PubMed]
- Andreoni, J. Cooperation in public-goods experiments: Kindness or confusion? Am. Econ. Rev. 1995, 85, 891–904. [Google Scholar]
- Fehr, E.; Gächter, S. Cooperation and punishment in public goods experiments. Am. Econ. Rev. 2000, 90, 980–994. [Google Scholar] [CrossRef]
- Fehr, E.; Gächter, S. Altruistic punishment in humans. Nature 2002, 415, 137–140. [Google Scholar] [CrossRef] [PubMed]
- Burton-Chellew, M.N.; West, S.A. Prosocial preferences do not explain human cooperation in public-goods games. Proc. Natl. Acad. Sci. USA 2013, 110, 216–221. [Google Scholar] [CrossRef] [PubMed]
- Burton-Chellew, M.N.; El Mouden, C.; West, S.A. Conditional cooperation and confusion in public-goods experiments. Proc. Natl. Acad. Sci. USA 2016, 113, 1291–1296. [Google Scholar] [CrossRef] [PubMed] [Green Version]
- Burton-Chellew, M.N.; Nax, H.H.; West, A. Payoff-based learning explains the decline in cooperation in public goods games. Proc. R. Soc. Lond. Biol. Sci. 2018, 282, 20142678. [Google Scholar] [CrossRef] [PubMed]
- Nikiforakis, N. Punishment and counter-punishment in public good games: Can we really govern ourselves? J. Public Econ. 2008, 92, 91–112. [Google Scholar] [CrossRef]
- Bowles, S.; Gintis, H. A Cooperative Species; Princeton University Press: Princeton, NJ, USA, 2013. [Google Scholar]
- Sigmund, K. The Calculus of Selfishness; Princeton University Press: Princeton, NJ, USA, 2010. [Google Scholar]
- Santos, F.C.; Santos, M.D.; Pacheco, J.M. Social diversity promotes the emergence of cooperation in public goods games. Nature 2008, 454, 213. [Google Scholar] [CrossRef]
- Gómez-Gardeñes, J.; Romance, M.; Criado, R.; Vilone, D.; Sánchez, A. Evolutionary games defined at the network mesoscale: The public goods game. Chaos Interdiscip. J. Nonlinear Sci. 2011, 21, 016113. [Google Scholar] [CrossRef]
- Gómez-Gardeñes, J.; Vilone, D.; Sánchez, A. Disentangling social and group heterogeneities: Public goods games on complex networks. Europhys. Lett. 2011, 95, 68003. [Google Scholar] [CrossRef]
- Perc, M.; Gómez-Gardeñes, J.; Szolnoki, A.; Floría, L.M.; Moreno, Y. Evolutionary dynamics of group interactions on structured populations: A review. J. R. Soc. Interface 2013, 10, 20120997. [Google Scholar] [CrossRef] [PubMed]
- Perc, M.; Jordan, J.J.; Rand, D.G.; Wang, Z.; Boccaletti, S.; Szolnoki, A. Statistical physics of human cooperation. Phys. Rep. 2017, 687, 1–51. [Google Scholar] [CrossRef] [Green Version]
- Newman, M.E.J. Networks: An Introduction; Oxford University Press: Oxford, UK, 2018. [Google Scholar]
- Peña, J.; Rochat, Y. Bipartite graphs as models of population structures in evolutionary multiplayer games. PLoS ONE 2012, 7, e44514. [Google Scholar] [CrossRef] [PubMed]
- Nowak, M.A. Five rules for the evolution of cooperation. Science 2006, 314, 1560–1563. [Google Scholar] [CrossRef] [PubMed]
- Szabó, G.; Fáth, G. Evolutionary games on graphs. Phys. Rep. 2007, 446, 97–216. [Google Scholar] [CrossRef] [Green Version]
- Roca, C.P.; Cuesta, J.A.; Sánchez, A. Evolutionary game theory: Temporal and spatial effects beyond replicator dynamics. Phys. Life Rev. 2009, 6, 208–249. [Google Scholar] [CrossRef] [Green Version]
- Traulsen, A.; Semmann, D.; Sommerfeld, R.D.; Krambeck, H.-J.; Milinski, M. Human strategy updating in evolutionary games. Proc. Natl. Acad. Sci. USA 2010, 107, 2962–2966. [Google Scholar] [CrossRef] [Green Version]
- Grujić, J.; Fosco, C.; Araujo, L.; Cuesta, J.A.; Sánchez, A. Social experiments in the mesoscale: Humans playing a spatial Prisoner’s Dilemma. PLoS ONE 2010, 5, e13749. [Google Scholar] [CrossRef]
- Gracia-Lázaro, C.; Ferrer, A.; Ruiz, G.; Tarancón, A.; Cuesta, J.A.; Sánchez, A.; Moreno, Y. Heterogeneous networks do not promote cooperation when humans play a Prisoner’s Dilemma. Proc. Natl. Acad. Sci. USA 2012, 109, 12922–12926. [Google Scholar] [CrossRef]
- Gracia-Lázaro, C.; Cuesta, J.; Sánchez, A.; Moreno, Y. Human behavior in prisoner’s dilemma experiments suppresses network reciprocity. Sci. Rep. 2012, 2, 325. [Google Scholar] [CrossRef] [PubMed]
- Antonioni, A.; Tomassini, M. A growing social network model in geographical space. J. Stat. Mech. 2017, 9, 093403. [Google Scholar] [CrossRef]
- Buhrmester, M.; Kwang, T.; Gosling, S.D. Amazon’s mechanical turk: A new source of inexpensive, yet high-quality, data? Perspect. Psychol. Sci. 2011, 6, 3–5. [Google Scholar] [CrossRef] [PubMed]
- Pereda, M.; Tamarit, I.; Antonioni, A.; Cuesta, J.A.; Hernández, P.; Sánchez, A. Large scale and information effects on cooperation in public good games. 2019; submitted. [Google Scholar] [CrossRef]
- Peña, J.; Volken, H.; Pestelacci, E.; Tomassini, M. Conformity hinders the evolution of cooperation on scale-free networks. Phys. Rev. E 2009, 80, 016110. [Google Scholar] [CrossRef] [PubMed] [Green Version]
- Szolnoki, A.; Perc, M. Conformity enhances network reciprocity in evolutionary social dilemmas. J. R. Soc. Interface 2015, 12, 20141299. [Google Scholar] [CrossRef] [PubMed] [Green Version]
- Javarone, M.A.; Antonioni, A.; Caravelli, F. Conformity-driven agents support ordered phases in the spatial public goods game. EPL (Europhys. Lett.) 2016, 3, 38001. [Google Scholar] [CrossRef]
Figure 1.
In the example, the node has four direct neighbors () and it thus participates in five PGGs, i.e. the circle centered in involving , and four other PGGs represented by circles centered in its neighbors: . Note that a node may indirectly interact with other nodes that are not first neighbors.
Figure 2.
Average individual contribution as a function of round number for several values of the enhancement factor r as shown in the inset. The average is taken over 40 independent repetitions of 40 rounds each on a network of size 500 and .
Figure 2.
Average individual contribution as a function of round number for several values of the enhancement factor r as shown in the inset. The average is taken over 40 independent repetitions of 40 rounds each on a network of size 500 and .
Figure 3.
Results of the experimental study by Burton-Chellew and West; we refer the reader to [6] for more detailed information.
Figure 3.
Results of the experimental study by Burton-Chellew and West; we refer the reader to [6] for more detailed information.

Figure 4.
Average contribution from simulation of a small network of 20 agents as a function of the round number for the r values shown in the inset. Averages are taken over 20 independent repetitions of the simulation.
Figure 4.
Average contribution from simulation of a small network of 20 agents as a function of the round number for the r values shown in the inset. Averages are taken over 20 independent repetitions of the simulation.

Figure 5.
Average contribution as a function of round number for several values of the enhancement factor r as shown in the inset: (a) ; and (b) . The average is over 40 independent repetitions of 40 rounds each on a network of size 500.
Figure 5.
Average contribution as a function of round number for several values of the enhancement factor r as shown in the inset: (a) ; and (b) . The average is over 40 independent repetitions of 40 rounds each on a network of size 500.
Figure 6.
Group size distribution for an instance of a network of 500 nodes having an average degree equals to 6.
Figure 6.
Group size distribution for an instance of a network of 500 nodes having an average degree equals to 6.

Figure 7.
Average contribution as a function of round number for several values of the enhancement factor r as shown in the inset: (a) mean degree four; and (b) mean degree twelve. The average is over 40 independent repetitions of 40 rounds each on a network of size 500.
Figure 7.
Average contribution as a function of round number for several values of the enhancement factor r as shown in the inset: (a) mean degree four; and (b) mean degree twelve. The average is over 40 independent repetitions of 40 rounds each on a network of size 500.

Figure 8.
Average contribution during time in five independent simulations in which agents are trend-following according to the rules of the group average-based model (see Table 2).
Figure 8.
Average contribution during time in five independent simulations in which agents are trend-following according to the rules of the group average-based model (see Table 2).
Figure 9.
Average contribution as a function of round number for several values of the enhancement factor r as shown in the inset for the mixed model. The average is over 40 independent repetitions of 40 rounds each on a network of size 500.
Figure 9.
Average contribution as a function of round number for several values of the enhancement factor r as shown in the inset for the mixed model. The average is over 40 independent repetitions of 40 rounds each on a network of size 500.


Table 1.
In the payoff satisfaction model, the agent decreases its contribution fraction to PGG when the received payoff is less than the contributed amount . Otherwise, it increases its contribution or keeps the previous one with uniform probability. Here, R represents a uniform randomly generated number in [0,1].
| Payoff Satisfaction Model | ||||||
|---|---|---|---|---|---|---|
| Previous contribution fraction () | 0 | 0.25 | 0.5 | 0.75 | 1.0 | |
| = | = | = | = | = | ||
| + | + | + | + | = | ||
| = | − | − | − | − | ||
Table 2.
In the payoff group average model, the agent decreases (increases) its contribution when the latter is larger (smaller) than the average contribution of the group. It remains the same when these two quantities are equal. The amount of decrease (increase) is a random value chosen in .
Table 2.
In the payoff group average model, the agent decreases (increases) its contribution when the latter is larger (smaller) than the average contribution of the group. It remains the same when these two quantities are equal. The amount of decrease (increase) is a random value chosen in .
| Group Average-Based Model | ||||||
|---|---|---|---|---|---|---|
| Previous contribution fraction () | 0 | 0.25 | 0.5 | 0.75 | 1.0 | |
| = | − | − | − | − | ||
| + | + | + | + | = | ||
| = | = | = | = | = | ||
© 2019 by the authors. Licensee MDPI, Basel, Switzerland. This article is an open access article distributed under the terms and conditions of the Creative Commons Attribution (CC BY) license (http://creativecommons.org/licenses/by/4.0/).
Share and Cite
MDPI and ACS Style
Tomassini, M.; Antonioni, A. Computational Behavioral Models for Public Goods Games on Social Networks. Games 2019, 10, 35. https://doi.org/10.3390/g10030035
AMA Style
Tomassini M, Antonioni A. Computational Behavioral Models for Public Goods Games on Social Networks. Games. 2019; 10(3):35. https://doi.org/10.3390/g10030035
Chicago/Turabian StyleTomassini, Marco, and Alberto Antonioni. 2019. "Computational Behavioral Models for Public Goods Games on Social Networks" Games 10, no. 3: 35. https://doi.org/10.3390/g10030035
Note that from the first issue of 2016, this journal uses article numbers instead of page numbers. See further details here.