
Evolution of “Pay-It-Forward” in the Presence of the Temptation to Free-Ride

1
Research Center for Ethi-Culture Studies, RINRI Institute, Tokyo 102-8561, Japan
2
High-Tech Research Center, Kokushikan University, Tokyo 154-8515, Japan
3
Department of Community Development, Koriyama Women’s College, Fukushima 963-8503, Japan
4
Faculty of Business Administration, Rissho University, Tokyo 141-8602, Japan
5
Department of Business Administration, Soka University, Tokyo 192-8577, Japan
*
Author to whom correspondence should be addressed.
Games 2024, 15(3), 16; https://doi.org/10.3390/g15030016
Submission received: 17 February 2024
/
Revised: 16 April 2024
/
Accepted: 19 April 2024
/
Published: 25 April 2024
Abstract
:“Paying it forward” is a behavior in which people help someone else because they were helped in the past. Although experimental evidence exists that indicates that real human beings often “pay-it-forward” even in the face of free-rider risks, the theoretical basis for the evolution of this behavior remains unclear. In this paper, we propose a game-theoretical model that explains how pay-it-forward behavior can evolve despite the temptation to free-ride. By assuming that human beings exhibit cognitive distortions, as predicted by prospect theory, and that free-riding is punished with a tiny probability, we demonstrate that pay-it-forward, alongside unconditional altruistic behavior, can evolve and effectively deter free-riding behavior.
1. Introduction
People often “pay-it-forward” by passing on benefits they have received from someone in the past to others in the future. Experimental and observational studies have provided evidence that people indeed engage in decisions reflective of pay-it-forward behavior [1,2]. For instance, in [1], game experiments conducted in a laboratory setting revealed that the altruistic behavior of one game player spread to other players within the social network. This propagation of altruistic behaviors from one player to another encourages cooperation among players.
The presence of pay-it-forward behaviors in the real world presents a significant challenge to game theory, especially within the context of evolutionary game theory. Essentially, when a player chooses to pass on benefits received from someone in the past to others, they do not gain any immediate personal profits. Consequently, individuals who opt not to pay-it-forward (i.e., those who engage in “free-riding”) often find themselves at a greater advantage compared to those who participate in pay-it-forward activities (“pay-it-forwarders”). Without introducing an additional mechanism, natural selection or social learning processes are expected to favor non-participants [3]. Thus, identifying a mechanism that discourages free-riding behavior has become a crucial theoretical challenge.
Unconditional altruistic behavior, in which individuals help others without expecting anything in return, often leads to what is known as the social dilemma, or free-rider problem, as documented in the literature [4,5,6,7,8,9,10]. Pay-it-forward practices, however, represent a form of conditional altruistic behavior where individuals help others only if they themselves have received help in the past. This fact highlights that conditional altruistic behavior shares the same underlying structure as the social dilemma, characterized by the following: (1) individuals in a society have the choice to either engage in pay-it-forward practices or to free-ride, (2) a society comprised mainly of pay-it-forwarders is generally more beneficial than one filled with free-riders, and (3), on an individual level, free-riders tend to fare better than pay-it-forwarders. This is because pay-it-forwarders distribute the benefits they have received to others, whereas free-riders keep any advantages for themselves. In situations presenting a social dilemma, opting for free-riding becomes more appealing for individuals irrespective of the choices made by others.
In this paper, we show that pay-it-forward can be sustainably maintained if individuals adhere to what is known as prospect theory (PT) and if punishment for not helping others is applied, albeit infrequently. This stands in contrast to scenarios where individuals are so rational that they follow the (linear) expected utility theory (EUT), under which pay-it-forward practices do not persist. In our previous research, we established that prospect theory facilitates cooperation through peer punishment [11], whereas EUT does not lead to the same outcome when free-riders are only occasionally punished. We hypothesize that a similar rationale applies to the evolution of cooperation through pay-it-forward mechanisms. Investigating this hypothesis is the main focus of the current paper.
Prospect theory is widely recognized as one of the most successful frameworks for describing the cognitive biases inherent in human decision-making [12,13,14]. Within this theory, distortions in the perception of probabilities and the evaluation of outcomes are represented through a weighting probability function and a value function, respectively. Both functions are characterized by their non-linearity and asymmetry, capturing the essence of human irrationality. This theoretical approach highlights how individuals often deviate from rational decision-making models, particularly in the context of risk and uncertainty, by assigning disproportionate weights to certain outcomes and probabilities.
Most studies on the evolution of cooperation in evolutionary game theory have traditionally been conducted under the assumption that individuals adhere to EUT [5]. EUT posits that individuals are perfectly rational, making their calculations regarding potential benefits, or so-called expected payoffs, with precision. Contrary to this assumption, experimental research on both behavioral economics and experimental economics has consistently demonstrated that real humans do not conform to EUT [15,16]. In reality, humans are incapable of estimating probabilities and values without bias. The capacity to accurately calculate probabilities and values, devoid of any distortions, underpins the concept of linearly calculated expected payoffs [17,18,19,20,21,22]. However, the payoffs, as perceived by real humans, are subjective, and this subjectivity is a critical factor in the actual decision-making process. This discrepancy between the theoretical assumptions of EUT and the practical observations under PT highlights the complexities and nuances in understanding human behavior in evolutionary game-theoretic contexts.
In the subsequent sections of this paper, we demonstrate that, when individuals exhibit the level of irrationality encapsulated by PT, pay-it-forward behaviors emerge, and cooperation persists even within parameter regions where conditional altruistic actions cannot be sustained under the rationality assumptions of EUT. Specifically, the risk associated with free-riding behaviors is mitigated by the cognitive biases and decision-making patterns described by PT. Furthermore, the strategy of pay-it-forward behaviors has the potential to overturn unconditional altruistic behavior, highlighting a critical distinction between paying-it-forward and unconditional cooperation, despite their superficial similarities.
Following a brief review of the relevant literature in the next section, we will outline our model before presenting our findings. The paper concludes with a section dedicated to our conclusions, summarizing the implications of our research on the understanding of cooperative behaviors and the influence of cognitive biases on the interactions among individuals.
2. Brief Literature Review
There are several recent papers that have combined evolutionary game theory with prospect theory, aiming to derive practical implications for addressing social issues. For instance, the study referenced as [23] considers the irrationality of players, as described by prospect theory, and constructs an evolutionary game-theoretical model to explore the decision-making process of enterprises when choosing between innovation and imitation. A paper by Sun, Gao, and Li published in 2022 [24] analyzes interactions between enterprises and governments, particularly in the context of establishing carbon emission regulations. Meanwhile, the paper referenced as [25] focuses on the decision-making processes of polluting enterprises and their interactions with government bodies. A more recent study [26] investigates the recycling of power batteries within the electric vehicle industry, proposing a game model that involves three distinct types of players (governments, manufacturers, and recycling companies). Each of these papers develops an evolutionary game model that incorporates aspects of prospect theory.
The evolution of cooperation has been extensively studied within the field of evolutionary game theory, as highlighted in [27]. A recent theoretical study [28] attempts to elucidate the evolution of cooperative (and coordinated) behavior by incorporating the effects of prospect theory into a model. This is achieved through the lens of a coordination game known as the stag-hunt game.
In this paper, we aim to show a path to the evolution of cooperation through pay-it-forward behaviors using a prisoner’s-dilemma-type game called the “donation game”. The mechanism to sustain cooperation via pay-it-forward is a type of so-called indirect reciprocity mechanism. Indirect reciprocity is one of the five typical mechanisms to sustain cooperation [29]. In indirect reciprocity, beneficial acts are returned not by the recipient, as in the direct reciprocity mechanism, but by third parties. In the literature [6], indirect reciprocity is classified into the following two categories: downstream reciprocity and upstream reciprocity. Pay-it-forward is categorized as upstream reciprocity, which represents the ”I-help-you-because-someone-helped-me” attitude. Downstream reciprocity represents the “I-help-you-because-you-helped-someone” attitude, which is the mainstream in the study of indirect reciprocity.
While the literature on the evolution of cooperation via downstream reciprocity is ample [30,31,32,33,34,35,36,37,38], evolutionary theory has yet to explain the effectiveness of upstream reciprocity in regard to the evolution of cooperation. A well-cited paper on upstream reciprocity in the context of evolutionary game theory was published in 2007 [3], but it concludes that upstream reciprocity can evolve as a “by-product of direct reciprocity”, i.e., upstream reciprocity works if it is combined with another effective mechanism, direct reciprocity. In [39], the evolution of upstream reciprocity was explained in a complex network, and in [40], it was shown that cooperation can evolve by upstream reciprocity only in small interaction groups. According to a thorough review on the theoretical research of indirect reciprocity published recently [41], although there is some experimentation on upstream reciprocity, explaining it via theoretical viewpoints is still challenging.
3. Model
3.1. Game
To maintain simplicity and facilitate analysis of the model, in line with several studies in the field of the evolution of cooperation [11,42,43,44], we consider a large, well-mixed population of individuals (or players). Two players are chosen at random from the population from time to time. Let us call the chosen players A and B. Players A and B engage in the following “donation game” (or “giving game”) [6]: each player decides whether to help the opponent by paying a cost . If Player A (B) chooses to help B (A), the opponent receives a benefit ; otherwise A (or B) does not pay anything and B (A) obtains nothing. Every player in the population is selected as a game player (infinitely) many times and experiences decision-making processes. From here on, we denote the action “cooperate with its opponent (or just cooperate)” by “C” and “defect its opponent (or just defect)” by “D”.
Table 1 shows the payoffs Player A obtains when playing the donation game with Player B. It consists of four possible outcomes, as both players have two options each. If both players choose C, Player A gains a benefit of . If Player A chooses C while Player B opts for D, Player A incurs a loss of . Conversely, if Player A selects D and Player B chooses C, then Player A receives a benefit of . If both players select D, Player A receives no benefit (and neither does Player B).
3.2. Game, Strategies and Payoff Matrix
We consider the following three strategies: AC, AD, and S [42]. Strategy AC prescribes to help others with probability . Due to the shortage of resources, AC-players do not give help with probability , even if they would like to. We call an implementation error and set its value to 0.05. Players using strategy AD are free-riders and never help others. We call those players AD-players. Strategy S players correspond to pay-it-forward, which prescribes to choosing C (with probability ) if they were helped in the last game. If they were not helped in the last game, S-players choose D in the current game. We also refer to the strategies by numbers: AC = strategy 1, AD = strategy 2, and S = strategy 3.
3.3. Payoff Matrix
We examine a type of punishment known as pool punishment [45,46,47,48,49,50,51]. In this framework, a punishment institution exists in the population and executes punishment to those who chose D in the donation game. Players in the population pay a cost , which will be used to maintain the punishment institution.
In this paper, we assume that the institution executes punishment with only a small probability to account for situations where the institution functions insufficiently. From the viewpoints of players, after the two selected players have played the donation game, they have a small chance of being punished by the external institution if they chose D in the donation game. The probability of being punished is , which is set to be 0.2 in the following numerical simulations.
We assume that AD-players, who never give help to others, do not pay (See Section 3.5 for more details). In this sense, AD-players are not only first-order free-riders but also second-order free-riders. Here, first-order free-riders mean that they do not engage in cooperative activities, while second-order free-riders are defined as those who do not contribute to punishment activities. AD-players are assumed to be both first-order and second-order free-riders at the same time. This is a harsher assumption for the evolution of cooperation than the assumption that AD-players also pay the cost to maintain the punishment institution, as other types of players are at more of a disadvantage if AD-players do not incur the punishment cost.
The strength of punishment is denoted by . Thus, if a player chooses D in the donation game, and if punishment is executed by the institution (which occurs with probability ), the player suffers a fine, . If punishment is not executed, nothing is imposed on the player. As a result, we obtain Table 2 as the payoff matrix studied in this paper. This matrix comprises eight elements, as Player A has two options (C or D), and, for each option, there are four possibilities depending on whether the opponent, Player B, chooses C or D and whether the institution executes punishment or not.
We call this payoff matrix . In Table 2, for example, “CP” means that Player B helps Player A and the institution executes punishment. In this case, if A does not help B, A obtains benefit but suffers at the same time. The total payoff in this case is .
It is worth noting that if Player A helps Player B, A will never be punished. Consequently, the element of the payoff matrix corresponding to this scenario () is undefined. For the same reason, is also undefined, as Player A’s action of choosing C will never result in punishment. We formally put value “0” for the elements and in the table. However, these values are never used, as these situations never occur. The cost of implementing punishment is not included in the payoff matrix, as it does not result from interactions with other players. The cost for punishment is introduced after estimating the expected payoffs on the basis of interactions with other players (See Section 3.5).
3.4. Strategy Switching
Players occasionally switch their strategies by social learning. As a result of the switching process, the time evolution of the proportion of strategy (), denoted by , is governed by the so-called replicator equation
where is the expected payoff of strategy and is the expected payoff of the whole population. Since is the proportion of strategy , holds.
By numerically integrating the replicator equation mentioned above, we can analyze the stability of each strategy. In the subsequent subsection, we will describe how the expected payoff is calculated.
3.5. Probability Distribution on and Expected Payoff
3.5.1. Linear Expected Utility Theory
Expected payoff reflects the long-term payoff of players using strategy . It can be determined by calculating the probability that each outcome for payoff matrix occurs. The probabilities are dependent on strategies. By , we denote the probability distribution on of players using strategy .
To determine probability distributions, it is crucial to first know the probability of whether players following a certain strategy will offer help to others. For those adhering to the AC strategy, this probability is , while for AD, it is 0. To ascertain the probability that S-players will offer help, we define as the frequency at which players receive help from a random player within the population. This frequency, , can also be interpreted as the probability of a player being given help by a random participant in the game.
It is important to note that the act of receiving help in the game does not rely on the strategy used by the recipient. Therefore, is strategy-independent and represents the chance that any given player is helped in a game. Consequently, the probability that S-players will choose action C is represented by .
The frequency evolves over time as individuals engage in the game. We assume that the dynamics of occur at a much faster pace than changes in strategy. In essence, players experience various interactions an infinite number of times before altering their strategies. This approach keeps the variables constant while allowing to vary, a premise similarly assumed in Sections 4.2 and 4.3 of [6].
As demonstrated in Appendix A, reaches an equilibrium defined by the following equation:
Here, the first term on the right-hand side represents the probability of encountering an AC-player (), who then opts for cooperation (C) with probability . The second term accounts for the likelihood of meeting an S-player () who, having previously been given help, chooses C with a probability of .
By solving this equilibrium equation, we find to be:
Since probability distributions on depend on strategies, the expected payoff is dependent on strategies. Table 3(a)–(c) show probability distributions with parameters (). In the tables, , , .
For example, is the product of the following three probabilities: the probability that an AC-player is given help by the opponent player of a game (), the probability that the AC-player chooses D (), and the probability that this behavior (i.e., choosing D) is punished by the external institution (). Note that for any .
With these probability distributions on , the expected payoff of players using strategy through interactions with other players is given by
For example, .
Considering that AD-players do not pay any cost to maintain the external punishment institution, we find the final form of the expected payoff of players following strategy :
for and
for .
Here, is the cost to maintain the punishment institution. AD-players are at more of an advantage than AC-players and S-players by the value of .
3.5.2. Prospect Theory
The way we include prospect theory in our evolutionary game model is essentially the same as in our previous paper [11]. Thus, we apply a value function and weighting function to each element of the payoff matrix and to the probability distribution , respectively:
where and are the value function and the weighting function, respectively. In Appendix B, we describe the appearance of the functions.
The subjectively distorted payoff matrix is independent of strategies. It is well-known that the nonlinearity of the value function means that the baseline of the payoff matrix, or the reference point, significantly influences the results, differing from EUT. Specifically, within the EUT framework, adding the same constant to all elements of the payoff matrix does not alter the payoff structure. In other words, the relative superiority or inferiority of strategies remains unchanged, even if each player consistently receives the same payoff. However, under PT, adding the same constant (for instance, by assuming each player obtains a constant payoff in playing a game) can affect the outcomes. We assume the payoff obtained from the outcome (2,3) in , which is zero, serves as the so-called reference point, with no additional constants added.
With these subjective probabilities and payoffs, the expected payoff is calculated as
for and
for .
Note that we apply only the value function, not the weighting function, to the last term (: the loss of payoff by paying a cost for punishment) for the following reason: it does not represent a loss suffered through interaction in a game and is therefore not a stochastic event (hence, the weighting function plays no role). By applying the value function to , the perceived impact of the cost for maintaining the punishment institution is regarded as more significant than its actual impact. We also note that the strategy change is described by the ordinary replicator dynamics mentioned above.
4. Results
4.1. Analysis in Case of EUT
In the context of expected utility theory (EUT), the replicator dynamics can be thoroughly analyzed due to the simplicity of the expected payoffs. The expected payoffs for AC-players, AD-players, and S-players are, respectively represented as
From these equations, it can be demonstrated that AD-players become extinct through the replicator dynamics, while AC-players evolve and are sustained, provided the punishment is effective or substantial enough (that is, if the parameters or surpass certain threshold values).
Specifically, suggests that , while implies . If these conditions are met, the AC strategy emerges as the unique evolutionarily stable strategy (ESS), leading all players to eventually adopt it, resulting in . Conversely, when , the AD strategy becomes the unique ESS.
The S strategy can never be an ESS because a population consisting solely of S-players is vulnerable to invasion by an AD-player. Indeed, at the point where , which implies , we find that . This indicates the inability of the S strategy to sustain itself as a stable strategy in the population if players follow EUT.
In the following numerical investigations, we fix parameter values as With these values, the conditions and hold if . Figure 1a–c display trajectories in the state space obtained by numerically integrating the replicator dynamics with and with , respectively.
The replicator dynamics analyzed to produce the figure are given by the following coupled equation system:
The initial conditions are set randomly. The state space is represented as the simplex , visualized as an equilateral triangle. The vertex AC corresponds to , AD to and S to . The state of the population evolves within this space according to the replicator equation. The figures also illustrate vector fields generated by the replicator dynamics.
If is sufficiently large, for example, 5.6, all trajectories converge to the vertex AC, as predicted by the above analysis (see Figure 1a). Consequently, all players ultimately adopt strategy AC, consistently aiming to help others.
With lower values of , as depicted in Figure 1b,c, all trajectories converge towards the AD strategy. At these parameter values, rational individuals opt for the AD strategy because the punishment executed by the institution is insufficiently severe (i.e., is small) and the probability of being punished is too low (i.e., is small). Consequently, the punitive institution fails to function effectively in this scenario.
A notable difference between Figure 1b () and Figure 1c () is observed in the vector directions on the edge between AC and S. In the former scenario, AC is able to invade S, whereas, in the latter, S invades AC. However, it is important to note that S can never achieve evolutionary stability as it is susceptible to invasion by AD. Consequently, we can deduce that the pay-it-forward strategy, S, does not significantly contribute to the evolution of cooperation with the institutional punishment within the EUT framework.
4.2. Numerical Results in Case of PT
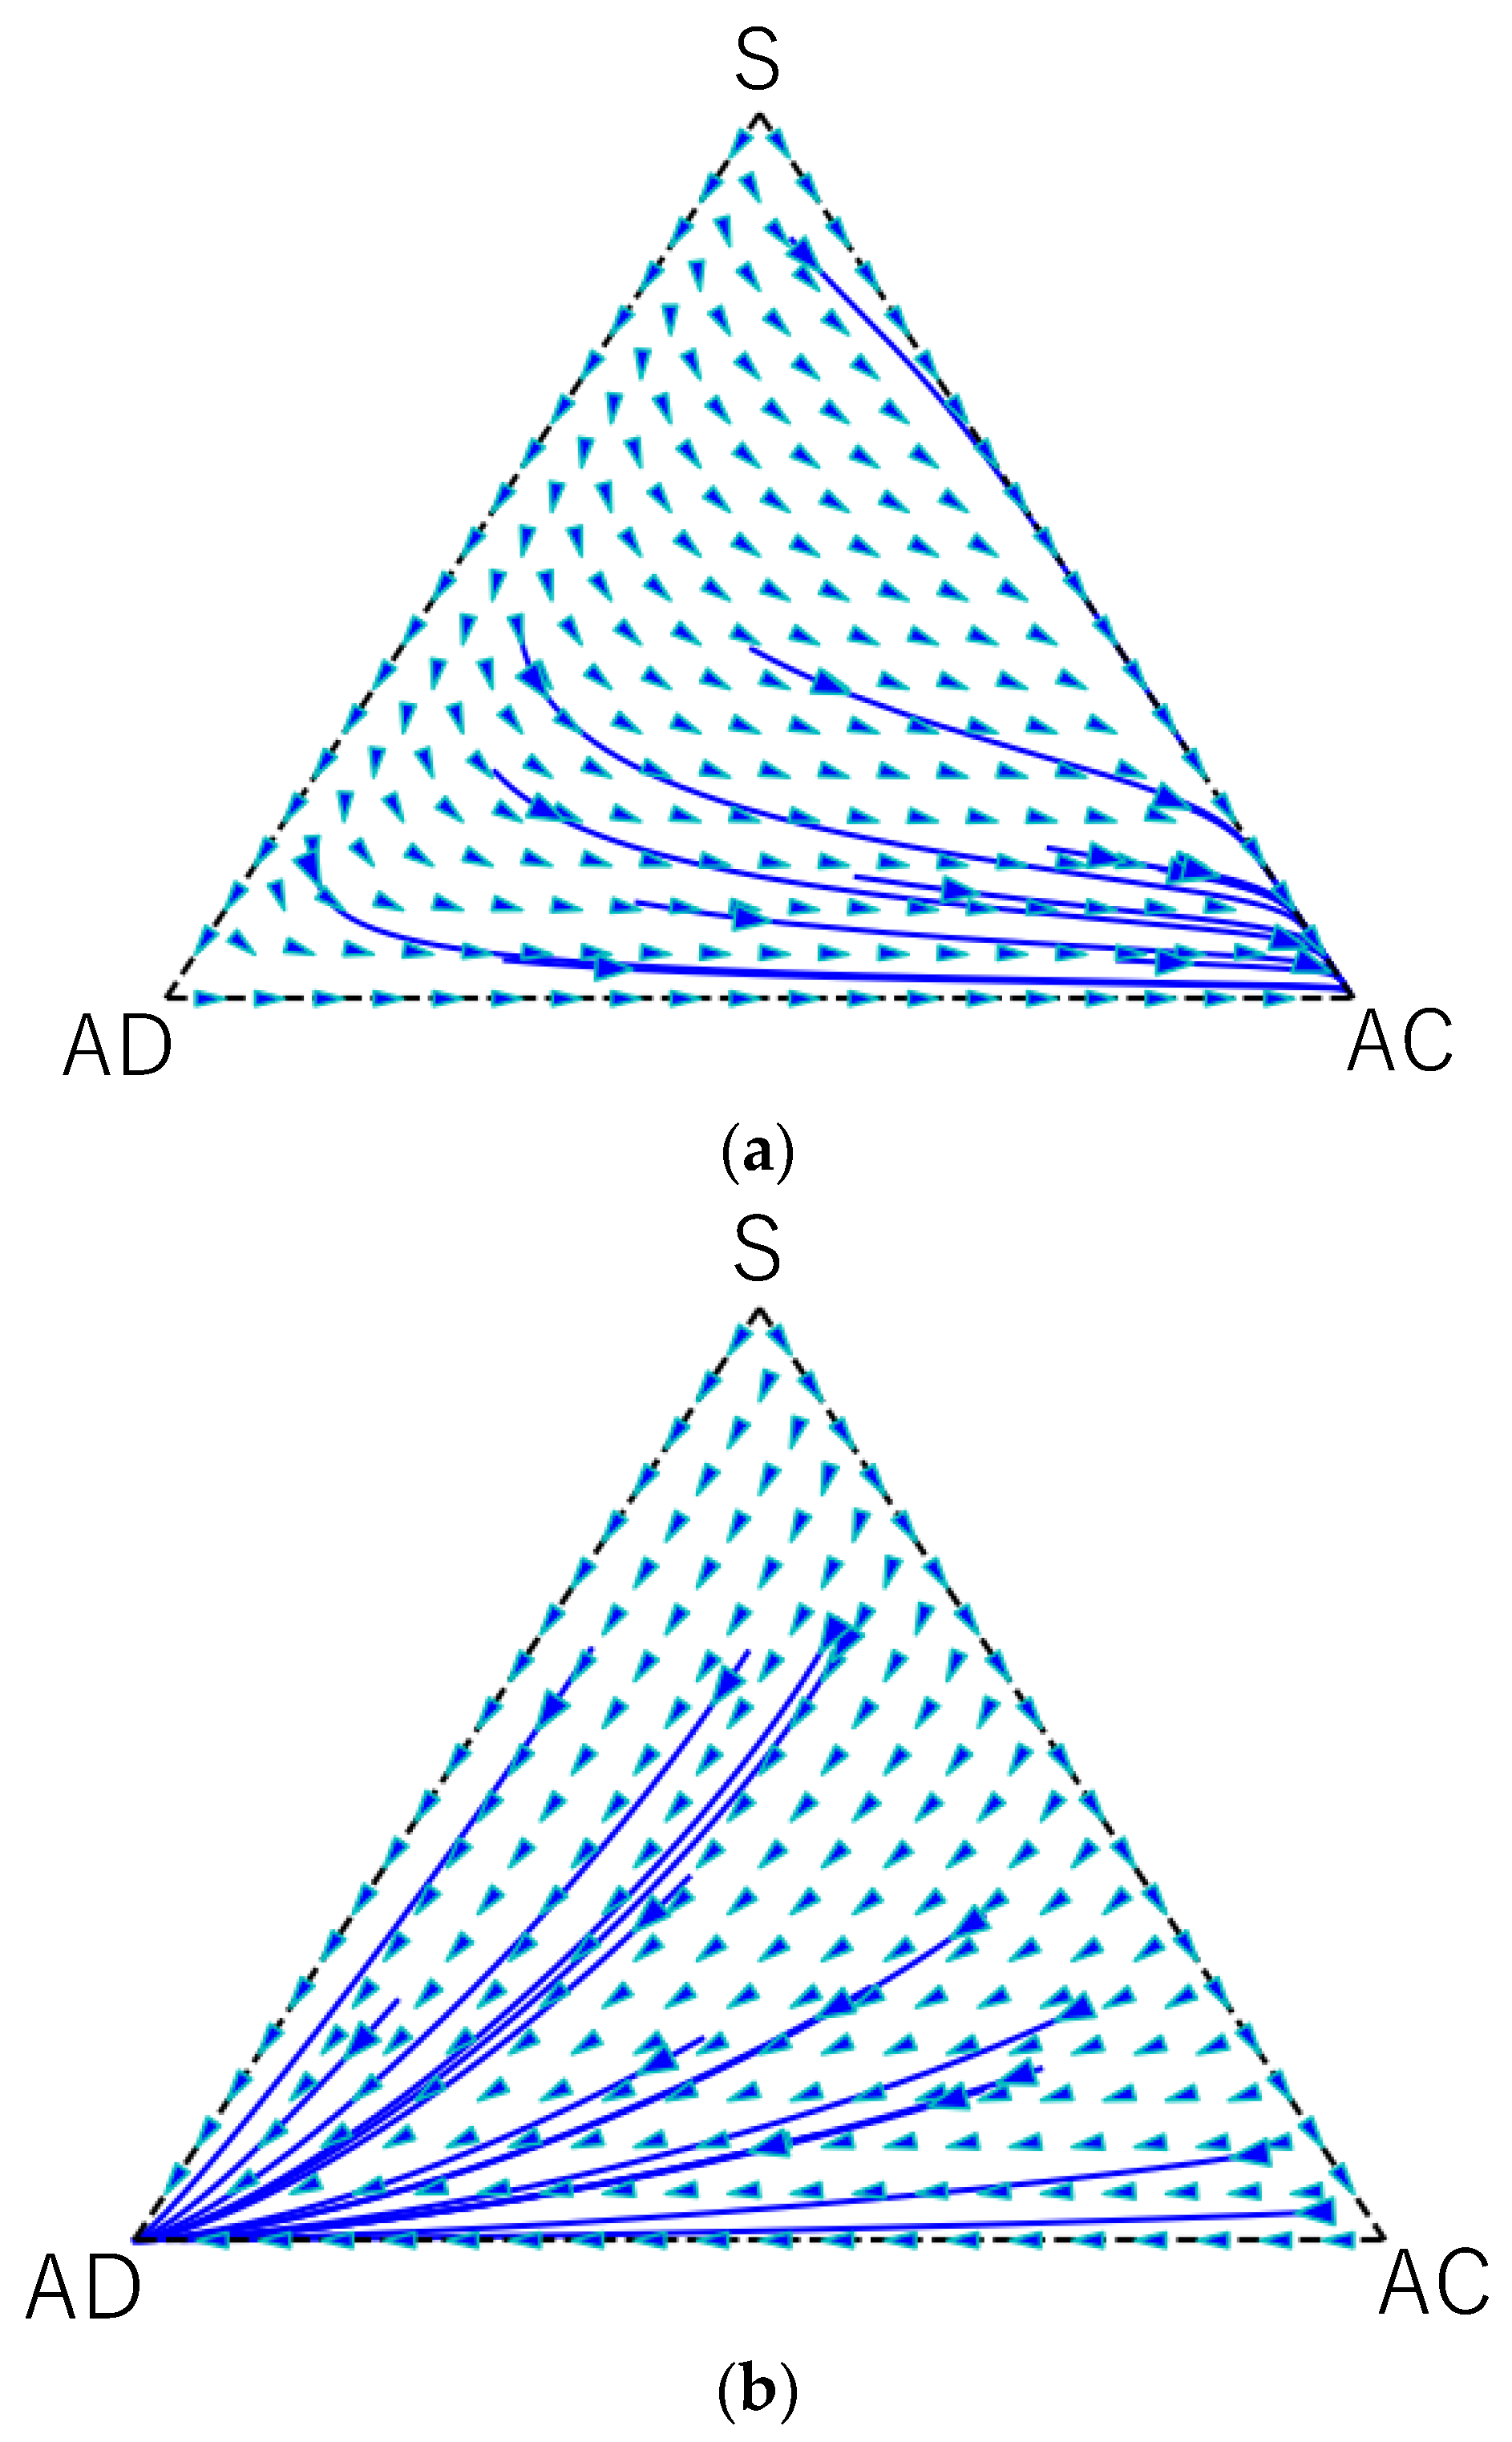
Figure 2a–c illustrate the trajectories and vector fields when prospect theory is applied, using the same parameter values as in Figure 1. We highlight the following two observations: (1) Figure 2b demonstrates that, even with parameter values for which AD is the unique evolutionarily stable strategy under EUT, cooperation evolves when players adhere to PT; that is, AC is the ESS. (2) In Figure 2c, a new stable fixed point, called T, emerges on the edge between S and AC. This fixed point represents a mixed state mainly comprising S-players, with AC-players also being present. The system exhibits bi-stability, as some trajectories converge towards the vertex AD, depending on their initial conditions.
In the case of Figure 1 and Figure 2c in particular, the AD strategy has several advantages. First, the condition indicates that the punishment is not severe enough to offset the benefits gained from free-riding. In addition, with being relatively small, choosing the D strategy entails an 80% chance of avoiding punishment. As such, AD players face a low probability (0.2) of being penalized despite consistently choosing D. Moreover, AD players receive an additional payoff from , as they incur no costs to support the institution.
It should be noted that, if all players were to adopt strategy S, cooperation would fail to materialize. This is due to the spread of action D across the population as a result of implementation errors. Consequently, at vertex S, the rate of cooperation is zero. This phenomenon can be understood by examining the equation for the variable , as discussed earlier. Importantly, represents the cooperation rate of the entire population, which equals zero when (i.e., in the absence of AC-players).
Plotting the value of (the ”cooperation rate”) as a function of on the edge between S and AC reveals that increases sharply with even small increments in (see Figure 3). Since and are related by along this edge, effectively becomes a function of a single variable. At the stable fixed-point T, where is approximately 0.1, the value of is around 0.6, indicating that more than half of the population engages in helping others.
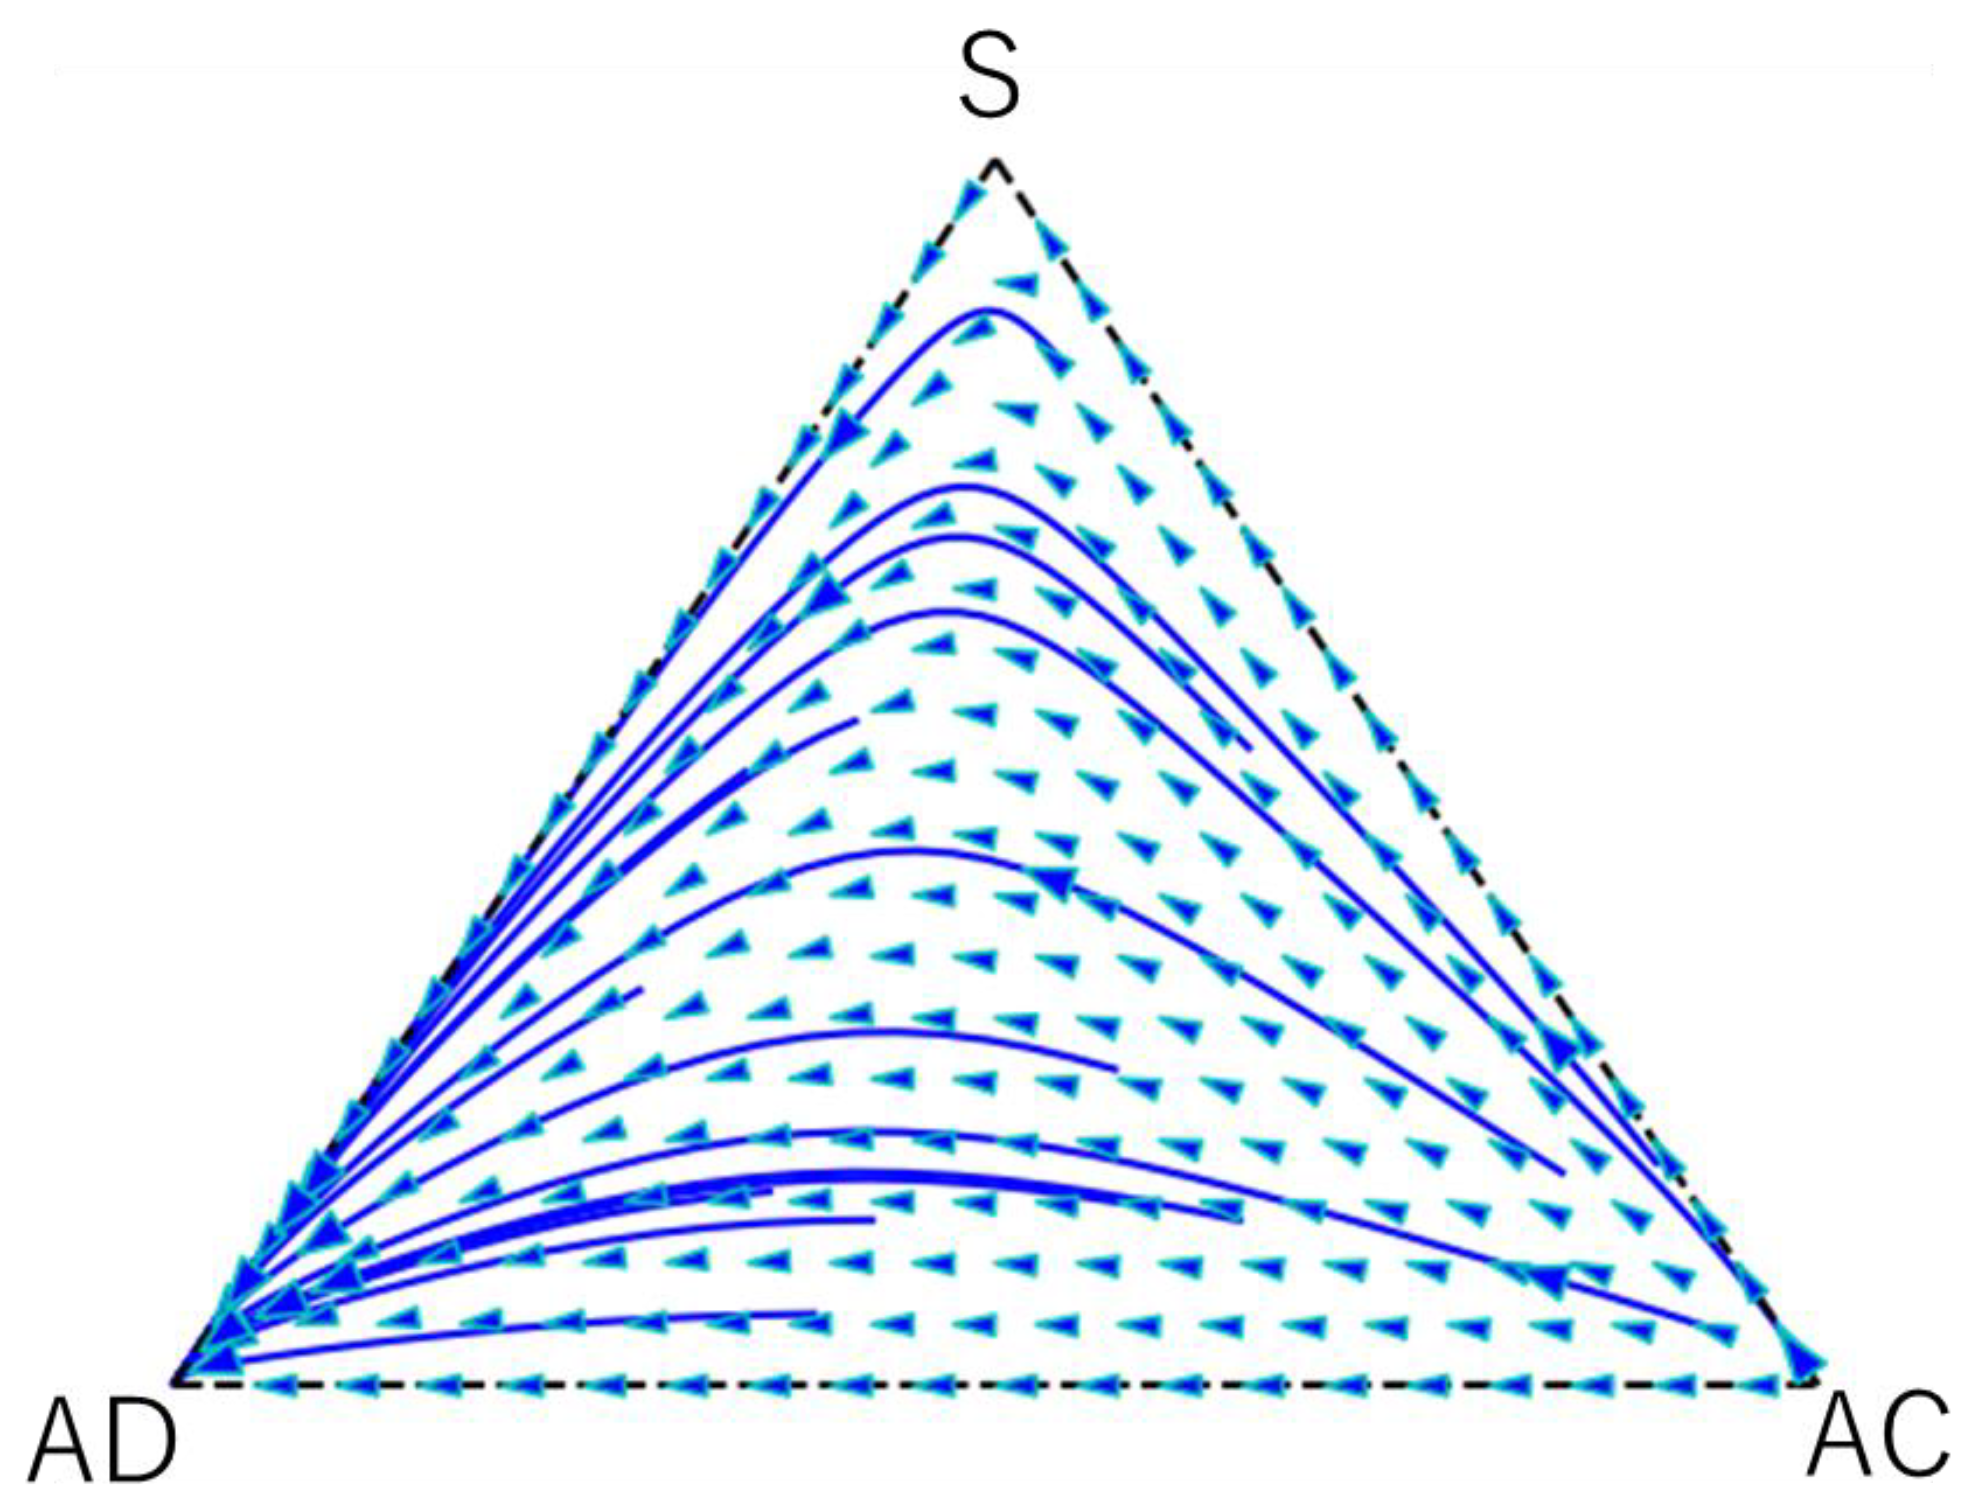
Figure 4 demonstrates that, when the punishment strength becomes smaller ( is chosen for this figure), all trajectories converge to the vertex AD. In this case, qualitative differences between EUT and PT are eliminated.
5. Conclusions
We have seen that there is a set of parameter values with which prospect theory leads to the evolution of pay-it-forward behaviors and with which linear expected utility theory does not. Ironically, punishment is more effective when people are irrational. One reason why even minimal punishment can be highly effective lies in the fact that players disproportionately fear the small possibility of punishment, perceiving it as more likely to occur than it actually does. Cognitive distortions described by PT significantly contribute to mitigating the risk of catastrophic population collapse due to free-riding.
As mentioned in the Introduction, in [11] it was demonstrated that combining prospect theory with punishment enables it to evolve and sustain the unconditional strategy AC, thus preventing free-riders from infiltrating a population of cooperators. In this paper, we applied a similar logic to pay-it-forward and have shown that prospect theory, coupled with slight punishment, facilitates the evolution of pay-it-forward. Given that the fixed-point T is located near vertex S, we can assert that the pay-it-forward strategy is ”risk-dominant” over the unconditional strategy AC, making it more advantageous than unconditional altruistic behaviors.
We noted that the probability of an S-player helping another player X does not rely on X’s strategy, indicating that S-players do not discriminate among other players. However, an S-player’s decision to help another is contingent upon whether the S-player received help in the previous game. Thus, while pay-it-forwarders do not discriminate, their actions are conditional. Taking these facts into account, we suggest that strategy S serves as an intermediate strategy between unconditional altruistic strategies, such as AC, and conditional cooperative strategies like “stern-judging”, “simple-standing”, or “image-scoring” in downstream indirect reciprocity.
Indeed, the bi-stable structure depicted in Figure 2c resembles the structure commonly observed in studies on downstream indirect reciprocity, where it has been found that, if players adopt strategies that consider so called “second-order information”, such as stern-judging or simple-standing in downstream reciprocity, the system exhibits bi-stability. Conversely, we have demonstrated that, when players adhere to prospect theory, upstream reciprocity exhibits a similar structure.
Image-scoring, a strategy in downstream reciprocity that relies solely on first-order information, is insufficient for the evolution of cooperation within the framework of EUT. Consequently, image-scoring fails to sustain stable cooperation in traditional settings [6], even though experimental evidence suggests that real humans only consider first-order information. Investigations into how the cognitive distortions described by prospect theory influence the stability of conditional strategies that use only first-order information in downstream indirect reciprocity present an intriguing research avenue.
Author Contributions
Conceptualization, S.U. and H.Y.; methodology, S.U.; formal analysis, S.U.; writing—original draft preparation, S.U.; writing—review and editing, S.U, T.S., H.Y. and I.O. All authors have read and agreed to the published version of the manuscript.
Funding
This work was supported by JSPS KAKENHI, Grant Numbers JP23K05943(TS), JP23K21017 (IO, HY), JP21KK0027(IO, HY), and JP23K25160(HY, IO).
Data Availability Statement
The authors confirm that the article has no data.
Conflicts of Interest
The authors declare no conflicts of interest. The founding sponsors had no role in the design of the study; in the collection, analyses, or interpretation of data; in the writing of the manuscript; and in the decision to publish the results.
Appendix A
The frequency changes over time . It is important to note that we use a distinct symbol, , for the time during which changes, as opposed to the symbol , which is usually used to describe changes in . The proportion of players participating in a game within the short time interval is proportional to , denoted as , with being some positive constant. The probability that these players receive help in a game is given by . The first term represents the probability of encountering AC-players who do not make an implementation error, while the second term pertains to encounters with S-players who were previously given help and, consequently, will offer support, assuming they do not make an implementation error. As a result, the frequency of players who have received help at time is given by
Taking the limit as , we derive the following time evolution equation for :
the equilibrium point of which is . This equilibrium is stable since the derivative of with respect to (i.e., ) is positive if and negative if .
Appendix B
We briefly outline the essence of prospect theory utilized in this paper, focusing on the value function and the weighting function [12,13,14]. It is important to note that the following description closely mirrors Section 2.2.2 of reference [11].
As mentioned in the main text, each element of the probability distribution gives the probability that the outcome occurs in a game. In the framework of PT, players calculate this probability distribution subjectively. The subjective probability distribution is given by applying a nonlinear function, called a weighting function, to the original probability
with
where is an objectively given probability.
We set the value of parameter to 0.65, which is an often-used value in prospect theory. The shape of the function with this parameter value is shown in the left panel of Figure A1 (solid curve) and, together in the case with , drawn as a dashed line, which corresponds to objectively given probabilities. According to this function, small objective probabilities are estimated to be greater than they are because for small .
The value function has the form
where represents an objectively given payoff. We choose the values of the two parameters and to be 0.88 and 2.25, respectively according to the literature on prospect theory. The right panel in Figure A1 shows the value function with these parameter values (solid curve) together with the linear function (drawn by the dashed line). Parameter implies that the value function is concave. A person obeying this function is called risk-averse. Parameter means that a person following this function is more sensitive to a loss than a gain (“loss-averse”).
Figure A1.
(Left panel) Weighting function (solid curve) with parameter . Horizontal axis represents objectively given probabilities , and vertical axis is subjective probability denoted by . Linear function with corresponding to linear expected utility theory is also displayed (dashed line). (Right panel) Value function (solid curve) with parameters . Argument of the function represents objectively given outcomes and function outputs subjective values. Linear function with is also shown (dashed line).

References
- Fowler, J.H.; Christakis, N.A. Cooperative behavior cascades in human social networks. Proc. Natl. Acad. Sci. USA 2010, 107, 5334–5338. [Google Scholar] [CrossRef]
- Pressman, S.D.; Kraft, T.L.; Cross, M.P. It’s good to do good and receive good: The impact of a “pay it forward” style kindness intervention on giver and receiver well-being. J. Posit. Psychol. 2015, 10, 293–302. [Google Scholar] [CrossRef]
- Nowak, M.A.; Roch, S. Upstream reciprocity and the evolution of gratitude. Proc. R. Soc. B 2007, 274, 605–610. [Google Scholar] [CrossRef]
- Ostrom, E. Governing the Commons: The Evolution of Institutions for Collective Action; Cambridge University Press: Cambridge, UK, 1990. [Google Scholar]
- Nowak, M.A. Evolutionary Dynamics; Harvard University Press: Cambridge, MA, USA, 2006. [Google Scholar]
- Sigmund, K. The Calculus of Selfishness; Princeton University Press: Princeton, UK; Oxford, UK, 2010. [Google Scholar]
- Nowak, M.A.; Highfield, R. Super Cooperators; Free Press: New York, NY, USA, 2011. [Google Scholar]
- Bowls, S.; Gintis, H. A Cooperative Species; Princeton University Press: Princeton, UK; Oxford, UK, 2011. [Google Scholar]
- Yamagishi, T. Trust: The Evolutionary Game of Mind and Society; Springer: New York, NY, USA, 2011. [Google Scholar]
- Perc, M.; Jordan, J.J.; Rand, D.G.; Wang, Z.; Boccaletti, S.; Szolnoki, A. Statistical physics of human cooperation. Phys. Rep. 2017, 68, 1–51. [Google Scholar] [CrossRef]
- Uchida, S.; Yamamoto, H.; Okada, I.; Sasaki, T. Evolution of Cooperation with Peer Punishment under Prospect Theory. Games 2019, 10, 11. [Google Scholar] [CrossRef]
- Kahneman, D.; Tversky, A. Prospect theory: Analysis of decision under risk. Econometrica 1979, 47, 263–291. [Google Scholar] [CrossRef]
- Tversky, A.; Kahneman, D. Loss aversion in riskless choice: A reference-dependent model. Q. J. Econ. 1991, 106, 1039–1061. [Google Scholar] [CrossRef]
- Wakker, P.P. Prospect Theory: For Risk and Ambiguity; Cambridge University Press: Cambridge, UK, 2010. [Google Scholar]
- Gilboa, I. Theory of Decision under Uncertainty; Cambridge University Press: Cambridge, UK, 2009. [Google Scholar]
- Gilboa, I. Making Better Decisions: Decision Theory in Practice; John Wiley and Sons: Tokyo, Japan, 2010. [Google Scholar]
- Tversky, A.; Kahneman, D. Judgement under uncertainty: Heuristics and biases. Science 1974, 185, 1124–1131. [Google Scholar] [CrossRef]
- Machina, M.J. Expected utility analysis without the independence axiom. Econometrica 1982, 50, 277–323. [Google Scholar] [CrossRef]
- Tversky, A.; Kahneman, D. Extensional vs. intuitive reasoning: The conjunction fallacy in probability judging. Psychol. Rev. 1983, 90, 293–315. [Google Scholar] [CrossRef]
- Schmeidler, D. Subjective probability and expected utility without additivity. Econometrica 1989, 57, 571–587. [Google Scholar] [CrossRef]
- Gilboa, I.; Schmeidler, D. Maxmin expected utility with a non-unique prior. J. Math. Econ. 1989, 18, 141–153. [Google Scholar] [CrossRef]
- Starmer, C. Developments in non-expected utility theory: The hunt for a descriptive theory of choice under risk. J. Econ. Lit. 2000, 38, 332–382. [Google Scholar] [CrossRef]
- Yang, G.; Chen, J. Research on Enterprise Radical Technology Innovation Behavior—Evolutionary Game Analysis Based on Prospect Theory. J. Ind. Technol. Econ. 2020, 39, 57–64. [Google Scholar]
- Sun, H.; Gao, G.; Li, Z. Evolutionary Game Analysis of Enterprise Carbon Emission Regulation Based on Prospect Theory. Soft Comput. 2022, 26, 13357–13368. [Google Scholar] [CrossRef]
- Shen, J.; Gao, X.; He, W.; Sun, F.; Zhang, Z.; Kong, Y.; Wan, Z.; Zhang, X.; Li, Z.; Wang, J.; et al. Prospect Theory in an Evolutionary Game: Construction of Watershed Ecological Compensation System in Taihu Lake Basin. J. Clean. Prod. 2021, 291, 125929. [Google Scholar] [CrossRef]
- Li, Y.; Zhang, J. Evolutionary Game Analysis of Low-Carbon Incentive Behaviour of Power Battery Recycling Based on Prospect Theory. Sustainability 2024, 16, 2793. [Google Scholar] [CrossRef]
- Sigmund, K. Games of Life; Dover Publications: Mineora, NY, USA, 2017. [Google Scholar]
- Ferreira, P.L.; Santos, F.C.; Pequito, S. Risk sensitivity and theory of mind in human coordination. PLoS Comput. Biol. 2021, 17, e1009167. [Google Scholar] [CrossRef]
- Nowak, M.A. Five rules for the evolution of cooperation. Science 2006, 314, 1560–1563. [Google Scholar] [CrossRef]
- Nowak, M.A.; Sigmund, K. Evolution of indirect reciprocity. Nature 2005, 437, 1292–1298. [Google Scholar] [CrossRef]
- Nowak, M.A.; Sigmund, K. The dynamics of indirect reciprocity. J. Theor. Biol. 1998, 194, 561–574. [Google Scholar] [CrossRef]
- Leimar, O.; Hammerstein, P. Evolution of cooperation through indirect reciprocity. Proc. R. Soc. B 2001, 268, 745–753. [Google Scholar] [CrossRef]
- Ohtsuki, H.; Iwasa, Y. How should we define goodness?—Reputation dynamics in indirect reciprocity. J. Theor. Biol. 2004, 231, 107–120. [Google Scholar] [CrossRef]
- Ohtsuki, H.; Iwasa, Y. The leading eight: Social norms that can maintain cooperation by indirect reciprocity. J. Theor. Biol. 2006, 239, 435–444. [Google Scholar] [CrossRef]
- Sasaki, T.; Okada, I.; Nakai, Y. The evolution of conditional moral assessment in indirect reciprocity. Sci. Rep. 2017, 7, 41870. [Google Scholar] [CrossRef]
- Uchida, S.; Yamamoto, H.; Okada, I.; Sasaki, T. A theoretical approach to norm ecosystems: Two adaptive architectures of indirect reciprocity show different paths to the evolution of cooperation. Front. Phys. 2018, 6, 14. [Google Scholar] [CrossRef]
- Yamamoto, H.; Okada, I.; Uchida, S.; Sasaki, T. Exploring norms indispensable for both emergence and maintenance of cooperation in indirect reciprocity. Front. Phys. 2022, 10, 1019422. [Google Scholar] [CrossRef]
- Fujimoto, Y.; Ohtsuki, H. Evolutionary stability of cooperation in indirect reciprocity under noisy and private assessment. Proc. Natl. Acad. Sci. USA 2023, 120, e2300544120. [Google Scholar] [CrossRef]
- Iwagami, A.; Masuda, N. Upstream reciprocity in heterogeneous networks. J. Theor. Biol. 2010, 265, 297–305. [Google Scholar] [CrossRef] [PubMed]
- Pfeiffer, T.; Rutte, C.; Killingback, T.; Taborsky, M.; Bonhoeffer, S. Evolution of cooperation by generalized reciprocity. Proc. R. Soc. B 2005, 272, 1115–1120. [Google Scholar] [CrossRef] [PubMed]
- Okada, I. A review of theoretical studies on indirect reciprocity. Games 2020, 11, 27. [Google Scholar] [CrossRef]
- Ohtsuki, H.; Iwasa, Y. Global analyses of evolutionary dynamics and exhaustive search for social norms that maintain cooperation by reputation. J. Theor. Biol. 2007, 244, 518–531. [Google Scholar] [CrossRef]
- Uchida, S.; Sigmund, K. The competition of assessment rules for indirect reciprocity. J. Theor. Biol. 2010, 263, 13–19. [Google Scholar] [CrossRef]
- Murase, Y.; Kim, M.; Baek, S.K. Social norms in indirect reciprocity with ternary reputations. Sci. Rep. 2022, 12, 455. [Google Scholar] [CrossRef]
- Yamagishi, T. The provision of a sanctioning system as a public good. J. Personal. Soc. Psychol. 1986, 51, 110–116. [Google Scholar] [CrossRef]
- Boyd, R.; Richerson, P.J. Punishment allows the evolution of cooperation (or anything else) in sizable groups. Ethol. Sociobiol. 1992, 13, 171–195. [Google Scholar] [CrossRef]
- Milinski, M.; Rockenbach, B. Human behaviour: Punisher pays. Nature 2008, 452, 297–298. [Google Scholar] [CrossRef]
- Casari, M.; Luini, L. Cooperation under alternative punishment institutions: An experiment. J. Econ. Behav. Organ. 2009, 71, 273–282. [Google Scholar] [CrossRef]
- Kosfeld, M.; Okada, A.; Riedl, A. Institution formation in public goods games. Am. Econ. Rev. 2009, 99, 1335–1355. [Google Scholar] [CrossRef]
- Sigmund, K.; de Silva, H.; Traulsen, A.; Hauert, C. Social learning promotes institutions for governing the commons. Nature 2010, 466, 861–863. [Google Scholar] [CrossRef]
- Traulsen, A.; Röhl, T.; Milinski, M. An economic experiment reveals that humans prefer pool punishment to maintain the commons. Proc. Biol. Sci. 2012, 279, 3716–3721. [Google Scholar] [CrossRef]
Figure 1.
Trajectories and vector fields yielded by replicator dynamics for case of linear expected utility theory, with (a), (b) and (c). Initial conditions are random. State space is simplex defined by , which is represented as an equilateral triangle. Arrows in trajectories show in which direction state evolves. Other parameters: .
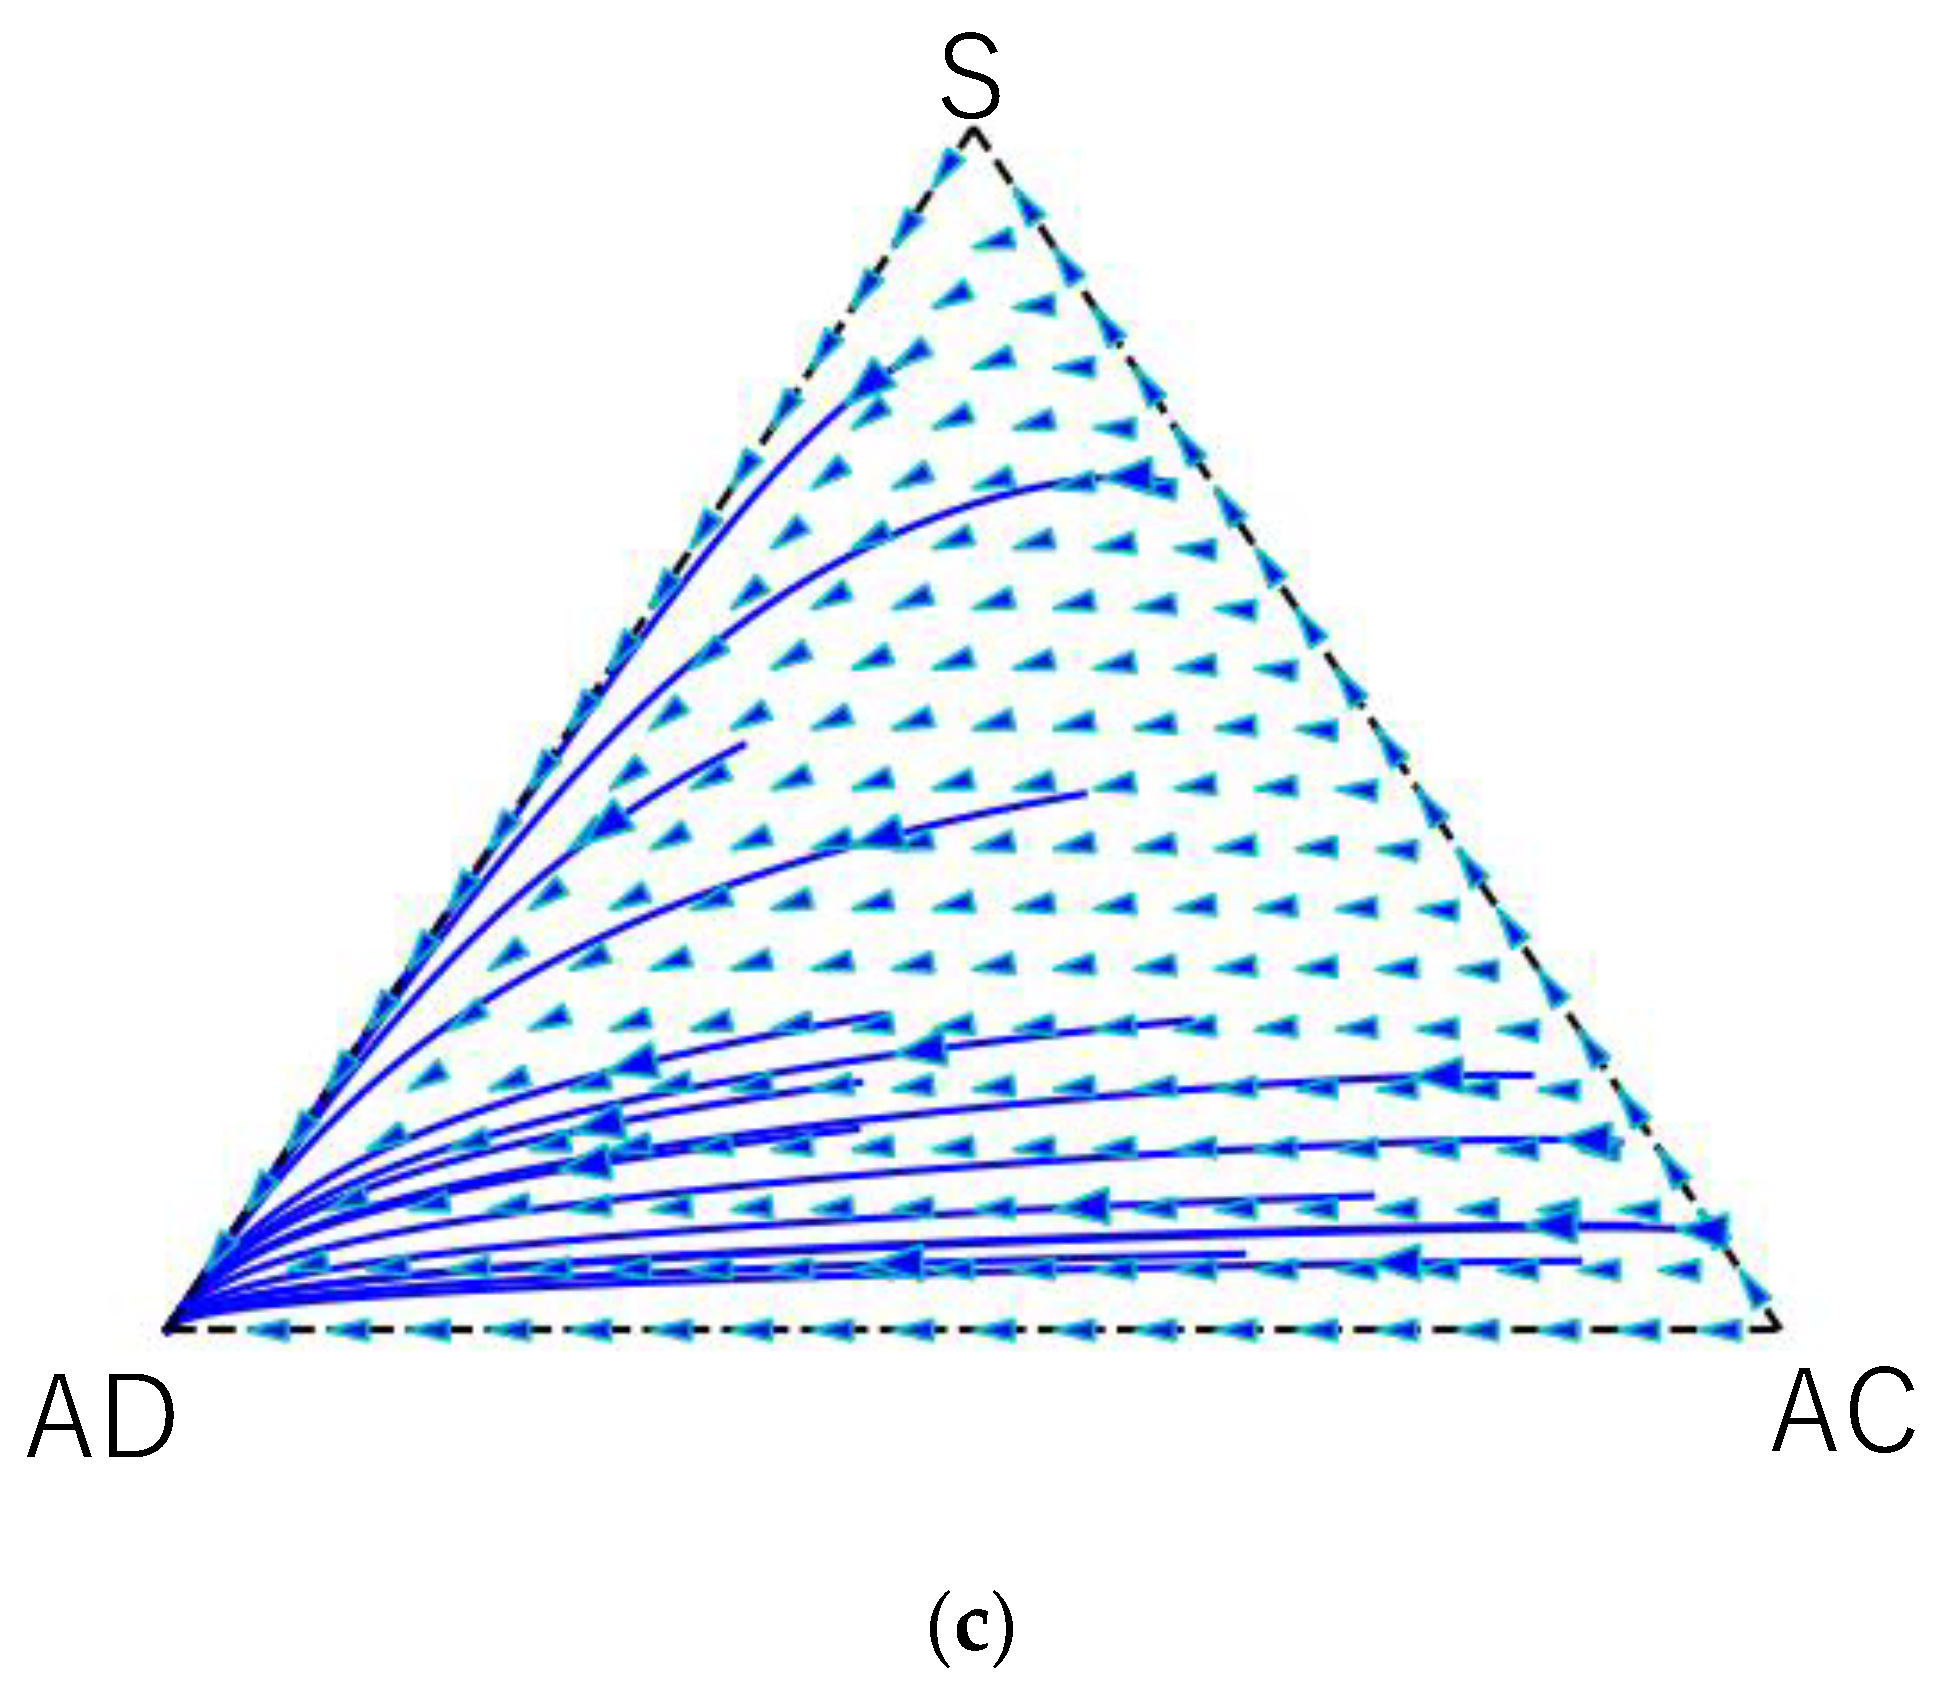
Figure 2.
Trajectories and vector fields yielded by replicator dynamics for the case of prospect theory, with (a), (b) and (c). Parameter values are the same as in Figure 1.
Figure 2.
Trajectories and vector fields yielded by replicator dynamics for the case of prospect theory, with (a), (b) and (c). Parameter values are the same as in Figure 1.
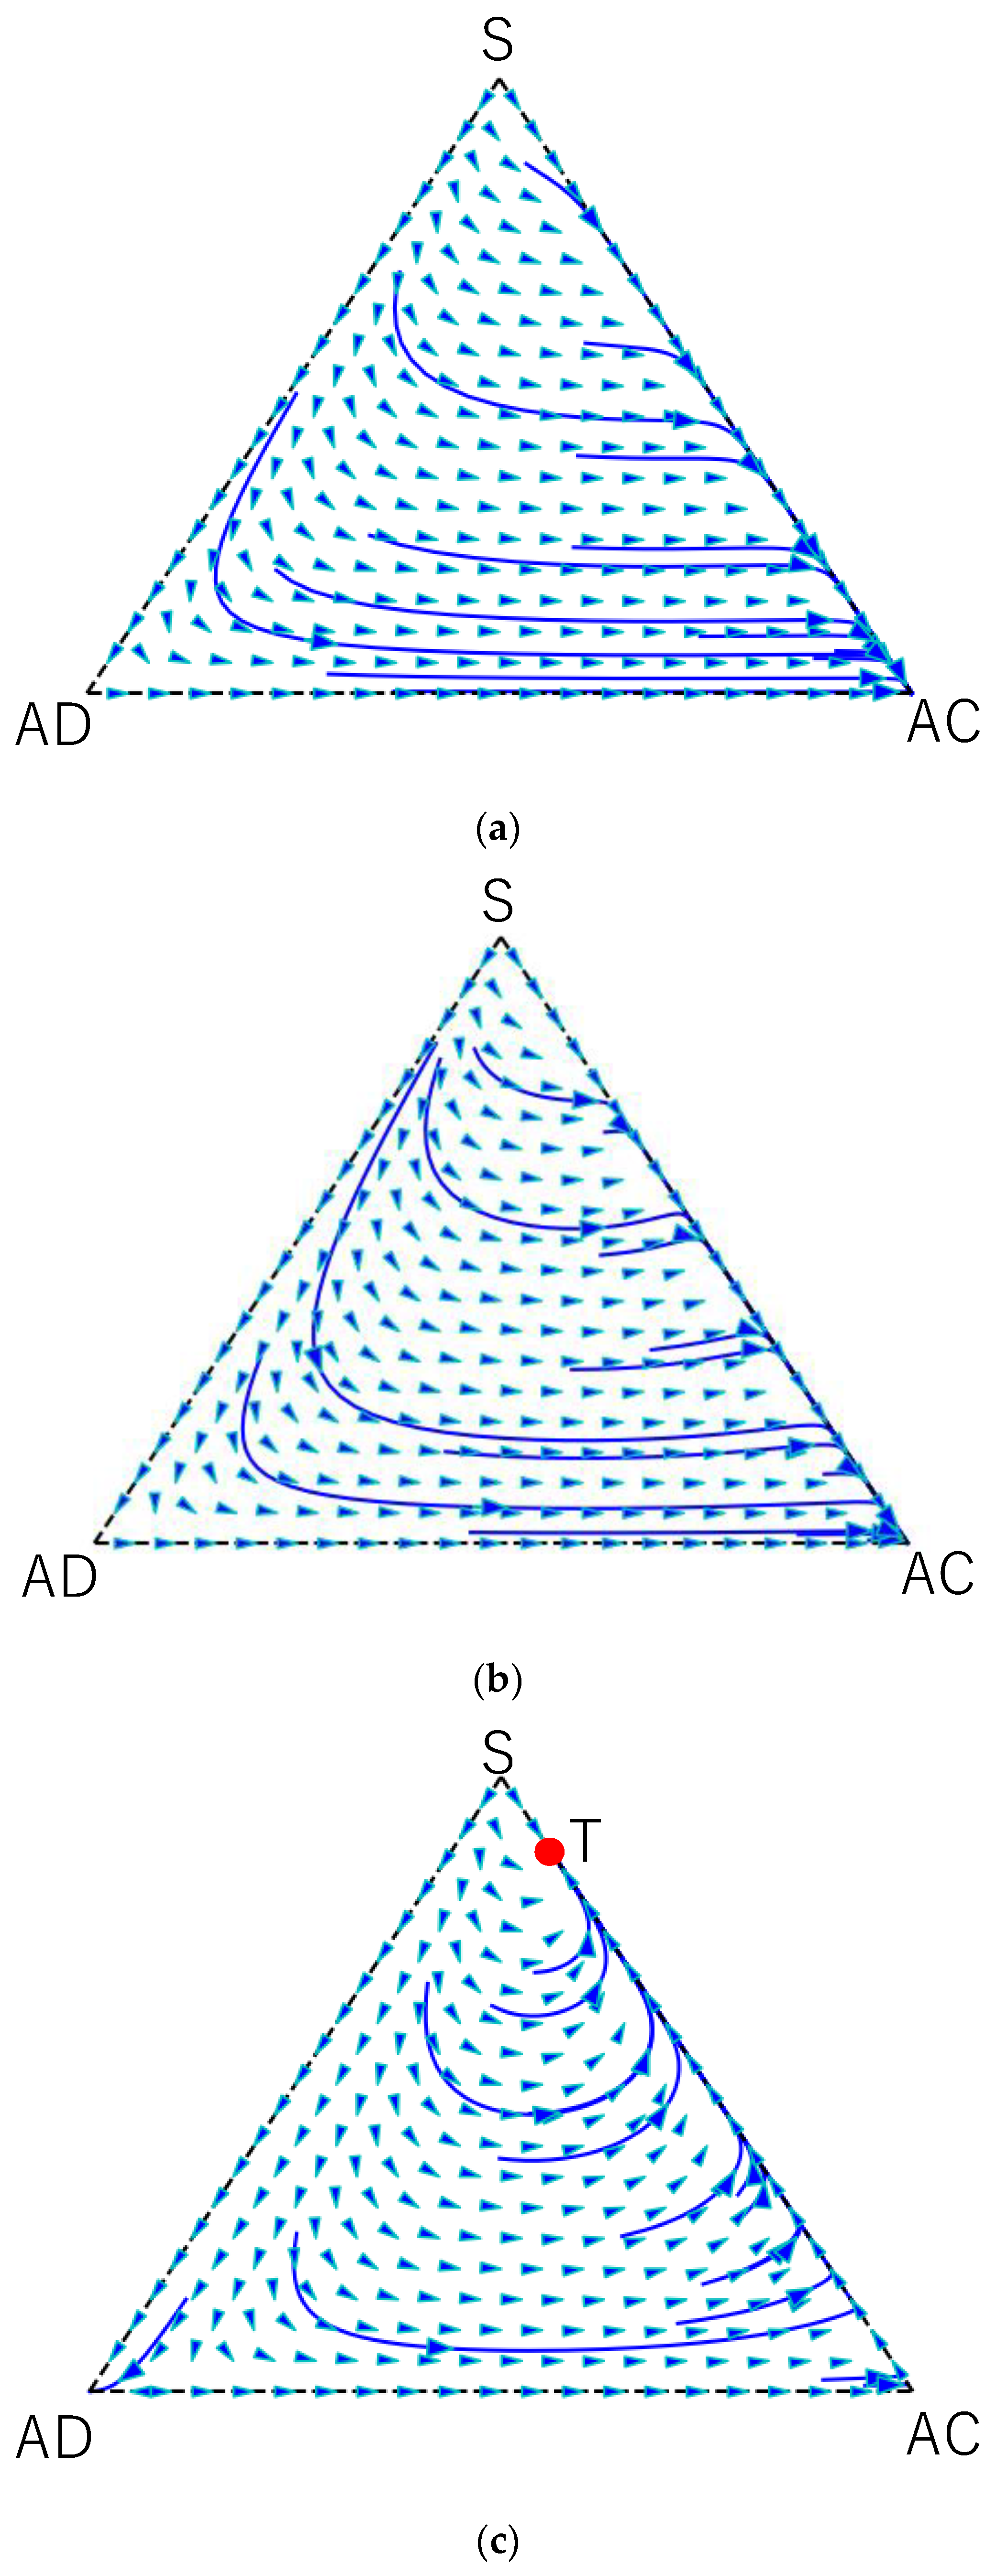
Figure 3.
Value of as a function of on edge between S and AC, with the same parameter values used in Figure 2. Note that is equivalent to cooperation rate in population. corresponds to cooperation rate at vertex S, and to vertex AC. Note that and are not independent, as holds. Therefore, is a function with one variable (). We see at . However, the value of sharply increases as increases, as far as is small.
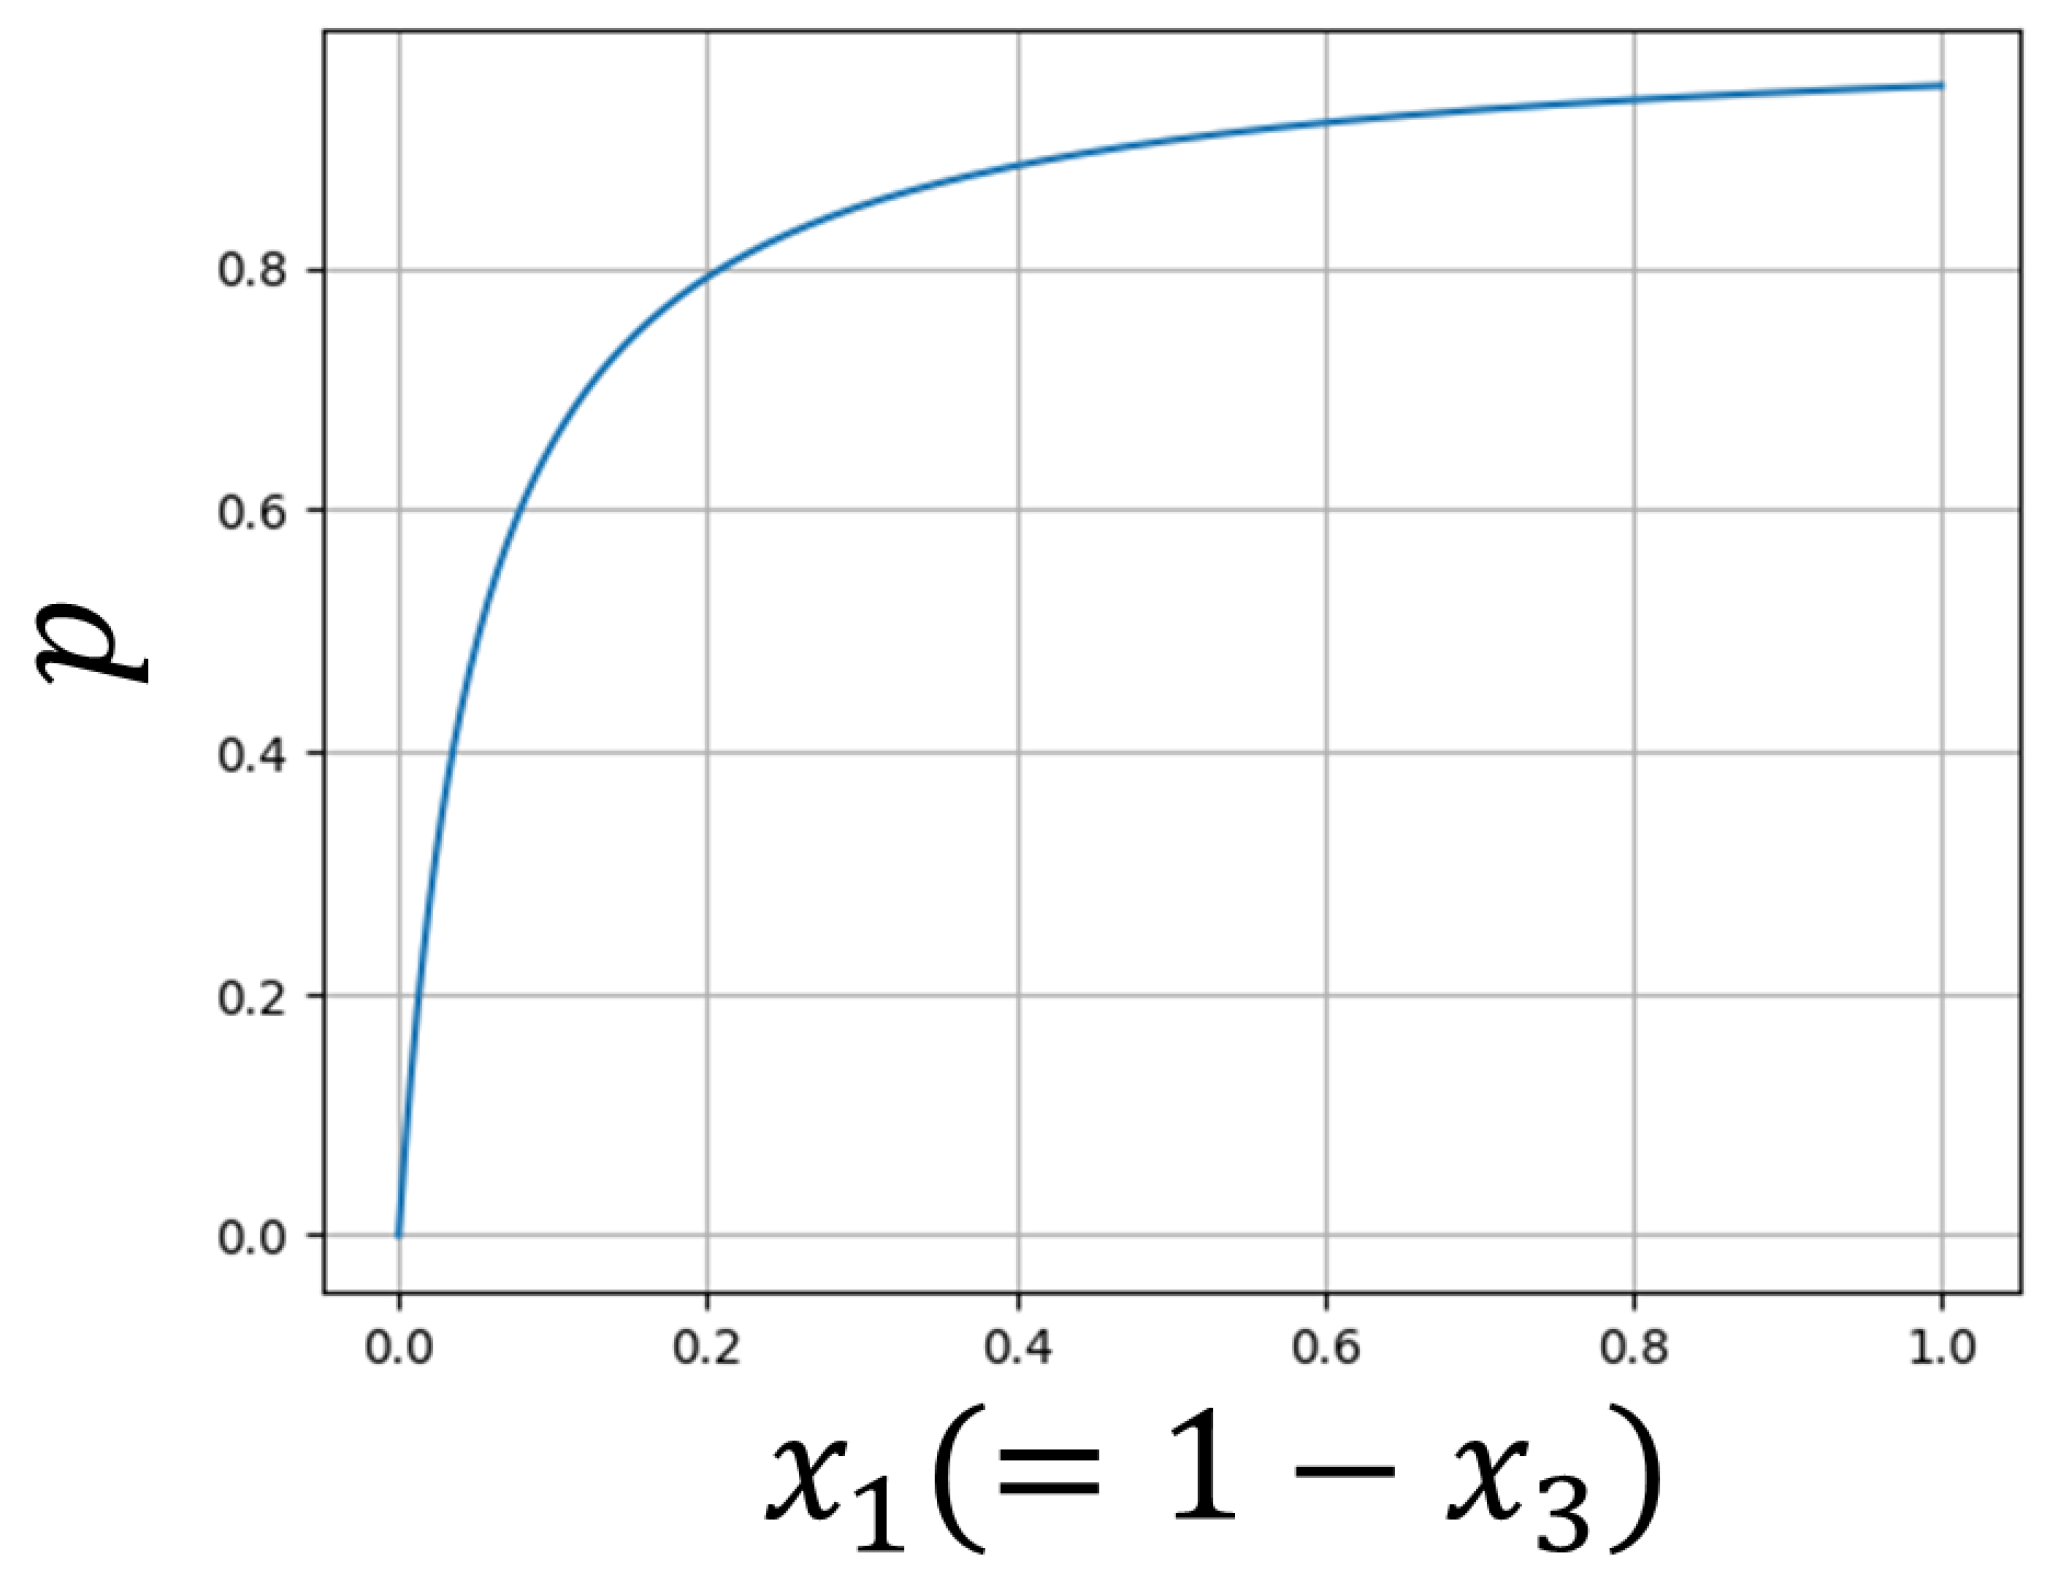
Figure 4.
Trajectories and vector field yielded by replicator dynamics in the case of prospect theory with s = 3. Other parameter values are the same as in Figure 1 and Figure 2.

Table 1.
Payoffs player A obtains in donation game.
| Player B’s Option Player A’s Option | Cooperate (C) | Defect (D) |
|---|---|---|
| Cooperate (C) | b − c | −c |
| Defect (D) | b | 0 |
Table 2.
Payoff matrix (payoffs Player A obtains in total).
| Outcome Player A’s Option | Cooperate Not-Punish (CN) | Cooperate Punish (CP) | Defect Not-Punish (DN) | Defect Punish (DP) |
|---|---|---|---|---|
| Cooperate (C) | 0 | 0 | ||
| Defect (D) | 0 |
Table 3.
Probability distributions for strategy 1 (a), strategy 2 (b), and strategy 3 (c).
| (a) | ||||
| Outcome Player A’s option | Cooperate Not-Punish (CN) | Cooperate Punish (CP) | Defect Not-Punish (DN) | Defect Punish (DP) |
| Cooperate (C) | ||||
| Defect (D) | ||||
| (b) | ||||
| Outcome Player A’s option | Cooperate Not-Punish (CN) | Cooperate Punish (CP) | Defect Not-Punish (DN) | Defect Punish (DP) |
| Cooperate (C) | 0 | 0 | 0 | 0 |
| Defect (D) | ||||
| (c) | ||||
| Outcome Player A’s option | Cooperate Not-Punish (CN) | Cooperate Punish (CP) | Defect Not-Punish (DN) | Defect Punish (DP) |
| Cooperate (C) | ||||
| Defect (D) | ||||
Disclaimer/Publisher’s Note: The statements, opinions and data contained in all publications are solely those of the individual author(s) and contributor(s) and not of MDPI and/or the editor(s). MDPI and/or the editor(s) disclaim responsibility for any injury to people or property resulting from any ideas, methods, instructions or products referred to in the content. |
© 2024 by the authors. Licensee MDPI, Basel, Switzerland. This article is an open access article distributed under the terms and conditions of the Creative Commons Attribution (CC BY) license (https://creativecommons.org/licenses/by/4.0/).
Share and Cite
MDPI and ACS Style
Uchida, S.; Sasaki, T.; Yamamoto, H.; Okada, I. Evolution of “Pay-It-Forward” in the Presence of the Temptation to Free-Ride. Games 2024, 15, 16. https://doi.org/10.3390/g15030016
AMA Style
Uchida S, Sasaki T, Yamamoto H, Okada I. Evolution of “Pay-It-Forward” in the Presence of the Temptation to Free-Ride. Games. 2024; 15(3):16. https://doi.org/10.3390/g15030016
Chicago/Turabian StyleUchida, Satoshi, Tatsuya Sasaki, Hitoshi Yamamoto, and Isamu Okada. 2024. "Evolution of “Pay-It-Forward” in the Presence of the Temptation to Free-Ride" Games 15, no. 3: 16. https://doi.org/10.3390/g15030016
Note that from the first issue of 2016, this journal uses article numbers instead of page numbers. See further details here.