The Effects of Social Exclusion and Group Heterogeneity on the Provision of Public Goods


1
School of Economics, University of Cape Town, Rondebosch 7701, South Africa
2
Centre for Research on Peace and Development (CRPD), KU Leuven, 3000 Leuven, Belgium
3
Director, Research Unit in Behavioural Economics and Neuroeconomics (RUBEN), University of Cape Town, Rondebosch 7701, South Africa
4
Director, Centre for Research on Peace and Development (CRPD), KU Leuven, 3000 Leuven, Belgium
5
Alexander von Humboldt Fellow, University of Heidelberg, 69117 Heidelberg, Germany
*
Author to whom correspondence should be addressed.
Games 2018, 9(3), 55; https://doi.org/10.3390/g9030055
Submission received: 25 May 2018
/
Revised: 19 July 2018
/
Accepted: 23 July 2018
/
Published: 1 August 2018
(This article belongs to the Special Issue Public Good Games)
Abstract
:The multi-dimensional nature of social exclusion requires several perspectives in understanding its causes and consequences. Focus on the topic is largely centred around questions of material deprivation. However, as poverty and inequality are inextricably linked to questions of access and inclusion, a holistic approach is required. Consequently, we explore how imposed relational asymmetries which manifest as differences in the ability to exercise personal agency and in turn, engender wealth inequalities, affect social cooperation in future interactions. To do this, we generate wealth inequalities through two Prisoner’s Dilemma games, where one party is excluded from participating in the determination of the outcomes of the game. The effects of this asymmetry in social participation on ex post cooperation is examined using a Public Goods game. We find that the presence of prior asymmetric influence in social decision-making subsequently reduces contributions to the public good, independent of endowment level. This reduction in social welfare is driven by the under-contribution from players who were excluded in prior social interactions. Simply put, the data shows that a history of social exclusion reduces subsequent public goods provision, independent of material inequality.
1. Introduction
The ability to exercise personal agency in one’s choices is a key aspect of the capabilities approach to understanding poverty and inequality, where agency refers to a person’s role as a member of society, with the ability to participate in economic, social, and political actions [1]. The ability to exercise personal agency, or lack thereof, may significantly affect the realised material outcomes of individuals. In turn, these inequalities in wealth that arise due to imposed differences in the ability to exercise personal agency may affect future prospects for cooperative behaviour among citizens, even once personal agency has been restored. Moreover, to the extent that an inability to exercise personal agency results in material inequalities, individuals may come to associate the production of these material inequalities with procedural unfairness. The inability to exercise agency amounts to being socially excluded, a multi-dimensional issue of unequal power relationships and access to social activities [2].
History points to several real world instances where members of particular groups have systematically had their personal agency removed or suppressed in some way that one could study to explore this question (for instance, apartheid South Africa, Nazi Germany, Rwandan genocide). These case study examples are often too varied in their contextual underpinnings, too sporadic in their occurrence, and require significant historical data spanning many years to answer the question we pose. In light of this, our approach is to turn to the lab, and rely on experimental methods to provide us a lens, albeit a rather particular one, to explore this question further. More specifically, we explore the extent to which inequalities in wealth endowments, generated by prior play in one-shot Prisoner’s Dilemma games in which one party’s choice agency was removed, affects the subsequent provision of public goods. In one of the two games, both parties are equally able to exercise their agency in implementing their choice (symmetric game), and in the other, only one individual in a given pairing enjoys such agency (asymmetric game). These two games are used to establish a history of prior interactions which mimic an exclusionary society, where some are unable to exercise their agency, and an inclusive society, where all are able to exercise their agency1. Importantly, the outcomes of these prior interactions generate wealth heterogeneity which set the starting endowments in the public goods game played subsequently.
We are interested in the extent to which unequal endowments, generated through prior play in an inclusive environment, affect subsequent decisions to cooperate in the provision of a public good, compared to inequalities generated through prior play in a setting where some have not been able to exercise their agency. We find that the presence of asymmetric agency in prior interactions reduces subsequent contributions to the public good, independent of endowment level. This reduction in social welfare is driven by the under-contribution of players whose agency was removed during prior play. Simply put, the inability of an individual to exercise agency in implementing their desired choice reduces subsequent public goods provision, independent of material inequality.
1.1. Does Exclusion Reduce Pro-Sociality?
In this paper, we seek to explore the effect that the deliberate removal of an individual’s decision-making agency has on future co-operative interactions. There are two potential channels through which one might imagine this deliberate removal of individual agency might negatively affect future co-operation. One channel relates to the psychological and emotional response to being deliberately excluded from a choice process, triggering a response to perceived procedural unfairness2 [3,4,5,6,7]. The second channel relates to the response to the material inequality that is produced through the process of deliberate exclusion, triggering inequality aversion [8,9,10]. Of course, these effects need not be independent, and may have interwoven effects on an individual’s future behaviour.
Candelo, Croson and Li [11] claim to be the first to study this relationship. In their study, the authors use real-world feelings of exclusion in a laboratory setting to test the effect of exclusion on public goods provision and contributions to local organisations3. The distinction between local organisations and public goods is based on benefits from the provision of the good. Local organisations, in some part, can exclude some members of the society while public goods are by definition enjoyed equally by all. This difference in the distribution of the benefits from the good, the authors argue, should reduce contributions by the excluded to the local organisations but have no impact on contributions to the public good [11]. The results confirm this intuition: Social exclusion reduces contributions to local organisations but does not affect public goods provision [11]. In addition, they argue that socially excluded individuals may have decreased feelings of altruism and empathy which in turn decreases contributions to the local organisation [11].
The argument of decreased feelings of altruism and empathy is based on a large literature in psychology on social exclusion and social behaviour, and the need to belong [12,13]. The literature shows that social exclusion results in negative feelings such as sadness, jealousy and shame, as well as anger and anxiety which result in varied behavioural responses including both increased and decreased pro-sociality [13]. The pro-social response is driven by a need to convince the excluding group that the excluded individual is worthy of inclusion. This attempt at assimilation leads to the adoption of typical group behaviour by the excluded individual and an increased willingness to contribute towards the success of the group [13]. Conversely, exclusion can lead the excluded individual to seek revenge and harm the group which they have been excluded from. Moreover, negative feelings can result in increased aggression towards others and decreased feelings of empathy and willingness to help [14]. Socially excluded individuals have also been shown to respond more aggressively to insults [14].
Another potential channel by which social exclusion may affect pro-sociality is through the reciprocation of deliberate exclusion. In addition to reciprocating actions, individuals also respond to the perceived motives and intentions of others [15,16,17,18,19]. If the intentions behind an outcome or action are perceived as negative, individuals are less willing to accept it. Conversely, when intentions are perceived to be good or positive, individuals perceive the outcome as more permissible and acceptable. Findings show that offers in ultimatum games are rejected significantly more often by the Responder when equal shares of the pie are part of the Proposers choice set [16,17,19]. By rejecting the same offer dependent on the choices facing the Proposer, the Responder is arguably responding to the deliberate deviation from equality by the Proposer in addition to the monetary outcome [16,19].
The broad literature on Ultimatum and Dictator games can also be used to infer the effects of asymmetries in decision-making power. Outcomes in Ultimatum games, as opposed to Dictator games, suggest that when both parties have some agency in an anonymous social exchange, this reduces the extent of payoff inequality, as opposed to the case where the dictator is able to impose a unilateral choice. The rules of the game in the dictator game are structured such that the institution clearly favours one party over another, while the ultimatum game offers a more equal footing to both parties. From this comparison, asymmetries in the ability to exercise agency lead to a more unequal distribution of welfare between parties in Dictator games compared to Ultimatum games [20,21,22]. In binary versions of the Dictator game, limiting the set of realisable distributions for the powerful player to equal and unequal choices produces conflicting results [23,24,25] which may be driven by differences in the extent of inequality associated with making an unequal choice4.
1.2. Does Inequality Affect Public Goods Provision?
Importantly though, the presence of material inequalities can also erode cooperation. Heterogeneity, including material inequalities, may erode the potential for cooperative behaviour across individuals and groups [26,27,28] by altering individual versus common goals due to differences in the relative individual benefit from the public good. Moreover, heterogeneity may increase the transactions costs of exchange, thereby undermining social capital or trust, thus reducing the likelihood of co-operative behaviour in resolving social dilemmas [29,30,31,32,33,34,35,36]). An alternative school of thought, however, posits that heterogeneity will result in higher provision of the public good since heterogeneity is associated with a less well-endowed median voter, who “votes” in favour of public good provision. Moreover, if the benefits of public goods are purely localised, and enjoyed by specific groups alone, be they ethnic groups or defined in terms of income/wealth status, then a common pool model may well imply the over-provision of public goods in the context of ethnic or income diversity [37].
Empirically, in public goods games, there is growing body of work, which this paper adds to, focusing on endowment heterogeneity on cooperation [38,39,40,41,42,43,44,45]5. However, there is mixed evidence on this effect with some finding no effects [43,45], others showing positive effects [38,42], as still others finding lower levels of cooperation [40,44,49]6.
The choice of individuals with unequal endowments concerning how much to contribute to the public good may also depend both on their relative endowment level, as well as the means by which the endowment status was determined. Again, evidence is mixed. For example, Burns and Visser [50] find that income heterogeneity is associated with higher contributions to the public good, especially from the relatively poor while Georgantzis and Proestakis [51] find the opposite, namely that higher public goods contributions on average are driven by increased contributions from higher endowment individuals. Eliciting players beliefs on contributions, shows that poorer individuals believe that the richer players should contribute relatively larger shares of their endowment to the provision of the good [51].
A possible explanation for the inconsistent effect of endowment inequality is that a player may be responding both to the inequality as well as the change in endowment [52]. That is, by varying the endowments across equal and unequal treatments, treatment effects represent both an endowment component and an inequality aspect. Heap, Ramalingam and Stoddard [52] address this concern by comparing participant contributions of the same endowment across groups with equal and unequal endowments. The authors find that the negative effects of inequality are observed only as the under-contribution by the rich [52]. Similarly, the effects of endowment inequality on public goods contributions may depend on the extent of inter-group competition. Heap, Ramalingam, and Stoddard [53] show that high levels of inequality reduce the gains from the competitive environment. This is driven largely by the rich players, whose contributions to the public good are unaffected by the presence or absence of competition. The poor, on the other hand, increase their contributions in a competitive environment characterised by moderate inequality, but this difference disappears with high intra-group inequality [53]. In terms of the origin of the endowment inequality, generating unequal endowments through luck (random allocation) as opposed to merit has no differential impact on contributions to the public good [44,45].
Much of the experimental literature on pro-sociality, particularly in public goods games, is characterised by windfall endowments (unearned endowments given to the players by the experimenter) and homogeneous endowments [46,47,48]. There is a dearth of literature on how altering the origins of inequality effects cooperative behaviour. The few existing studies show that endogenously generating unequal endowments, through luck (random allocation) as opposed to merit, has no differential impact on contributions to the public good [44,45]. This paper builds on this existing literature, by examining the impact of endowment inequality that arises as a material consequence of the deliberate removal of an individual’s agency in a prior interaction. We explore the use of asymmetric decision making power for equal or unequal wealth; the effects of this endogenously generated inequality on cooperation; and, as our main interest, the effects of social exclusion, by means of social decision-making, on the ex post provision of public goods.
2. Experimental Design
The experiment consists of two stages played sequentially. The first stage is comprised of two one-shot Prisoner’s Dilemma games, with the first called the symmetric game and the second the asymmetric game7. The second stage of the experiment is a standard Linear Public Goods game with a Voluntary Contribution Mechanism (VCM).
2.1. Stage One: Prisoner’s Dilemma Games
The symmetric game is identical to the traditional Prisoner’s Dilemma in which two players must choose to either cooperate or defect. In contrast, the asymmetric game forces one player to cooperate and only affords one player in the pair the right to choose cooperate or defect [15]. With one player forced to cooperate, only two outcomes are possible: the game can either result in mutual cooperation or a defect-cooperate outcome depending solely on the dictator’s choice.
The payoffs from the outcomes of the two games are shown in Table 18. Mutual Defection, DD, which is only possible in the symmetric game, earns each player fifteen tokens. A cooperator paired with a defector, CD or DC, earns ten tokens and the defector earns forty. Finally, mutual cooperation earns each player thirty tokens. In the asymmetric game, one player is forced to cooperate which makes mutual defection impossible.The unilateral power in the asymmetric game can be seen from the table in that only one player’s choice matters, and the other player is always forced to cooperate regardless of their own preference (DC and CC).
These two games are played sequentially, using the strategy method, beginning with the symmetric game followed immediately by the asymmetric game9. Together, the two games form Stage One of the experiment.
The payoffs from Stage One determine player endowments in the subsequent public goods game which forms Stage Two of the experiment. For example, if the outcome of the PD game was mutual cooperation, both players earned thirty tokens, and would enter the public goods game with an endowment of thirty tokens each. If the PD outcome was DC, then the defector would enter the public goods game with an endowment of forty while the cooperating player would receive an endowment of ten tokens.
There are three different treatments in terms of how Stage One payoffs are realised as endowments for Stage Two. In Treatment One, our baseline control, the endowments in the public goods game are randomly allocated to players, and do not depend on Stage One. As a results, there is no prior play in Treatment One. In Treatment Two, the endowments for players in the public goods game are determined by the choices made in the symmetric PD game. In Treatment Three, the asymmetric game is used to determine the endowments for the public goods game.
The experimental sessions were allocated to each treatment randomly from a manual draw, without replacement, at the beginning of each day in which sessions would take place. Participants were informed of this at the beginning of the session, but were only told which treatment they were in at the end of Stage One10. In other words, players made their choices in the symmetric and asymmetric PD game behind the “veil of ignorance” [55]. Only once players had made their choices for both PD games did the experimenter reveal whether the session had been randomly chosen as one where the choices from the symmetric game would be used to determine endowments for Stage Two, or whether the choices from the asymmetric game would be used. In the case of the latter, once players were made aware that the asymmetric game would be used to determine endowments for Stage Two, randomisation was then used again, within each pair of players, to determine which of the two players’ actual choices would be ignored. The player whose choice was ignored was set to cooperate, while the other player’s actual choices would remain.
Lastly, participants were only informed of the outcome of the game chosen to determine endowments. That is, players in Treatment Two, in which the symmetric game was used, were not made aware of the outcome of the asymmetric game. Similarly, players in Treatment Three, in which the asymmetric game was chosen, were unaware of the outcome of the symmetric game.
2.2. Stage Two: Public Goods Game
In Stage Two, participants were placed into groups of four to participate in a standard, Linear Public Goods game with voluntary contributions. In this standard game, individuals must choose how much of an allocated endowment to contribute towards the provision of a public good, which is enjoyed equally by all individuals in the group, irrespective of how much the individual contributes themselves. The dilemma arises in that individual returns are increasing with the amount contributed for the provision of the public good, but are lower than the value of marginal contributions. Formally (see Equation (1)), the marginal per capita return to contribution, , is less than one where k is a multiplicative scalar and N is the group size. In this experiment, and . The two values chosen for this experiment result in a marginal per capita return of 0.5.
All three treatments use the VCM payoff structure as described by Equation (1). In each round of the game, r, player i earns a payoff of . Her payoffs are determined by: (a) the amount of her endowment, which is constant across all rounds, less the amount she chooses to allocate to her private account, , in addition to (b) the return, , from the amount she and her co-players contribute to the public account.
To be clear, the endowments for the public goods game are allocated in one of three ways. The first treatment randomly assigns Prisoner’s Dilemma payoffs to each player. In the second and third treatment, asymmetric and symmetric Prisoner’s Dilemma games are played by all players using the strategy method. The asymmetric game forces one player to cooperate while the other player is free to choose whether to cooperate or defect. The symmetric game is identical to the traditional Prisoner’s Dilemma. Once players in Treatment Two and Treatment Three completed the two games of Stage One, outcomes from the symmetric game are used as the players’ endowments in the VCM for Treatment Two. Outcomes from the asymmetric game are used to determine endowments for players in Treatment Three.
3. Experimental Protocol
Participants in the experiment were students recruited from the University of Cape Town in South Africa. Recruitment was done through a university wide email list with no restrictions placed on who could participate in the study. Key demographic and other participant characteristics are described in Table 2. During the recruitment, no context was given to the students about the games to be played, nor did the recruitment use the words “experiment” or “economics” in its description. The recruitment promised a twenty rand show-up fee and the possibility of earning up to 275 rand in the hour and a half the experiment was anticipated to last11.
Upon arrival, participants were randomly allocated a computer in a room with the capacity to accommodate 120 participants12. To ensure privacy, the sessions were run with a minimum of twelve participants and a maximum of twenty-eight, distributed widely across the room. The entire experiment was run using Z-Tree software [56].
In all sessions, no deception was used at any stage and all details relevant to the decisions to be made in the task were announced to all participants. Details of each stage, and each game, were announced after the preceding game was completed by all participants. (See Supplementary Materials for all instructions). In the Prisoner’s Dilemma games, participants were informed that they would be randomly matched by the computer with an anonymous participant. Moreover, it was announced that their payoffs from the selected game in Stage One would be revealed after both games in Stage One had been completed, and earnings from the entire experiment would be converted into rands and displayed on their screens at the end of the session. Participants therefore played the asymmetric Prisoner’s Dilemma with no knowledge of the outcome of the symmetric game played just before13. The Prisoner’s Dilemma to be selected for the session was only announced to players after both Prisoners’ Dilemma games had been played. Participants were not informed of the outcome of the Prisoner’s Dilemma not selected for that session. Finally, apart from knowledge of the fact that a second stage of the experiment existed, participants were unaware that the VCM game would be played, nor were they aware of the relationship between the two stages of the experiment, until the second stage began.
As Treatment One did not include prior play, endowments in this treatment were randomly assigned to each participant. In a bid to mitigate differences in the wealth distribution across the treatments, the endowments to be distributed were based on the joint distribution of endowments in the other treatments. To achieve this, Treatment One was conducted after the other treatments had been completed.
At the end of the first stage, the VCM was then explained. The game was described as one in which anonymous groups of four players, randomly determined and fixed for the duration of the game, would be asked to make eight independent decisions on the share of their endowment to allocate to either Account A or Account B. Account A served as the private account and Account B as the public account14. Moreover, it was announced to all participants that in the treatments with prior play, the individual they were matched with in the Prisoner’s Dilemma games would not be in their group for the VCM15.
In the contribution stages, each participant was shown the distribution of endowments in their group and then asked to make their contributions to the public account. Only positive integer values were permitted as contributions. Once all players in the session had made their contribution decision, with no time limit for decisions to be made, the game proceeded to the profit stage. In the profit stage, participants’ individual computer screens showed the sum of contributions made by all members of their group; the size of the pot to be shared; the uniform individual income from the public account for the round; and the participant’s own contribution to the pot. No information was provided on the individual contributions of other group members and only information pertaining to the current round of play was made available.
At the end of the VCM, and before their final payoffs in tokens and rands was revealed, participants were required to complete a final survey16. The survey also included questions on demographic characteristics such as race, gender and nationality, settlement, type of residence (a crude indicator of the individual’s household wealth), among other questions. Once the survey was complete, participants were shown the rand value of their earnings and the session concluded.
4. Results
4.1. Descriptive Statistics
A total of 292 individuals participated in the study (Table 2)17. Treatment sizes vary with 108 participants in Treatment One (random endowments), eighty-eight in Treatment Two and ninety-six in Treatment Three. The differences in participant numbers across the treatments are a result of fluctuating attendance at the sessions.
On average, participants were twenty-three years old, and just over a third of the sample were female. Of the entire sample, seventeen percent of participants had registered for an undergraduate course in game theory, and trust levels on the whole are low. While participants were randomly allocated to sessions, there are some differences in the characteristics of participants across different treatments. Consequently, we include controls for these characteristics in all of our regression analysis in order to deal with any bias that might arise in our results due to differences in background demographic characteristics across treatment groups18.
4.2. The Effects of Asymmetries in Personal Agency on Cooperation
Result 1:
The propensity to cooperate ex ante is higher when loss of personal agency is possible, and decisions are made behind the veil of ignorance.
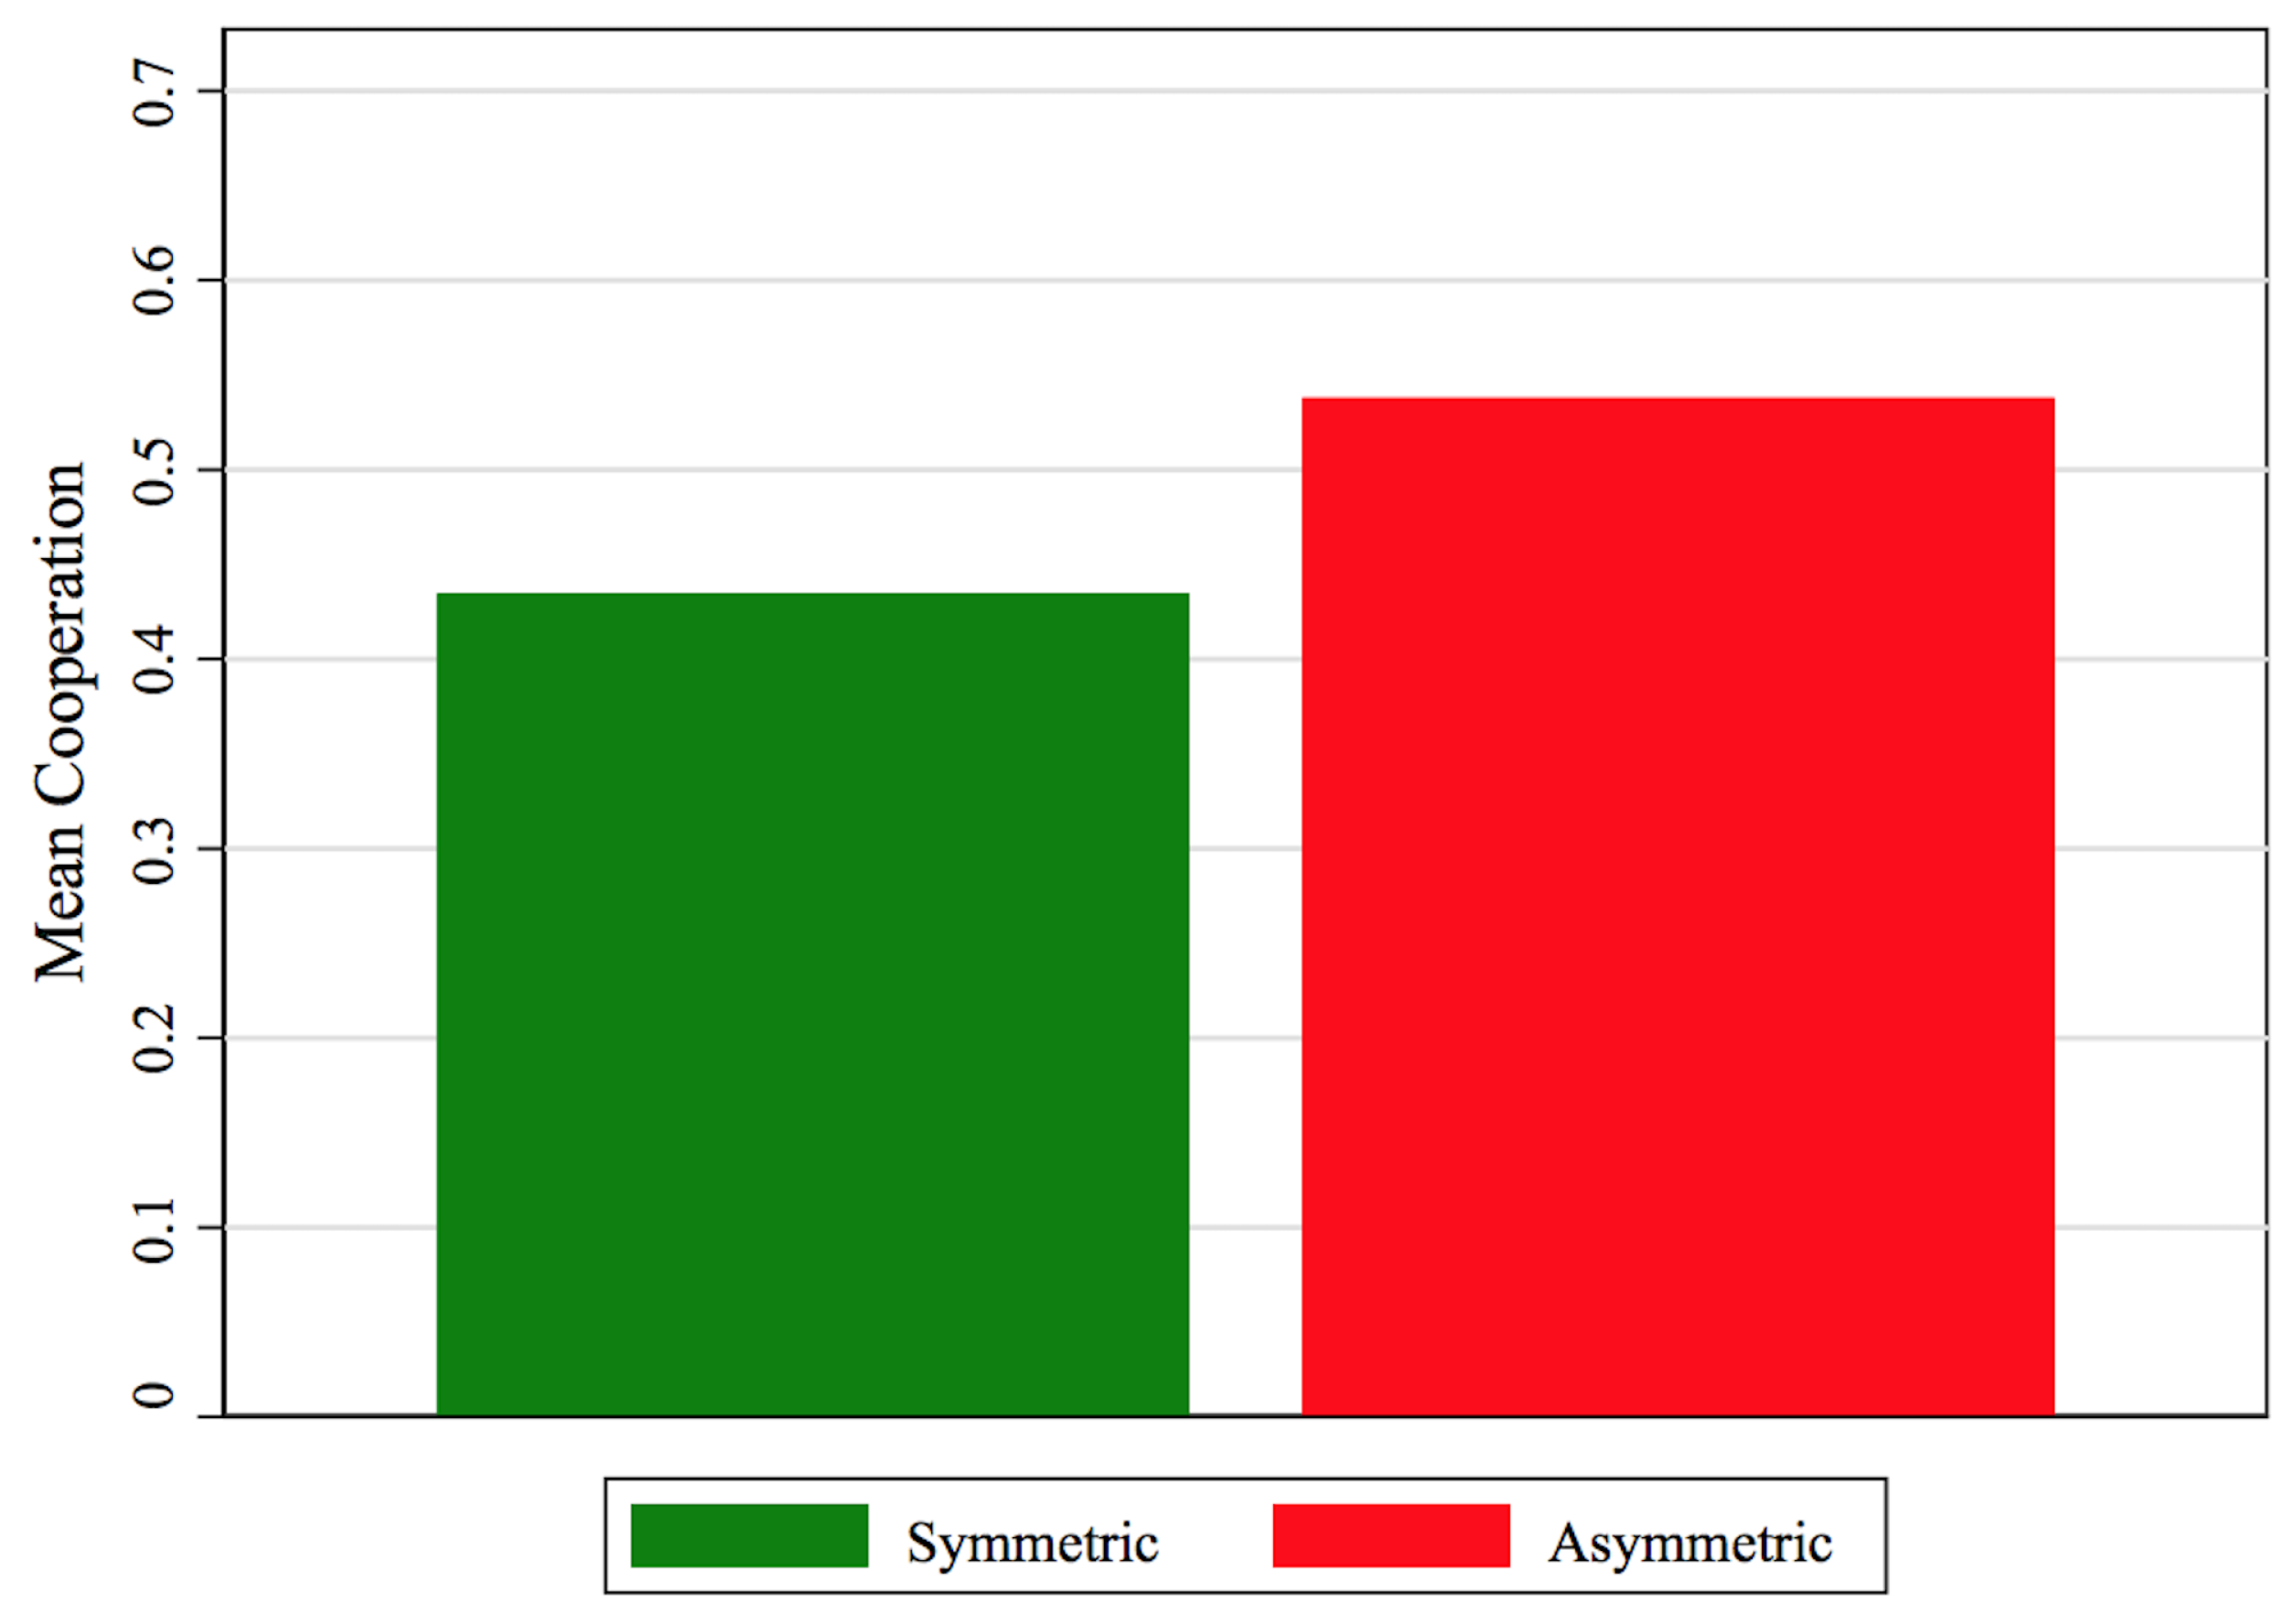
Figure 1 shows the rates of cooperation in the two PD games pooled for Treatment Two and Treatment Three. It can be seen from the figure that fifty-four percent of participants cooperated in the asymmetric game, while only forty-three percent cooperated in the symmetric game. The differences between the symmetric and asymmetric game, tested using a Wilcoxon Signed-Rank Test, are significant at the five percent level (z = −2.43; p = 0.02).
A closer inspection of the cooperative behaviour in the games shows that although rates of cooperation are higher with asymmetries in choice sets, only thirty-two percent of this is driven by individuals who cooperate in both games. Of the remaining participants, thirty-five percent defected in both games. The remaining third of the sample changed choices across the two games by alternating, in either direction, between cooperate and defect. Differences between these combinations are insignificant (p = 0.337). We turn now to the public goods game results.
4.3. The Effects of Wealth and the Origins of Inequality
Since endowments in the public goods game are determined by prior play, it is important to check for the extent to which the distribution of endowments by treatment are similar. Table 3 reports mean differences in group and individual experimental data by treatment. Comparisons are made between each pairwise combination of treatments.
Table 3 shows that the entire sample has a mean group wealth of 101 tokens with an average Gini Coefficient of 0.18 and the average player is endowed with twenty-five tokens. The only significant differences in group characteristics from the experimental data are between Treatment Two and Treatment Three. Group wealth is highest in Treatment Three by twenty tokens which is to be expected given the higher rates of cooperation in the asymmetric game. Similarly, the average player is wealthier in Treatment Three, by five tokens, compared to Treatment Two. We control for these differences in our regression analysis. All of the group characteristics shown in Table 3 are included in all the regressions.
Result 2:
Public goods provision is significantly lower when endowments are determined by the outcome of prior strategic interactions as opposed to random allocation.
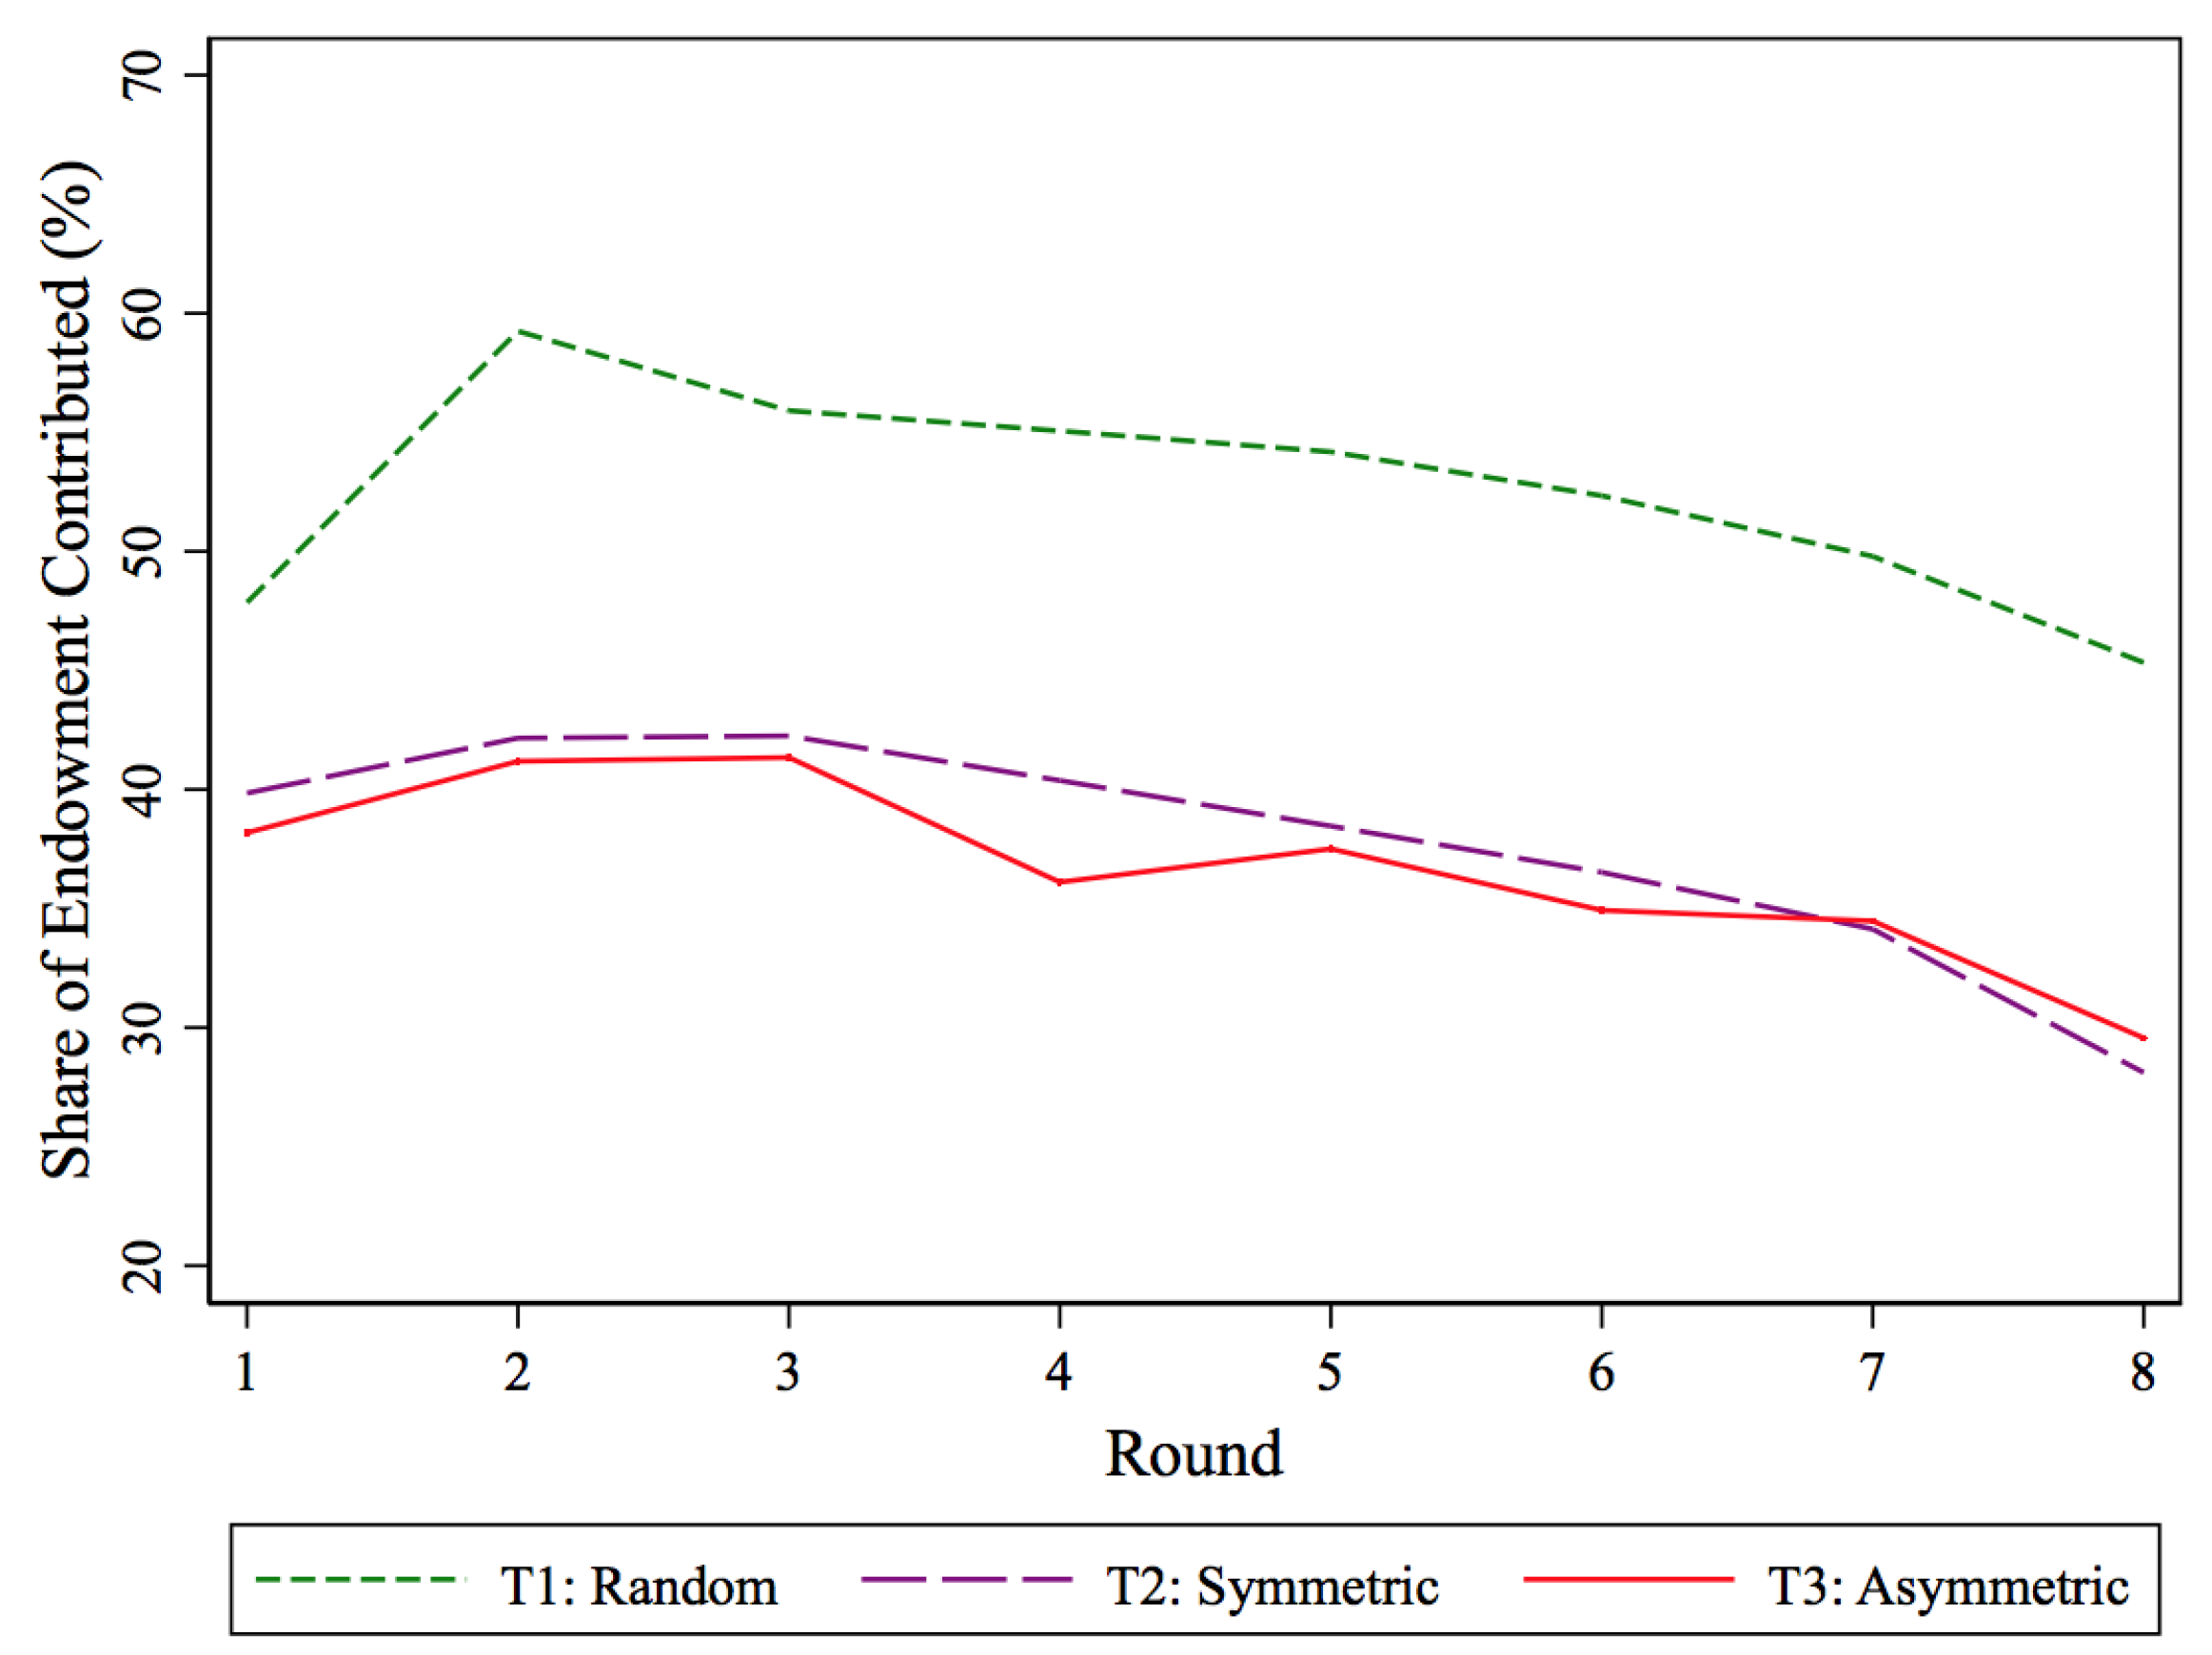
Figure 2 illustrates the percentage of endowment contributed to the public good by treatment, over the course of the game. Across treatments, the average share of endowment contributed to the public account by each player decreases with repeated play, although never reaching zero. This is in line with stylised facts in the literature [46].
Contributions to the public good are significantly higher in Treatment One, where unequal endowments were randomly allocated, than compared to Treatment Two and Three where unequal endowments reflect the outcome of prior strategic interaction (p = 0.000). Treatment One participants contribute nearly fifty percent of their endowment in the first round with contributions peaking in the second round at about sixty percent, and declining thereafter. In contrast, contributions in Treatments Two and Three begin lower at around forty percent and follow a similar pattern of decay.
We verify this result using OLS regression models, where the dependent variable is the percentage share of endowment contributed. To account for potential confusion or experimentation by participants at the onset of the game, the regression analysis will typically limit the sample to rounds two to eight19. In the first column of Table 420, which includes all eight rounds of the VCM, participants in Treatment Two contribute fourteen percentage points less than players in Treatment One and Treatment Three reduces contributions by eleven percentage points. The effects are qualitatively unchanged in column 2 of the table which limits the sample to rounds two to eight with approximately a one percentage point increase in the magnitude of the coefficients.
Result 3:
The removal of personal agency reduces ex-post contributions to the public good.
Since player endowments are unequal, we control for endowment level in the regressions. While contributions to the public good decline significantly as endowment levels rise, these coefficients are small, suggesting a weak effect. However, as endowments arise from different prior treatments (symmetric versus asymmetric agency), it is possible that endowment effects are sensitive to the origins of the player’s wealth. To identify these different effects, interaction terms between treatments and endowment are reported in column 3 as “Endowment in Symmetric (T2)” and “Endowment in Asymmetric (T3)” for these endowment interactions for Treatment Two and Treatment Three, respectively.
Controlling for unequal endowments that originate due to different initial conditions in player agency, the only persistent treatment effect that remains is that contributions to the public good are significantly lower ex-post the implementation of asymmetric agency (viz Treatment Three). The asymmetry in personal agency reduces contributions by twenty percentage points (approximately forty-five percent). Treatment Two effects are no longer significant although the coefficient remains negative. The independent effect of endowment remains less than half a percentage point while endowments in Treatment Two and Three are insignificant in predicting contributions to the public good (as seen in column 3). This is at least suggestive that in Treatment Three, it is not simply unequal endowments that lead to lower contributions, since the effect size for endowments is small. Rather it is suggestive that the loss of decision-making agency by some, may have engendered strong ex-post responses.
We explore this further by considering the behaviour of socially excluded players (i.e., those who were unable to exercise personal agency in the PD setting). To identify the effects of being socially excluded on the individual, we consider players whose choice in the Prisoners’ Dilemma game in Treatment Three was not used to determine the outcome of the game, while treating all other players in the experiment, across all treatments, as socially included. That is, all players in Treatment One and Treatment Two as well as half of the players in Treatment Three, are socially included (since they are able to exercise their choice) while only the remaining half of Treatment Three players are socially excluded.
In Table 5, the distribution of observations based on the socially excluded or included, as defined above, as well as average endowments, across the three treatments is presented21. In Treatments One and Two, all the participants are considered to be socially included thus, over all rounds of play, there are 756 observations in Treatment One and 616 observations in Treatment Two. For Treatment Three, half of the players are socially excluded; thus only 336 of the 672 observations are from socially included participants. Socially included participants in Treatment Three are, on average, fifteen tokens wealthier than their excluded counterparts, which is a highly significant difference. Similarly, the average socially included player, across all three treatments, is significantly wealthier (twenty-six tokens) than socially excluded players.
Our estimations of the effects of social exclusion use OLS regressions in addition to group-level fixed effects22. We add the group-fixed effects model because including controls for group inequality, as measured by the Gini Coefficient, is an imperfect description of group inequality given the small group sizes and the discrete wealth levels. The unsettled debate on the effects of inequality makes it difficult to postulate the direction of the bias from imperfectly accounting for group inequality. Moreover, as each group forms its own dynamic, in part from the differences in group inequality across groups, as well as other factors such as group specific patterns of contribution to the public account, the contributions are likely to be more correlated within groups than they are across groups. These group specific characteristics may alter the results. Using fixed effects allows us to deal with some of these issues.
The results from these models are shown in Table 623. Ex-ante, not having decision-making power in the PD game, relative to others, reduces ex-post contributions to the public good by between fifteen and twenty-three percentage points (columns 1 and 2). Since being socially excluded need not always yield the lowest endowment (if one is matched with a cooperative partner), a control for the interaction of social status and endowment is added in column 2 as “Endowment and socially excluded”. As endowment is a function of the decisions made in the Prisoner’s Dilemma game, the interaction term in effect serves as a proxy for whether the excluded player was paired with a cooperative or defecting co-player. With this additional control, the effects of being socially excluded increase substantially by eight percentage points. However, since the interaction term is not statistically significant, this suggests that it is the experience of exclusion itself, as opposed to the material consequences arising from this, that have a stronger effect on public goods provision. Lastly, column 3 controls for group fixed effects on the same regression specified in column 2. The qualitative results from column 2 are observed in column 3 as well, although the effect is significant only at the ten percent level and the magnitude is reduced by about five percentage points. Exclusion reduces contributions independent of the material consequences arising from the exclusionary social interaction.
Given our finding in Table 6, we explore the effect of unequal endowments on public goods contributions in more detail in Table 7. The baseline group in all three regressions are players with ten token endowments. The results show no endowment effects in Treatment One and Treatment Three, confirming that in Treatment Three, the lower contributions on aggregate are not due to endowment effects. Rather, endowment effects are evident within Treatment Two. There is significant under-contribution by relatively well-endowed players. Players with thirty tokens contribute seventeen percentage points less than players with ten tokens and, similarly, players with forty tokens contribute thirty-five percentage points less.
One cannot, however, conclude that the substantial free-riding of the rich in Treatment Two, particularly the wealthiest, may be associated with underlying anti-social preferences. The wealthiest players necessarily defected in the Prisoner’s Dilemma game2425. However, by this logic, the players with fifteen tokens, who also necessarily defected in the Prisoner’s Dilemma games should also under-contribute. This is not the case. Again, it is suggestive that the context within which decisions are made, in this case, where both players had equal power to exercise their agency which in turn determined their endowment positions, may have important effects on ex-post behaviour.
The contribution decisions by the wealth of a player suggests that cooperation cannot be explained by theories of altruism or inequality aversion. Altruism would require all players to contribute their entire endowment [57], which is clearly not the case. Inequality averse (richer) players would contribute a greater share of their endowment than poorer players [8], which is also not supported by the data.
5. Discussion
This paper addresses the impact of social exclusion on cooperation, using a two-stage experimental design with two Prisoners’ Dilemma games in the first stage, one in which both parties exercise personal agency in making cooperate-defect decisions, while in the other, only one party is able to exercise their agency and their co-player is forced to cooperate. The results show that there is significant, and relatively more, co-operation in a PD game where agency is removed for one player. Despite the fact that no detrimental monetary consequences to defection are possible in the asymmetric game, in which one party is forced to cooperate, rates of cooperation are significantly higher in this game than in the symmetric game, in which losses from defecting can occur. It must be noted that as players make their choices in the asymmetric game, unaware of their actual social position, the veil of ignorance may elicit greater feelings of empathy or concern for the subordinated Other, who may in fact turn out to be the player herself. The effects of the veil of ignorance becomes rather salient when the results are compared to those from Ultimatum games and Dictator games, which our symmetric and asymmetric game, respectively, resemble. The Ultimatum game consistently shows relatively more equal choices than the Dictator game which, in the context of our experiment, would suggest greater cooperation in the symmetric game than the asymmetric version.
The benevolence of the potential dictators in this experiment may also be driven by the smaller pecuniary gains to a purely self-interested dictator (ten tokens), compared to the larger monetary costs to the co-player from a defecting dictator (twenty tokens). The cost of self-orientated behaviour to a co-player is more than double the benefit to the deciding player. This assertion is supported by the literature on Binary Dictator games which shows conflicting results in the rates of equal choices which may be due to relative gains and losses between the players. However, in the asymmetric case where one individual is unable to exercise their agency, it is also possible that the fact that the other party, chosen at random, is forced to cooperate may induce those with agency who are conditional cooperators to be more inclined to select co-operate rather than defect. This may explain the higher rates of co-operation evidenced in the asymmetric game, despite the fact that the payoff structure still maintains defect as the dominant strategy. This is an interesting possibility that could be explored in further work. Varying the difference in gains and losses, as well as removing the veil of ignorance, may lead to different results and would also be worth exploring in future work.
The payoffs from the realized PD game are used as endowments in a Public Goods game, played subsequently. In this way, the experiment explores the effect that a history of social exclusion in the form of imposed asymmetries in decision-making power might have on future social interactions. Moreover, the prior play is used to generate endowment inequality. Treatments differ in the mechanism used to generate this inequality. In Treatment One, unequal endowments are randomly allocated to players. In Treatment Two, endowments are based on the realized outcomes in the PD game where both players were able to exercise their personal agency. In Treatment Three, endowments are the result of the decisions made by only one player in each pair. We consider Treatment Two, with its equal decision-making power in prior play to represent an inclusive society, while Treatment Three, with its asymmetric decision-making from unequal social positions, an exclusionary society. Our main result shows that social exclusion has significant negative effects for social welfare ex-post. Players with a history of prior play where they were unable to exercise their personal agency contribute lower shares of their endowment to the public good ex-post, independent of wealth. The same is not true for individuals with a history of prior play where both players were able to exercise their agency. The subdued cooperation from a history of social exclusion appears to be driven by players who were excluded from exercising their own choices.
We do not claim to be able to explain the deleterious effects of social exclusion. Our results provide evidence that social exclusion can reduce future co-operation even once agency has been restored. The lingering effects of oppressive regimes in many transition societies attests to this. One causal pathway is that social exclusion that leads to material inequality may undermine co-operation. A second pathway is that social exclusion may also work to undermine inter-personal relationships and trust, raising suspicion of others. However, one would expect these mechanisms to be most prevalent as a consequence of unfavourable exchanges, where the player with agency chooses to defect. Our results suggest that the mere act of being socially excluded is sufficient to reduce future co-operation, independent of whether the prior exchange was favourable or unfavourable.
Our findings have important implications for understanding social exclusion. Much of the discourse largely engages with material inequalities and deprivation. However, as the social exclusion paradigm relies on a multi-dimensional and relational approach, this is a significant oversight. By expanding the discourse into systematic social relations such as asymmetries in agency, understanding attitudes towards redistribution, and the propagation and engendering of poverty and inequality is greatly enhanced. Without interventions to promote cooperation and group cohesion, either beyond simply pecuniary considerations, social welfare may be unable to be maximised even after institutional factors of exclusion are removed. How to design policies which address both the material and non-pecuniary aspects of this problem is an interesting and important avenue for further research.
Supplementary Materials
The following are available online at https://www.mdpi.com/2073-4336/9/3/55/s1.
Author Contributions
Conceptualization, L.N., J.B. and A.L.; Methodology, L.N. and J.B.; Software, L.N.; Validation, L.N., J.B.; Formal Analysis, L.N. and J.B.; Investigation, L.N.; Resources, A.L.; Data Curation, L.N.; Writing—Original Draft Preparation, J.B.; Writing—Review & Editing, L.N.; Visualization, L.N.; Supervision, J.B.; Project Administration, A.L.; Funding Acquisition, J.B. and A.L.
Funding
This research was funded by VLIR-UOS.
Conflicts of Interest
The authors declare no conflict of interest. The funding sponsors had no role in the design of the study; in the collection, analyses, or interpretation of data; in the writing of the manuscript, and in the decision to publish the results.
Appendix A
In Table A1, Table A2 and Table A3, we reproduce the in-text regressions, as they appear, and report key demographic characteristics and control variables. The baseline comparison in the regressions are Black African men.
The effect of race (White, Coloured or Mixed Race and Indian/Asian), an important socio-economic and salient factor in South Africa’s history of social exclusion and current issues of redistribution and procedural fairness, is inconsistent in its significance and direction of impact. Cautious interpretation of this result is important as the number of participants in some of the racial categories is as low as eighteen. Similar inconsistency on gender effects are seen. As would be expected, participants who had previously registered for a course in game theory, by-in-large, under-contribute.

Table A1.
Expanded Treatment Effects of Aggregate Social Asymmetries.
| Variables | (1) | (2) | (3) | |
|---|---|---|---|---|
| T2: Symmetric | −14.40 *** | −15.63 *** | −4.13 | |
| (4.03) | (4.16) | (9.80) | ||
| T3: Asymmetric | −11.11 *** | −12.11 *** | −20.37 ** | |
| (3.74) | (3.93) | (10.01) | ||
| Endowment | −0.44 *** | −0.47 *** | −0.41 * | |
| (0.16) | (0.17) | (0.24) | ||
| Round | −1.24 *** | −2.01 *** | −2.01 *** | |
| (0.31) | (0.35) | (0.35) | ||
| Group Endowment | −0.06 | −0.07 | −0.06 | |
| (0.07) | (0.07) | (0.07) | ||
| Don’t trust strangers | −6.73 * | −7.91 ** | −8.15 ** | |
| (3.84) | (3.95) | (3.90) | ||
| Female | −6.19 ** | −5.70 * | −5.95 * | |
| (3.11) | (3.25) | (3.21) | ||
| White | 11.15 * | 11.39 | 9.63 | |
| (6.68) | (7.10) | (7.24) | ||
| Coloured | 8.61 * | 8.74 * | 7.84 | |
| (4.63) | (4.83) | (4.89) | ||
| Indian/Asian | −3.54 | −4.51 | −4.79 | |
| (7.90) | (8.35) | (8.24) | ||
| Registered for Game Theory | −10.77 ** | −9.89 ** | −11.02 ** | |
| (4.50) | (4.67) | (4.62) | ||
| Endowment in T2 | - | - | −0.48 | |
| (0.31) | ||||
| Endowment in T3 | - | - | 0.31 | |
| (0.35) | ||||
| Constant | 75.08 *** | 82.75 *** | 82.48 *** | |
| (8.63) | (8.84) | (9.33) | ||
| Observations | 2096 | 1834 | 1834 | |
| R-squared | 0.12 | 0.14 | 0.15 |
*** p < 0.00; ** p < 0.05; * p < 0.10.
Table A2.
Expanded Effects of Individual Social Exclusion.
| Variables | OLS (1) | OLS (2) | Group Fixed Effects |
|---|---|---|---|
| Socially Excluded | −15.04 *** | −23.08 ** | −18.22 * |
| (4.79) | (10.53) | (10.66) | |
| Endowment | −0.62 *** | −0.67 *** | −0.63 *** |
| (0.18) | (0.19) | (0.16) | |
| Endowment and socially excluded | - | 0.38 | 0.53 |
| (0.45) | (0.37) | ||
| Round | −2.01 *** | −2.01 *** | −2.01 *** |
| (0.35) | (0.35) | (0.35) | |
| Don’t trust strangers | −7.85 ** | −8.09 ** | −10.68 *** |
| (3.92) | (3.93) | (3.17) | |
| Female | −5.60 * | −5.59 * | 1.03 |
| (3.26) | (3.25) | (2.51) | |
| White | 12.58 * | 12.19 * | 12.75 ** |
| (7.27) | (7.29) | (5.24) | |
| Coloured | 9.63 * | 8.65 * | 0.01 |
| (4.93) | (5.15) | (4.10) | |
| Indian/Asian | −4.01 | −4.08 | −10.75 * |
| (8.31) | (8.35) | (6.35) | |
| Registered for Game Theory | −11.17 ** | −11.37 ** | −10.72 *** |
| (4.62) | (4.65) | (3.47) | |
| Constant | 71.50 *** | 72.04 *** | 74.50 *** |
| (13.03) | (12.93) | (7.67) | |
| Observations | 1834 | 1834 | 1834 |
| R-squared | 0.14 | 0.14 | 0.39 |
*** p < 0.00; ** p < 0.05; * p < 0.10.
Table A3.
Expanded Effects of the Origins of Wealth Heterogeneity.
| Decision | Variables | T1: Random | T2: Symmetric | T3: Asymmetric |
|---|---|---|---|---|
| CD | Fifteen tokens | −2.19 | −8.72 | - |
| (8.06) | (10.36) | |||
| CC | Thirty tokens | −4.38 | −17.20 * | −3.32 |
| (7.85) | (10.08) | (8.88) | ||
| DC | Forty tokens | −4.53 | −35.01 *** | −1.92 |
| (8.41) | (10.60) | (11.12) | ||
| Round | −2.09 *** | −2.17 *** | −1.79 *** | |
| (0.65) | (0.54) | (0.62) | ||
| Group endowment | −0.27 ** | 0.04 | −0.08 | |
| (0.11) | (0.15) | (0.14) | ||
| Don’t trust strangers | −2.16 | −10.53 | −15.10 ** | |
| (6.32) | (8.96) | (7.29) | ||
| Female | 4.24 | −7.28 | −10.12 * | |
| (5.35) | (6.95) | (6.01) | ||
| White | 11.94 | −14.42 | 11.69 | |
| (10.64) | (10.75) | (10.40) | ||
| Coloured | 5.94 | 20.24 * | −0.31 | |
| (7.45) | (10.58) | (10.07) | ||
| Indian/Asian | −23.25 *** | 24.71 | −14.78 | |
| (8.17) | (17.43) | (16.73) | ||
| Registered for Game Theory | −2.38 | −22.09 ** | −10.65 | |
| (10.95) | (8.82) | (7.48) | ||
| Constant | 100.46 *** | 57.15 *** | 66.96 *** | |
| (17.66) | (18.60) | (14.45) | ||
| Observations | 651 | 574 | 609 | |
| R-squared | 0.14 | 0.21 | 0.16 |
*** p < 0.00; ** p < 0.05; * p < 0.10.
References
- Sen, A. Development as Freedom; Oxford University Press: Oxford, UK, 2001. [Google Scholar]
- Rispel, L.C.; Molomo, B.; Dumela, S. South African Case Study on Social Exclusion; HSRC Press: Cape Town, South Africa, 2008. [Google Scholar]
- Kessler, J.B.; Leider, S. Procedural fairness and the cost of control. J. Law Econ. Organ. 2016, 32, 685–718. [Google Scholar] [CrossRef]
- Cropanzano, R.; Folger, R. Referent cognitions and task decision autonomy: Beyond equity theory. J. Appl. Psychol. 1989, 74, 293. [Google Scholar] [CrossRef]
- Greenberg, J. Reactions to procedural injustice in payment distributions: Do the means justify the ends? J. Appl. Psychol. 1987, 72, 55. [Google Scholar] [CrossRef]
- Maris, E.; Stallen, P.J.; Vermunt, R.; Steensma, H. Evaluating noise in social context: The effect of procedural unfairness on noise annoyance judgments. J. Acoust. Soc. Am. 2007, 122, 3483–3494. [Google Scholar] [CrossRef] [PubMed]
- Folger, R.; Martin, C. Relative deprivation and referent cognitions: Distributive and procedural justice effects. J. Exp. Soc. Psychol. 1986, 22, 531–546. [Google Scholar] [CrossRef]
- Fehr, E.; Schmidt, K.M. A theory of fairness, competition and cooperation. Q. J. Econ. 1999, 114, 817–868. [Google Scholar] [CrossRef]
- Wang, M. Does Strategy Fairness Make Inequality more Acceptable? Technical Report; School of Economics, University of East Anglia: Norwich, UK, 2017. [Google Scholar]
- Bolton, G.E.; Ockenfels, A. ERC: A theory of equity, reciprocity, and competition. Am. Econ. Rev. 2000, 90, 166–193. [Google Scholar] [CrossRef]
- Candelo, N.; Croson, R.T.; Li, S.X. Identity and social exclusion: An experiment with Hispanic immigrants in the US. Exp. Econ. 2017, 20, 460–480. [Google Scholar] [CrossRef]
- Baumeister, R.F.; Leary, M.R. The need to belong: Desire for interpersonal attachments as a fundamental human motivation. Psychol. Bull. 1995, 117, 497. [Google Scholar] [CrossRef] [PubMed]
- Hutchison, P.; Abrams, D.; Christian, J. The social psychology of exclusion. In Multidisciplinary Handbook of Social Exclusion Research; John Wiley & Sons: Chichester, UK, 2007; pp. 29–58. [Google Scholar]
- Twenge, J.M.; Baumeister, R.F.; Tice, D.M.; Stucke, T.S. If you can’t join them, beat them: Effects of social exclusion on aggressive behavior. J. Pers. Soc. Psychol. 2001, 81, 1058. [Google Scholar] [CrossRef] [PubMed]
- Rabin, M. Incorporating fairness into game theory and economics. Am. Econ. Rev. 1993, 83, 1281–1302. [Google Scholar]
- Güroğlu, B.; van den Bos, W.; Crone, E.A. Fairness considerations: Increasing understanding of intentionality during adolescence. J. Exp. Child Psychol. 2009, 104, 398–409. [Google Scholar] [CrossRef] [PubMed]
- Sutter, M. Outcomes versus intentions: On the nature of fair behavior and its development with age. J. Econ. Psychol. 2007, 28, 69–78. [Google Scholar] [CrossRef]
- Ridinger, G. Intentions Versus Outcomes: Cooperation and Fairness in a Sequential Prisoner’s Dilemma with Nature. 2016. Available online: https://papers.ssrn.com/sol3/papers.cfm?abstract_id=2841833 (accessed on 30 July 2018).
- Falk, A.; Fehr, E.; Fischbacher, U. On the nature of fair behavior. Econ. Inq. 2003, 41, 20–26. [Google Scholar] [CrossRef]
- Camerer, C.; Thaler, R.H. Anomalies: Ultimatums, dictators and manners. J. Econ. Perspect. 1995, 9, 209–219. [Google Scholar] [CrossRef]
- Hoffman, E.; McCabe, K.; Smith, V.L. Social distance and other-regarding behavior in dictator games. Am. Econ. Rev. 1996, 86, 653–660. [Google Scholar]
- Forsythe, R.; Horowitz, J.L.; Savin, N.E.; Sefton, M. Fairness in simple bargaining experiments. Games Econ. Behav. 1994, 6, 347–369. [Google Scholar] [CrossRef]
- Kahneman, D.; Knetsch, J.L.; Thaler, R.H. Fairness and the assumptions of economics. J. Bus. 1986, 59, S285–S300. [Google Scholar] [CrossRef]
- Dana, J.; Weber, R.A.; Kuang, J.X. Exploiting moral wiggle room: Experiments demonstrating an illusory preference for fairness. Econ. Theory 2007, 33, 67–80. [Google Scholar] [CrossRef]
- López-Pérez, R.; Vorsatz, M. What behaviors are disapproved? Experimental evidence from five dictator games. Games 2012, 3, 78–96. [Google Scholar] [CrossRef] [Green Version]
- Zak, P.J.; Knack, S. Trust and growth. Econ. J. 2001, 111, 295–321. [Google Scholar] [CrossRef]
- Bouckaert, J.; Dhaene, G. Inter-ethnic trust and reciprocity: Results of an experiment with small businessmen. Eur. J. Polit. Econ. 2004, 20, 869–886. [Google Scholar] [CrossRef]
- Akerlof, G.A. Social distance and social decisions. Econometrica 1997, 65, 1005–1027. [Google Scholar] [CrossRef]
- Knack, S.; Keefer, P. Does social capital have an economic payoff? A cross-country investigation. Q. J. Econ. 1997, 112, 1251–1288. [Google Scholar] [CrossRef]
- Varughese, G.; Ostrom, E. The contested role of heterogeneity in collective action: Some evidence from community forestry in Nepal. World Dev. 2001, 29, 747–765. [Google Scholar] [CrossRef]
- James, C. Foundations of Social Theory; Belknap: Cambridge, MA, USA, 1990. [Google Scholar]
- Messick, D.M.; Brewer, M.B. Solving Social Dilemmas; A Review. In Review of Personality and Social Psychology; Sage: Beverly Hills, CA, USA, 1983. [Google Scholar]
- Alesina, A.; La Ferrara, E. Participation in Heterogeneous Communities. Q. J. Econ. 2000, 115, 847–904. [Google Scholar] [CrossRef] [Green Version]
- Bardhan, P. Analytics of the institutions of informal cooperation in rural development. World Dev. 1993, 21, 633–639. [Google Scholar] [CrossRef]
- Bardhan, P. Irrigation and cooperation: An empirical analysis of 48 irrigation communities in South India. Econ. Dev. Cult. Chang. 2000, 48, 847–865. [Google Scholar] [CrossRef]
- Dayton-Johnson, J. Determinants of collective action on the local commons: A model with evidence from Mexico. J. Dev. Econ. 2000, 62, 181–208. [Google Scholar] [CrossRef]
- Alesina, A.; Drazen, A. Why are Stabilizations Delayed? Am. Econ. Rev. 1991, 81, 1170–1188. [Google Scholar]
- Fellner, G.; Iida, Y.; Kröger, S.; Seki, E. Heterogeneous Productivity in Voluntary Public Good Provision: An Experimental Analysis; IZA Discussion Paper No. 5556; Institute for the Study of Labor: Bonn, Germany, 2011. [Google Scholar]
- Fisher, J.; Isaac, R.M.; Schatzberg, J.W.; Walker, J.M. Heterogenous demand for public goods: Behavior in the voluntary contributions mechanism. Public Choice 1995, 85, 249–266. [Google Scholar] [CrossRef]
- Anderson, L.R.; Mellor, J.M.; Milyo, J. Inequality and public good provision: An experimental analysis. J. Soc.-Econ. 2008, 37, 1010–1028. [Google Scholar] [CrossRef]
- Cardenas, J.C. Real wealth and experimental cooperation: Experiments in the field lab. J. Dev. Econ. 2003, 70, 263–289. [Google Scholar] [CrossRef]
- Fischbacher, U.; Schudy, S.; Teyssier, S. Heterogeneous Reactions to Heterogeneity in Returns from Public Goods. Soc. Choice Welf. 2014, 43, 195–217. [Google Scholar] [CrossRef]
- Hofmeyr, A.; Burns, J.; Visser, M. Income Inequality, Reciprocity and Public Good Provision: An Experimental Analysis. S. Afr. J. Econ. 2007, 75, 508–520. [Google Scholar] [CrossRef]
- Cherry, T.L.; Kroll, S.; Shogren, J.F. The Impact of Endowment Heterogeneity and Origin on Public Good Contributions: Evidence From the Lab. J. Econ. Behav. Organ. 2005, 57, 357–365. [Google Scholar] [CrossRef]
- Kroll, S.; Cherry, T.L.; Shogren, J.F. The impact of endowment heterogeneity and origin on contributions in best-shot public good games. Exp. Econ. 2007, 10, 411–428. [Google Scholar] [CrossRef]
- Ledyard, J. Public Goods: A Survey of Experimental Research; Academic Press: New York, NY, USA, 1995. [Google Scholar]
- Zelmer, J. Linear Public Goods Experiments: A Meta-Analysis. Exp. Econ. 2003, 6, 299–310. [Google Scholar] [CrossRef]
- Chaudhuri, A. Sustaining cooperation in laboratory public goods experiments: A selective survey of the literature. Exp. Econ. 2011, 14, 47–83. [Google Scholar] [CrossRef]
- Marwell, G.; Ames, R. Experiments on the Provision of Public Goods. I. Resources, Interest, Group Size, and the Free-Rider Problem. Am. J. Sociol. 1979, 84, 1135–1360. [Google Scholar] [CrossRef]
- Burns, J.; Visser, M. Income Inequality and the Provision of Public Goods: When the Real World Mimics the Lab. Available online: https://tinyurl.com/ybaptzz4 (accessed on 30 July 2018).
- Georgantzıs, N.; Proestakis, A. Accounting for Real Wealth in Heterogeneous-Endowment Public Good Games; ThE Papers 10/20; Department of Economic Theory and Economic History of the University of Granada: Granada, Spain, 2011; Volume 10, p. 20. [Google Scholar]
- Heap, S.P.H.; Ramalingam, A.; Stoddard, B.V. Endowment inequality in public goods games: A re-examination. Econ. Lett. 2016, 146, 4–7. [Google Scholar] [CrossRef] [Green Version]
- Heap, S.P.H.; Ramalingam, A.; Ramalingam, S.; Stoddard, B.V. Doggedness or disengagement? An experiment on the effect of inequality in endowment on behaviour in team competitions. J. Econ. Behav. Organ. 2015, 120, 80–93. [Google Scholar] [CrossRef]
- Laver, M. Private Desires, Political Action: An Invitation to the Politics of Rational Choice; Sage: London, UK, 1997. [Google Scholar]
- Rawls, J. A Theory of Justice; Harvard University Press: Cambridge, MA, USA, 1971. [Google Scholar]
- Fischbacher, U. z-Tree: Zurich toolbox for ready-made economic experiments. Exp. Econ. 2007, 10, 171–178. [Google Scholar] [CrossRef] [Green Version]
- Becker, G.S. A Theory of Social Interactions. Source J. Political Econ. 1974, 82, 1063–1093. [Google Scholar] [CrossRef]
| 1. | As we are interested in social exclusion primarily in the form of limitations to social participation and decision-making power, we will use “social exclusion” and “ability to exercise personal agency” interchangeably throughout. |
| 2. | In our experiment, being socially excluded means having one’s personal agency removed. In turn, this leaves the individual vulnerable to the actions of the other player, whose dominant strategy should be to defect, thereby generating material inequalities in the endowments in the subsequent public goods game. Individuals who find themselves in the position of having their agency removed, and subsequently being on the receiving end of disadvantageous inequality, may perceive the process that generated the endowments in the public goods game as being unfair. This is akin to procedural unfairness. |
| 3. | Exclusion is identified based on the identity of the participants in the study. The logic behind the identity-based identification strategy assumes that Hispanic Americans born in the Untied States experience more social inclusion than those born outside of America [11]. |
| 4. | |
| 5. | |
| 6. | The design of experiments in this field vary substantially in several features. In some cases, the endowments allocated to participants at the onset of the game are varied [43,44], the value of the public good to different individuals (the marginal per capita returns) is altered [38,42,49] or different show up fees for participation are awarded [40]. These are likely to be some of the contributing factors to the variety of results. |
| 7. | The term “asymmetric game” is sometimes used in the literature to describe a Prisoner’s Dilemma in which all possible payoffs are unequal. The game presented here differs crucially from this in that the asymmetry is in strategies and not in payoffs. The asymmetric strategy Prisoner’s Dilemma game is sometimes termed a Prisoner’s Non-Dilemma [15]. However, in some instances, a Prisoner’s Non-Dilemma refers to Prisoner’s Dilemma game in which the dominant strategy is also the socially optimal strategy [54]. Unfortunately, plurality in terminology cannot be avoided in achieving meaningful and concise descriptions of the games in this experiment. It is, therefore, important that the games described in this paper are read as asymmetric (symmetric) strategy Prisoner’s Dilemma games, even when this is not made explicit in-text. |
| 8. | The payoffs, for the entire experiment, are denoted in Experimental Currency Tokens with one token equal to half a South African rand, which is equivalent to roughly 0.1 United States dollars. The players were unaware of the conversion rate until the experimental session concluded, therefore these values cannot be used to assess salience or dominance. As the players were not aware of the South African rand equivalent of each token, the text will refer to payoffs exclusively in terms of Experimental Currency Units. |
| 9. | The sequential play of the Prisoner’s Dilemma game makes it possible that the symmetric game had an impact on the decisions made in the subsequent asymmetric game. Budget constraints made it impossible for us to test order effects with sufficient sample size. While order effects might exist, so long as the order effects operate in the same way across our different treatments, which we have no reason to question, the order of play does not undermine our final results. |
| 10. | As Treatment One had no prior play, the announcement to players of the game to be selected, thus the treatment the session would be allocated to, was only made in Treatment Two and Treatment Three. |
| 11. | The hourly student tutoring rate is approximately one hundred rand per hour. |
| 12. | Seating randomisation was done manually and participants observed this. All other randomisation in the experiment was computerised (which participants were also informed of) and implemented automatically as the experiment progressed. |
| 13. | Players were made aware of the asymmetries in strategies in the asymmetric game at the beginning of this game. |
| 14. | No other context was provided and references to words such as “contributions”, “public” or “private” were deliberately avoided. Two examples were used to ensure the participants understood the structure of the game. Both examples were constructed such that the mechanism of the VCM was identical to that of the experiment, while paying due consideration to the possibility of anchoring players to the choices described in the examples. In both examples, groups of four fixed players allocated shares of their endowments to Account A or Account B and all earned identical income from Account B. Both examples had homogeneous endowments of twenty tokens for each player. The choice of twenty tokens as the homogeneous endowment was made deliberately as an endowment of twenty tokens is not possible in the experiment. In Example One, all four players contributed their entire endowment to Account B while, in Example Two, all group members contributed zero tokens to the public account. Following the examples, the independence of each player’s contribution to those made by their fellow group members as well as the endowment heterogeneity in the experiment were reiterated to the participants. |
| 15. | The random stranger matching of the groups in the public goods game precludes behaviour motives such as retribution or reciprocity. |
| 16. | Participants were asked to complete a questionnaire online before arriving for the session. This pre-session questionnaire elicited perceptions of the general trustworthiness of people using the common trust question; “In general, would you say that most people can be trusted?” In addition, participants were asked to indicate, from a limited list, the economics courses for which they had enrolled for at the university. Participants who failed to complete the questionnaire online completed the questionnaire immediately before the session started. This data is used as controls in all regressions presented in the paper as well as an addition control for whether a participant completed the questionnaire online or at beginning of the session. |
| 17. | The total number of participants across rows in the table does not sum to the total number of participants in the sample as each row represents pairwise comparisons of the treatments and not all three treatments together. |
| 18. | South Africa has its own unique history of the social, economic and political exclusion of particular groups. While this is an important topic, we did not design this experiment to focus on real-world experiences of exclusion of our subjects. We did not prime identity in the experiment, nor did we deliberately recruit according to identity group markers, and so do not wish to make too much of the differential response of individuals from different race groups. However, given the importance of identity in the South African setting, in all of our analysis, we control for race in order to deal with any potential confounds in our treatment variables of interest. We do not specifically report them in the regressions in the paper, but do report them in the set of regressions reported in Appendix A. |
| 19. | The results remain robust to the inclusion of round one data. |
| 20. | See Table A1 for an expanded list of reported key explanatory variables. |
| 21. | Student t-test for differences in mean endowment between socially included and excluded participants in Treatment Three are based on the number of participants as endowments are earned once and consistent across the rounds of play. |
| 22. | The appropriateness of the fixed effects model, as opposed to a random effects alternative, is supported by Hausman test with Chi-squared statistic of 39.27 and p = 0.00. |
| 23. | See Table A2 for expanded list of key co-variates. |
| 24. | The combination of decisions in the Prisoners’ Dilemma which would lead to each player’s endowment are shown in the column headed "Decision" in Table 6. |
| 25. | Additional key controls are reported in Table A3. |
Figure 1.
This figure shows the rates of cooperation in the Prisoners’ Dilemma Games of Treatment Two (symmetric agency) and Treatment Three (asymmetric agency) combined. The bar on the left-hand side shows cooperation in the symmetric PD and the bar on the right shows rates of cooperation in the asymmetric PD. Differences in the rates of cooperation are tested using the Wilcoxon Signed-Rank Test (z = −2.43; p = 0.02).

Figure 2.
This figure shows the average percentage share of endowment contributed by players in each treatment over the eight rounds of play.
Figure 2.
This figure shows the average percentage share of endowment contributed by players in each treatment over the eight rounds of play.

Table 1.
Prisoner’s Dilemma Payoffs.
| Outcome | Symmetric Payoffs | Asymmetric Payoffs |
|---|---|---|
| DD | 15;15 | - |
| CD | 10;40 | - |
| DC | 40;10 | 40;10 |
| CC | 30;30 | 30;30 |
Table 2.
Descriptive Statistics: Participant Characteristics.
| Treatment: Endowment Origin | ||||
|---|---|---|---|---|
| Variables | All | T2: Symmetric | T1: Random | |
| Age in years | 22.57 | 23.02 | 21.88 | ** |
| Female | 0.376 | 0.375 | 0.37 | |
| Black African | 0.62 | 0.73 | 0.61 | * |
| Coloured | 0.19 | 0.09 | 0.19 | * |
| Indian/Asian | 0.06 | 0.05 | 0.08 | |
| White | 0.06 | 0.02 | 0.09 | ** |
| Don’t trust strangers | 0.64 | 0.66 | 0.61 | |
| Game Theory Course | 0.17 | 0.18 | 0.09 | * |
| Participants | 292 | 88 | 108 | |
| Variables | All | T3: Asymmetric | T1: Random | |
| Age in years | 22.57 | 22.94 | 21.89 | * |
| Female | 0.376 | 0.44 | 0.37 | |
| Black African | 0.62 | 0.61 | 0.61 | |
| Coloured | 0.19 | 0.27 | 0.19 | |
| Indian/Asian | 0.06 | 0.04 | 0.08 | |
| White | 0.06 | 0.03 | 0.09 | * |
| Don’t trust strangers | 0.64 | 0.67 | 0.61 | |
| Game Theory Course | 0.17 | 0.25 | 0.09 | *** |
| Participants | 292 | 96 | 108 | |
| Variables | All | T3: Aymmetric | T2: Symmetric | |
| Age in years | 22.57 | 22.94 | 23.023 | |
| Female | 0.376 | 0.44 | 0.38 | |
| Black African | 0.62 | 0.61 | 0.73 | |
| Coloured | 0.19 | 0.27 | 0.09 | *** |
| Indian/Asian | 0.06 | 0.04 | 0.05 | |
| White | 0.06 | 0.03 | 0.02 | |
| Don’t trust strangers | 0.64 | 0.67 | 0.66 | |
| Game Theory Course | 0.17 | 0.25 | 0.18 | |
| Participants | 292 | 96 | 88 | |
*** p < 0.00; ** p < 0.05; * p < 0.10.
Table 3.
Descriptive Statistics: Experimental Data.
| Treatment: Endowment Origin | |||
|---|---|---|---|
| Variables | All | T1: Random | T2: Symmetric |
| Sum of group endowments | 101.44 | 101.67 | 91.36 |
| Gini Coefficient | 0.18 | 0.19 | 0.19 |
| Endowment | 25.36 | 25.42 | 22.84 |
| Observations | 292 | 108 | 88 |
| All | T1: Random | T3: Asymmetric | |
| Sum of group endowments | 101.44 | 101.67 | 110.42 |
| Gini Coefficient | 0.18 | 0.19 | 0.17 |
| Endowment | 25.36 | 25.42 | 27.60 |
| Observations | 292 | 108 | 96 |
| All | T2: Symmetric | T3: Asymmetric | |
| Sum of group endowments | 101.44 | 91.36 | 110.42 |
| Gini Coefficient | 0.18 | 0.19 | 0.17 *** |
| Endowment | 25.36 | 22.84 | 27.60 *** |
*** p < 0.00; ** p < 0.05; * p < 0.10.
Table 4.
Treatment Effects of Aggregate Social Asymmetries.
| Variables | (1) | (2) | (3) |
|---|---|---|---|
| T2: Symmetric | −14.40 *** | −15.63 *** | −4.13 |
| (4.03) | (4.16) | (9.80) | |
| T3: Asymmetric | −11.11 *** | −12.11 *** | −20.37 ** |
| (3.74) | (3.93) | (10.01) | |
| Endowment | −0.44 *** | −0.47 *** | −0.41 * |
| (0.16) | (0.17) | (0.24) | |
| Round | −1.24 *** | −2.01 *** | −2.01 *** |
| (0.31) | (0.35) | (0.35) | |
| Group Endowment | −0.06 | −0.07 | −0.06 |
| (0.07) | (0.07) | (0.07) | |
| Don’t trust strangers | −6.73 * | −7.91 ** | −8.15 ** |
| (3.84) | (3.95) | (3.90) | |
| Endowment in Symmetric (T2) | - | - | −0.48 |
| (0.31) | |||
| Endowment in Asymmetric (T3) | - | - | 0.31 |
| (0.35) | |||
| Constant | 75.08 *** | 82.75 *** | 82.48 *** |
| (8.63) | (8.84) | (9.33) | |
| Observations | 2096 | 1834 | 1834 |
| R-squared | 0.12 | 0.14 | 0.15 |
*** p < 0.00; ** p < 0.05; * p < 0.10.
Table 5.
Distribution and Endowments of Socially Excluded by Treatment.
| Socially Included | Socially Excluded | ||
|---|---|---|---|
| Treatment One: Random | |||
| Endowment | 25.42 | - | |
| Observations | 756 | 0 | |
| Participants | 108 | 0 | |
| Treatment Two: Symmetric | |||
| Endowment | 22.84 | - | |
| Observations | 616 | 0 | |
| Participants | 88 | 0 | |
| Treatment Three: Asymmetric | |||
| Endowment | 34.79 | 20.42 | *** |
| Observations | 336 | 336 | |
| Participants | 48 | 48 | |
*** p < 0.00.
Table 6.
Effects of Individual Social Exclusion.
| Variables | OLS (1) | OLS (2) | Group Fixed Effects |
|---|---|---|---|
| Socially Excluded | −15.04 *** | −23.08 ** | −18.22 * |
| (4.79) | (10.53) | (10.66) | |
| Endowment | −0.62 *** | −0.67 *** | −0.63 *** |
| (0.18) | (0.19) | (0.16) | |
| Endowment and socially excluded | - | 0.38 | 0.53 |
| (0.45) | (0.37) | ||
| Don’t trust strangers | −7.85 ** | −8.09 ** | −10.68 *** |
| (3.92) | (3.93) | (3.17) | |
| Round | −2.01 *** | −2.01 *** | −2.01 *** |
| (0.35) | (0.35) | (0.35) | |
| Constant | 71.50 *** | 72.04 *** | 74.50 *** |
| (13.03) | (12.93) | (7.67) | |
| Observations | 1834 | 1834 | 1834 |
| R-squared | 0.14 | 0.14 | 0.39 |
*** p < 0.00; ** p < 0.05; * p < 0.10.
Table 7.
Effects of the Origins of Wealth Heterogeneity.
| Decision | Variables | T1: Random | T2: Symmetric | T3: Asymmetric |
|---|---|---|---|---|
| DD | Fifteen token endowment | −2.19 | −8.72 | - |
| (8.06) | (10.36) | |||
| CC | Thirty token endowment | −4.38 | −17.20 * | −3.32 |
| (7.85) | (10.08) | (8.88) | ||
| DC | Forty token endowment | −4.53 | −35.01 *** | −1.92 |
| (8.41) | (10.60) | (11.12) | ||
| Don’t trust strangers | −2.16 | −10.53 | −15.10 ** | |
| (6.32) | (8.96) | (7.29) | ||
| Round | −2.09 *** | −2.17 *** | −1.79 *** | |
| (0.65) | (0.54) | (0.62) | ||
| Observations | 651 | 574 | 609 | |
| R-squared | 0.14 | 0.21 | 0.16 |
*** p < 0.00; ** p < 0.05; * p < 0.10.
© 2018 by the authors. Licensee MDPI, Basel, Switzerland. This article is an open access article distributed under the terms and conditions of the Creative Commons Attribution (CC BY) license (http://creativecommons.org/licenses/by/4.0/).
Share and Cite
MDPI and ACS Style
Njozela, L.; Burns, J.; Langer, A. The Effects of Social Exclusion and Group Heterogeneity on the Provision of Public Goods. Games 2018, 9, 55. https://doi.org/10.3390/g9030055
AMA Style
Njozela L, Burns J, Langer A. The Effects of Social Exclusion and Group Heterogeneity on the Provision of Public Goods. Games. 2018; 9(3):55. https://doi.org/10.3390/g9030055
Chicago/Turabian StyleNjozela, Lindokuhle, Justine Burns, and Arnim Langer. 2018. "The Effects of Social Exclusion and Group Heterogeneity on the Provision of Public Goods" Games 9, no. 3: 55. https://doi.org/10.3390/g9030055
Note that from the first issue of 2016, this journal uses article numbers instead of page numbers. See further details here.