Characterizing Actions in a Dynamic Common Pool Resource Game


Worcester Polytechnic Institute (WPI), Worcester, MA 01609, USA
*
Author to whom correspondence should be addressed.
Games 2018, 9(4), 101; https://doi.org/10.3390/g9040101
Submission received: 10 November 2018
/
Revised: 7 December 2018
/
Accepted: 10 December 2018
/
Published: 13 December 2018
Abstract
:We conducted a dynamic common pool resource experiment and found large differences among groups in the total benefits (surplus) obtained from the resource. To shed light on the factors underlying the differences, we characterized individual appropriation decisions as irresponsible, sustainable, or constructive, and defined a measure of the intensity of such actions. We then examined the relationships between group-level success and the frequency and intensity of the individual actions, finding that the average intensity of irresponsible actions was the best predictor of group success. We interpreted this as suggestive evidence that policies aimed at preserving and maximizing the benefits of renewable resources should above all else aim to reduce the intensity of irresponsible actions.
1. Introduction
Early common pool resource experiments tended to implement repeated, static games in which the size of the resource stock was the same in every round [1,2,3]. By contrast, the management of many common pool resources (especially renewable ones, such as fish) is inherently dynamic. As a result, researchers have begun using resource stocks that evolve over time [4,5,6,7,8,9,10]. However, the focus is often on the exogenous factors affecting group-level outcomes rather than on individual decisions.1
We focused on individual actions by characterizing them based on how they affect the size of the resource stock. Specifically, we characterized actions as irresponsible, sustainable, or constructive, and defined a measure of their intensity. We then examined how group earnings related to the frequency and intensity of the actions, finding that the average intensity of irresponsible actions is the best predictor of group earnings.
Our results, therefore, suggest that when it comes to predicting group success using individual appropriation decisions, differences along the intensive margins are of greater importance than differences along the extensive margins. We also suggested a potentially fruitful target for policy: Reducing the intensity of irresponsible actions. Such policies potentially include the implementation of punishment and/or communication mechanisms, which Ostrom, Walker, and Gardner long ago found to be effective, though in a repeated, static environment [8].
We contribute to the previous experimental economics literature in three primary ways. First, we present a way of classifying appropriation decisions based on how they affect the resource stock. Second, we provide the first analysis we are aware of on how group earnings relate to the frequencies and intensities of individual actions. Finally, we suggest a target for policy aimed at increasing the benefits of dynamic common pool resources.
More broadly, we tie to the research on social dilemmas, including Elinor Ostrom’s work on collective action [11]. She made a distinction between people who are “rational egoists” (self-interested) and those who are conditional cooperators (will cooperate if others do). While we mainly focused on classifying actions, rather than people, Ostrom’s “egoists” would choose irresponsible actions in our study, and her conditional cooperators could behave irresponsibly, sustainably, or constructively, depending on their beliefs about what others will do.
2. Experiment
We conducted a 20 round common pool resource game that subjects completed in randomly assigned, fixed groups of four.2 In each round, each subject made an appropriation decision by choosing how many lab dollars (LD; 1 LD = 0.25 USD) to “withdraw” from the “account”.3
If the sum of the four withdrawals was less than or equal to the account balance (the resource stock), each subject received their withdrawal. If the sum was larger, then the balance was divided as follows: All group members began “consuming” the balance at an equal rate until each had obtained their withdrawal, or the account ran out, whichever happened first (for each subject). If a group exhausted the account, the game was over, regardless of how many rounds had occurred.
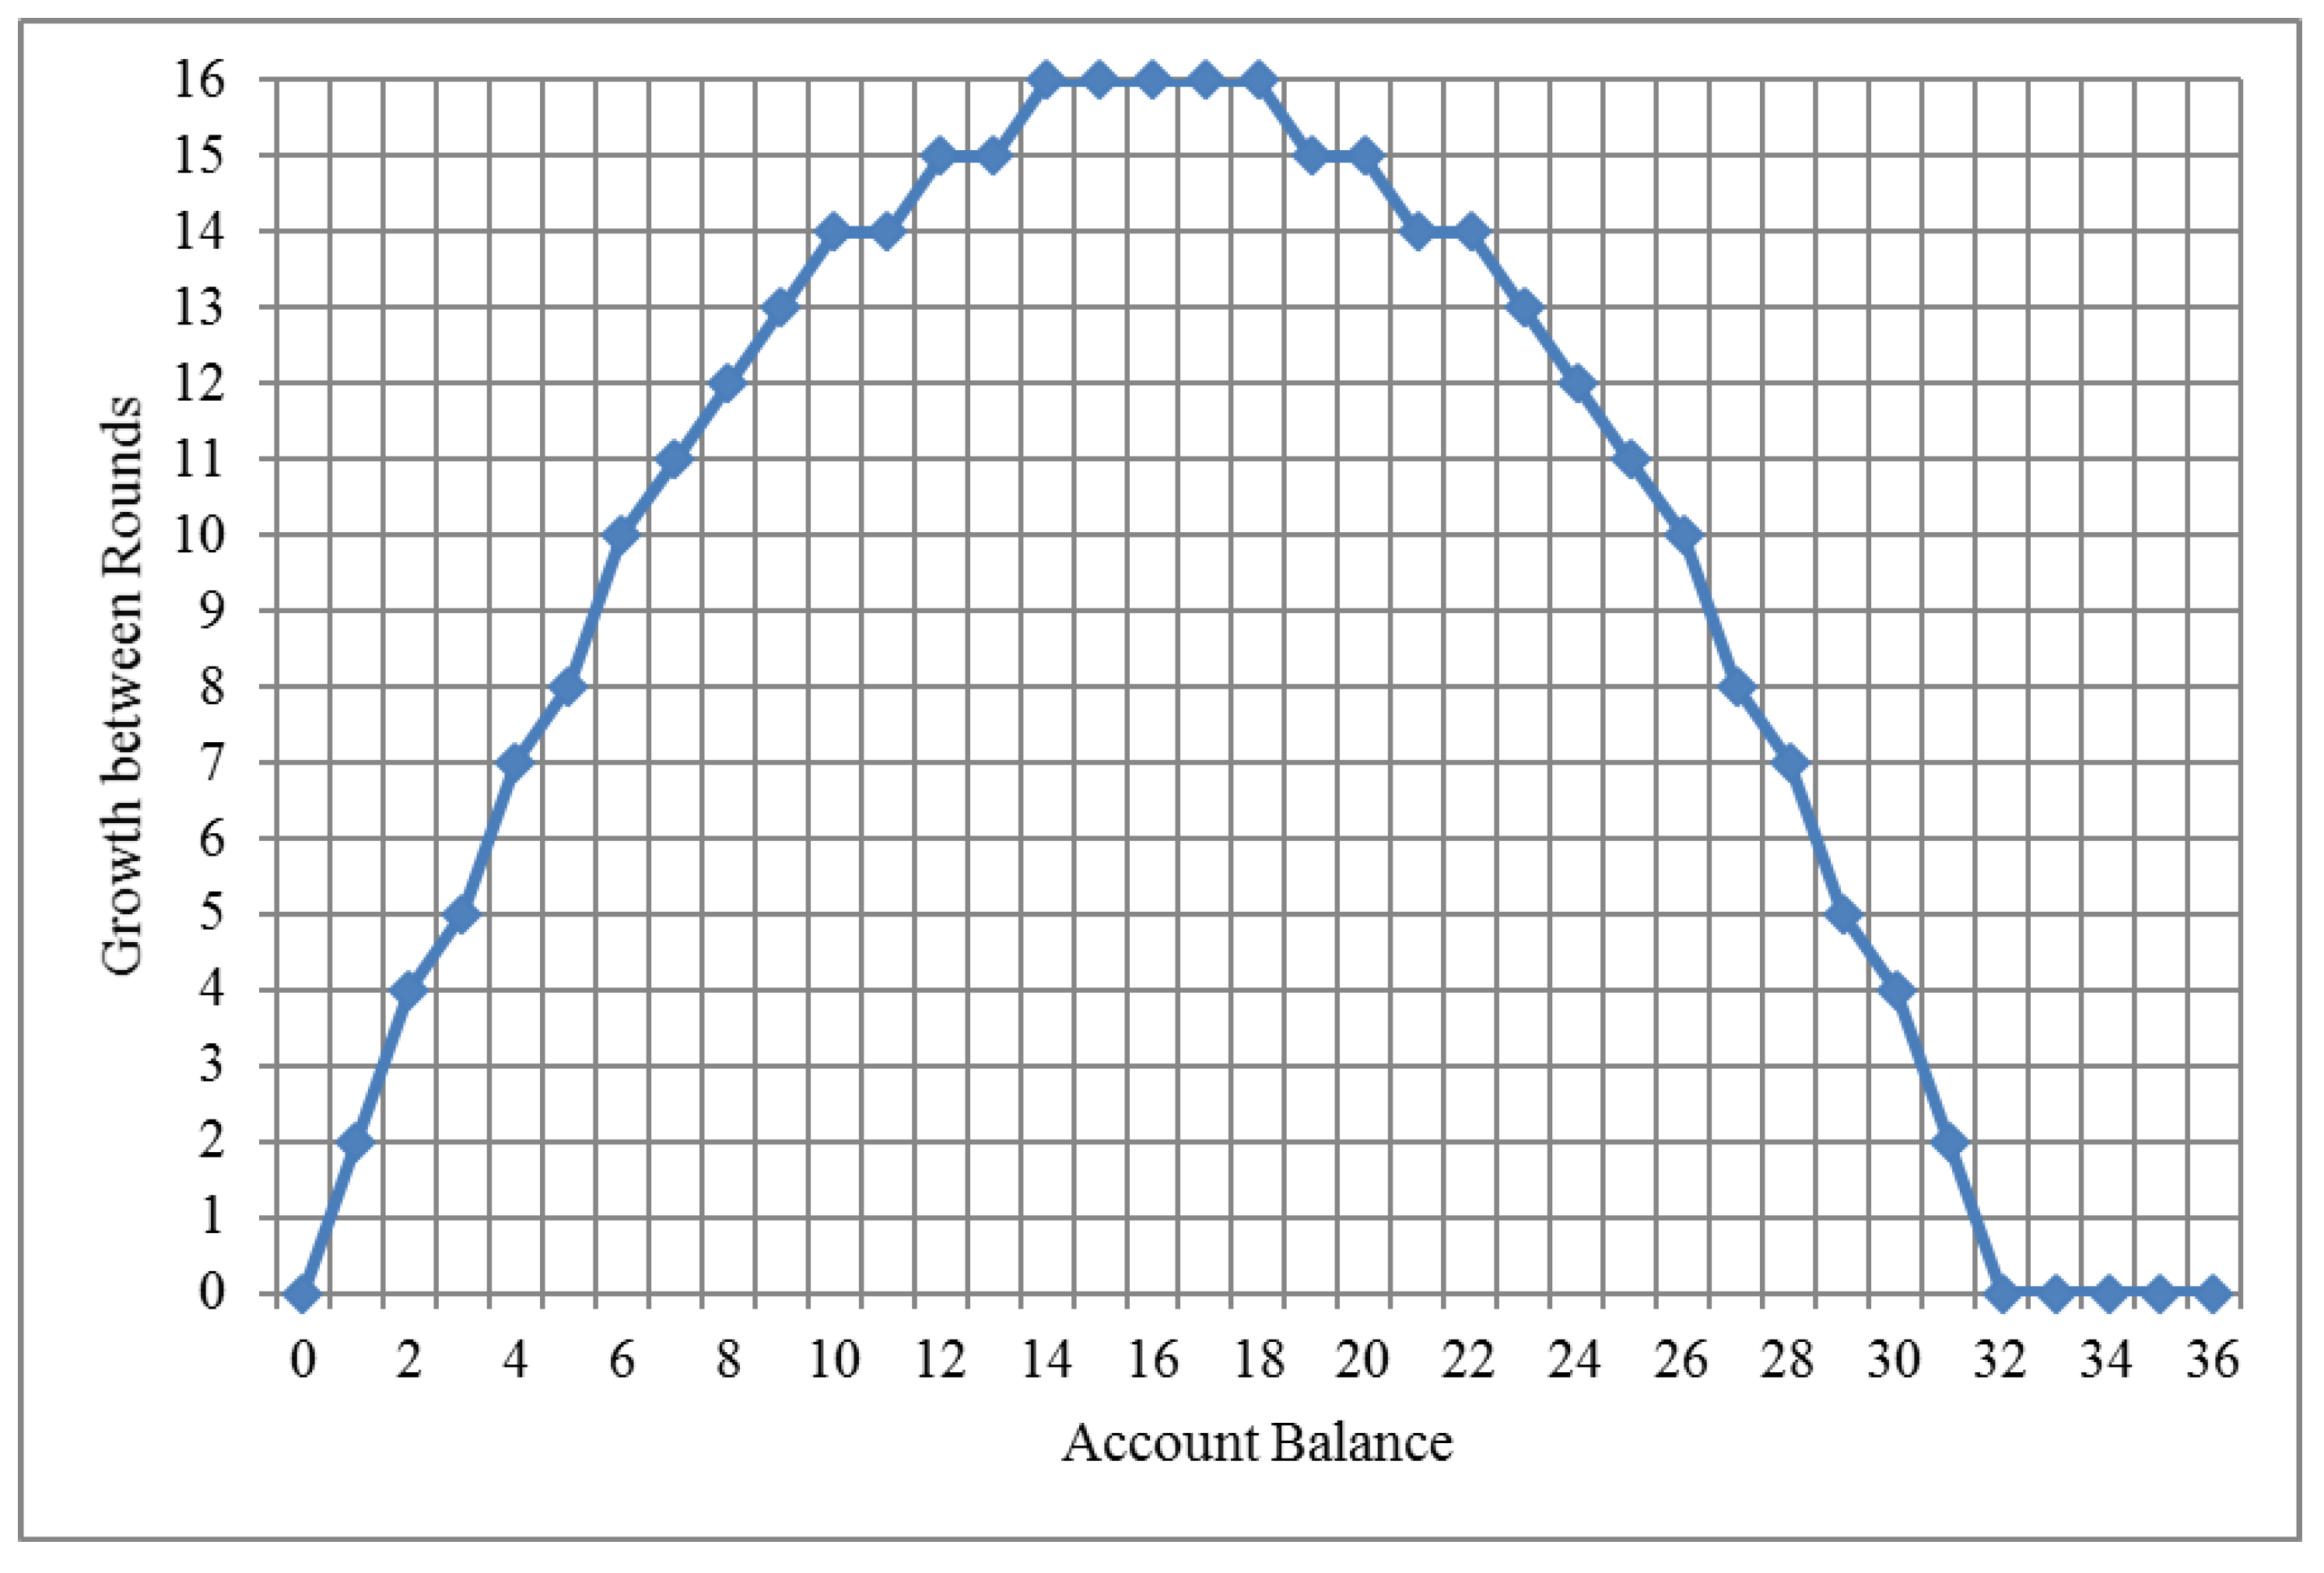
Between rounds, the resource grew following the growth function in Figure 1. As in References [6,7,10], growth is logistic, making growth a function of the stock size an inverted parabola (we use a discrete approximation). Logistic growth captures the growth of many natural species quite well: Growth is initially increasing in the stock size to reflect increased reproduction, but this happens at a decreasing rate because the size of the ecosystem is finite. Beyond the peak of the parabola (the maximum sustainable yield), nearing the carrying capacity of the ecosystem made growth decrease in stock size. Examples of natural species that exhibit such growth range from yeast in a petri dish to fish stocks to herds of antelope. We favored this approach to modeling growth for its ecological validity, and to the extent that results could depend on how we modeled growth, we argue that it is best to choose the growth function carefully.
We included a graph of the growth function in the instructions to help subjects to understand the dynamics of the game. Growth is maximized when the account balance is between 14 and 18 LD. The account balance starts at 32 LD. If subjects repeatedly withdrew an average of 5 LD (the middle of the action space), they would exhaust the stock in round 3.
At the end of each round, subjects received the following feedback: (1) The amounts that they received (usually their withdrawals, but the amounts could be less if the account was exhausted), (2) the total amount withdrawn from the account (by the four group members), and (3) the new account balance. Then, the account grew, and the next round began by showing subjects the new account balance. The game ended at the conclusion of round 20, or the exhaustion of the stock, whichever happened first.
2.1. The Subgame Perfect Nash Equilibrium (SPNE) and Social Optimum
The game is solvable by backward induction. Under the traditional assumption of individual wealth maximization, the SPNE is everyone always withdrawing the maximum (10 LD). The outcome is that all players choose withdrawals of 10 LD in round 1, the 32 LD account balance is divided evenly (8 LD each), and the account is exhausted. The problem for conservation is that it is never individually optimal to show restraint if the gains (in terms of account growth) will be 75% appropriated by others.
The set of socially optimal outcomes involves maintaining maximum growth until the last round and then exhausting the stock, achieving a total surplus of LD for the group, or an average of 84 LD per player, not necessarily shared equally.
Note that we did not expect to observe either the Nash or socially optimal outcomes. They were not hypotheses or predictions for the experiment. We viewed them simply as useful benchmarks of which to be aware when examining the data.
2.2. Characterizing Individual Actions
To develop hypotheses regarding how group-level outcomes (earnings) related to individual actions, we found it helpful to characterize the actions precisely. We first defined each possible action as irresponsible, sustainable, or constructive.
Definition 1.
An action (or withdrawal)is irresponsible ifand, whereis the growth of the resource (account balance) as a function of the stock and is the stock before the withdrawals.
Irresponsible actions are such that if everyone mimicked the same action, the total amount withdrawn would be larger than the amount by which the stock would subsequently grow. Irresponsible actions decrease the size of the stock and have the potential to exhaust it if they are sufficiently prevalent for a sufficient number of rounds. As an example, if the stock is 32 LD, withdrawing 5 LD is irresponsible because (see Figure 1).
The exception is that if a larger withdrawal helps to bring the stock down to the maximum sustainable yield, the action is not irresponsible. For example, if the stock is 36 LD, a withdrawal of 5 LD is not irresponsible because it helps to achieve the maximum sustainable yield. It is for this reason that we add the condition that for the action to be irresponsible.
Definition 2.
An actionis sustainable ifor.
Sustainable actions are such that if everyone took the same action, the stock would subsequently grow by the total amount withdrawn. They maintain the stock size and do not contribute to exhaustion. For example, if the stock is 20 LD, withdrawing 3 LD is sustainable because .
The exception is that any action that contributes to leaving the stock at or above the maximum sustainable yield is also sustainable (e.g., withdrawing 5 LD from a stock of 36 LD).
Definition 3.
An actionis constructive if.
Constructive actions are such that if everyone took the same action, the stock would grow by more than the total amount withdrawn. They increase the stock size and prevent exhaustion. If the stock is 20 LD, withdrawing 2 LD is constructive because .
Now that we have definitions of irresponsible, sustainable, and constructive actions, it is useful to recognize that irresponsible and constructive actions can be of different intensities. As a result, we next define intensity.
Definition 5.
The intensity of an actionis, where is the maximum possible withdrawal that satisfies either of the conditions of a sustainable action (given by Definition 2) for the stock size .
We divide the difference between the withdrawal and the maximum sustainable amount by the stock to control for the stock size, capturing the idea that it is more serious to take extra units when the stock is low. The intensities of irresponsible (constructive) actions are positive (negative). If someone withdraws 5 LD when the sustainable withdrawal is 4 LD and the stock size is 32 LD, . If , , and , .
2.3. Hypotheses
We are now in a position to discuss how we expected each type of action and intensity (at the individual level) to affect group-level outcomes (in terms of total group earnings). We should say that our hypotheses were intuitive, and we do not claim that we were setting out to provide evidence on partial effects that were unexpected. Our objective was different. We aimed to determine how much support we would find for each of the hypotheses, and then to examine the hypotheses against each other in terms of explanatory power for group earnings. More specifically, we wanted to see if differences in group-level outcomes were better explained by variations in individual actions along the extensive (frequency) or intensive (intensity) margins.
Hypothesis 1.
Group earnings are negatively related to the frequency of irresponsible actions.
We expected groups with higher frequencies of irresponsible actions, on average, to have lower resource stocks, experience lower resource growth, exhaust their resources more quickly, and generally obtain lower earnings.
Hypothesis 2.
Group earnings are positively related to the frequency of sustainable actions.
We expected groups with higher frequencies of sustainable actions, on average, to have higher resource stocks, experience higher regeneration, exhaust their stocks later in the sequence of rounds, or not at all, and generally obtain higher total earnings.
Hypothesis 3.
Group earnings are positively related to the frequency of constructive actions.
We expected groups with higher frequencies of constructive actions (all else equal) to obtain higher total earnings for the same reasons as our rationale for Hypothesis 2.
Hypothesis 4.
Group earnings are negatively related to the average intensity of irresponsible actions ().
We expected that if we calculated the average intensity of irresponsible actions for each group (over all four players and rounds in the sequence), groups with a higher average intensity of irresponsible actions would have lower total earnings. More specifically, we expected that groups with higher average intensities of irresponsible actions would have lower resource stocks, experience lower regeneration, exhaust their stocks more quickly, and thus, earn lower amounts.
Hypothesis 5.
Total group earnings are positively related to the average intensity of constructive actions ().
Hypothesis 5 is the opposite of Hypothesis 4, and we expected the same rationale to apply.
3. Results
We programmed and conducted the experiment at Worcester Polytechnic Institute’s Experimental Economics Laboratory using the experiment software z-Tree [12]. All subjects were undergraduates at our school. Sessions lasted about 45 min and average total earnings were $15.49 (61.97 LD).
We ran eight sessions with eight subjects, for a total of 64 subjects, or 16 groups. Since the game was limited to 20 rounds, we could potentially have had 1280 appropriation decisions. However, many groups exhausted the resource before the final round, making the total number of decisions 1164.
3.1. Summary Statistics and Trends
We provide some basic summary statistics in Table 1. The average withdrawal and amount received were 3.16 and 3.10 LD. Conditional on having a positive stock from which to withdraw something, the average withdrawal and amount received were 3.46 and 3.41 LD. The frequencies of irresponsible, sustainable, and constructive withdrawals were 41.8%, 23.5%, and 34.7%. Average withdrawal intensity, which we define as a withdrawal minus the sustainable withdrawal for the current stock size, all divided by the stock, was 0.01. We also provide the average intensities of the irresponsible and constructive withdrawals.
As far as group-level statistics, the average stock at the end of each round and growth between rounds were 9.09 and 11.41 LD. If we once again condition on the stock being positive at the start of the round, the averages were 10.00 and 12.61 LD. We also list information on earnings, and on the frequency and intensity of the different behaviors at the group level.
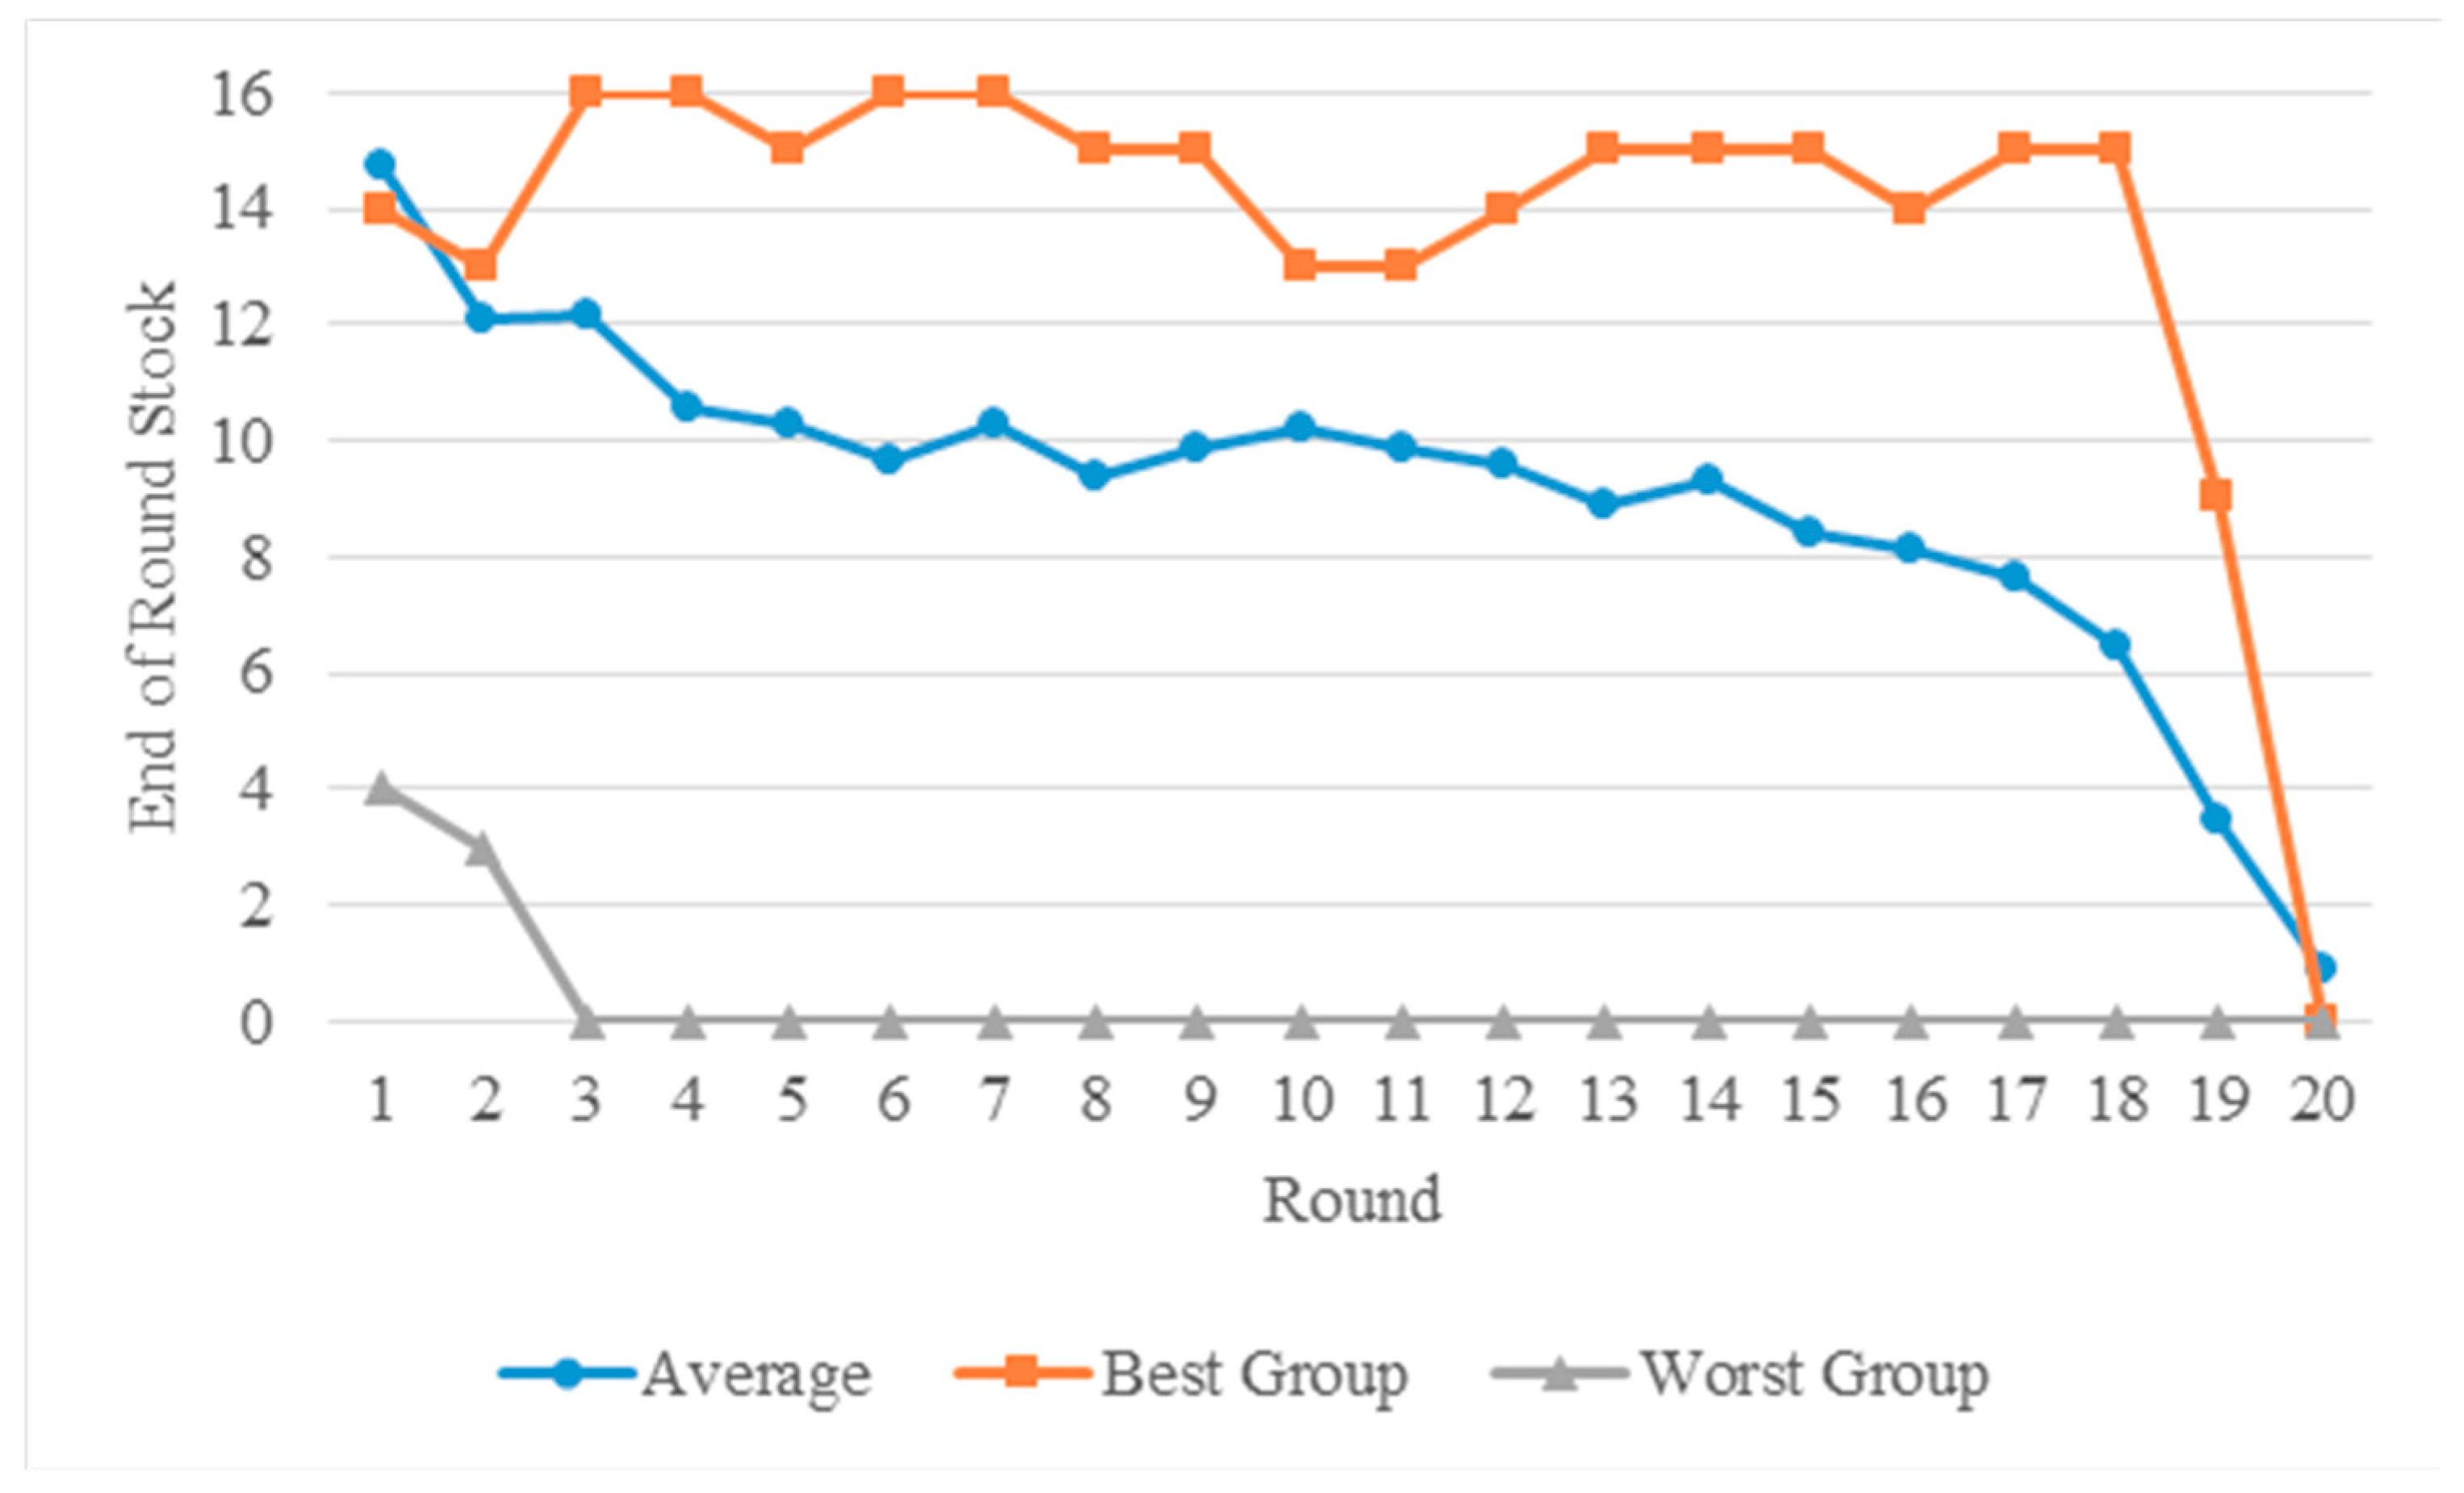
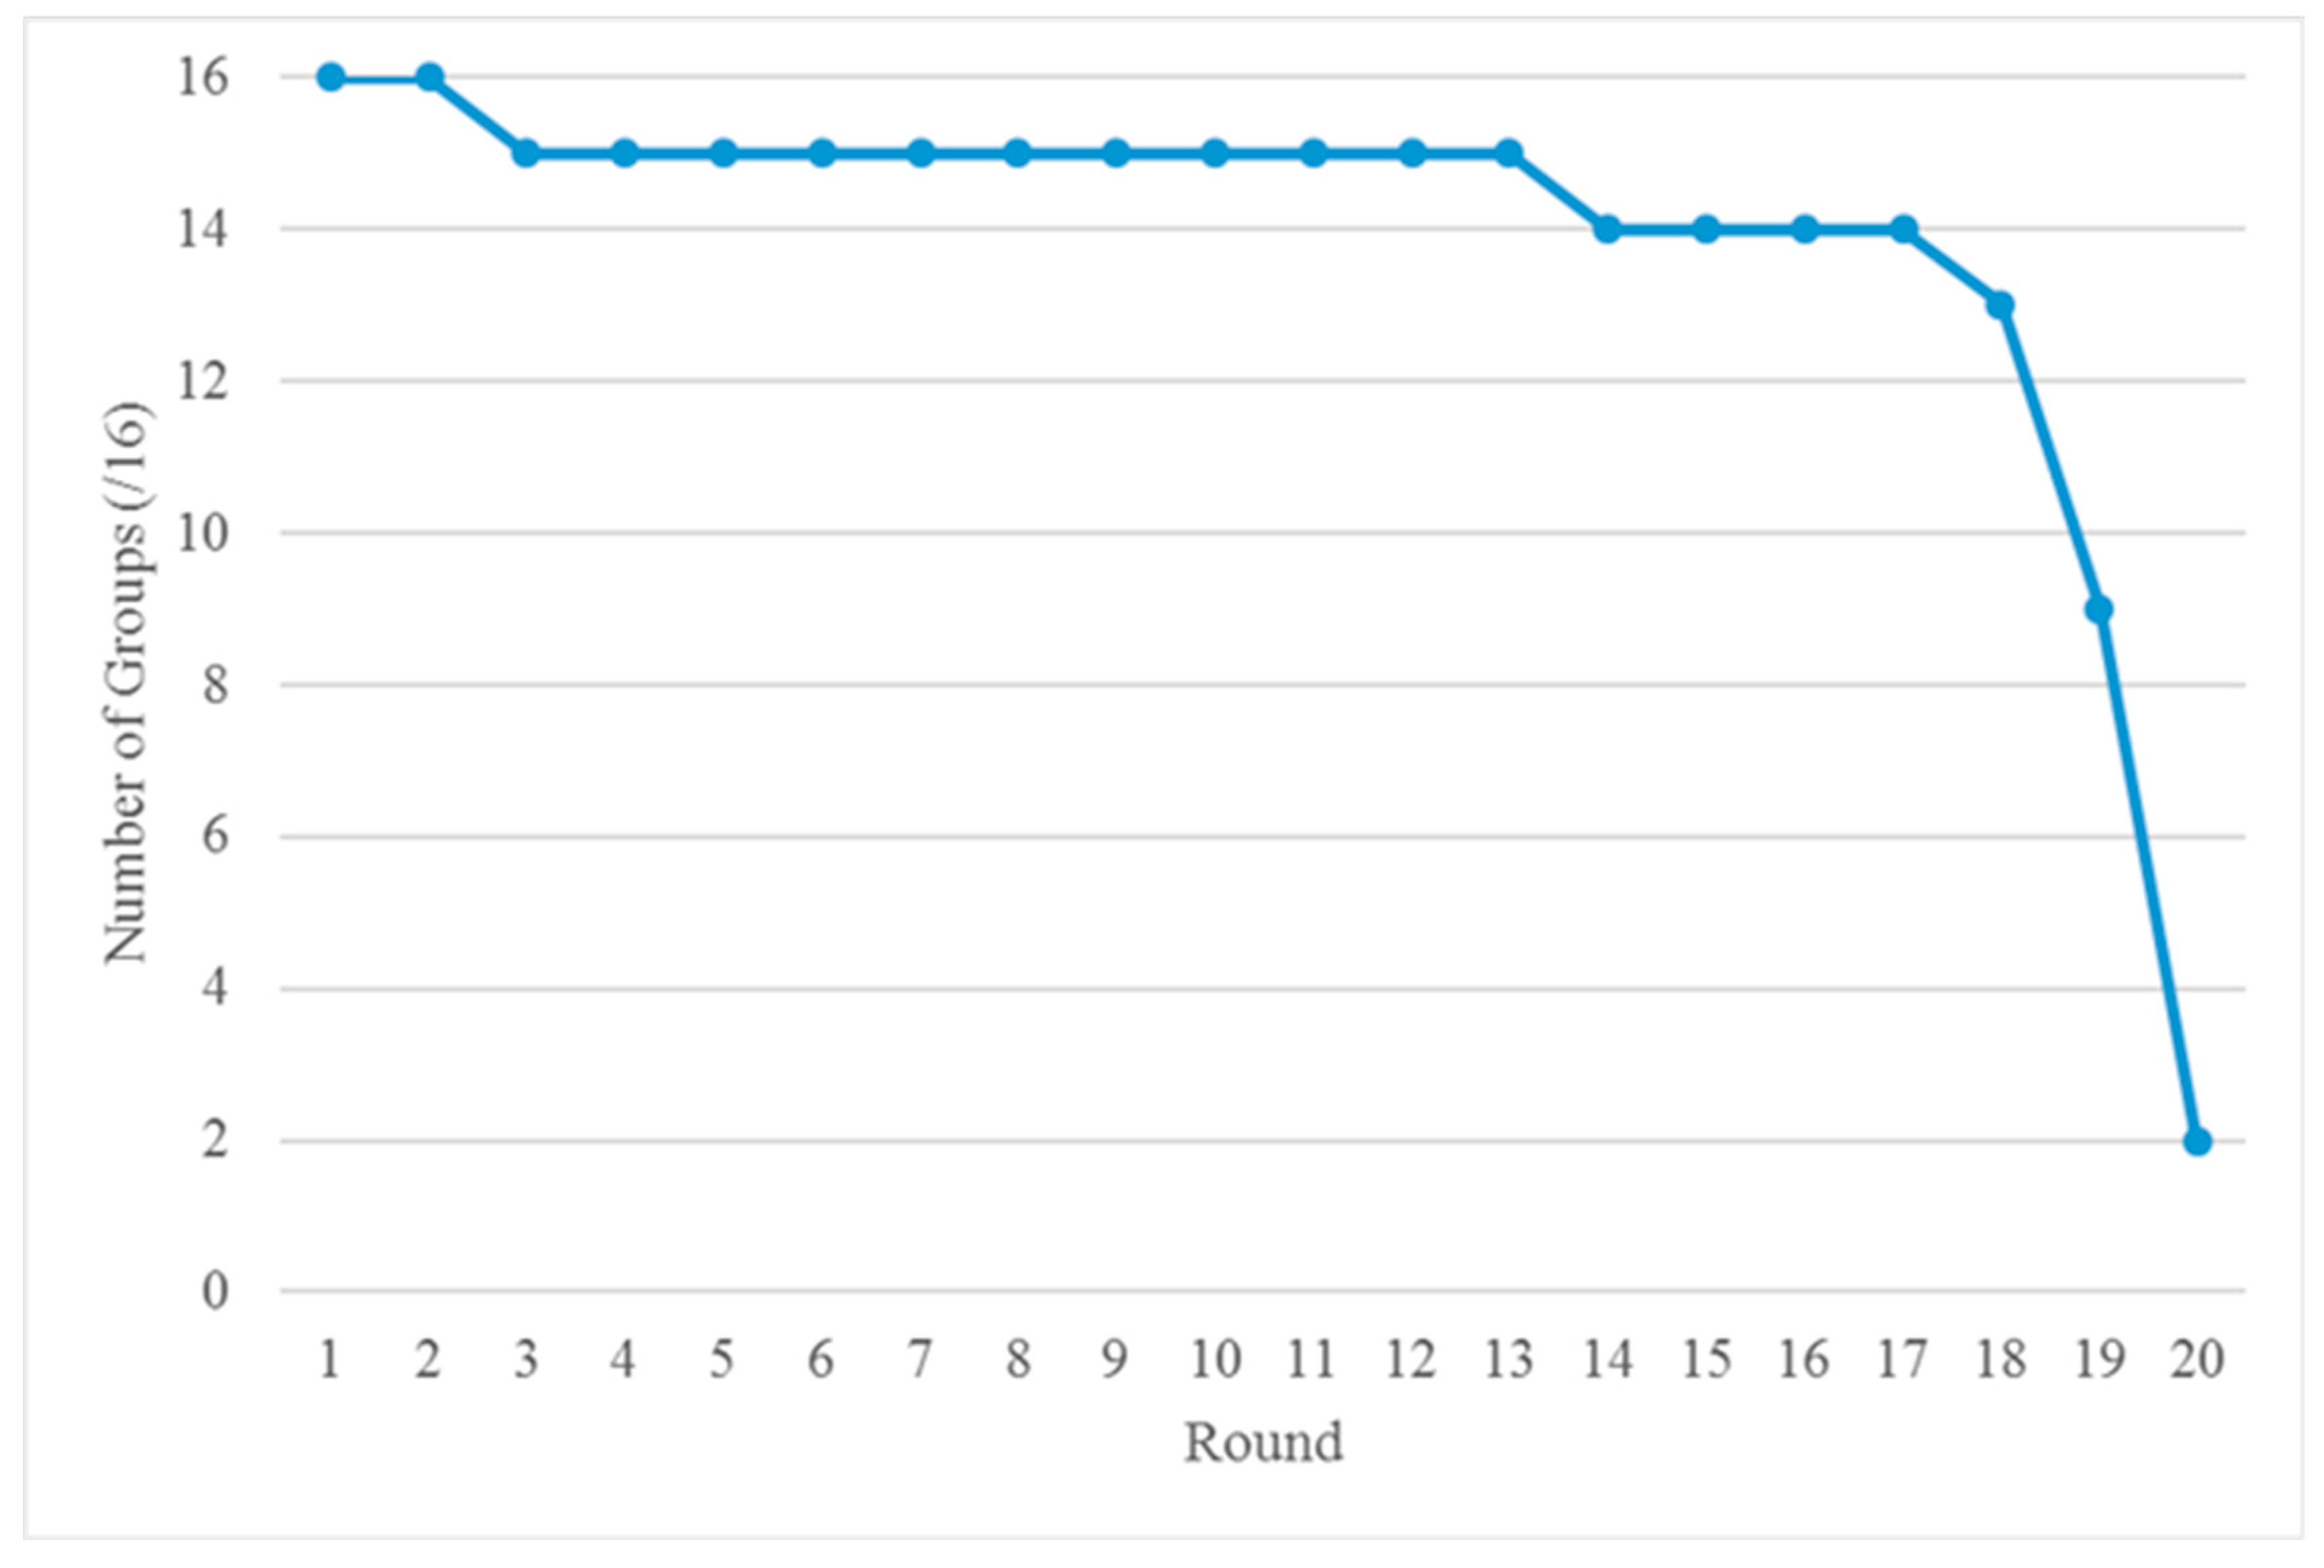
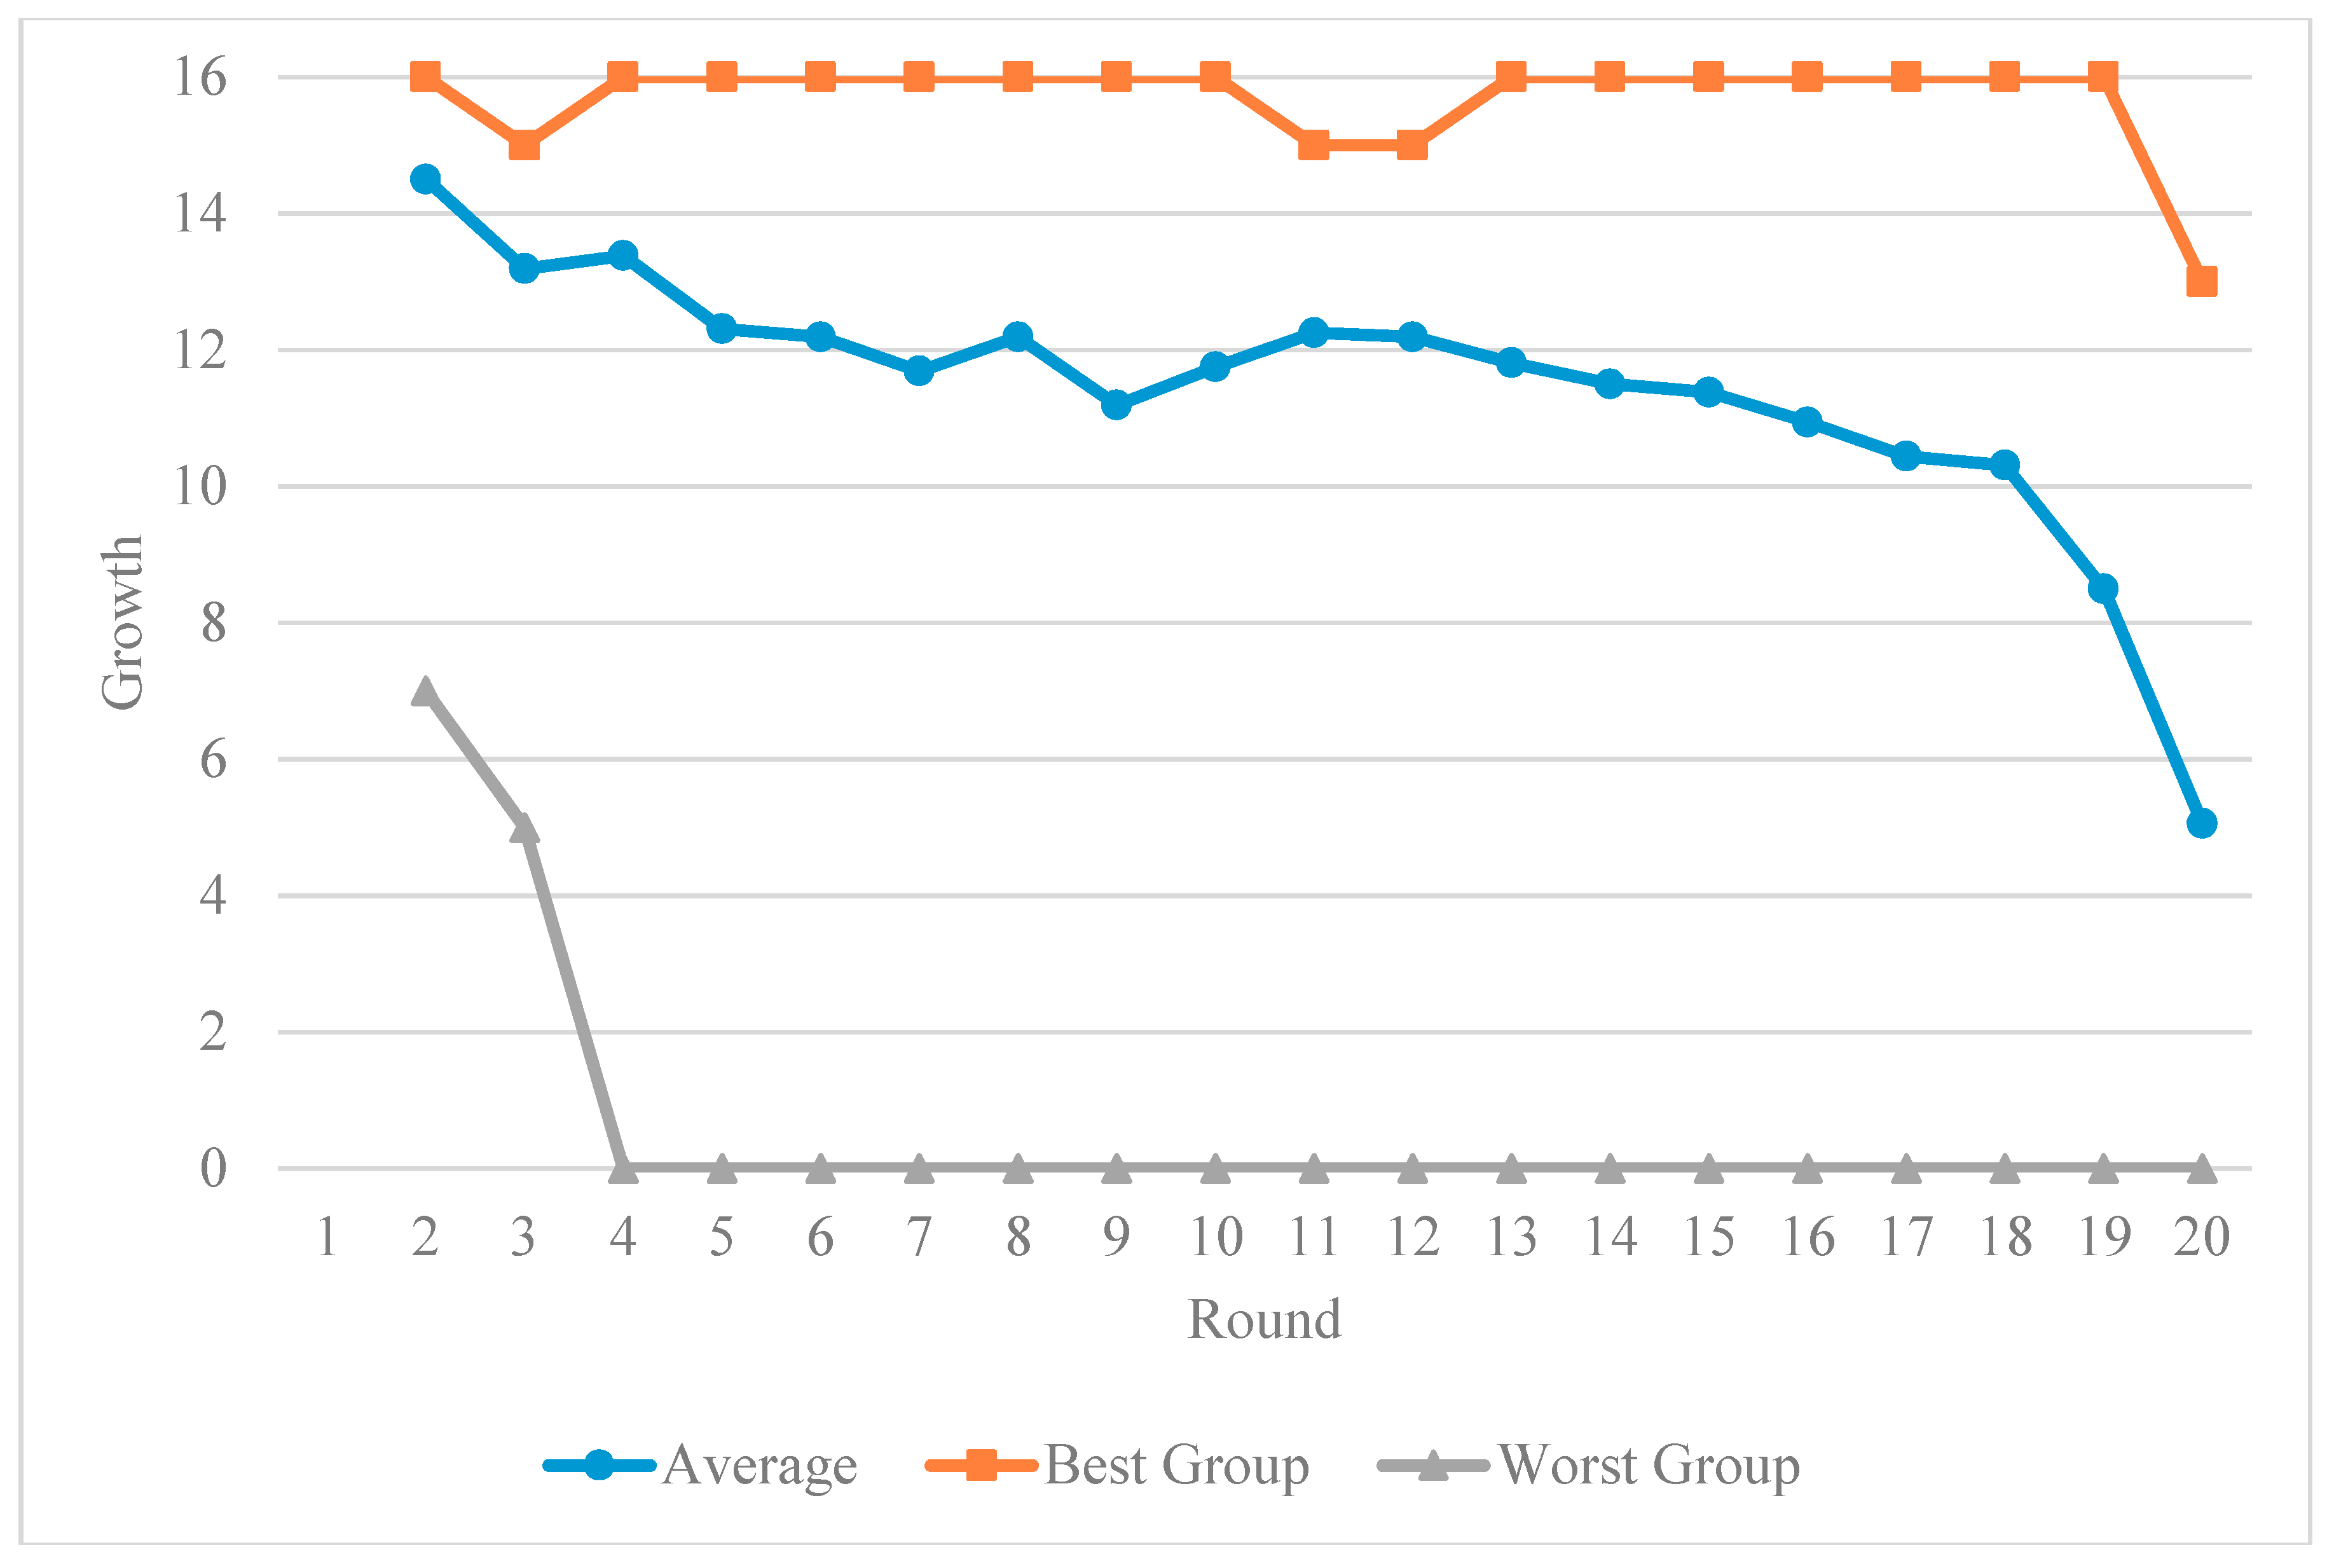
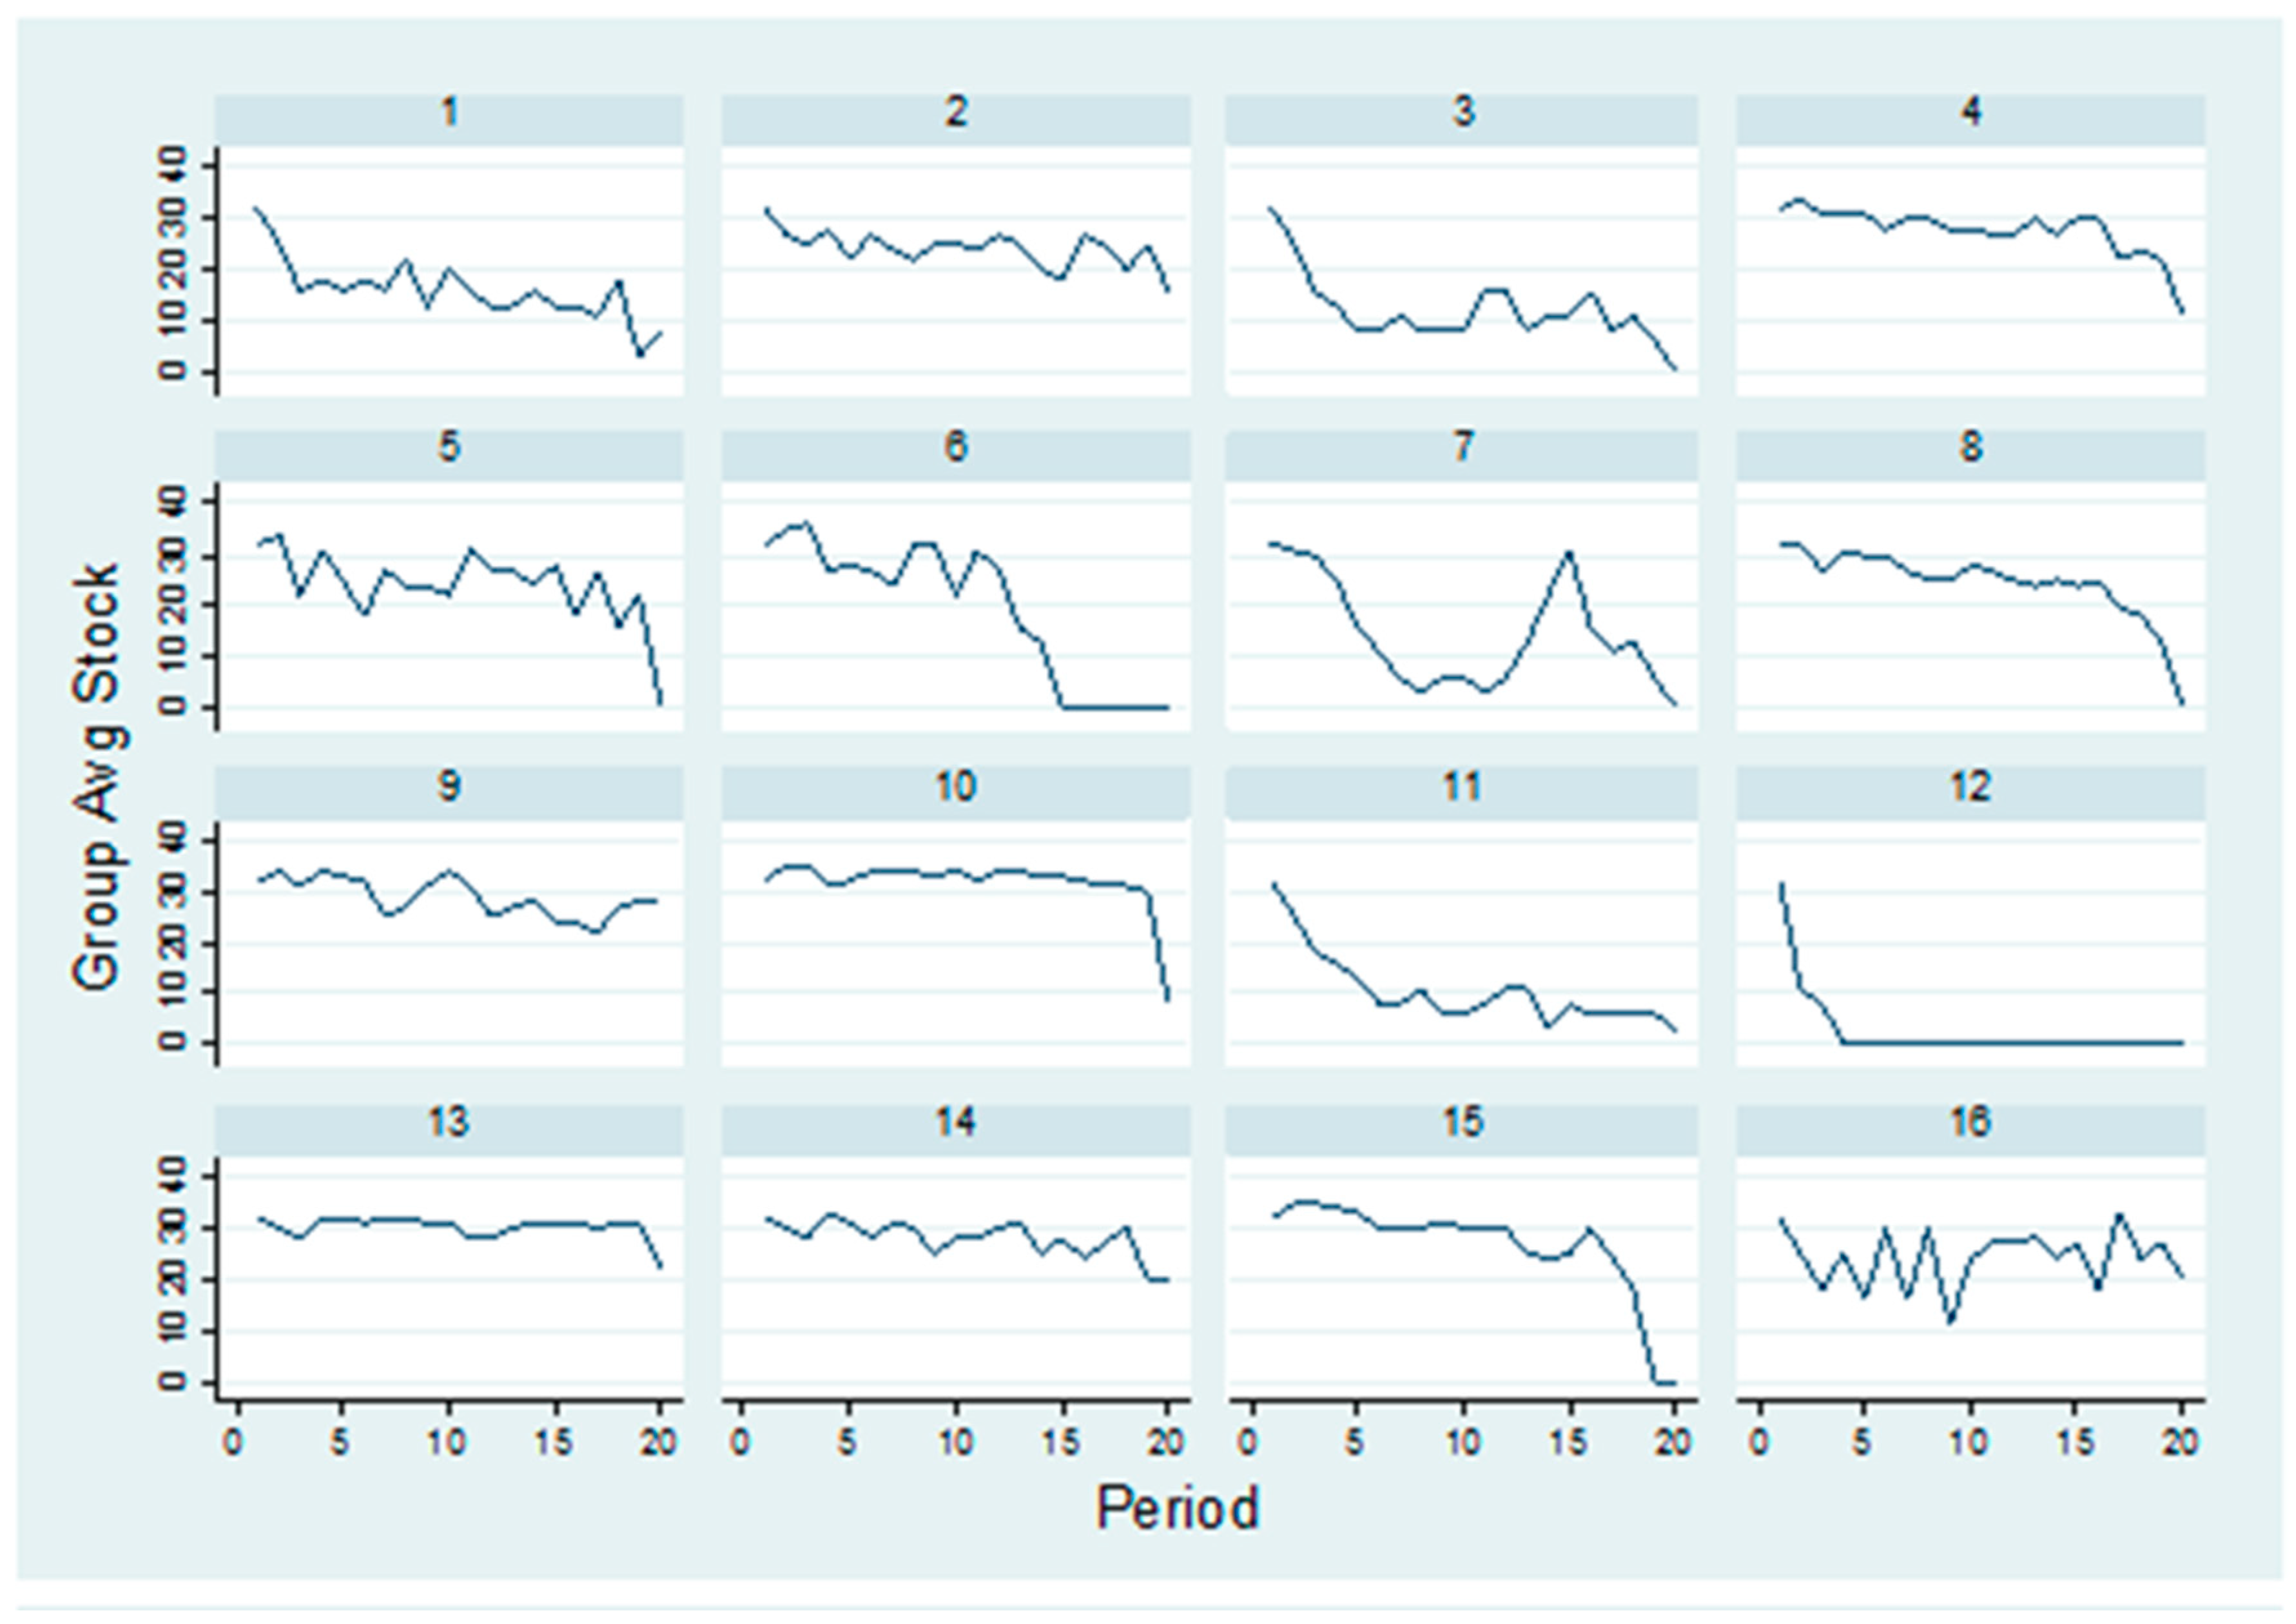
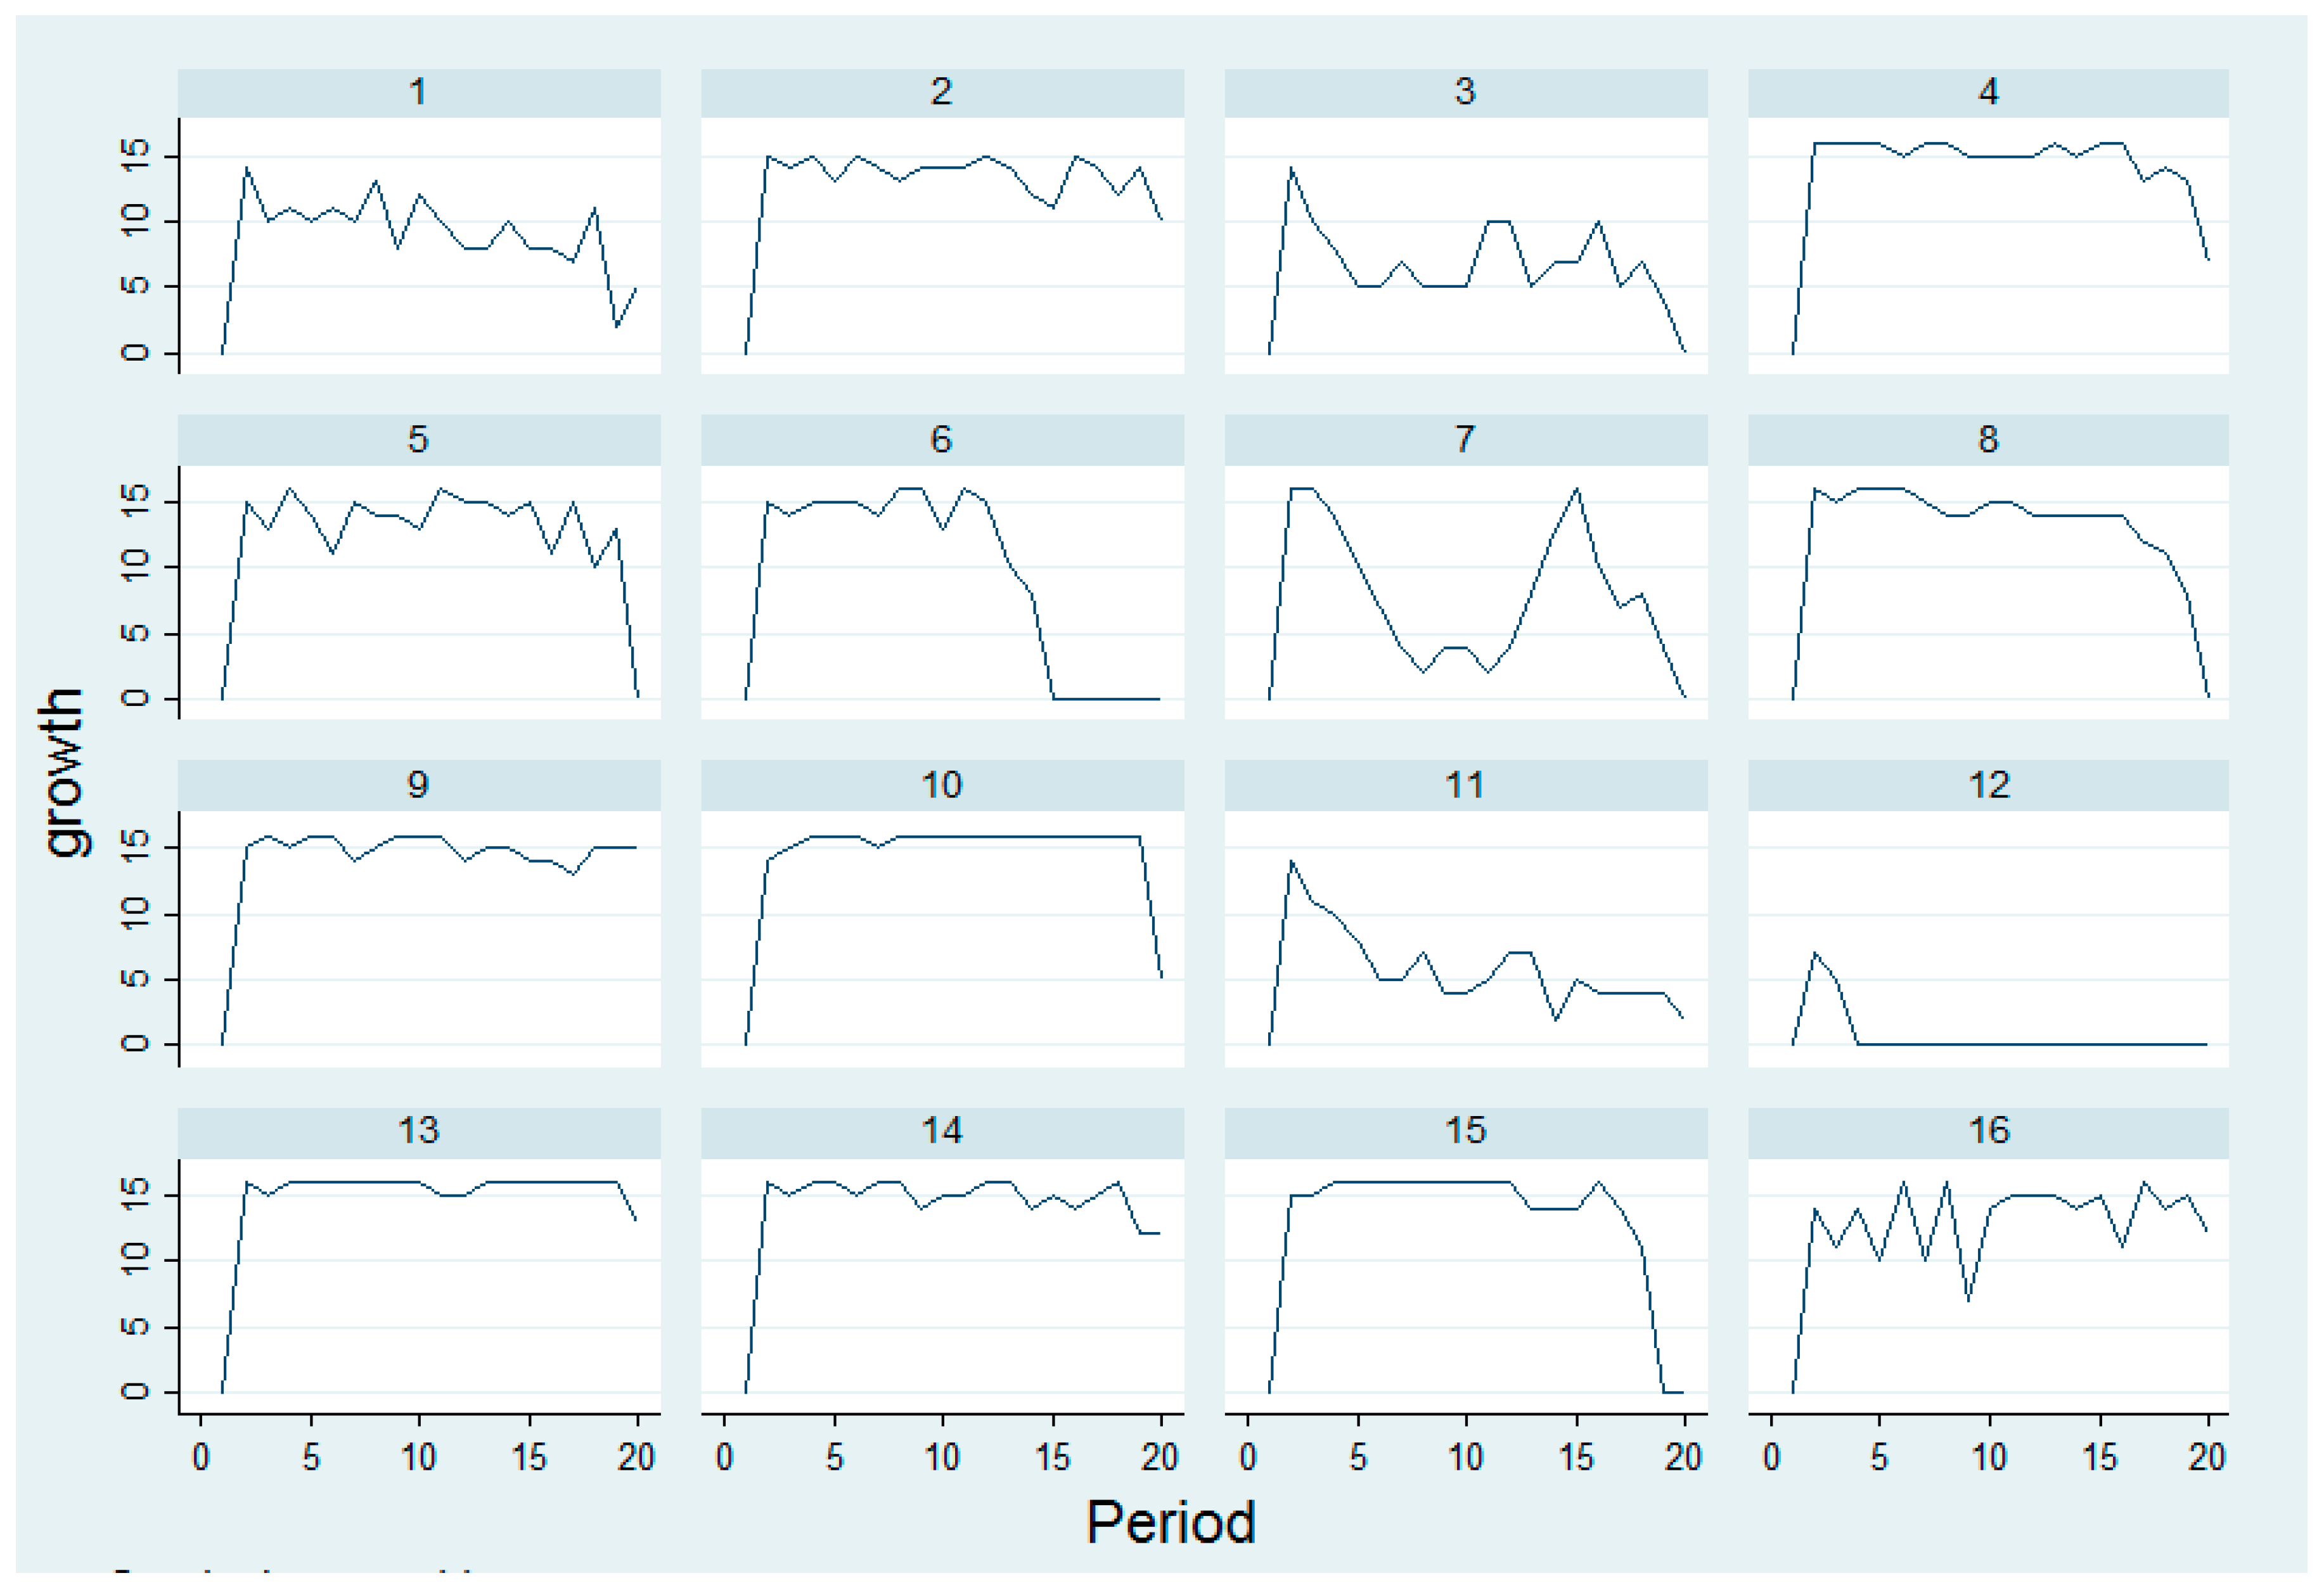
We show the average stock at the end of each round in Figure 2. We also include the trends for the groups that earned the most and the least. In the Appendix A, we provide graphs of the number of groups with a positive stock at the end of each round and average growth before the start of each round (Appendix A Figure A1 and Figure A2).4
3.2. Individual Decisions
Favoring brevity, we relegate regressions of individual withdrawals (see Appendix A Table A1), the binary decisions of whether withdrawals are irresponsible, sustainable, or constructive (Appendix A Table A2), and of withdrawal intensity (Appendix A Table A3) to the Appendix A.5
In these regressions, we generally found that withdrawals were increasing in the round and stock size. Additionally, there was some “stickiness” to withdrawals such that those who withdrew more than the average of their group mates previous round tended to make higher withdrawals in the current round. Finally, fixed effects were important for obtaining unbiased estimates of withdrawals.
Regarding whether withdrawals were irresponsible, sustainable, or constructive, it is important to control for the nonlinear effects of stock size. When one does, irresponsible and constructive withdrawals are no more or less likely in the later rounds of the game. Constructive withdrawals, however, are significantly less likely in the later rounds. When it came to withdrawal intensity, the round and stock size had positive effects, indicating that subjects withdrew more aggressively in the later rounds of the game and when the stock was larger.
If we take a moment to examine whether individual subjects consistently behaved irresponsibly, sustainably, or constructively, we learn that the ability to classify subjects depends on the threshold for assigning subjects to types (see Table 2). Specifically, if we consider a subject irresponsible, sustainable, or constructive if they behave accordingly at least 50% of the time, we can categorize 79.7% of our subjects. If we raise the threshold to 75% of the time, we can only categorize 20.3% of them. Thus, while we found some potential to classify people, as Elinor Ostrom discusses [11], it seems that there is also a benefit to studying individual actions.
3.3. Main Regressions
We now move to our regressions of group earnings (see Table 3). In Specifications (1)–(3), the frequencies of irresponsible, sustainable, and constructive withdrawals had negative, positive, and insignificant effects on group earnings. The significant results provide support for Hypotheses 1 and 2, but we failed to find significant support for Hypothesis 3. Additionally, all of the significance went away as soon as we controlled for the group’s average stock size over the sequence of rounds (Specifications (4)–(6)). Thus, while we found some preliminary support for the idea that differences in earnings among groups are due to variations in individual behavior along the extensive margins, the evidence is not robust to control for the group’s average stock size over the sequence.
In Specifications (7) and (8), the average intensities of irresponsible and constructive withdrawals had negative and insignificant (respectively) effects on earnings, providing support for Hypothesis 4 on the negative effect of the average intensity of irresponsible withdrawals, but failing to provide any support for Hypothesis 5 on the effect of the intensity of constructive withdrawals. The negative effect of the intensity of irresponsible withdrawals was especially strong. Here, we therefore found that when it comes to explaining differences among groups using the intensive margin of individual actions, the intensity of irresponsible withdrawals by far had the most significance.
In Specification (9), we included the frequencies and average intensities of irresponsible and constructive withdrawals. We could not include the frequency of sustainable withdrawals because the three frequencies summed to one, creating collinearity. The strongest effect was once again the negative effect of the average intensity of irresponsible withdrawals, emphasizing its usefulness in predicting group success.
4. Conclusion
We conducted a dynamic common pool resource experiment and examined the sources of differences in total earnings across groups. To facilitate this effort, we characterized individual appropriation decisions as irresponsible, sustainable, or constructive. We also developed a measure of the intensity of the actions. In looking at how group-level outcomes (total earnings) related to the individual actions, we found that the average intensity of irresponsible actions was the best single predictor of group success, indicating that differences in outcomes among groups are best explained by differences in individual actions along the intensive rather than extensive margin. The policy implication is that efforts to improve efficiency in the management of dynamic common pool resources should target the intensity of irresponsible appropriation decisions. A targeted punishment mechanism might be effective, or maybe simply a “nudge” that explains to decision-makers that high-intensity irresponsible actions are especially destructive to groups. Testing such a mechanism is for now left as a topic for future work.
Supplementary Materials
The instructions for the experiment and screenshots from the software are available online at https://www.mdpi.com/2073-4336/9/4/101/s1. Figure S1. Account Growth between Rounds, Figure S2. Information Screen, Figure S3. Decision Screen, Figure S4. Feedback Screen.
Author Contributions
Conceptualization, G.B.S., A.S. and Z.C.; Data curation, G.B.S. and Z.C.; Formal analysis, G.B.S., A.S. and Z.C.; Funding acquisition, G.B.S. and A.S.; Investigation, G.B.S., A.S. and Z.C.; Methodology, G.B.S., A.S. and Z.C.; Project administration, G.B.S. and A.S.; Resources, G.B.S. and A.S.; Software, A.S.; Supervision, G.B.S. and A.S.; Validation, G.B.S., A.S. and Z.C.; Visualization, G.B.S., A.S. and Z.C.; Writing—Original draft, G.B.S., A.S. and Z.C.; Writing—Review & editing, G.B.S. and A.S.
Funding
This research received no external funding.
Conflicts of Interest
The authors declare no conflict of interest.
Appendix A

Table A1.
Regressions of Withdrawals.
| Heading | (1) | (2) | (3) | (4) | (5) | (6) |
|---|---|---|---|---|---|---|
| round | 0.034 *** | 0.048 *** | 0.016 * | 0.042 *** | 0.007 | 0.037 *** |
| (0.011) | (0.012) | (0.009) | (0.013) | (0.011) | (0.012) | |
| stock | 0.175 *** | 0.200 *** | 0.127 *** | 0.205 *** | 0.143 *** | 0.203 *** |
| (0.014) | (0.017) | (0.015) | (0.021) | (0.012) | (0.018) | |
| Withdrawal -1 | 0.116 | 0.007 | −0.146 | −0.069 | ||
| (0.079) | (0.056) | (0.092) | (0.070) | |||
| withdrawal deviation -1 | 0.381 *** | 0.122 * | ||||
| (0.070) | (0.059) | |||||
| constant | −1.099 *** | −1.875 *** | −0.213 | −1.947 *** | 0.396 * | −1.578 *** |
| (0.388) | (0.441) | (0.215) | (0.466) | (0.204) | (0.322) | |
| model | RE | FE | RE | FE | RE | FE |
| # of subjects | 64 | 64 | 64 | 64 | 64 | 64 |
| rounds | 1–18 | 1–18 | 2–18 | 2–18 | 2–18 | 2–18 |
| # of observations | 1076 | 1076 | 1012 | 1012 | 1012 | 1012 |
| R2 | 0.356 | 0.371 | 0.388 | 0.345 | 0.448 | 0.352 |
| Hausman’s test | χ2 = 40.04 | p < 0.01 | χ2 = 340.86 | p < 0.01 | χ2 = 227.71 | p < 0.01 |
Standard errors adjusted for clustering at the group-level reported in parentheses. * p < 0.10, ** p < 0.05, *** p < 0.01. -1 in the previous round; # number.
Table A2.
Regressions of Types of Withdrawals (Irresponsible, Sustainable, or Constructive).
| Irresponsible Withdrawals | Sustainable Withdrawals | Constructive Withdrawals | |||||||
|---|---|---|---|---|---|---|---|---|---|
| (1) | (2) | (3) | (4) | (5) | (6) | (7) | (8) | (9) | |
| round | 0.003 | 0.008 * | 0.003 | −0.009 | −0.004 | 0.004 | 0.006 ** | −0.004 | −0.007 *** |
| (0.005) | (0.005) | (0.005) | (0.006) | (0.005) | (0.004) | (0.002) | (0.002) | (0.002) | |
| stock | 0.011 ** | 0.070 *** | 0.011 * | −0.095 *** | −0.021 *** | 0.026 * | |||
| (0.005) | (0.022) | (0.006) | (0.020) | (0.004) | (0.015) | ||||
| stock2 | −0.002 *** | 0.003 *** | −0.001 *** | ||||||
| (0.001) | (0.001) | (0.000) | |||||||
| constant | 0.372 *** | 0.069 | −0.364 * | 0.325 *** | 0.004 | 0.790 *** | 0.303 *** | 0.898 *** | 0.541 *** |
| (0.061) | (0.107) | (0.206) | (0.074) | (0.134) | (0.215) | (0.029) | (0.143) | (0.112) | |
| model | RE–LPM | RE–LPM | RE–LPM | RE–LPM | RE–LPM | RE–LPM | RE–LPM | RE–LPM | RE–LPM |
| # of subjects | 64 | 64 | 64 | 64 | 64 | 64 | 64 | 64 | 64 |
| rounds | 1–18 | 1–18 | 1–18 | 1–18 | 1–18 | 1–18 | 1–18 | 1–18 | 1–18 |
| # of obs. | 1076 | 1076 | 1076 | 1076 | 1076 | 1076 | 1076 | 1076 | 1076 |
| R2 | 0.001 | 0.000 | 0.023 | 0.012 | 0.078 | 0.268 | 0.004 | 0.051 | 0.075 |
Standard errors adjusted for clustering at the group-level reported in parentheses. * p < 0.10, ** p < 0.05, *** p < 0.01. # number; obs.: observations.
Table A3.
Regressions of Withdrawal Intensity.
| Heading | (1) | (2) | (3) | (4) |
|---|---|---|---|---|
| round | 0.001 ** | 0.002 *** | 0.001 | 0.002 *** |
| (0.001) | (0.001) | (0.000) | (0.001) | |
| stock | 0.003 *** | 0.004 *** | 0.002 *** | 0.005 *** |
| (0.001) | (0.001) | (0.001) | (0.001) | |
| withdrawal intensity -1 | 0.224 *** | 0.048 | ||
| (0.079) | (0.057) | |||
| constant | −0.082 *** | −0.111 *** | −0.043 ** | −0.129 *** |
| (0.027) | (0.026) | (0.017) | (0.028) | |
| model | RE | FE | RE | FE |
| # of subjects | 64 | 64 | 64 | 64 |
| rounds | 1–18 | 1–18 | 2–18 | 2–18 |
| # of observations | 1076 | 1076 | 1012 | 1012 |
| R2 | 0.015 | 0.079 | 0.075 | 0.088 |
| Hausman’s test | χ2 = 17.93 | p < 0.01 | χ2 = 2878.70 | p < 0.01 |
Standard errors adjusted for clustering at the group-level reported in parentheses. * p < 0.10, ** p < 0.05, *** p < 0.01. -1 in the previous round; # number
Figure A1.
Number of groups (/16) with a positive stock at the end of each round.

Figure A2.
Growth prior to the start of each round.

Figure A3.
Stock at the end of each round (for all 16 groups).

Figure A4.
Growth prior to the start of each round (for all 16 groups).

References
- Ostrom, E.; Walker, J.; Gardner, R. Covenants with and without a sword: Self-governance is possible. Am. Politi. Sci. Rev. 1992, 86, 404–417. [Google Scholar] [CrossRef]
- Walker, J.; Gardner, R. Probabilistic destruction of common-pool resources: Experimental evidence. Econ. J. 1992, 102, 1149–1161. [Google Scholar] [CrossRef]
- Walker, J.; Gardner, R.; Ostrom, E. Rent dissipation in a limited-access common-pool resource: Experimental evidence. J. Environ. Econ. Manag. 1990, 19, 203–211. [Google Scholar] [CrossRef]
- Janssen, M.A.; Bousquet, F.; Cardenas, J.C.; Castillo, D.; Worrapimphong, K. Breaking the elected rules in a field experiment on forestry resources. Ecol. Econ. 2013, 90, 132–139. [Google Scholar] [CrossRef] [Green Version]
- Kimbrough, E.; Vostroknutov, A. The social and ecological determinants of common pool resource sustainability. J. Environ. Econ. Manag. 2015, 72, 38–53. [Google Scholar] [CrossRef] [Green Version]
- Muller, R.A.; Whillans, F. A Common Pool Resource Experiment with a Dynamic Stock Externality. Available online: https://economics.ca/2008/papers/1127.pdf (accessed on 30 December 2017).
- Noussair, C.N.; van Soest, D.; Stoop, J. Cooperation in a dynamic fishing game: A framed field experiment. Am. Econ. Rev. 2015, 105, 408–413. [Google Scholar] [CrossRef]
- Osés-Eraso, N.; Udina, F.; Viladrich-Grau, M. Environmental versus human-induced scarcity in the commons: Do they trigger the same response? Environ. Resour. Econ. 2008, 40, 529–550. [Google Scholar] [CrossRef]
- Osés-Eraso, N.; Viladrich-Grau, M. The sustainability of the commons: Giving and receiving. Exp. Econ. 2011, 14, 458–481. [Google Scholar] [CrossRef]
- Schill, C.; Lindahl, T.; Crépin, A.S. Collective action and the risk of ecosystem regime shifts: Insights from a laboratory experiment. Ecol. Soc. 2015, 20, 48. [Google Scholar] [CrossRef]
- Ostrom, E. Collective action and the evolution of social norms. J. Econ. Perspect. 2000, 14, 137–158. [Google Scholar] [CrossRef]
- Fischbacher, U. z-Tree: Zurich toolbox for ready-made economic experiments. Exp. Econ. 2007, 10, 171–178. [Google Scholar] [CrossRef] [Green Version]
| 1 | |
| 2 | We include the instructions and screenshots (Figure S1–S4) in the Online Supplementary Material. |
| 3 | We use terminology such as “withdraw” and “account” as part of an effort to use neutral vocabulary. |
| 4 | We also show the trends of the stocks and growth for each of the 16 groups (Appendix A Figure A3 and Figure A4). |
| 5 | Due to end-round effects, we dropped rounds 19 and 20 from our analysis, but the results are robust to which rounds we dropped. |
Figure 1.
Growth function.

Figure 2.
Stock at the end of each round.

Table 1.
Summary Statistics.
| Individual Variables | Mean | Median | Min | Max | Std. Dev. | n |
| withdrawal | 3.16 | 3 | 0 | 10 | 2.11 | 1280 |
| received | 3.10 | 3 | 0 | 10 | 2.05 | 1280 |
| withdrawal (stock > 0) | 3.46 | 4 | 0 | 10 | 1.95 | 1164 |
| received (stock > 0) | 3.41 | 4 | 0 | 10 | 1.89 | 1164 |
| cumulative earnings | 61.97 | 67.5 | 4 | 110.5 | 23.09 | 64 |
| frequency irresp. withdrawals | 0.418 | 0 | 0 | 1 | 0.49 | 1164 |
| frequency sust. withdrawals | 0.235 | 0 | 0 | 1 | 0.42 | 1164 |
| frequency constr. withdrawals | 0.347 | 0 | 0 | 1 | 0.48 | 1164 |
| withdrawal intensity | 0.01 | 0 | −0.17 | 0.84 | 0.10 | 1164 |
| irresponsible intensity | 0.08 | 0.05 | 0.01 | 0.84 | 0.11 | 506 |
| constructive intensity | −0.07 | −0.06 | −0.17 | −0.01 | 0.05 | 412 |
| Group Variables | Mean | Median | Min | Max | Std. Dev. | n |
| stock (end of round) | 9.09 | 10 | 0 | 22 | 5.79 | 320 |
| growth | 11.41 | 14 | 0 | 16 | 5.30 | 304 |
| stock (end of round; stock > 0) | 10.00 | 11 | 0 | 22 | 5.27 | 291 |
| growth (stock > 0) | 12.61 | 14 | 0 | 16 | 3.98 | 275 |
| cumulative earnings | 247.88 | 285 | 44 | 330 | 81.12 | 16 |
| frequency irresp. withdrawals | 0.404 | 0.42 | 0.10 | 0.58 | 0.13 | 16 |
| frequency sust. withdrawals | 0.241 | 0.17 | 0.01 | 0.71 | 0.21 | 16 |
| frequency constr. withdrawals | 0.355 | 0.35 | 0.11 | 0.54 | 0.11 | 16 |
| avg. intensity | 0.01 | 0.00 | −0.01 | 0.08 | 0.02 | 16 |
| avg. irresp. intensity | 0.07 | 0.06 | 0.02 | 0.19 | 0.04 | 16 |
| avg. constr. intensity | −0.07 | −0.05 | −0.13 | −0.04 | 0.03 | 16 |
Abbreviations: Std. Dev.: Standard Deviation; irresp.: irresponsible; sust.: sustainable; constr.: constructive; avg.: average.
Table 2.
Distribution of subject types using different thresholds of consistency.
| Subject Type | Threshold 50% | Threshold 75% | ||
|---|---|---|---|---|
| Frequency | % | Frequency | % | |
| Irresponsible | 23 | 35.9% | 7 | 10.9% |
| Sustainable | 11 | 17.2% | 3 | 4.7% |
| Constructive | 17 | 26.6% | 3 | 4.7% |
| Unclassified | 13 | 20.3% | 51 | 79.7% |
| Total subjects | 64 | 100.0% | 64 | 100.0% |
Table 3.
Regressions of Group Earnings.
| (1) | (2) | (3) | (4) | (5) | (6) | (7) | (8) | (9) | |
|---|---|---|---|---|---|---|---|---|---|
| freq. irresp. | −303.59 ** | −9.99 | −128.91 * | ||||||
| (135.09) | (101.78) | (62.90) | |||||||
| freq. sust. | 128.57 ** | −41.50 | |||||||
| (54.69) | (35.54) | ||||||||
| freq. constr. | −27.28 | 123.49 | 80.10 ** | ||||||
| (192.24) | (122.26) | (26.51) | |||||||
| avg. inten. irresp. | −1147.53 *** | −1468.20 *** | |||||||
| (228.03) | (218.28) | ||||||||
| avg. inten. constr. | 1,362.39 | −752.09 | |||||||
| (879.46) | (483.75) | ||||||||
| average stock | 9.93 *** | 10.68 *** | 10.54 *** | 23.59 *** | 15.50 * | 28.50 *** | |||
| (1.12) | (2.01) | (2.08) | (5.58) | (7.37) | (6.31) | ||||
| (average stock)2 | −0.40 *** | −0.23 | −0.50 ** | ||||||
| (0.13) | (0.17) | (0.17) | |||||||
| constant | 370.65 *** | 216.93 *** | 257.56 *** | 15.14 | 3.28 | −47.24 | 9.72 | 111.16 | −47.82 |
| (44.35) | (29.49) | (81.04) | (43.84) | (52.36) | (94.99) | (51.66) | (103.79) | (45.19) | |
| model | GLS | GLS | GLS | GLS | GLS | GLS | GLS | GLS | GLS |
| # of groups (n) | 16 | 16 | 16 | 16 | 16 | 16 | 16 | 16 | 16 |
| R2 | 0.247 | 0.111 | 0.002 | 0.708 | 0.717 | 0.737 | 0.940 | 0.791 | 0.978 |
Abbreviations: freq. irresp.: frequency irresponsible; sust.: sustainable; constr.: constructive; avg. inten.: average intensity. * p < 0.1, ** p < 0.05, *** p < 0.01, # number.
© 2018 by the authors. Licensee MDPI, Basel, Switzerland. This article is an open access article distributed under the terms and conditions of the Creative Commons Attribution (CC BY) license (http://creativecommons.org/licenses/by/4.0/).
Share and Cite
MDPI and ACS Style
Somasse, G.B.; Smith, A.; Chapman, Z. Characterizing Actions in a Dynamic Common Pool Resource Game. Games 2018, 9, 101. https://doi.org/10.3390/g9040101
AMA Style
Somasse GB, Smith A, Chapman Z. Characterizing Actions in a Dynamic Common Pool Resource Game. Games. 2018; 9(4):101. https://doi.org/10.3390/g9040101
Chicago/Turabian StyleSomasse, Gbetonmasse B., Alexander Smith, and Zachary Chapman. 2018. "Characterizing Actions in a Dynamic Common Pool Resource Game" Games 9, no. 4: 101. https://doi.org/10.3390/g9040101
Note that from the first issue of 2016, this journal uses article numbers instead of page numbers. See further details here.