Article

Playing a Game or Making a Decision? Methodological Issues in the Measurement of Distributional Preferences

by
Matthias Greiff
1,*,†,
Kurt A. Ackermann
2,† and
Ryan O. Murphy
3,†
1
Institute of Management and Economics, Clausthal University of Technology, Julius-Albert-Str. 2, 38678 Clausthal-Zellerfeld, Germany
2
ZHAW Zurich University of Applied Sciences, Stadthausstrasse 14, 8400 Winterthur, Switzerland
3
Department of Economics, University of Zurich, Blümlisalpstrasse 10, 8006 Zurich, Switzerland
*
Author to whom correspondence should be addressed.
These authors contributed equally to this work.
Games 2018, 9(4), 80; https://doi.org/10.3390/g9040080
Submission received: 24 August 2018 / Revised: 20 September 2018 / Accepted: 4 October 2018 / Published: 10 October 2018
(This article belongs to the Special Issue Dictator Games)

Abstract

:
In terms of role assignment and informational characteristics, different contexts have been used when measuring distributional preferences. This could be problematic as contextual variance may inadvertently muddle the measurement process. We use a within-subjects design and systemically vary role assignment as well as the way information is displayed to subjects when measuring distributional preferences in resource allocation tasks as well as proper games. Specifically we examine choice behavior in the contexts of role certainty, role uncertainty, decomposed games, and matrix games. Results show that there is large heterogeneity in the choices people make when deciding how to allocate resources between themselves and some other person under different contextual frames. For instance, people make more prosocial choices under role uncertainty as compared to role certainty. Furthermore, altering the way information is displayed given a particular situation can have a more dramatic effect on choice behavior than altering the situation itself. That is, depending on how information is displayed, people may behave as if they would perform a non-strategic decision making task when in fact they are playing a proper game characterized by strategic interdependence.

1. Introduction

In this paper, we are concerned with the measurement of distributional preferences (the allocation of payoffs between self and other) within the Social Value Orientation (SVO) paradigm. Distributional preferences are a specific form of social preferences. The term social preferences refers to a broad set of other-regarding preferences, like distributional preferences, reciprocity concerns, image concerns, or preferences which are conditional on beliefs (see e.g., [1], for a discussion of conditional social preferences). Distributional preferences more narrowly refer to the preferences that are revealed when a person chooses how to allocate resources between herself and another person.
The measurement of distributional preferences is an important issue in economics and psychology (see e.g., [2,3,4,5,6]), but different measurement methods have been used around this construct. In principle, quantifying distributional preferences has two distinct components. The first component concerns the choice sets: well-defined sets of options that correspond to different allocations of resources or payoffs. The second component is the social context in which a decision maker (DM) makes her choices. Typically, social features of the decision task are minimized, but there remains at least some minimal social context, as there must be some “other” entity who is affected by the DM’s choices. For our purposes, we will use the term social context to refer to different types of role assignment and incentivisation protocols.
When measuring distributional preferences, confounding effects are supposed to be minimized when the DM allocates resources between herself and some other person in a decision making task, e.g., a dictator game. In a decision making task, the other person is passive so that the DM faces a non-strategic situation. It is questionable whether distributional preferences can also be measured in a proper game characterized by strategic interdependence, e.g., a prisoner’s dilemma. In a proper game, the DM’s final payoff is not a result of her choices alone, but rather the result of her decisions in combination with the decisions made by a mutually interdependent other person. In such situations of strategic interdependence, i.e., games, people’s choices are supposed to be a function of both their distributional preferences and their beliefs about the other person’s behavior (e.g., [7,8,9]). As decision making tasks are fundamentally different from strategic interactions in terms of the degree of interdependence, we refer to decision making tasks and strategic interactions as strictly different situations. Hence, according to this theoretical framework, the measurement of distributional preferences within a proper game is expected to be confounded by beliefs.1
Behavior in decision making tasks and in proper games both depend on social context, i.e., on how roles are assigned between (potential) interaction partners. To date it is unclear, however, whether the way in which information is displayed to people given a particular social context may affect behavior as well. That is, will people behave as if they were performing a non-strategic decision making task when in fact they are playing a proper game given that information is displayed in a particular way? This is the primary question this paper is addressing.
A second question the data from our experiment will allow us to address is whether the way roles are assigned in resource allocation tasks affects behavior in systematic ways. In this regard, Levati et al. [10] emphasize the importance of exercising control over contextual features with the goal of reducing the likelihood of a mismatch between a subject’s model of a social context and the experimenter’s model of the corresponding social context. To achieve this goal, information on how different contexts influence subjects’ perceptions and behavior is required. One feature that seems to affect a subject’s perception in the context of resource allocation tasks is the way in which the roles of DMs and recipients are assigned. Kerschbamer [6] (Online Appendix, pp. 1–9) provides a brief discussion of different role assignment procedures, but to the best of our knowledge, there is no study providing a systematic within-subjects comparison of distributional preference measurements across different role assignment procedures.2 Due to the experimental design we developed to answer the main question outlined above, this paper can also contribute to filling this gap as a secondary goal.
The design of our experiment is similar to Blanco et al. [13], Fischbacher et al. [14] and Dariel and Nikiforakis [15]. All three papers use a within-subject design to compare behavior across different games. However, instead of comparing strategic behavior across games, we compare subjects’ behavior across different social contexts (role assignment protocols) and situations, i.e., decision making tasks as well as proper games, while varying how information is displayed to subjects.3 We structure the paper as follows: In Section 2, we give a systematic review of the different procedures that have been used to measure distributional preferences, focusing on choice sets and contexts. In Section 3, we briefly sketch the experimental design and then outline the main research questions and corresponding hypotheses. We then provide details of our experimental procedure (Section 4) and present the results in Section 5. We conclude by discussing the results and offering some explanations for how role assignment and the display of information affects the measurement of distributional preferences (Section 6).

2. Measures of Distributional Preferences

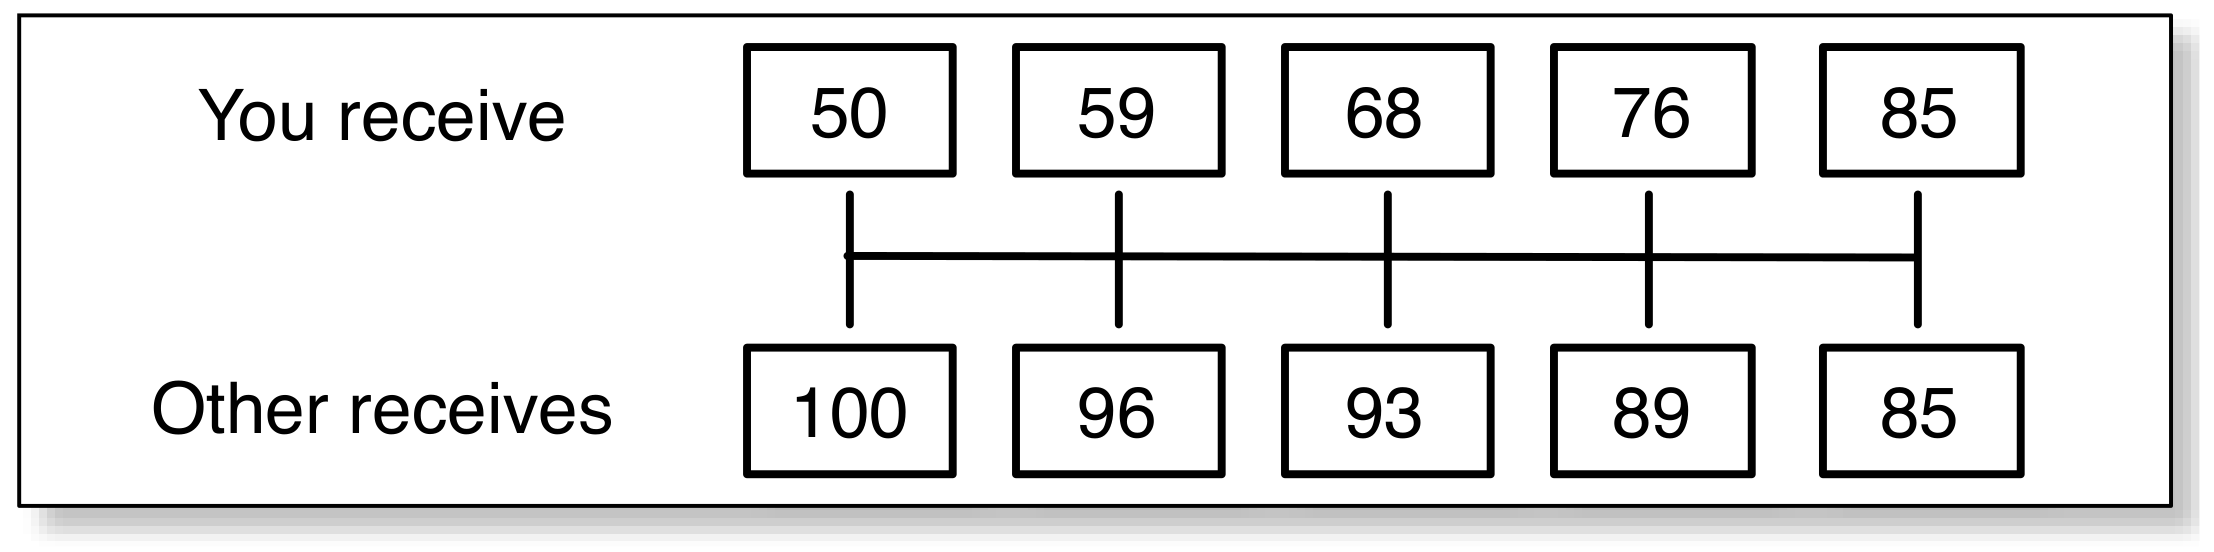
2.1. Different Sets of Stimuli and the Slider Measure

The basis of most distributional preference measures is a resource allocation task. The simplest task of this kind is a dictator game, where there is a fixed amount of monetary resources that one person allocates between herself and some random other person. Other measurements of distributional preferences are based on multiple resource allocation tasks that have a more nuanced structure (e.g., various marginal rates of substitution, see Murphy and Ackermann [5], and Kerschbamer [16], for a comparison of different methods). In each resource allocation task, the DM chooses her most preferred option. The resulting pattern of choices across the set of different allocation tasks can then be used to estimate that DM’s distributional preferences.
One of these kinds of distributional preference measures is the SVO Slider Measure, which consists of six such resource allocation tasks. For example, in the resource allocation task depicted in Figure 1, the DM chooses between five own-other payoff combinations, ((50,100),(59,96),(68,93),(76,89),(85,85)).4 Based on the DM’s choices in all six tasks, the DM’s SVO score is computed. An SVO score is continuous and usually presented in the metric of degrees (reflecting a motivational vector in a Cartesian plane defined by payoffs for the self and payoffs for another person). Scores range between −16.26 and 61.39 degrees, with negative angular degrees indicating negative concerns for others (spite), and positive angular degrees indicating positive concerns for others (altruism or prosociality). Values near zero are consistent with narrow self-interest.5 Scores in degrees can be translated into an other-regarding coefficient α within a linear joint utility function of the form U ( x , y ) = x + α y , where x denotes the DM’s payoff and y denotes the recipient’s payoff.
All six resource allocation tasks are displayed in Figure A1 in the Appendix and in Murphy et al. [17]. A detailed description of how SVO is computed can be found in Appendix A.
For this study, we used the SVO Slider Measure because it has demonstrable psychometric benefits over alternative measures, yields a continuous score for better measurement fidelity, and it has a built-in transitivity check. SVO has been shown to be highly stable as an individual difference with a test-retest reliability of r = 0 . 915 [17]. It is also sensitive to individual differences and hence provides considerable statistical power. This is useful for detecting subtle differences in choice behavior that may emerge from different contexts, which is crucial for this study. Other measures that yield only a binary categorization of DMs (e.g., either selfish or prosocial) lack statistical power and may not be able to identify changes in distributional preferences nor predict corresponding choice behavior.
The SVO Slider Measure produces a one-dimensional index of prosociality, which makes it well suited to study the effects of social contexts. The SVO Slider Measure’s primary items, of which shortened versions were used in this study, do not allow for the detection of more nuanced motivations behind distributional preferences, however, like preferences for efficiency or inequality aversion. To detect these motivations, more complicated tests based on a larger number of items, like the extended version of the Slider Measure (see Section 3.6 in Murphy et al. [17]), or Kerschbamer’s Equality Equivalence test [6] should be used. However, in this study we are less interested in detecting the differences in people’s motivations, but rather in the consistency of choice behavior in resource allocation tasks across different contextual settings and situations.

2.2. Different Role Assignment Protocols and Strategic Interdependence

One way to conceptualize a resource allocation task is to consider a decision situation with two distinct roles, an active Decider and a passive Receiver. The Decider chooses a joint allocation which determines her own and the Receiver’s payoff. This is not a proper game as only the Decider’s choice affects payoffs. However, it is a social decision as the Decider’s choice has an effect on some other person.
There has been substantial contextual heterogeneity in how resource allocation tasks have been implemented. This heterogeneity stems in part from differences in role assignment protocols, on which we elaborate next.

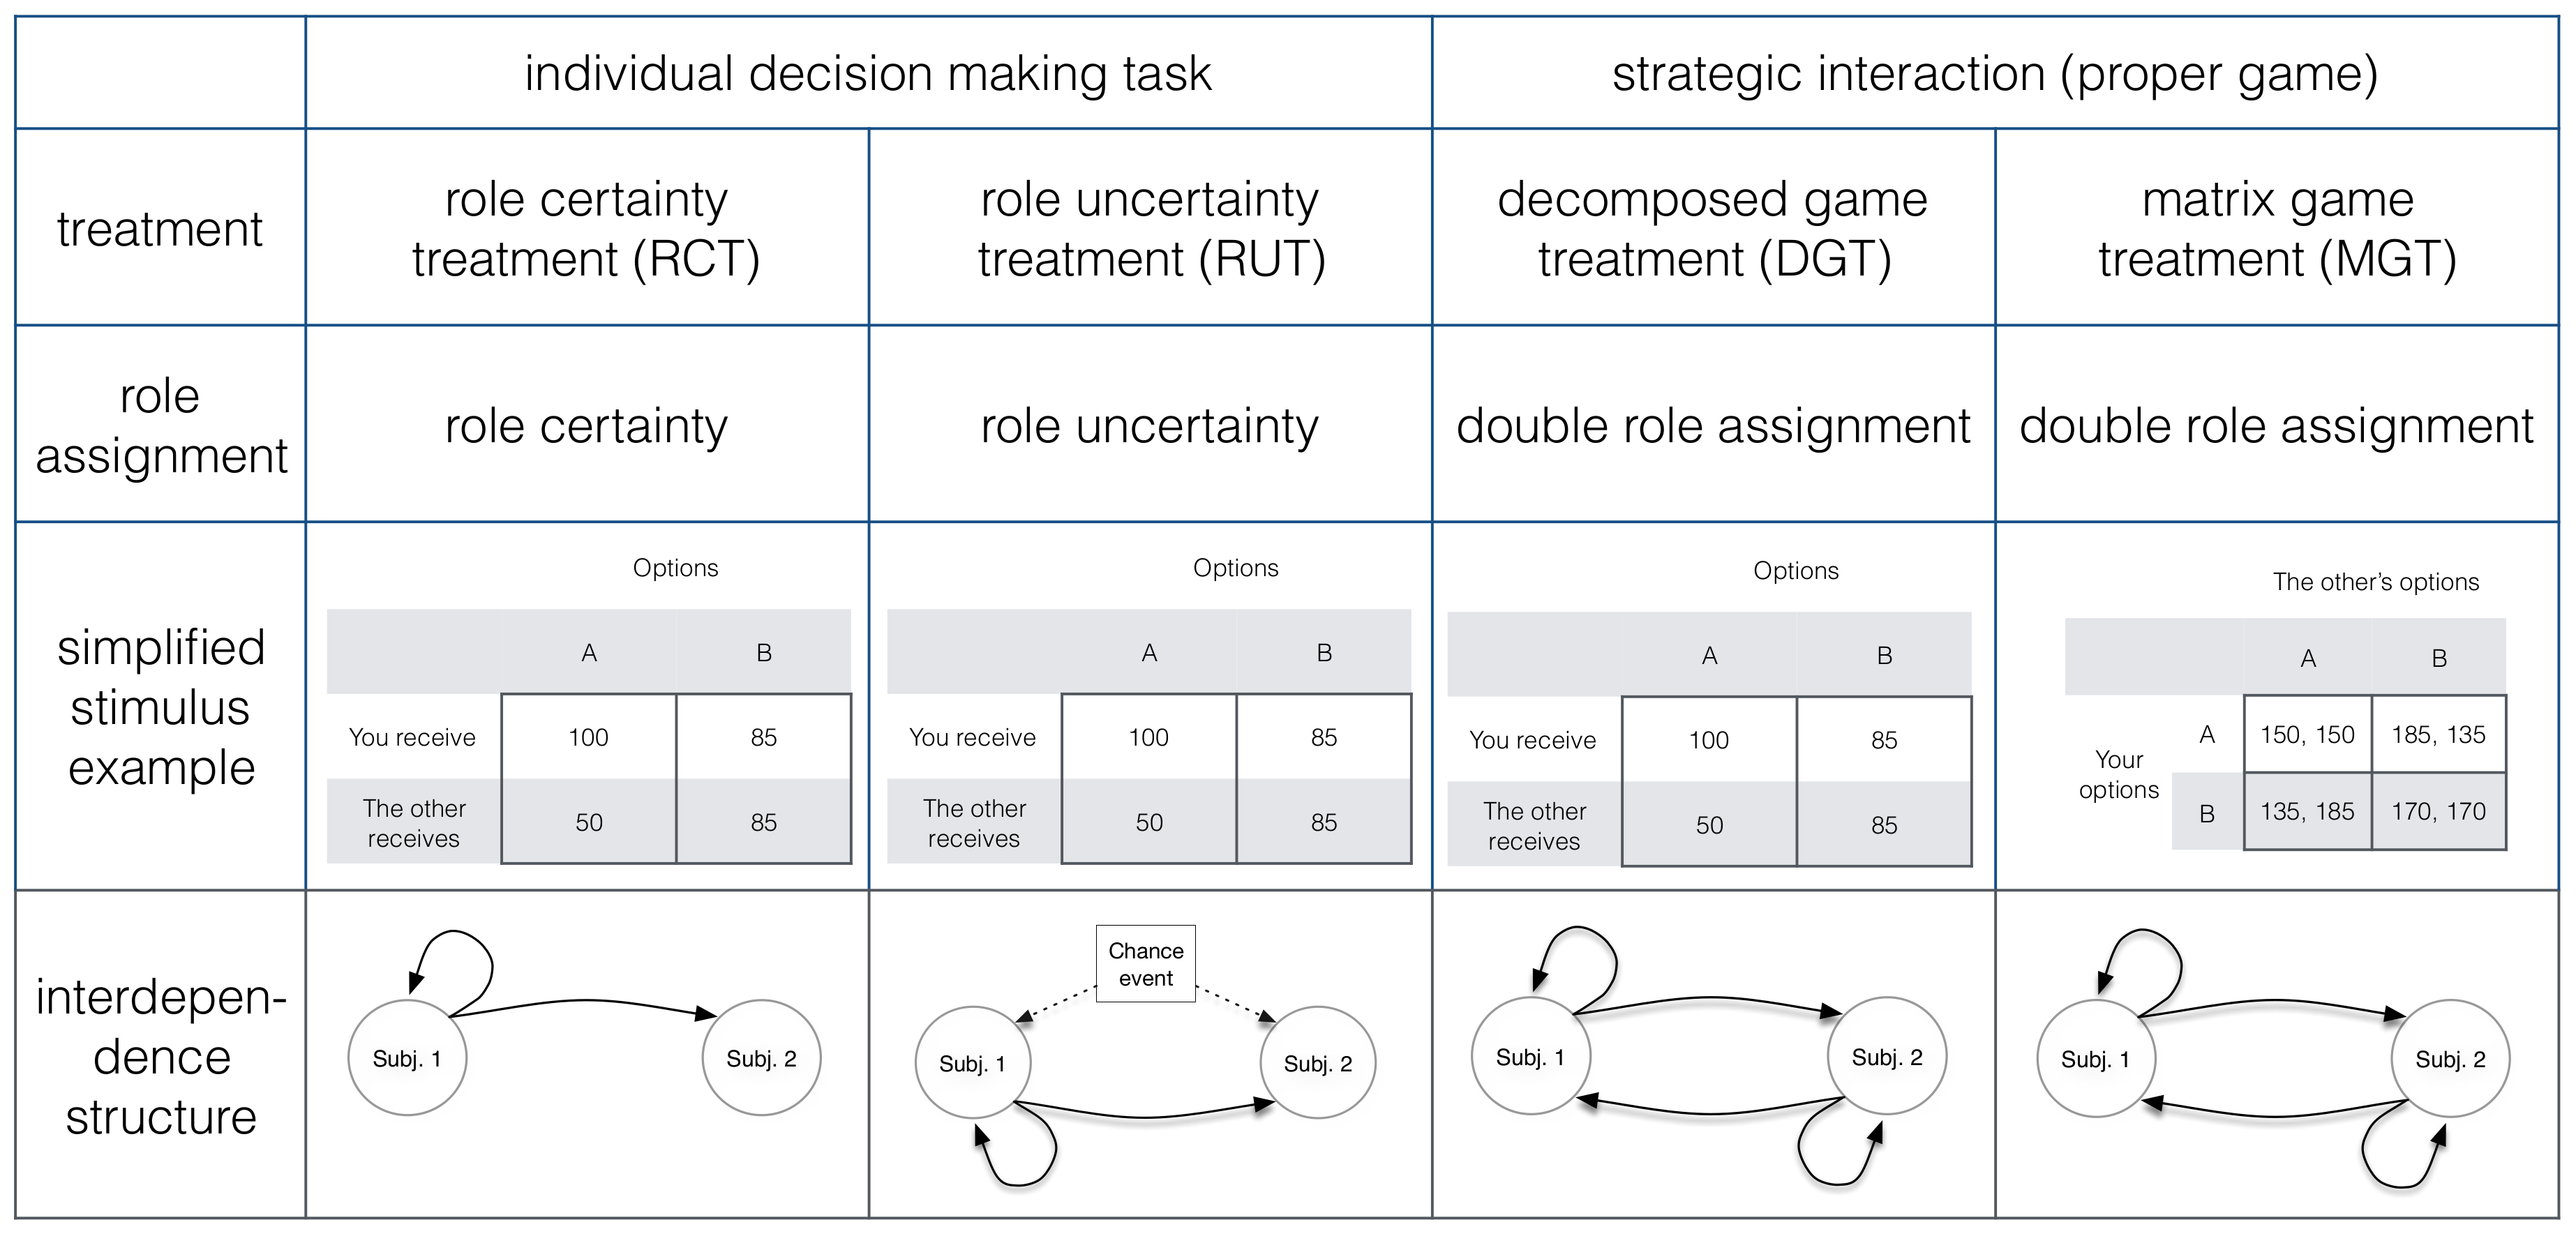
2.2.1. Role Certainty

With fixed role assignment or role certainty, subject A is in the role of the Decider and subject B is in the role of the Receiver. B is passive, A knows this, and all of these features are common knowledge. In experimental practice, the sample of subjects is randomly split and the role of the Decider is assigned to subjects in one half, while the role of the Receiver is assigned to subjects in the other half of the sample. Role certainty has been employed in several experiments (e.g., [18,19,20]).
A downside of this procedure is experimental inefficiency in that the distributional preferences of only half of the subjects are assessed. Another consequence of this procedure is that this context creates a substantial imbalance in power that is obvious to Deciders and Receivers. This imbalance may evoke particular feelings of responsibility or entitlement on behalf of some Deciders, whereas others may not be affected by this imbalance (see, for instance, [21,22], concerning the effect of power and status on distributional preferences).

2.2.2. Role Uncertainty

A procedure that avoids the inefficiency of only measuring the distributional preferences of half the sample is role uncertainty. All subjects perform the resource allocation task but do not know a priori whether they are going to be assigned the role of Decider or Receiver. Only after decisions are made, subjects are matched randomly in pairs and another random process determines which role is assigned to which subject in each pair. Role uncertainty has been employed in several experiments as well (e.g., [23,24]).
Role uncertainty also mitigates the issue of power imbalance and preserves symmetry. With role uncertainty, all subjects are equally entitled (and dependent) because all subjects perform the same task behind the same veil of ignorance ([24], p. 859).
A downside of this role assignment protocol is that some subjects may be prone to a phenomenon termed “magical thinking” (see, for instance, [25]), such that they may behave more prosocially than they usually would in order to (“magically”) increase the degree of prosociality in other subjects, which would be beneficial in case they end up being the Receiver. Magical thinking may therefore affect estimates of distributional preferences when elicited under a protocol of role uncertainty.

2.2.3. Double Role Assignment

With double role assignment, all subjects simultaneously perform the resource allocation task. A subject’s total payoff comes from two sources: the payoff from her role as Decider, and her payoff from her role as Receiver. The mapping from choices to payoffs is common knowledge, and, in case the two subjects are directly interdependent (fixed pairs), this is a strategic setting. Double role assignment with random pairs is used in many economic experiments (e.g., [3,26,27,28]). Double role assignment with fixed pairs has also been employed in several experiments, mostly in psychology (e.g., [29,30,31,32]) but also in economics (e.g., [33,34,35,36]).
Each subject simultaneously gives and receives, so that a subject’s decision to give might depend on her expectation about what she will receive from the other. Measuring distributional preferences with double role assignment -especially when pairs are fixed- may yield a confounded result as expectations may inform choices as well as preferences. Along these lines Rigdon and Levine [37] find significant differences in choice behavior contingent upon subjects’ expectations.
Given double role assignment with fixed pairs, one way of displaying information about the situation to subjects would be to show them the corresponding payoff matrix. If, however, information is displayed in terms of a payoff matrix, strategic interdependence is salient because a subject can see clearly that there is another subject whose decision affects the payoffs of both subjects as well. Depending on the marginal rate of substitution between own and other’s payoff, allocating a high payoff to the receiver will increase the sum of payoffs. In these cases, the game will be a prisoner’s dilemma (see Figure 2), in which behavior is likely to depend on beliefs [38]. Therefore, the presentation of a matrix game as stimulus has, of course, not been applied in the context of measuring distributional preferences under the protocol of double role assignment with fixed pairs.
However, attempts have been made to remove the salience of strategic interdependence inherent to double role assignments by altering the way information is displayed to subjects via decomposed games (see [29,30]). Assume that two subjects, A and B, simultaneously choose between two payoff allocation options X and Y, while X = ( 100 , 50 ) and Y = ( 85 , 85 ) . With the decomposed games method each subject sees both allocations and is informed that the other subject chooses between the same allocations. The normal form representation (which is not shown to subjects) and the corresponding decomposed game is depicted in Figure 2.
The use of decomposed games may be a misguided experimental manipulation as it really does nothing to mitigate strategic interdependence (see also [7]). That is, the situation that subjects are confronted with when making choices on the basis of a payoff matrix or on the basis of a decomposed game under double role assignment is identical. Decomposed games are still strategic games, but merely designed to make the strategic character of the situation less salient to subjects. For subjects with unlimited cognitive capacities, a decomposed game and the corresponding matrix game are identical. For boundedly rational subjects, there might be differences. For them, it might be difficult to recognize the strategic interdependence and, if they recognize strategic interdependence, they might have difficulties computing the final payoffs in the decomposed game.
One interpretation of the decomposed games approach is that it acts like choice framing, directing a subject’s attention to the consequences of her own action while downplaying the potential consequences of the other’s choice [29]. However, to date there is no clear evidence that subjects show a different behavior when playing a matrix game as compared to making allocation choices in a decomposed game under the protocol of double role assignment. The main research question we address here concerns precisely this comparison between these two conditions.
Furthermore, the inclusion of the two previously described conditions—namely decision making tasks under role certainty and role uncertainty—allows us to analyze the degree to which choice behavior in decomposed games under double role assignment is indeed more similar to behavior in a non-strategic decision making task as compared to a proper game.

3. Hypotheses

Before we derive the hypotheses we briefly sketch the experimental design depicted in Figure 3, because understanding the design helps make the hypotheses clearer. There are three different role assignment protocols (role certainty, role uncertainty, and double role assignment) and one of the role assignments has two ways of displaying information (decomposed game vs. matrix game representation). This yields four treatments: the Role Certainty Treatment (RCT), the Role Uncertainty Treatment (RUT), the Decomposed Game Treatment (DGT), and the Matrix Game Treatment (MGT). Consequently, there are two different kinds of situations that subjects will be confronted with, namely two non-strategic decision making tasks (RCT and RUT) that only differ in the way roles are assigned and two strategic interactions (i.e., proper games, DGT and MGT) that only differ in the way information is displayed. We use a within-subjects design and apply random sequences of treatments to mitigate potential carryover effects. This experimental design allows us to test the following hypotheses.

3.1. Main Hypotheses

H1. 
Choice behavior in decomposed games differs from choice behavior in corresponding matrix games.
Previous empirical results show that behavior in decomposed games and strategically equivalent matrix games may be different [29,39]. The differences are not systematic and Pruitt [29] as well as Gallo Jr. et al. [39] provide no explanation for them. For most decompositions, cooperation rates where higher, though. Hence, choices may be more prosocial in DGT as compared to MGT. However, this assumption does not rely on theoretical considerations, but merely on (inconsistent) patterns observed in past research.
From a theoretical standpoint, differences in choice behavior between DGT and MGT would indicate that presenting a game in decomposed form may indeed blur the situation’s strategic character in the perception of people, as it was originally intended. This would mean that choices made in MGT would be affected by both distributional preferences and beliefs about the interaction partner’s choices, while choices made in DGT would be driven entirely (or perhaps almost entirely) by distributional preferences alone. That is, differences between DGT and MGT may reflect the impact of beliefs on choices.
There are at least three potential accounts for how beliefs could affect choices. First, people’s beliefs may be affected by person-specific information, such as personal experiences from past interactions in daily life, for instance. As a consequence, differences in choice behavior between DGT and MGT would appear random and unsystematic, as these differences would arise from private information that the experimenter cannot account for and that may vary widely across individuals.
Second, people may hold beliefs that are consistent with the notion of social projection (see, for instance, [40]), such that DMs expect others to be similar to themselves. In the context of the present study, this would imply that prosocial DMs (i.e., subjects with S V O > 22 . 45 ) expect their interaction partner to be prosocial as well, while proselfs (i.e., subjects with S V O < 22 . 45 ) expect their interaction partner to be more selfish. In this respect, recent research has shown that there is a relation between prosociality and trust, which is consistent with the assumption of social projection (e.g., [41,42]). Under the assumption that beliefs are formed by social projection, we would expect that SVO scores are amplified in MGT as compared to DGT. That is, prosocials may behave even more prosocially, and proselfs may behave even less prosocially, in MGT as compared to DGT.
Third, if MGT is perceived as a strategic interaction while DGT is not (or less so), then MGT may elicit a phenomenon that has been termed magical thinking while DGT would not. Shafir and Tversky [25] report results of an experiment where 25% of choices from subjects playing sequential and simultaneous prisoner’s dilemmas had the following pattern: Subjects chose to defect when they knew the other subject had chosen to defect. Furthermore, they chose to defect when they knew the other subject had chosen to cooperate. Finally, however, they chose to cooperate when they did not know the other subject’s choice. A possible explanation is that in simultaneous games, subjects cooperate because they believe that cooperation on their side may magically evoke cooperation on the interaction partner’s side as well, which would manifest itself in terms of a choice consistent with the motivation to maximize joint gains ([25], p. 457). Magical thinking would therefore lead subjects to choose more prosocial allocations in MGT as compared to DGT.
Hypothesis H1 is tested in order to answer the question whether choice behavior in decomposed games does indeed differ from choice behavior in corresponding matrix games in the first place. However, the data allows us to also evaluate the potential explanations for behavioral differences between these two conditions as stated above, given that differences do occur.
H2. 
Choice behavior in decomposed games is more consistent with choice behavior in decision making tasks (with role certainty or role uncertainty) as compared to choice behavior in corresponding matrix games.
If choice behavior in decomposed games differs from choice behavior in matrix games (see H1), this would indicate the effectiveness of framing by altering the way information is displayed to subjects in the context of strategic interactions. However, in order to find out whether this kind of framing affects choice behavior in the expected direction—namely making choice behavior in a strategic interaction more consistent with choice behavior in a non-strategic decision making task—a comparison between choice behavior across both situations (decision making tasks vs. strategic interactions) is required.

3.2. Secondary Hypotheses

In addition to our two main hypotheses, the experimental design allows us to test several other hypotheses about how contextual features affect behavior and to evaluate whether results from previous studies concerning the effect of role assignment protocols on choice behavior in resource allocation tasks can be replicated in this study.
H3. 
Choice behavior under role certainty indicates less prosociality than choice behavior under role uncertainty.
Iriberri and Rey-Biel [11] and Walkowitz [12] compare behavior in modified dictator games with role certainty and role uncertainty. Both find that subjects are more generous under role uncertainty. This could be driven by fairness considerations or by the cost of expressing generosity.
Fairness considerations could lead to more prosocial choices in the RUT. Assume that the choice of an allocation that would result in a high payoff for the other subject is perceived as nice. If A has a preference for fairness and expects B to choose the nice allocation, A might reciprocate by also choosing the nice allocation [43]. Here, A’s choice depends on her expectation about B’s intention.
Higher generosity with role uncertainty could be due to the low costs of expressing generosity (see also the literature on low cost expressive voting, e.g., [44,45]). Assume that being generous increases utility because subjects derive utility from expressing their generosity [45]. With role certainty, the additional utility from being generous comes with a reduction in own payoff. With role uncertainty, being generous in the role of Decider reduces the expected payoff; the actual payoff is reduced only if the subject is assigned to the role of Decider. Hence, the expected price of expressing generosity is lower in RUT. Due to fairness considerations and the low costs of expressing generosity, we expect subjects to be more generous under role uncertainty.
H4. 
Incentives affect choice behavior in resource allocation tasks.
In the RCT, half of the subjects filled out the SVO Slider Measure knowing they were the Deciders. The other half filled out the Slider Measure knowing they were the Receivers and that their responses would not have any effect on themselves nor any other subject. This implementation yields a between-subjects test of the effect of incentives on distributional preferences. A within-subjects test of the effect of incentives on distributional preferences would be to compare hypothetical choices in RCT with incentivized choices in RUT. Similar tests have been conducted before. Mentzakis and Mestelman [46] found no significant effects, but in Forsythe et al. [18], subjects are found to be more generous if decisions are hypothetical. Although previous findings are mixed, we expect that incentivized choices will be less prosocial.

4. Experimental Procedure

The experiment was conducted using zTree [47]. A total of 192 subjects participated. The order in which subjects encountered the four treatments was fully counterbalanced across sessions with eight subjects per session. Subjects were informed that each subject’s final payoff was determined by the sum of each treatment’s payoff plus a fixed show-up fee (5 euros). In each treatment, subjects are matched in fixed pairs and all subjects make choices in six different decision situations. In the RCT, RUT and DGT these six situations correspond to simplified versions of the SVO Slider Measure’s six primary items (see Figure A1). In the MGT the six decision situations correspond to the six payoff matrices that result when the six Slider Measure items are recomposed to form matrix games (analogous to the recomposition-procedure depicted in Figure 2). Hence, we can compute a subject’s SVO for each treatment and analyze the choice behavior in the decision situations across treatments. Role-assignments are treatment specific, as described in Figure 3. Additional details on the experimental procedure, a discussion of potential demand effects and a translation of the instructions can be found in Appendix B and Appendix C.

5. Results

Each of the 192 subjects participated in all four treatments. Due to the role assignment protocol in RCT, the decisions of only half the sample were incentivized in this treatment. If not explicitly stated otherwise, only incentivized decisions are used for statistical analysis.

5.1. Descriptive Analysis

Table 1 summarizes the data on subjects’ SVO scores. SVO scores close to zero (around ±7) indicate choice behavior that is consistent with narrow self-interest, while more positive scores indicate more concerns for others (i.e., higher degrees of prosociality). A score of 45 would indicate perfect prosociality (i.e., weighting the other person’s payoff as much as the own payoff), while scores above 45 would indicate strong altruism (i.e., weighting the other person’s payoff more than the own payoff). The observed distributions of SVO scores are consistent with data from earlier experiments in which SVO was measured [17]. The first four columns of Table 1 contain the descriptive statistics for incentivized choices only. In RCT half of the subjects made hypothetical decisions which are summarized in column 6. Pooled observations from RCT are summarized in column 5.
These descriptive statistics concerning SVO scores are informative with respect to the question whether distributional preferences differ systematically across treatments. However, they are much less informative with respect to the consistency of choice behavior across treatments, while consistency is a very important metric concerning the hypotheses we are going to test. Say for example that half of the subjects became more prosocial in a particular treatment and half become less prosocial in the same treatment (compared to a baseline treatment). This result would yield a consistent mean level of prosociality, but it would not indicate that overall subjects were behaving consistently. To analyze choice consistency across treatments, comparisons between SVO scores at the individual level (i.e., within subjects) are required.
The scatterplots (Figure 4) and the corresponding rank correlations reveal that there is substantial heterogeneity at the individual level, indicating inconsistency in choice behavior across treatments. Each scatterplot compares individual SVO scores between two treatments and reports the corresponding correlation. We see that for all pairwise comparisons, there are data points both above and below the 45-degree line. This indicates changes in distributional preferences at the individual level. There are only 16 out of 192 subjects for whom SVOs were identical in all treatments.6
The correlations among individual SVO scores across treatments (see Figure 4) can be treated as a method similarity matrix, which itself can be the basis for further analysis using classical multi-dimensional scaling. This kind of analysis provides data on the “distance” (i.e., dissimilarity) among the different methods. Moreover, if the different methods were inconsequential to behavior, then the correlations between the treatments would be very high and be approximately the same as a test-retest correlation. However, the rank correlations between treatments are of low to medium size at best, ranging between ( ρ = 0 . 26 ) and ( ρ = 0 . 53 ), which serves as a first indication that individual choice behavior was indeed affected substantially by the experimental treatments.

5.2. Hypotheses Tests

In this section we present the results for the hypotheses discussed above. After stating each result, we describe the statistical tests that support the result, followed by a short discussion.

5.2.1. Main Results

Result 1.
Choice behavior in decomposed games differs from choice behavior in corresponding matrix games.
This result is based on two analyses. First, the rank correlation of individual SVO scores between the decomposed game treatment (DGT) and the matrix game treatment (MGT) is only ρ = 0 . 41 and hence much lower than would be expected if the two treatments constituted equivalent measures. As a comparison, the test-retest correlation of the standard SVO Slider Measure is r = 0 . 915 , implying expected deviations of about 0.085 (95% CI 0.065 to 0.111) due to measurement error alone.7 Please note that the two situations subjects are confronted with in MGT and DGT are identical while the only difference between the two treatments is the way in which information is displayed.
The difference in means between SVO scores in DGT (mean = 17 . 3 , sd = 13 . 97 ) and in MGT (mean = 18 . 83 , sd = 16 . 92 ) is not statistically significant ( t ( 191 ) = 1 . 243 , p = 0 . 216 ). Also, the difference in median SVO scores (DGT: 14 . 94 , MGT: 16 . 26 ) is not significantly different from zero (Wilcoxon signed rank test, z = 1 . 05 , p = 0 . 295 ). This indicates that the two treatments do not evoke differential degrees of prosociality at the aggregate level. Rather, some subjects behaved much more prosocially when confronted with the matrix game when compared to the decomposed game, while other subjects show the opposite pattern (see the corresponding bottom-right scatterplot in Figure 4). An analysis of absolute differences in individual SVO scores corroborates this result. On average, the absolute difference in individual SVO scores between the two treatments (i.e., the mean of | S V O ( D G T ) - S V O ( M G T ) | ) is 12.49. From these analyses we conclude that choice behavior in decomposed games differs from choice behavior in corresponding matrix games as suggested in Hypothesis 1.
Regarding the question of how choice behavior differs between the treatments, we analyze the data with respect to the two potential theoretical accounts magical thinking and social projection.
First, magical thinking would lead people to behave more prosocially in strategic situations, given that they perceive the situation as being strategic. Consequently, we would expect to observe higher degrees of prosociality in MGT and DGT as compared to RCT and RUT, given that DGT is perceived as a strategic situation. Alternatively, given that subjects perceive DGT as a decision making task rather than a proper game, we would expect to observe higher degrees of prosociality in MGT as compared to DGT, RCT and RUT. However, as reported above, SVO scores do not differ significantly between DGT and MGT.
To test for potential differences in SVO scores between [DGT, MGT] on the one side, and [RCT, RUT] on the other side, we computed each subject’s average SVO from the non-strategic treatments [RCT, RUT] on the one hand and the strategic treatments [DGT, MGT] on the other hand, using only observations from the 96 subjects who made incentivized choices in RCT. Let us denote these mean scores as S V O ( n o n s t r . ) and S V O ( s t r . ) , respectively. The difference in means between S V O ( n o n s t r . ) (mean = 17 . 97 , sd = 11 . 89 ) and S V O ( s t r . ) (mean = 19 . 80 , sd = 12 . 27 ) is not statistically significant ( t ( 95 ) = - 1 . 561 , p = 0 . 122 , two-sided). A signed rank test shows that the median of differences is only marginally significantly different from zero ( z = - 1 . 751 , p = 0 . 080 ). Hence, we find only weak evidence that subjects behaved systematically more prosocially when making choices in proper games as compared to resource allocation tasks at the aggregate level. Thus, the results do not provide strong support for magical thinking as an explanation.
Second, differences in choice behavior between the treatments may be accounted for by social projection. If so, we would expect to observe that prosocial subjects behave more prosocially, and conversely individualistic subjects behave more individualistically in strategic situations as compared to decision making tasks. That is, individual SVO scores would be amplified in strategic situations.
Given that DGT is not perceived as a strategic interaction (or as less so), we would expect that SVO scores are amplified in MGT as compared to DGT. To test this, we first categorize subjects based on their SVO in DGT as either prosocial or proself given the chance of S V O = 22 . 45 (see [17]). Next, we test for systematic shifts in SVO scores between DGT and MGT for prosocials and proselfs separately. The analyses show that there are significant shifts, but in unexpected directions. Prosocials behave less prosocially in MGT (mean = 27 . 38 , sd = 14 . 62 ) as compared to DGT (mean = 32 . 81 , sd = 6 . 06 , t ( 71 ) = 3 . 06 , p = 0 . 003 , two-sided), while proselfs behave more prosocially in MGT (mean = 13 . 69 , sd = 16 . 16 ) as compared to DGT (mean = 7 . 99 , sd = 7 . 63 , t ( 119 ) = - 3 . 69 , p = 0 . 0003 , two-sided).
To test for a similar pattern when comparing the two non-strategic situations [RCT, RUT] with the strategic MGT, we use S V O ( n o n s t r . ) as the benchmark for categorizing subjects into prosocials and proselfs. We find that this comparison, too, shows that prosocials behave less prosocially in MGT (mean = 26 . 61 , sd = 16 . 14 ) as compared to [RCT, RUT] ( S V O ( n o n s t r . ) mean = 30 . 57 , sd = 6 . 24 , t ( 34 ) = 1 . 46 , p = 0 . 153 , two-sided), while proselfs behave more prosocially in MGT (mean = 15 . 98 , sd = 15 . 65 ) as compared to [RCT,RUT] ( S V O ( n o n s t r . ) mean = 10 . 75 , sd = 7 . 51 , t ( 60 ) = - 2 . 67 , p = 0 . 0099 , two-sided).
Clearly, the pattern of results is not consistent with the hypothesis of social projection, but rather the observed pattern is exactly the opposite of what would be expected if subjects form beliefs based on social projection. We will discuss potential explanations for this observation in the conclusions.
Result 2.
Choice behavior in decomposed games is more consistent with choice behavior in decision making tasks as compared to choice behavior in corresponding matrix games.
This result is consistent with both an inspection of the dissimilarity matrix in Table 2 and multidimensional results (explained below). RCT and MGT produce the largest difference between treatments (0.741), and DGT and RUT produce the smallest difference (0.466). All of these differences are more than would be expected from chance alone. That is, the observed differences are substantially larger than would be expected given the Slider Measure’s test-retest reliability, indicating substantial effects of contextual variation on the measurement of distributive preferences at the individual level.
Results from multidimensional scaling yields an ordering of the different methods in terms of similarity.8 The resulting order is: RCT, RUT, DGT, and MGT. The raw output scores are −0.4404, −0.1296, −0.0434, 0.6135 respectively. The stress of the model is (1.65 × 10⁻⁶) indicating adequacy of the goodness of fit of the unidimensional model. These multidimensional scaling scores are then normalized between 0 and 1 (see Figure 5), and the results show in a simple display that behavior in DGT is more consistent with behavior in both RCT and RUT than with people’s choice behavior in the MGT condition.
Please note that the large differences in scores between DGT and MGT is not inconsistent with the lack of significant differences in mean (or median) SVO scores across treatments. The central tendency of the DGT and MGT distributions are similar but that does not imply that individual behavior in the treatments is consistent. Rather, we see that many DMs respond strongly to the strategic framing, but in different ways.
These results are corroborated by the additional analysis of comparisons between absolute differences in SVO scores across treatments at the individual level (see Table 3).9 As mentioned above, the absolute difference in individual SVO scores between DGT and MGT is 12.49. This absolute difference is similar in magnitude to the absolute differences in SVO scores between RCT and RUT on one side, and MGT on the other side (13.54 and 12.14, respectively). Also, none of these three difference scores is significantly different from the others (see Table 4). This indicates that differences in choice behavior between the two strategic interactions (DGT and MGT), which vary only in the way information is displayed, are as large as the differences in choice behavior between the decision making tasks (RCT and RUT) and the proper game (MGT).
Concurrently, choice behavior in DGT differs about as much from choice behavior in both RCT and RUT (0.544 and 0.466, respectively) as choice behavior differs between the two decision making tasks themselves (0.484). The correlation of individual SVO scores between DGT and RUT ( ρ = 0 . 534 ) is even slightly higher than the one between RCT and RUT ( ρ = 0 . 516 ).
At the aggregate level, the pattern of results indicates that choice behavior in decomposed games under double role assignment is more consistent with choice behavior in non-strategic resource allocation tasks as compared to choice behavior in a corresponding proper game represented in matrix form. In other words, framing a proper game in the spirit of a resource allocation task by presenting the game in decomposed rather than matrix form indeed appears to have the originally intended effect of removing the saliency of the situation’s strategic character (see e.g., [29,30]). Moreover, the mean absolute difference in SVO scores between RCT and DGT (9.39) is substantially and statistically significantly (see Table 3) lower than between DGT and MGT (12.49). The mean absolute difference between RUT and DGT (8.64) is substantially and statistically significantly lower than between DGT and MGT. This means that changing the way information is displayed given a particular situation, e.g., by presenting a game in decomposed rather than its corresponding matrix form (MGT → DGT), can have a more dramatic effect on behavior than changing the situation itself, i.e., confronting people with a proper game rather than a non-strategic decision making task (RCT → DGT).

5.2.2. Secondary Results

Result 3.
Choice behavior under role uncertainty indicates more prosociality as compared to choice behavior under role certainty.
On average, we find that subjects in RUT behave more prosocially than in RCT. That is, there is a significant difference in mean SVO scores between subjects who made choices under role uncertainty (mean = 19 . 49 , sd = 14 . 19 )10 and subjects who made choices under role certainty (mean = 16 . 46 , sd = 13 . 06 , t ( 95 ) = - 2 . 222 , p = 0 . 029 , two-sided). Our experiment cannot tell whether this result is driven by fairness considerations or by the cost of expressing generosity. However, if SVO is measured with role uncertainty, a subject’s SVO score likely indicates an upper bound.
Result 4.
We find mixed evidence concerning differences in degrees of prosociality in incentivized choices as compared to not incentivized choices.
To see how financial incentives affect behavior, we look both at within-subjects and between-subjects tests (see H4 in Section 3.2). First, we compare SVO scores within the RCT, comparing subjects who made incentivized choices with subjects who made hypothetical choices (between subjects). In RCT there is no significant difference between incentivized and hypothetical choices (incentivized: mean = 16 . 46 , sd = 13 . 06 , hypothetical: mean = 19 . 51 , sd = 16 . 18 ; t = 1 . 435 , p = 0 . 153 ; Mann-Whitney test, z = 1 . 475 , p = 0 . 140 ). This insignificant result might be due to the low statistical power of the between-subject comparison. Assuming a small effect size of d = 0 . 25 the statistical power ( 1 - β ) is only 0 . 51 .
Second, we compare SVO scores of subjects who made hypothetical choices in the RCT to the same subjects’ SVO scores in the RUT (within subjects). Using this more powerful within-subject comparison ( 1 - β = 0 . 77 for d = 0 . 25 and α = 0 . 05 ), we find evidence for differences. Both mean and median SVO scores based on hypothetical choices from RCT exceed SVO scores based on incentivized choices from RUT. According to a one-sided signed rank test, the median of hypothetical choices ( 16 . 73 ) significantly ( p = 0 . 0043 ) exceeds the median of incentivized choices ( 12 . 89 ). According to a one-sided t-test, the difference in means between hypothetical choices (mean = 19 . 51 , sd = 16 . 18 ) and incentivized choices (mean = 16 . 48 , sd = 13 . 06 ) is significant ( t ( 95 ) = - 2 . 10 , p = 0 . 019 ).
As an additional result, we find that financial incentives significantly reduce variance in RCT (Levene test, W = 8 . 715 , d f ( 1 , 190 ) , p = 0 . 004 ). If incentivized decisions have less variance because subjects are less likely to respond haphazardly, incentives may be an effective way to reduce noise when measuring distributional preferences.

6. Conclusions

This article contributes to the literature by illuminating procedural differences and identifying their effects on distributional preferences as well as the corresponding choice behavior. We systematically studied the effect of three different methods to measure SVO (RCT, RUT, DGT), and included an obvious strategic choice (MGT) setting as a benchmark. Although laboratory experiments offer a relatively clean environment for assessing distributional preferences via resource allocation tasks, there necessarily remains at least some minimal social context in which choices are embedded, as there is some “other” whose payoff is affected by the DM’s choices. The role assignment and incentivization protocols, as well as the way in which information is displayed, create additional parts of the social context, and we found that subtle changes in the social context can affect choice behavior substantially.
We found that people do indeed respond quite strongly, while these responses are idiosyncratic and vary substantially at the individual level. This can, at least partly, be accounted for by the fact that strategic interactions evoke the formation of beliefs about the interaction partner’s behavior while corresponding expectations are supposed to be irrelevant in decision making tasks. As a consequence, some people may make more prosocial choices in a resource allocation task as compared to a game, while other people may show the opposite pattern. These individual differences are, in part, fueled by different beliefs or expectations about the other, layered on top of innate distributional preferences. Accordingly, we found no systematic differences in prosociality between the two situations on the aggregate. This particular result emphasizes the importance of considering results at the individual vs. aggregate level.
The analyses concerning Result 1 showed that—at the aggregate level—there is no difference in mean SVO scores between DGT and MGT, both of which are strategic choice settings. However, this does not imply that people are consistent in the choices they make in decomposed games as compared to matrix games. As the comparison between DGT and MGT in Figure 4 reveals, many subjects behaved more prosocially when playing the game in matrix form as compared to its decomposed form, while many other subjects showed the opposite pattern. At the aggregate level, these changes (i.e., the differences in SVO scores between DGT and MGT) cancel out, but at the individual level, these differences are substantial and far more pronounced than would be expected from measurement error alone.
The comparison of decomposed games and matrix games adds to the literature on presentation effects.11 Since there is a large difference in individual choice behavior between DGT and MGT but only a small difference between RUT and DGT (see the analyses concerning Result 2), it seems that the decomposed game framing sufficiently hides the potential consequences from the other subject’s choice. As a result, choice behavior in decomposed games under double role assignment is more consistent with choice behavior in non-strategic resource allocation tasks as compared to choice behavior in proper games represented in matrix form.
As for the question of how choice behavior differs between proper games and corresponding decision making tasks, we performed exploratory analyses to test if magical thinking or social projection may account for the observed behavioral patterns. Our data does support neither of these two possible explanations. In fact, we found a pattern that is the exact opposite of what would be expected by social projection. That is, our data suggest that prosocials behave less prosocially and proselfs behave more prosocially in strategic situations as compared to resource allocation tasks. There are several conceivable (albeit speculative) explanations for this pattern. For instance, people may be aware that the population consists of a wide variety of different distributional-preference-types and perhaps hold a mental representation of an average type. As a result, people with high degrees of prosociality may represent the average type as a less prosocial person than they themselves are, while people with low degrees of prosociality may represent the average type to be a more prosocial person than they themselves are.12 Consequently, given that people are motivated to make choices similar to the ones they expect their interaction partner will make, prosocial people would make less prosocial choices while individualistic people would make more prosocial choices in strategic situations as compared to decision making tasks. Our data is consistent with this explanatory account. However, we did not explicitly design the experiment to test effects of that kind and further research is required to evaluate the validity of this line of reasoning. The analyses we performed suggest, though, that conducting further research along these lines may be a worthwhile undertaking.
Concerning the question to what extent incentives affect choice behavior in resource allocation tasks, we find mixed evidence. Nonetheless, we do not necessarily agree with Mentzakis and Mestelman [46] who argue that eliciting SVO without financial incentives comes with no disadvantages. The difference in medians suggests that there may be a tendency of subjects to behave more prosocially if no incentives are used. Moreover, we find that hypothetical decisions may inflate variance and hence reduce statistical power (see also Camerer and Hogarth [54]).
With respect to the question whether different role assignment protocols evoke differential degrees of generosity, we find evidence that choice behavior indicates higher degrees of prosociality under the protocol of role uncertainty. Hence we conjecture that when distributional preferences are measured under the protocol of role uncertainty, a subject’s assessed degree of prosociality should be taken as an approximate upper bound. Therefore, the efficiency gained by applying a role uncertainty protocol in resource allocations tasks likely comes at the cost of overestimating degrees of prosociality. Experimenters should weigh the benefits of an efficiency advantage against the possibility of collecting slightly—though systematically—distorted distributional preference results. Luckily, for the cost-efficiency-minded researcher, the effect is rather small in size, and for work that only requires a rough approximation of distributive preferences, the RUT approach may be sufficient.13
While the role assignment protocols of role certainty and role uncertainty in the dyadic case are—to our knowledge—the most commonly used methods in corresponding experimental research, there are other role assignment protocols that have been used prior. One such protocol, which moves beyond dyadic settings, is the so-called ring matching, which has predominantly been used in economic experiments (e.g., [3,26,27,28]). With ring matching, every subject is Decider and Receiver at the same time, though the subject to whom she allocates money is not the same subject from whom she receives money. Given three subjects, for example, A dictates to B, B dictates to C, and C dictates to A. Please note that indirect reciprocity might affect behavior since A’s decision of how much to give to B could depend on A’s expectations about C’s behavior. However, as the size of the ring (i.e., the number of subjects within a ring) increases, these potential chains of indirect reciprocity do increase as well, which might itself affect behavior. In a theoretical analysis comparing role certainty and ring matching, Grech and Nax [56] suggest that prosocial behavior may decrease when the size of the ring increases. In a follow-up study to the one presented here, researchers could systematically vary the matching ring size and test Grech and Nax’s [56] predictions.
Our experiment is silent as to which of these social contexts provides the best way to measure distributional preferences. To establish evidence to address this question, one would have to measure distributional preferences using a variety of different social contexts and then use these different individual scores to predict other behavior (establishing predictive validity), correlate the scores on other measures (establishing convergent validity), and show how the scores were separate from other constructs like beliefs (establishing divergent validity). Ironically, a confounded measure of distributional preferences (simultaneously measuring both preferences and beliefs) may make better predictions of cooperative choices rather than a pure measure of distributional preferences alone, as beliefs are also a good predictor of cooperative behavior. It is for this reason that one would have to measure beliefs in tandem with preferences, in order to establish the unique predictive capacity of SVO for cooperative behaviors. All of these more complex experimental designs are beyond the scope of the current paper, which had the more modest goal of identifying to what degree, if at all, social contexts in terms of role assignment and incentivization protocols affect subject’s choice behavior in resource allocation tasks and to what degree decomposed games are effective in removing the saliency of strategic interdependence in proper games.

Author Contributions

Conceptualization and Methodology, M.G., K.A.A. and R.O.M.; Software, K.A.A.; Formal Analysis, M.G., K.A.A. and R.O.M.; Writing—Original Draft Preparation, M.G.; Writing—Review & Editing, M.G., K.A.A. and R.O.M.; Funding Acquisition, M.G.

Funding

This research was funded by the University of Giessen (Germany).

Acknowledgments

We thank Max Albert, Rudolf Kerschbamer, the participants of the Social Norms and Institutions Conference (ETH Zurich), the participants of the 14th TIBER Symposium on Economics and Psychology (Tilburg) and the participants of the ESA European meeting 2015 (Heidelberg) for helpful comments and suggestions. Janis Cloos and Simone Schweizer provided excellent research assistance.

Conflicts of Interest

The authors declare no conflict of interest. The founding sponsors had no role in the design of the study; in the collection, analyses, or interpretation of data; in the writing of the manuscript, and in the decision to publish the results.

Abbreviations

The following abbreviations are used in this manuscript:
DGTDecomposed Game Treatment
DMDecision Maker
MGTMatrix Game Treatment
RCTRole Certainty Treatment
RUTRole Uncertainty Treatment
SVOSocial Value Orientation

Appendix A. Details on the SVO Slider Measure

The six resource allocation tasks depicted in Figure A1 are the six primary items of the SVO Slider Measure. Based on the DM’s choices, her SVO is computed as
S V O = arctan π ¯ o - 50 π ¯ s - 50 ,
where π ¯ s and π ¯ o denote the DM’s and the other’s mean payoff. The SVO angle can range between −16.26° and 61.39°, while negative angular degrees indicate negative concerns for others, angular degrees close to zero indicate narrow self-interest, and positive angular degrees indicate positive concerns for others.
Figure A1. The six resource allocation tasks from the SVO Slider Measure.
Games 09 00080 g0a1

Appendix B. Detailed Experimental Procedure

The experiment was conducted at the University of Giessen using zTree [47]. A total of 192 subjects participated. Upon arrival, subjects were asked to take a seat at a randomly assigned computer workstation where they found general instructions which informed subjects that the experiment consists of four independent treatments. In addition to the general instructions, each subject found four sealed and differently colored envelopes on her desk, containing the instructions for the four different treatments.
Subjects were informed that at the beginning of each part, the on-screen instructions would inform them which colored envelope to open. This procedure ensures that subjects are informed about each treatment only when the treatment begins, but that the treatments exist a priori and are independent of their choices.
To avoid that subjects act prosocially in order to elicit kindness from reciprocators in subsequent tasks or treatments, subjects received feedback about results and earnings only at the very end of the experiment.
The order in which subjects encountered the four treatments was fully counterbalanced across sessions. That is, we implemented all permutations of the orders of treatments, resulting in 4 ! = 24 orders that were each implemented in a separate session. The number of subjects per session was eight, and a no-contagion matching, which was also explained to subjects, was used [57].
At the beginning of each treatment, subjects opened the envelope containing the treatment-specific instructions which were also read aloud by the experimenter, and subjects had the opportunity to ask questions privately. Before starting the experimental task subjects had to answer a control question correctly to verify their comprehension.
Each treatment consists of six different decision situations. In treatments RCT, RUT and DGT the six decision situations correspond to the six resource allocation tasks which comprise the six primary items of the SVO Slider Measure (see Figure A1). In treatment MGT the six decision situations correspond to six matrix games (see Table A1 for an example and Appendix D for all six matrix games).14
Table A1. Recomposition of task number six into a matrix game. In treatment MGT, six matrices (derived from the corresponding decomposed games) were presented to subjects and subjects were asked to choose their most preferred allocations.
The Other’s Options
Option AOption BOption COption DOption E
Your OptionsOption A150, 150159, 146168, 143176, 139185, 135
Option B146, 159155, 155164, 152172, 148181, 144
Option C143, 168152, 164161, 161169, 157178, 153
Option D139, 176148, 172157, 169165, 165174, 161
Option E135, 185144, 181153, 178161, 174170, 170
Within each treatment, task order and option order of the six resource allocation tasks was fully randomized. These randomization procedures were implemented to control for order effects both within and across treatments, and moreover, to mitigate carryover effects from subjects remembering their previous choices in particular items and simply attempting to reproduce their former choice patterns rather than reflecting anew on their preferences in each task and treatment.
Subjects were informed that each subject’s final payoff was given by the sum of each treatment’s payoff plus a fixed show-up fee (5 euros). For each treatment, one of the six decision situations from each treatment was randomly selected, and the decisions made by both members in that decision situation determined payoffs from this treatment.
The experiment lasted 60 min and the average payment, including the show-up fee, was 14.55 Euros.
In principle, our within-subjects design could serve as a demand characteristic. According to Zizzo’s [59] paper on demand effects, “[e]xperimenter demand effects refer to changes in behavior by experimental subjects due to cues about what constitutes appropriate behavior (behavior ‘demanded’ from them)” (2010, p. 75). What constitutes the appropriate behavior in our experiment is far from clear. One possibility could be that the appropriate behavior would be consistent behavior, i.e., making the same choices in each treatment. This would lead to an underestimation of effect sizes. Another possibility could be that subjects focus on the differences in the matching procedure and react to these differences. However, what would be the appropriate reaction? Different subjects might have different ideas about what constitutes the appropriate behavior in any given treatment, so that potential demand effects would cancel out at the aggregate level. Demand effects would lead to overestimation only if there would be a positive correlation between the demand effect and our hypotheses (e.g., if the instructions signaled that it is appropriate to behave more prosocial with role uncertainty). We do not believe that this is the case. In fact, we believe that possible demand effects are uncorrelated with our hypotheses.
Since we cannot be certain (about the cause of the low correlations), we tried to minimize potential demand effects by (i) randomizing the order of the treatments, and (ii) informing subjects about each treatment when the treatment begins.

Appendix C. Experimental Instructions

Welcome to the experiment and thank you for your participation. Please read the instructions carefully. Do not talk to your neighbors during the entire experiment. If you have any questions please raise your hand. One of the experimenters will come to you and answer your questions in private. Following these rules is very important. Otherwise the results of this experiment will be scientifically worthless.
Please take your time reading the instructions and making your decisions. You are not able to influence the duration of the experiment by rushing through your decisions, because you always have to wait until the remaining participants have reached their decisions.
The experiment is completely anonymous. Neither during nor after the experiment you will be informed with whom you have interacted. No other participant will be informed about which role you were assigned to and how much you have earned. You will receive a show-up fee of 5 euros for your participation. Depending on your decisions and the decisions of the other participants you can additionally earn between 4 and 12 euros. You will be paid individually, privately, and in cash after the experiment. The expected duration of the experiment is 60 min. The exact course of the experiment will be described in the following.
The experiment consists of four parts which are independent from each other. Each part consists of six decision situations. The beginning of a new part of the experiment will be indicated on the screen. The instructions for each part of the experiment are in the colored envelopes. Please open the envelope with the relevant information only if the corresponding part of the experiment begins.
In each round, participants will be randomly matched in pairs, but you will never interact with the same participant twice. In other words, you can be sure that you will never interact with the same participant in several parts of the experiment. Furthermore, the matchings are done in such a way that the actions you take in one round cannot affect the actions of the people you will be paired with in later rounds. This also means that the actions of the participants you are paired with in a given round cannot be affected by your actions in earlier rounds.
During the experiment, you will not receive any information about the decisions of the other participants, and other participants will not receive information about your decisions.
During the experiment, the payoffs are denoted in points. The exchange rate between points and Euros is 1/50. In other words, for 50 points you receive 1 Euro.
Calculation of your final payoff: After the experiment, a decision situation is randomly selected from each part of the experiment. Each decision situation has the same probability for being selected. That is, in every part each decision situation could be the decision situation, which determined your payoff from this part. Therefore, it makes sense to treat each decision situation as if it is the payoff-relevant decision situation.
The payoff that you get in addition to the 5 euros is the sum of the payoffs in the randomly selected decision situations. At the end of the experiment, you will be informed about the four randomly selected decision situations, the corresponding payoffs, and the sum of the payoffs. There will be a brief questionnaire after the last round is completed. After completion of the questionnaire, you will receive your payoff in cash. Payoffs will be made in private so that other participants will not be informed about your payoff.
The experiment will begin shortly. If you have any questions please raise your hand and wait until someone comes to your place. Please do not talk to the other participants during the entire experiment. Thank you for participating.
Part “Red”
In this part of the experiment, there are two roles, Decider and Receiver, who will be randomly chosen. At the beginning, you will be informed about your role. In each of the six decision situations, the Decider chooses her most preferred allocation. That is, the decisions of the Decider determines her own payoff and the payoff of the Receiver. The Receiver has no influence on her own payoff and the payoff of the Decider. The Receiver chooses the allocation, that she would have chosen if she were in the role of the Decider. That is, that the decisions of the Receiver are purely hypothetical.
Your payoff from this part is calculated as follows: At the end of this part, a decision situation is randomly drawn and the allocation chosen by the Decider determines Decider’s and Receiver’s payoffs. You will be informed about the chosen decision situation and the corresponding payoffs at the end of the experiment.
Part “Blue”
In this part of the experiment, there will be six decisions. In each decision, you choose your most preferred allocation. The other participant faces the same decisions and has exactly same information as you. When you and the other participant have taken all decisions, it will randomly be determined whether payoffs are determined by your or the other participants’ decisions.
Your payoff from this part is calculated as follows: At the end of this part, a decision situation is randomly drawn. In addition, a fair coin toss determines whether payoffs are determined by your or the other participants’ decisions. You will be informed about the chosen decision situation and the corresponding payoffs at the end of the experiment.
Part “Green”
In this part of the experiment, there will be six decisions. In each decision, you choose your most preferred allocation. The other participant faces the same decisions and has exactly same information as you. The payoffs depend of your decisions and on the other participant’s decision.
Your payoff from this part is calculated as follows: At the end of this part, a decision situation is randomly drawn. Your payoff is given by the amount you have allocated to yourself, and the amount that the other participant has allocated to you. The payoff of the other participant is given by the amount the other participant has allocated to herself, and the amount that you have allocated to the other participant. You will be informed about the chosen decision situation and the corresponding payoffs at the end of the experiment.
Part “Yellow”
In this part of the experiment, you interact with another participant in six decision situations. In each decision situation, both participants have to make a decision. That is, each participant chooses the option she prefers. The payoffs that are associated with each combination of decisions are displayed in the payoff table.
In the row header there are the options that you can choose. In the column header there are the options that can be chosen by the other participant. The payoffs associated with a particular combination of choices are in the cell, in which the chosen row and column intersect. The entry to the left of the vertical bar within a cell is your payoff. The entry to the right of the vertical bar within a cell is the other participant’s payoff.
Your payoff from this part is calculated as follows: At the end of this part, a decision situation is randomly drawn. Your payoff and the other participant’s payoff is determined by the options you and the other participant selected in this decision situation. You will be informed about the chosen decision situation and the corresponding payoffs at the end of the experiment.

Appendix D. The Matrix Games Used in MGT

Table A2. Recomposition of task number one into a matrix game.
The Other’s Options
Option AOption BOption COption DOption E
Your OptionsOption A170, 170153, 170135, 170118, 170100, 170
Option B170, 153153, 153135, 153118, 153100, 153
Option C170, 135153, 135135, 135118, 135100, 135
Option D170, 118153, 118135, 118118, 118100, 118
Option E170, 100153, 100135, 100118, 100100, 100
Table A3. Recomposition of task number two into a matrix game.
The Other’s Options
Option AOption BOption COption DOption E
Your OptionsOption A100, 100109, 104118, 108126, 111135, 115
Option B104, 109113, 113122, 117130, 120139, 124
Option C108, 118117, 122126, 126134, 129143, 133
Option D111, 126120, 130129, 134137, 137146, 141
Option E115, 135124, 139133, 143141, 146150, 150
Table A4. Recomposition of task number three into a matrix game.
The Other’s Options
Option AOption BOption COption DOption E
Your OptionsOption A150, 150146, 159143, 168139, 176135, 185
Option B159, 146155, 155152, 164148, 172144, 181
Option C168, 143164, 152161, 161157, 169153, 178
Option D176, 139172, 148169, 157165, 165161, 174
Option E185, 135181, 144178, 153174, 161170, 170
Table A5. Recomposition of task number four into a matrix game.
The Other’s Options
Option AOption BOption COption DOption E
Your OptionsOption A150, 150129, 159108, 16886, 17665, 185
Option B159, 129138, 138117, 14795, 15574, 164
Option C168, 108147, 117126, 126104, 13483, 143
Option D176, 86155, 95134, 104112, 11291, 121
Option E185, 65164, 74143, 83121, 91100, 100
Table A6. Recomposition of task number five into a matrix game.
The Other’s Options
Option AOption BOption COption DOption E
Your OptionsOption A150, 150163, 138175, 125188, 113200, 100
Option B138, 163151, 151163, 138176, 126188, 113
Option C125, 175138, 163150, 150163, 138175, 125
Option D113, 188126, 176138, 163151, 151163, 138
Option E100, 200113, 188125, 175138, 163150, 150
Table A7. Recomposition of task number six into a matrix game.
The Other’s Options
Option AOption BOption COption DOption E
Your OptionsOption A150, 150159, 146168, 143176, 139185, 135
Option B146, 159155, 155164, 152172, 148181, 144
Option C143, 168152, 164161, 161169, 157178, 153
Option D139, 176148, 172157, 169165, 165174, 161
Option E135, 185144, 181153, 178161, 174170, 170

References

  1. De Boer, J. Social Preferences and Context Sensitivity. Games 2017, 8, 43–15. [Google Scholar] [CrossRef]
  2. Camerer, C.F.; Fehr, E. Measuring social norms and preferences using experimental games: A guide for social scientists. In Foundations of Human Sociality; Oxford University Press: New York, NY, USA, 2004; pp. 55–95. [Google Scholar]
  3. Fisman, R.; Kariv, S.; Markovits, D. Individual Preferences for Giving. Am. Econ. Rev. 2007, 97, 1858–1876. [Google Scholar] [CrossRef] [Green Version]
  4. Balliet, D.; Parks, C.; Joireman, J. Social value orientation and cooperation in social dilemmas: A meta-analysis. Group Process. Intergroup Relat. 2009, 12, 533–547. [Google Scholar] [CrossRef]
  5. Murphy, R.O.; Ackermann, K.A. Social value orientation: Theoretical and measurement issues in the study of social preferences. Personal. Soc. Psychol. Rev. 2014, 18, 13–41. [Google Scholar] [CrossRef] [PubMed]
  6. Kerschbamer, R. The geometry of distributional preferences and a non-parametric identification approach: The equality equivalence test. Eur. Econ. Rev. 2015, 76, 85–103. [Google Scholar] [CrossRef] [PubMed]
  7. Greiff, M. Affective social ties without the need to belong? Ration. Mark. Morals 2013, 4, 20–27. [Google Scholar]
  8. Murphy, R.O.; Ackermann, K.A. Explaining Behavior in Public Goods Games: How Preferences and Beliefs Affect Contribution Levels. 2013. Available online: https://ssrn.com/abstract=2244895 (accessed on 8 October 2018).
  9. Murphy, R.O.; Ackermann, K.A. Social preferences, positive expectations, and trust based cooperation. J. Math. Psychol. 2015, 67, 45–50. [Google Scholar] [CrossRef]
  10. Levati, M.V.; Miettinen, T.; Rai, B. Context and Interpretation in Laboratory Experiments: The Case of Reciprocity. J. Econ. Psychol. 2011, 32, 846–856. [Google Scholar] [CrossRef]
  11. Iriberri, N.; Rey-Biel, P. The role of role uncertainty in modified dictator games. Exp. Econ. 2011, 14, 160–180. [Google Scholar] [CrossRef]
  12. Walkowitz, G. On the Validity of Cost-Saving Payment Methods in Dictator-Game Experiments: A Systematic Test. 2018. Available online: https://ssrn.com/abstract=3068380 (accessed on 8 October 2018).
  13. Blanco, M.; Engelmann, D.; Normann, H.T. A within-subject analysis of other-regarding preferences. Games Econ. Behav. 2011, 72, 321–338. [Google Scholar] [CrossRef] [Green Version]
  14. Fischbacher, U.; Gächter, S.; Quercia, S. The behavioral validity of the strategy method in public good experiments. J. Econ. Psychol. 2012, 33, 897–913. [Google Scholar] [CrossRef] [Green Version]
  15. Dariel, A.; Nikiforakis, N. Cooperators and reciprocators: A within-subject analysis of pro-social behavior. Econ. Lett. 2014, 122, 163–166. [Google Scholar] [CrossRef]
  16. Kerschbamer, R. The Geometry of Distributional Preferences and a Non-Parametric Identification Approach; Working Papers in Economics and Statistics; University of Innsbruck: Tyrol, Austria, 2013. [Google Scholar]
  17. Murphy, R.O.; Ackermann, K.A.; Handgraaf, M.J.J. Measuring social value orientation. Judgm. Decis. Mak. 2011, 6, 771–781. [Google Scholar] [CrossRef]
  18. Forsythe, R.; Horowitz, J.L.; Savin, N.E.; Sefton, M. Fairness in simple bargaining experiments. Games Econ. Behav. 1994, 6, 347–369. [Google Scholar] [CrossRef]
  19. Dana, J.; Weber, R.A.; Kuang, J.X. Exploiting moral wiggle room: Experiments demonstrating an illusory preference for fairness. Econ. Theory 2007, 33, 67–80. [Google Scholar] [CrossRef]
  20. Bardsley, N. Dictator game giving: Altruism or artefact? Exp. Econ. 2007, 11, 122–133. [Google Scholar] [CrossRef]
  21. Visser, M.S.; Roelofs, M.R. Heterogeneous preferences for altruism: Gender and personality, social status, giving and taking. Exp. Econ. 2011, 14, 490–506. [Google Scholar] [CrossRef]
  22. Bruttel, L.; Stolley, F. Gender Differences in the Response to Decision Power and Responsibility—Framing Effects in a Dictator Game. Games 2018, 9, 28. [Google Scholar] [CrossRef]
  23. Charness, G.; Grosskopf, B. Relative payoffs and happiness: An experimental study. J. Econ. Behav. Organ. 2001, 45, 301–328. [Google Scholar] [CrossRef]
  24. Engelmann, D.; Strobel, M. Inequality aversion, efficiency, and maximin preferences in simple distribution experiments. Am. Econ. Rev. 2004, 94, 857–869. [Google Scholar] [CrossRef]
  25. Shafir, E.; Tversky, A. Thinking through uncertainty: Nonconsequential reasoning and choice. Cogn. Psychol. 1992, 24, 449–474. [Google Scholar] [CrossRef]
  26. Andreoni, J.; Miller, J. Giving according to GARP: An experimental test of the consistency of preferences for altruism. Econometrica 2002, 70, 737–753. [Google Scholar] [CrossRef]
  27. Balafoutas, L.; Kerschbamer, R.; Sutter, M. Distributional preferences and competitive behavior. J. Econ. Behav. Organ. 2012, 83, 125–135. [Google Scholar] [CrossRef] [PubMed]
  28. Balafoutas, L.; Kerschbamer, R.; Kocher, M.; Sutter, M. Revealed distributional preferences: Individuals vs. teams. J. Econ. Behav. Organ. 2014, 108, 319–330. [Google Scholar] [CrossRef] [PubMed] [Green Version]
  29. Pruitt, D.G. Reward structure and cooperation: The decomposed prisoner’s dilemma game. J. Personal. Soc. Psychol. 1967, 7, 21–27. [Google Scholar] [CrossRef]
  30. Messick, D.M.; McClintock, C.G. Motivational bases of choice in experimental games. J. Exp. Soc. Psychol. 1968, 4, 1–25. [Google Scholar] [CrossRef]
  31. Liebrand, W.B.G. The effect of social motives, communication and group size on behaviour in an N-person multi-stage mixed-motive game. Eur. J. Soc. Psychol. 1984, 14, 239–264. [Google Scholar] [CrossRef] [Green Version]
  32. Van Lange, P.A.M.; Bekkers, R.; Schuyt, T.N.M.; van Vugt, M. From games to giving: Social value orientation predicts donations to noble causes. Basic Appl. Soc. Psychol. 2007, 29, 375–384. [Google Scholar] [CrossRef] [Green Version]
  33. Offerman, T.; Sonnemans, J.; Schram, A. Value orientations, expectations and voluntary contributions in public goods. Econ. J. 1996, 106, 817–845. [Google Scholar] [CrossRef]
  34. Brosig, J. Identifying cooperative behavior: Some experimental results in a prisoner’s dilemma game. J. Econ. Behav. Organ. 2002, 47, 275–290. [Google Scholar] [CrossRef]
  35. Sonnemans, J.; van Dijk, F.; van Winden, F. On the dynamics of social ties structures in groups. J. Econ. Psychol. 2006, 27, 187–204. [Google Scholar] [CrossRef] [Green Version]
  36. Kanagaretnam, K.; Mestelman, S.; Nainar, K.; Shehata, M. The impact of social value orientation and risk attitudes on trust and reciprocity. J. Econ. Psychol. 2009, 30, 368–380. [Google Scholar] [CrossRef]
  37. Rigdon, M.L.; Levine, A.S. Gender, Expectations, and the Price of Giving. Rev. Behav. Econ. 2018, 5, 39–59. [Google Scholar] [CrossRef]
  38. Fischbacher, U.; Gächter, S.; Fehr, E. Are People Conditionally Cooperative? Evidence from a Public Goods Experiment. Econ. Lett. 2001, 71, 397–404. [Google Scholar] [CrossRef]
  39. Gallo, P.S., Jr.; Funk, S.G.; Levine, J.R. Reward size, method of presentation, and number of alternatives in a prisoner’s dilemma game. J. Personal. Soc. Psychol. 1969, 13, 239–244. [Google Scholar] [CrossRef]
  40. Krueger, J.I.; Acevedo, M.; Robbins, J.M. Self as sample. In Information Sampling and Adaptive Cognition; Fiedler, K., Juslin, P., Eds.; Cambridge University Press: New York, NY, USA, 2005; pp. 353–377. [Google Scholar]
  41. Pfattheicher, S.; Böhm, R. Honesty-humility under threat: Self-uncertainty destroys trust among the nice guys. J. Personal. Soc. Psychol. 2018, 114, 179–194. [Google Scholar] [CrossRef] [PubMed]
  42. Thielmann, I.; Hilbig, B.E. Trust in me, trust in you: A social projection account of the link between personality, cooperativeness, and trustworthiness expectations. J. Res. Personal. 2014, 50, 61–65. [Google Scholar] [CrossRef]
  43. Rabin, M. Incorporating fairness into game theory and economics. Am. Econ. Rev. 1993, 83, 1281–1302. [Google Scholar]
  44. Kirchgässner, G. Towards a theory of low-cost decisions. Eur. J. Political Econ. 1992, 8, 305–320. [Google Scholar] [CrossRef]
  45. Hillman, A.L. Expressive behavior in economics and politics. Eur. J. Political Econ. 2010, 26, 403–418. [Google Scholar] [CrossRef]
  46. Mentzakis, E.; Mestelman, S. Hypothetical bias in value orientations ring games. Econ. Lett. 2013, 120, 562–565. [Google Scholar] [CrossRef]
  47. Fischbacher, U. z-Tree: Zurich toolbox for ready-made economic experiments. Exp. Econ. 2007, 10, 171–178. [Google Scholar] [CrossRef] [Green Version]
  48. Höglinger, M.; Wehrli, S. Measuring Social Preferences on Amazon Mechanical Turk. In Social Dilemmas, Institutions, and the Evolution of Cooperation; Jann, B., Przepiorka, W., Eds.; De Gruyter: Berlin, Germnay; Boston, MA, USA, 2017; pp. 527–546. [Google Scholar]
  49. Ackermann, K.A. Social Value Orientation: An Analysis of Measurement, Form, Predictive Power, and Malleability of Social Preferences. Ph.D. Thesis, ETH Zurich, Zurich, Switzerland, 2014. [Google Scholar]
  50. Kruskal, J.B. Multidimensional scaling by optimizing goodness of fit to a nonmetric hypothesis. Psychometrika 1964, 29, 1–27. [Google Scholar] [CrossRef]
  51. Requate, T.; Waichman, I. A profit table or a profit calculator? A note on the design of Cournot oligopoly experiments. Exp. Econ. 2010, 14, 36–46. [Google Scholar] [CrossRef]
  52. Gürerk, Ö.; Selten, R. The effect of payoff tables on experimental oligopoly behavior. Exp. Econ. 2011, 15, 499–509. [Google Scholar] [CrossRef] [Green Version]
  53. Dariel, A. Conditional Cooperation and Framing Effects. Games 2018, 9, 37. [Google Scholar] [CrossRef]
  54. Camerer, C.F.; Hogarth, R.M. The effects of financial incentives in experiments: A review and capital-labor-production framework. J. Risk Uncertain. 1999, 19, 7–42. [Google Scholar] [CrossRef]
  55. Sefton, M. Incentives in simple bargaining games. J. Econ. Psychol. 1992, 13, 263–276. [Google Scholar] [CrossRef]
  56. Grech, P.D.; Nax, H.H. Nash Equilibria of Dictator Games: A New Perspective. 2017. Available online: https://ssrn.com/abstract=2989644 (accessed on 8 October 2018 ).
  57. Kamecke, U. Rotations: Matching schemes that efficiently preserve the best reply structure of a one shot game. Int. J. Game Theory 1997, 26, 409–417. [Google Scholar] [CrossRef]
  58. Crosetto, P.; Weisel, O.; Winter, F. A Flexible z-Tree Implementation of the Social Value Orientation Slider Measure (Murphy et al. 2011): Manual; Jena Economic Research Papers; Friedrich-Schiller-University Jena: Jena, Germany, 2012. [Google Scholar]
  59. Zizzo, D.J. Experimenter demand effects in economic experiments. Exp. Econ. 2009, 13, 75–98. [Google Scholar] [CrossRef]
1.
A similar argument also holds for last-mover decisions in sequential games because the last-mover’s behavior could be driven by reciprocity.
2.
See Iriberri and Rey-Biel [11] for a between-subjects design comparing role certainty and uncertainty; see Walkowitz [12] for a between-subjects design comparing different payment methods.
3.
Notice that in our terminology, different situations may emerge from varying social context. That is, as long as only one DM affects the final payoffs of all involved parties (i.e., under role assignment protocols such as role certainty, or role uncertainty), the situation constitutes a decision making task. However, as soon as the involved parties are interdependent, such that individual payoffs are determined by the other involved DMs’ choices as well (i.e., under double role assignment protocols), the situation constitutes a proper game.
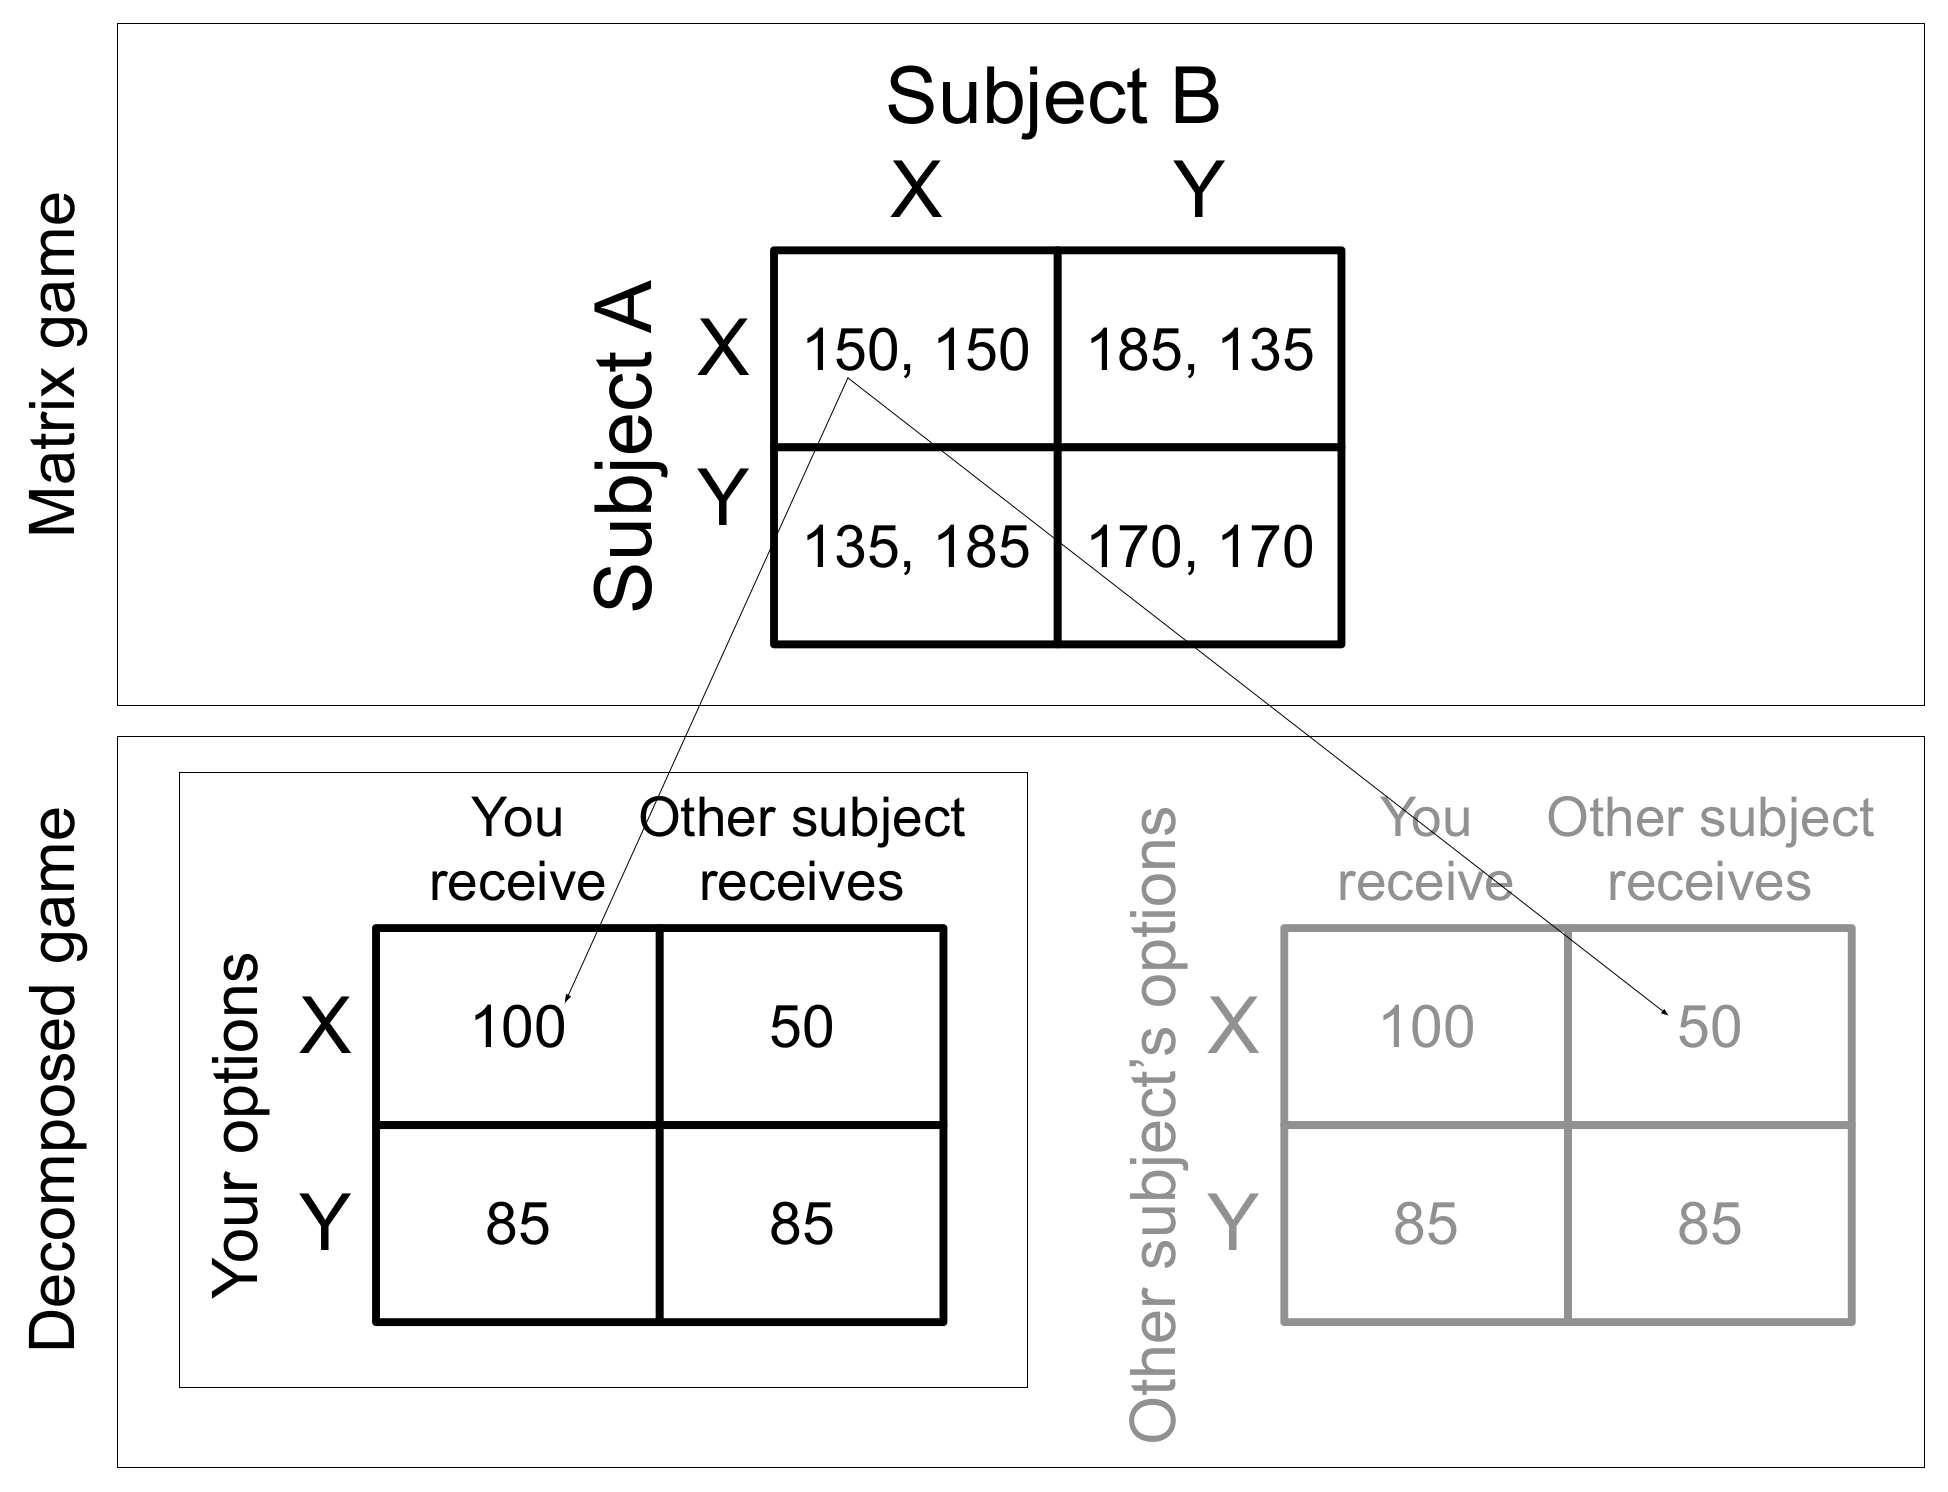
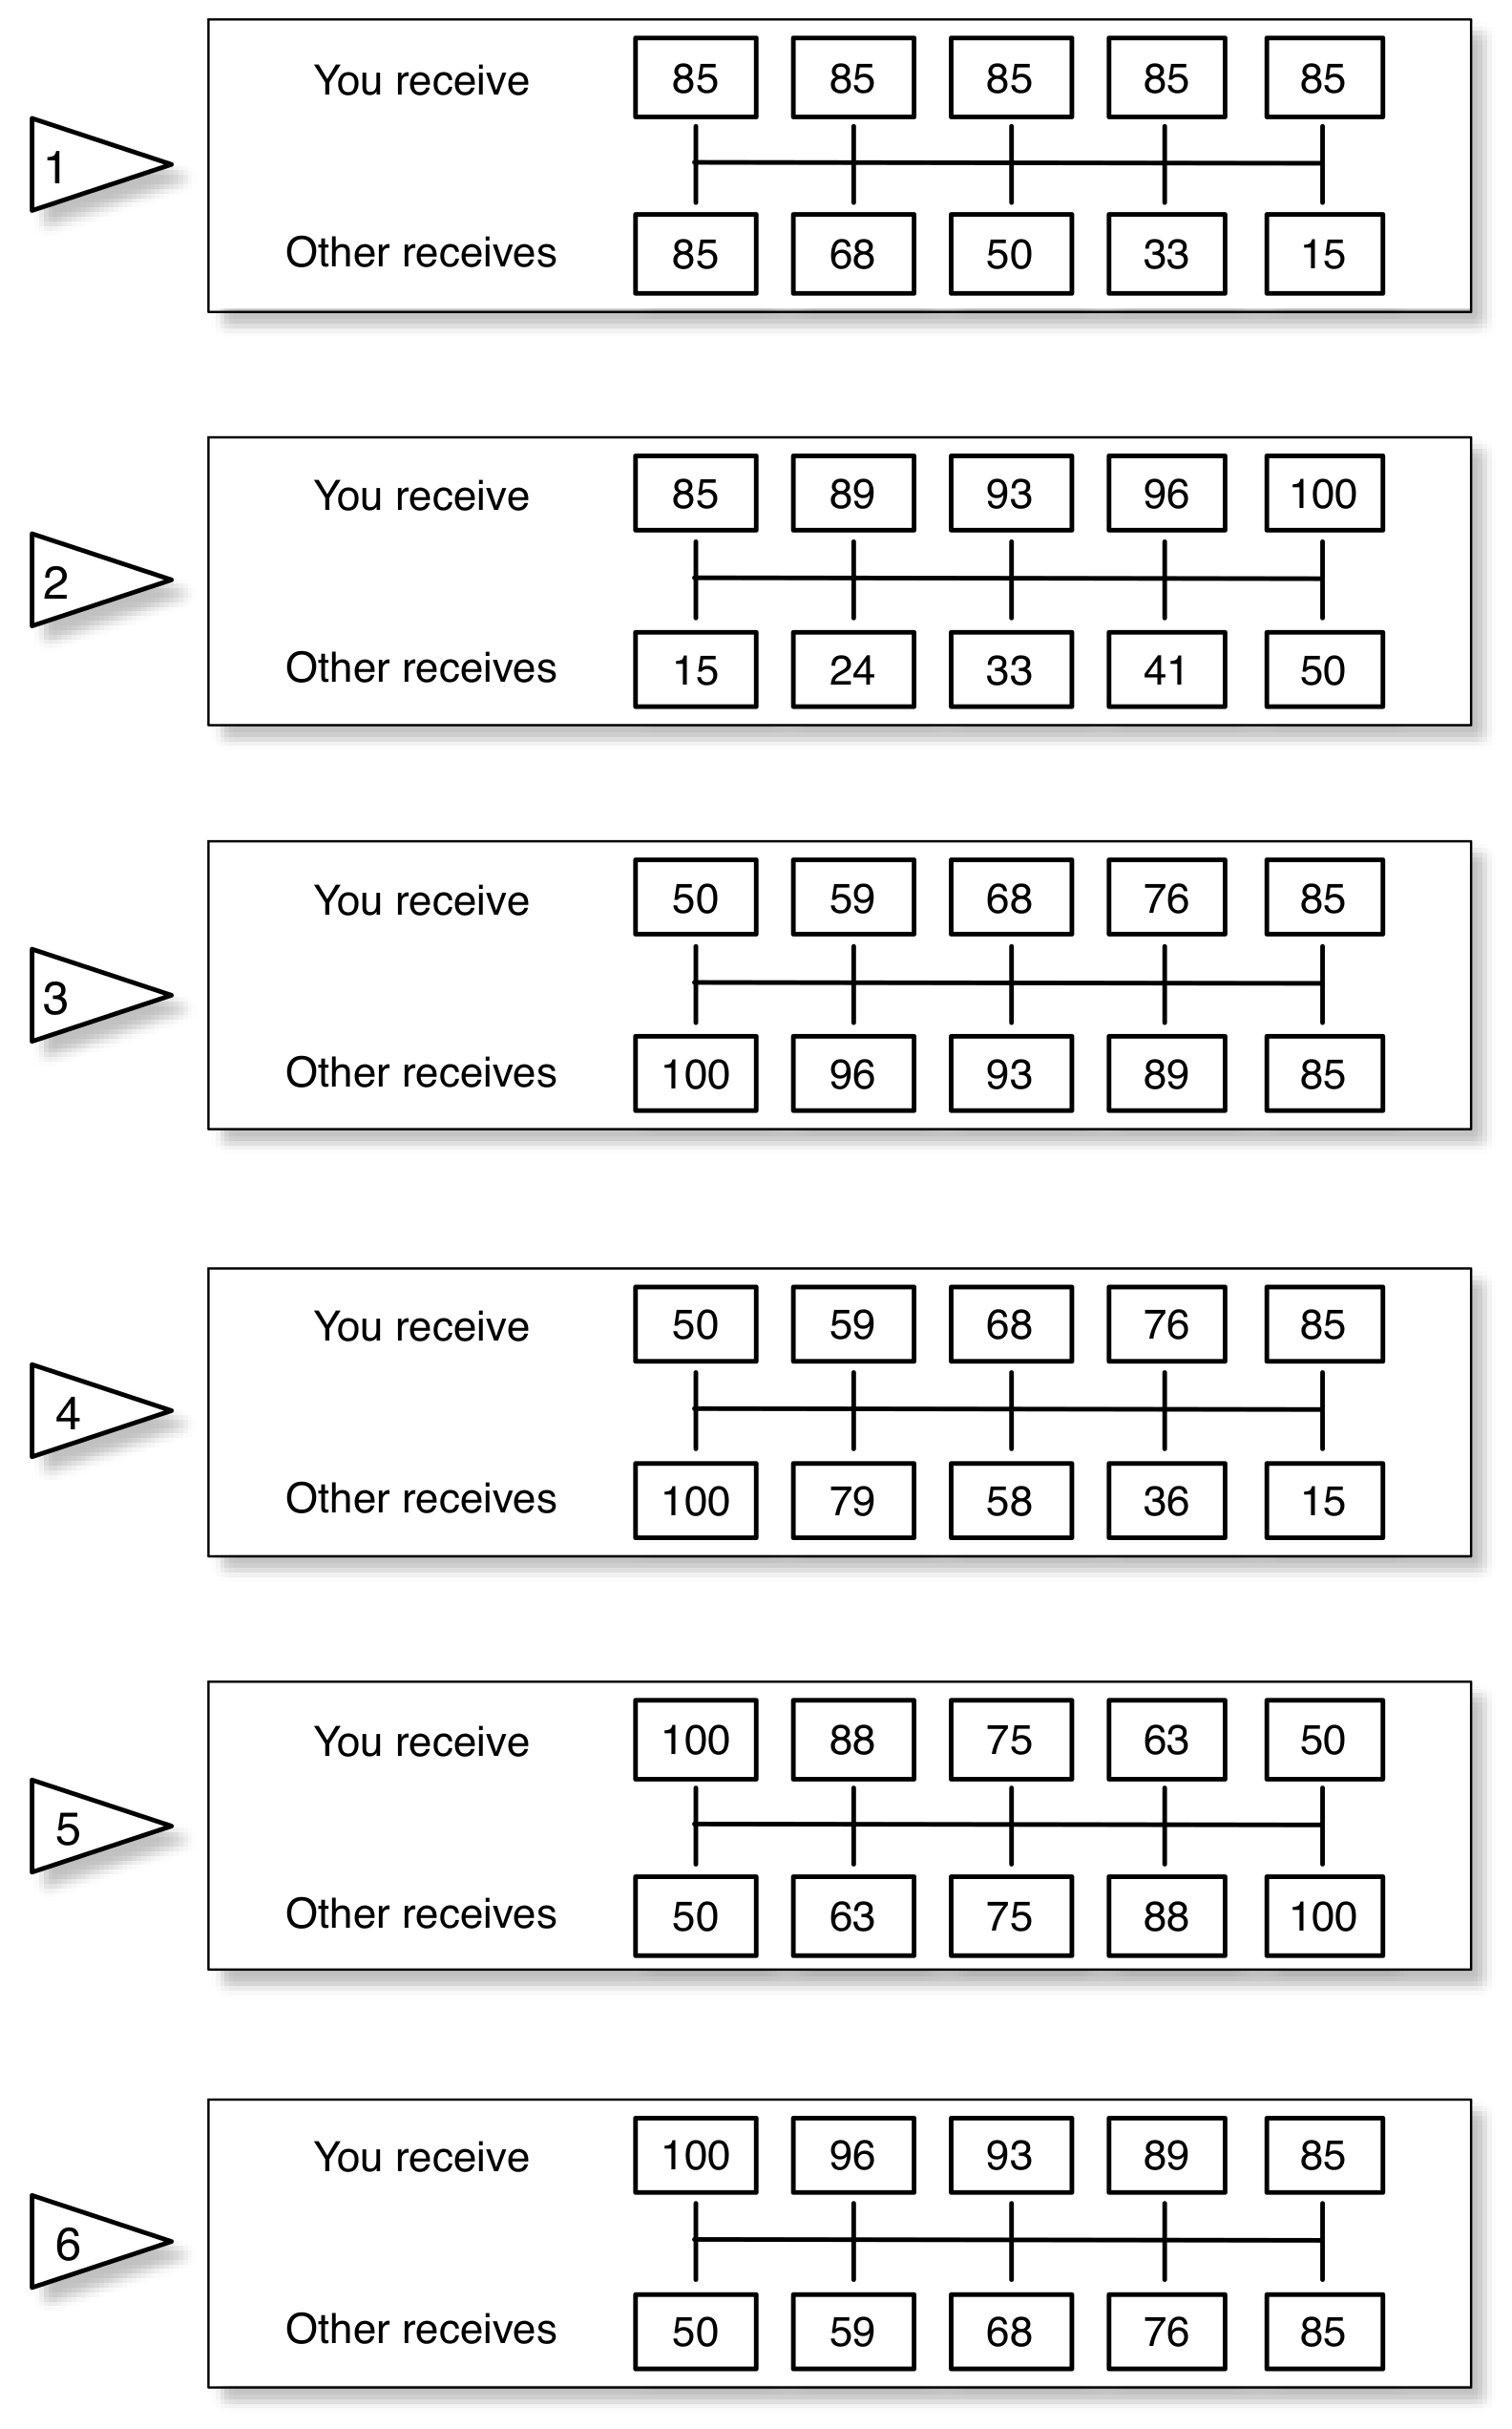
4.
In the SVO Slider Measure introduced in Murphy et al. [17], DMs choose between nine own-other payoff combinations in each of the six resource allocation tasks. With double-role assignment (see Section 2.2.3 below) this would result in a 9 × 9 payoff matrix with 81 cells. As this would put a very high cognitive load on subjects, we reduced the number of own-other payoff combinations from 9 to 5, resulting in a 5 × 5 payoff matrix (see Appendix D).
5.
Self-interest does not result in a score of exactly 0 because allocation task 1 is structured such that the DM’s payoff is invariant at 85 and the DM chooses a payoff for the other ranging between 15 and 85.
6.
For 9 subjects, who made hypothetical decisions in RCT, SVOs were the same in RUT, DGT and MGT; for 7 subjects, who made incentivized decisions in RCT, SVOs were the same in all four treatments. For a total of 37 subjects, SVO scores do not differ by more than 5 units between treatments.
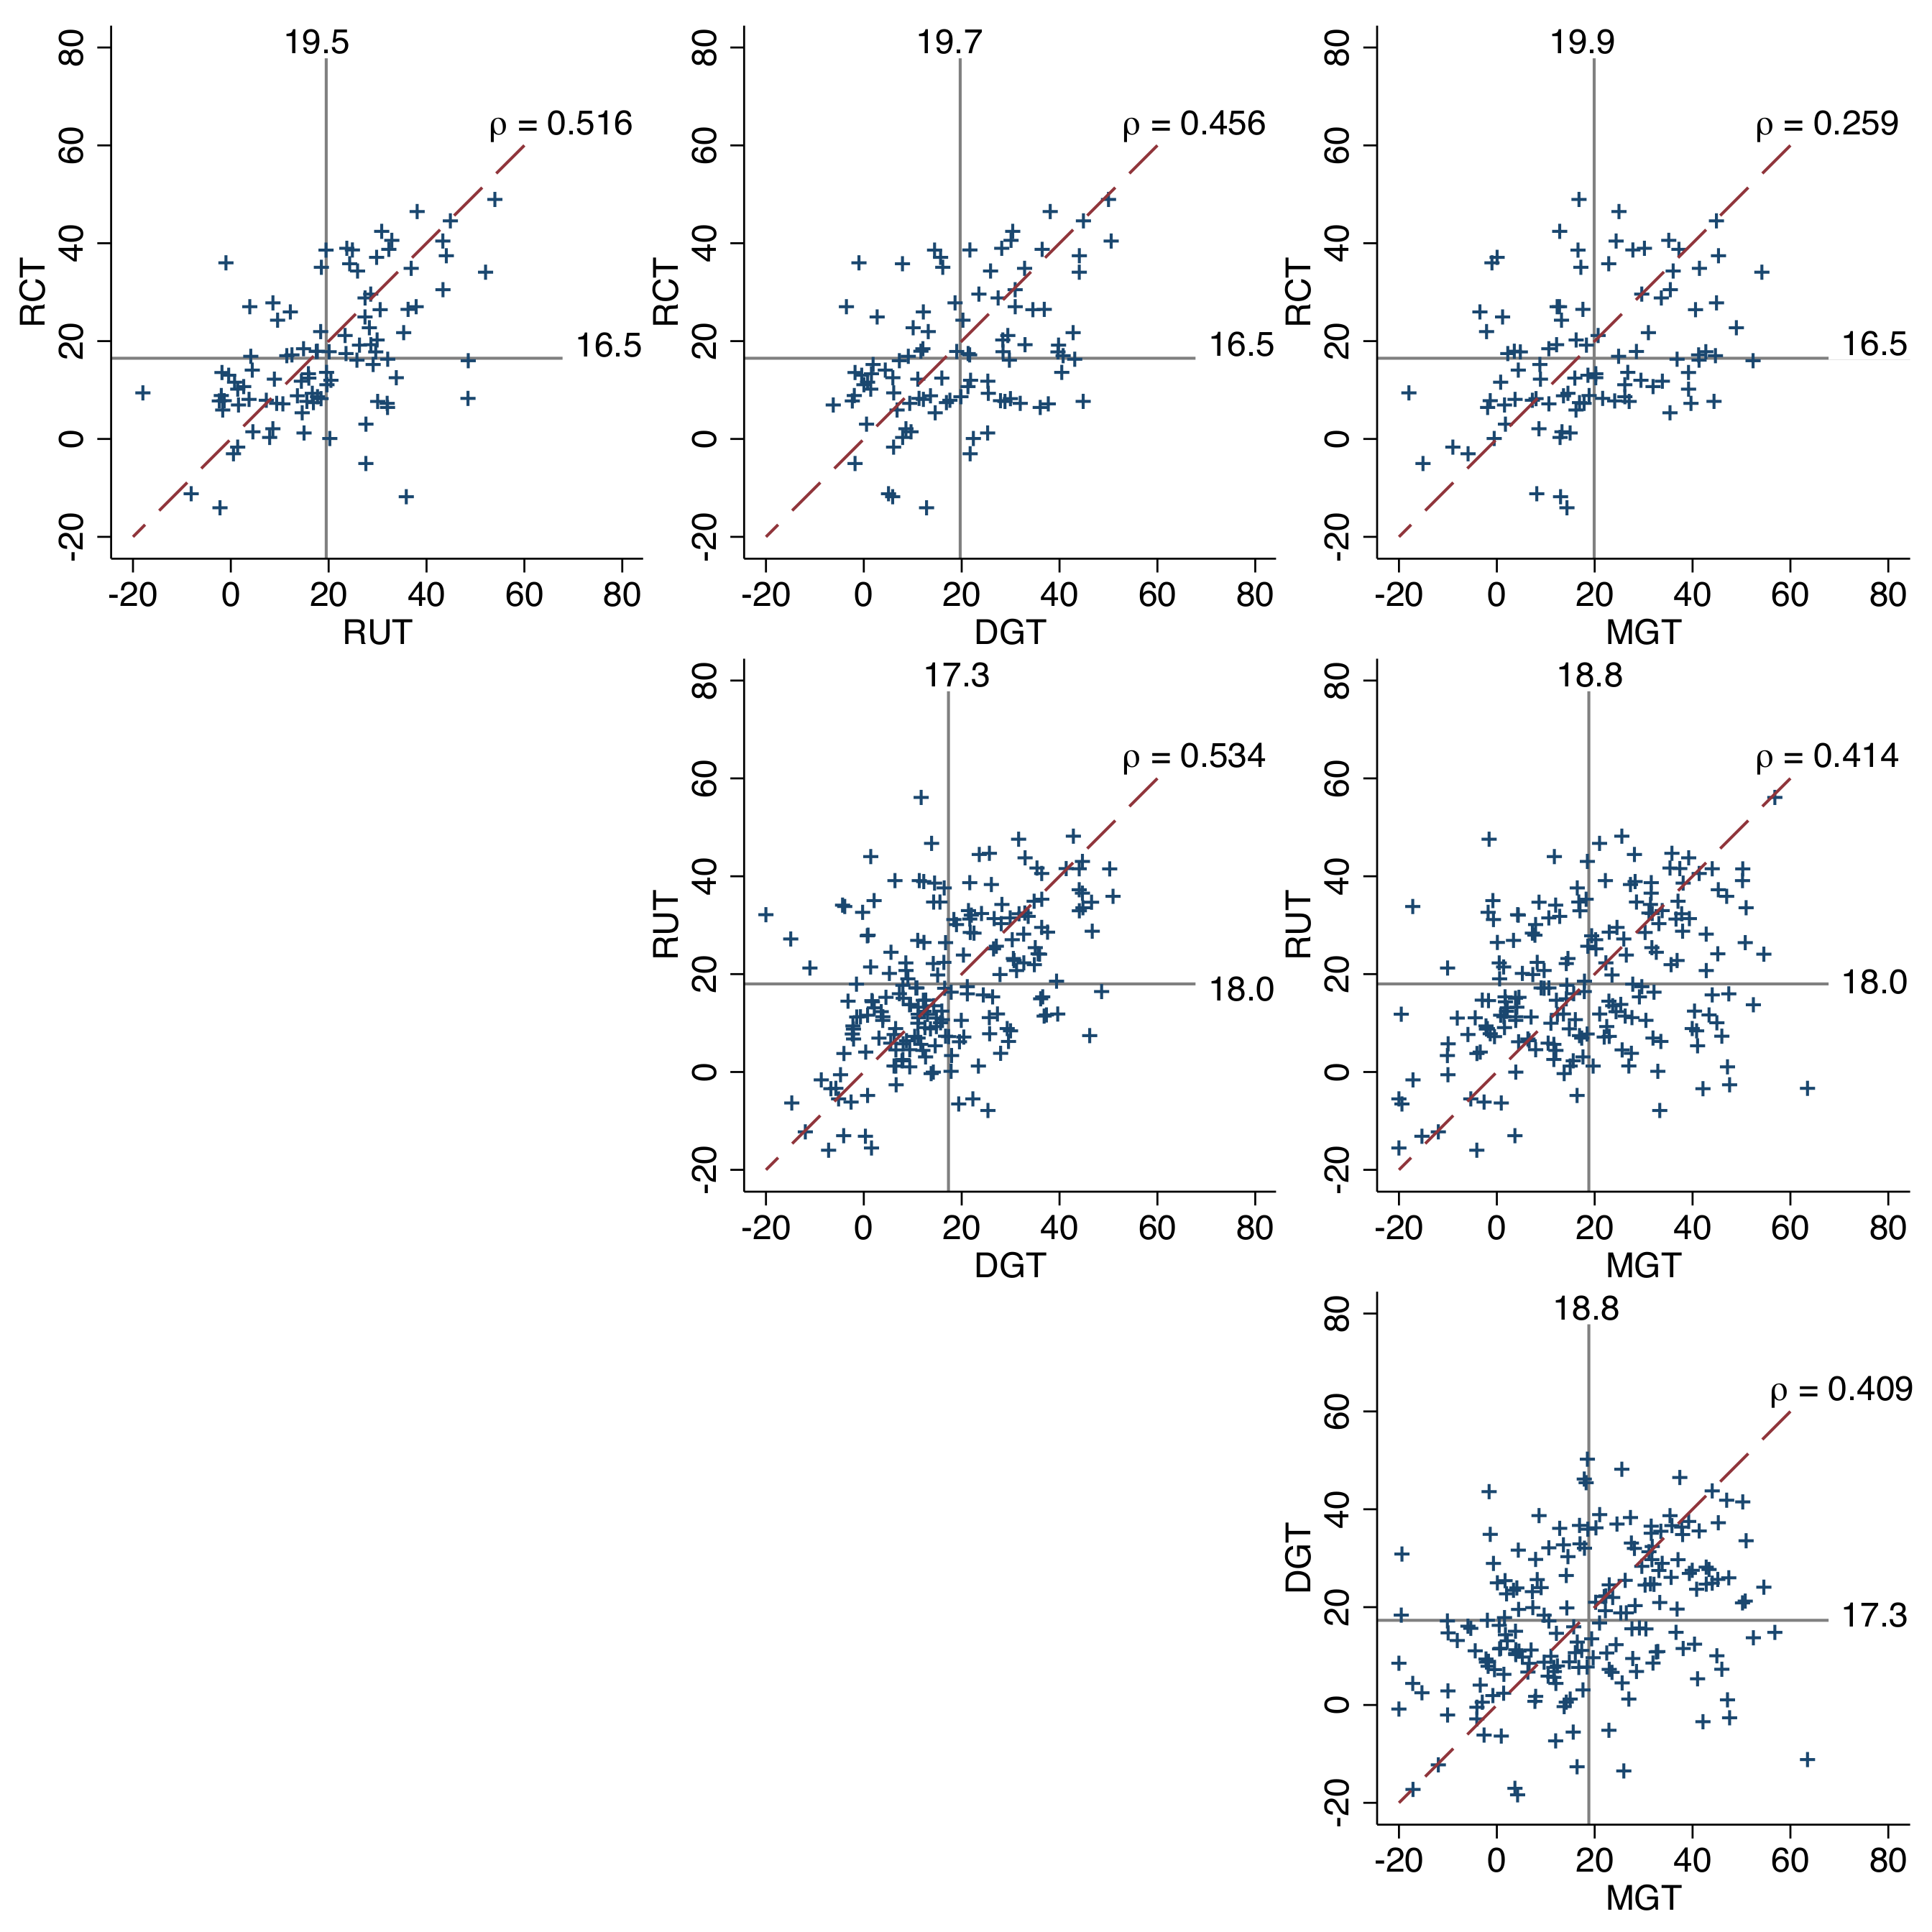
7.
The SVO Slider Measure’s high retest reliability has been confirmed in other studies. Höglinger and Wehrli [48] find a retest reliability of r = 0 . 79 when administering the Slider Measure on Amazon Mechanical Turk. Furthermore, Ackermann [49], (p. 124) reports a correlation of r = 0 . 79 between Slider Measure scores assessed directly before and directly after subjects played a repeated public goods game for 10 rounds, while shifts in individual SVO scores between the two assessments were very well accounted for by what happened in the corresponding public goods games. Hence, there is evidence that the lower bound of the Slider Measure’s retest reliability is around r = 0 . 79 , such that the substantially lower inter-treatment correlations found in this study are highly unlikely to be due to measurement error alone, even under very conservative assumptions.
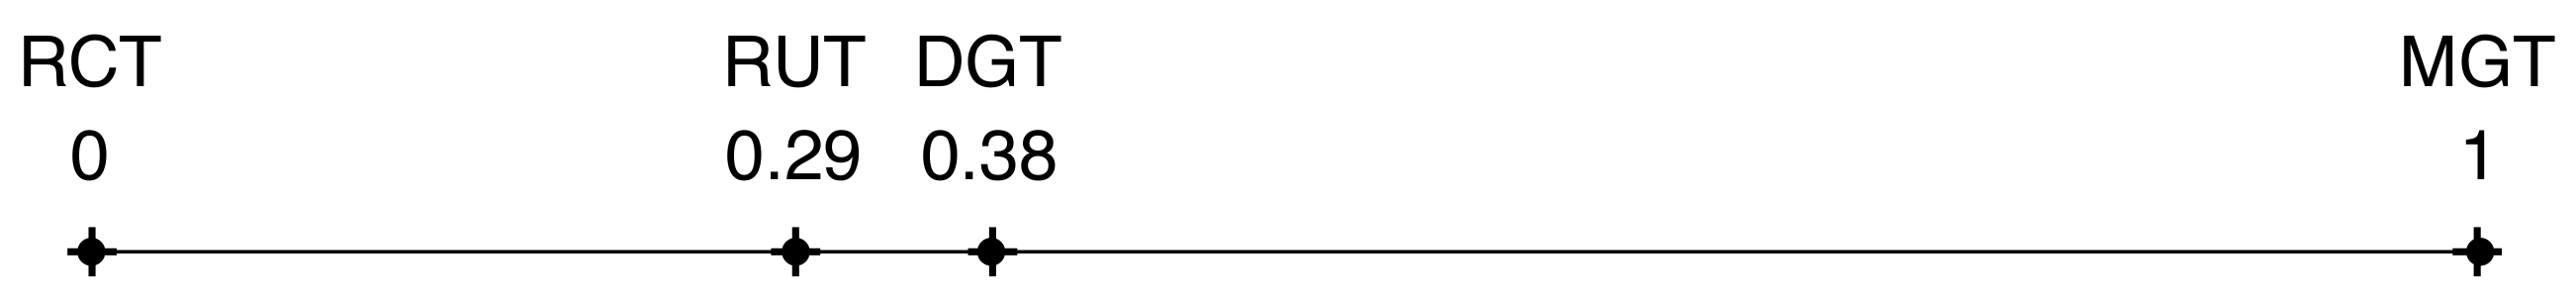
8.
To perform the MDS-analysis, the complete dissimilarity matrix (with complete entries that are symmetric across the diagonal) is considered and serves as input. On the basis of this input, the Euclidean distances between the treatments in terms of dissimilarities are computed. That is, each treatment (RCT, RUT, DGT and MGT) is assigned a location in 4-dimensional space with the coordinates being the corresponding dissimilarity coefficients. For example, the coordinates for RCT are [0, 0.484, 0.544, 0.741]. This serves the purpose of transforming dissimilarities into distances. Once the six Euclidean distances between the four treatments are computed, they serve as input for the multidimensional scaling algorithm, which produces a rank order of treatments on one dimension in terms of similarity. We used a standard non-metric MDS-algorithm based on Kruskal’s normalized STRESS1 criterion (see [50]).
9.
We also applied yet another method to analyze the data concerning Hypothesis 2. Concretely, in addition to comparing absolute differences in SVO scores across treatments, we also compared aggregated deviations in the options that were chosen in the single items of the choice tasks across treatments. The results are qualitatively equivalent to the results reported here on the basis of the comparison between absolute differences in SVO scores.
10.
The mean value for RUT differs slightly from the value reported in Table 1 because here, it is based only on the 96 subjects who were incentivized in RCT.
11.
A limited number of economic experiments have investigated how small variations in information presentation may affect behavior. Requate and Waichman [51] study Cournot duopolies and find no differences between treatments when information was presented in a profit table and treatments compared to when information was presented with a profit calculator. Collusion increased however if a best-response option was available to subjects. Gürerk and Selten [52] studied the effect of payoff tables in 100-period repeated Cournot oligopoly games with 2, 3 and 4 players. They found that when payoff tables were provided, collusion was more pronounced, especially in early periods. Dariel [53] compared different ways to elicit preferences for conditional cooperation by varying the salience of conditionality across treatments. When preferences for conditional cooperation are elicited sequentially (i.e., on successive screens instead of on a single screen), the fraction of free-riders is much smaller, possibly due to self-image concerns.
12.
To check if there is evidence for this assumption, we performed additional analyses with the data from Murphy and Ackermann [8], where subjects’ beliefs about other peoples’ SVOs were directly measured along with their own SVOs. These analyses revealed that prosocial subjects indeed believe that most other people are less prosocial than they themselves are ( t = 10 . 19 , p < 0 . 001 ), while proself subjects indeed believe that most other people are more prosocial than they themselves are ( t = - 4 . 68 , p < 0 . 001 ).
13.
A similar relation between uncertainty and prosociality can be seen in an early experiment by Sefton [55], who compared dictator games with full pay and random pay schemes. He found that subjects are more prosocial if the probability of being paid is 25% than when all subjects being paid for sure. See also work by Walkowitz [12].
14.
The resource allocation tasks were implemented in terms of zTree modules [58] that were slightly modified so that items consists of five options per task rather than nine options. We provide subjects with five options per task to ensure that the recomposition of the corresponding decomposed games into matrix games in normal form would not overwhelm subjects with too many strategies. In the most commonly used version, each item from the Slider Measure corresponds to the choice between nine alternatives. Recomposing these Slider Measure items would have resulted in a 9 × 9 payoff matrix with 81 cells. Reducing to 5 options yielded a matrix game that had only 25 cells which we considered experimentally tractable.
Figure 1. One of the six resource allocation tasks of the SVO Slider Measure as used in this study. In each task, the DM chooses between five own-other payoff combinations.
Games 09 00080 g001
Figure 2. Decomposed game and matrix game. In the matrix game, subject A chooses a row and subject B simultaneously chooses a column. In the decomposed game, both subjects simultaneously choose an allocation and the final payoffs are given by the sum of the allocations. Please note that the only characteristic that differentiates between a decomposed game and a corresponding matrix game is the way information is displayed to subjects while the situation itself is identical in both settings. Since choosing option Y increases the sum of payoffs, the game is a prisoner’s dilemma.
Games 09 00080 g002
Figure 3. Experimental design. The figures in the last row show how influence propagates from a subject to affect her own payoff and the payoff of another subject.
Games 09 00080 g003
Figure 4. SVO scatterplots and Spearman’s rank correlations ( ρ ). Horizontal and vertical lines represent mean values of the corresponding treatment. When RCT is involved, indicated mean values differ from the mean values in Table 1. This is because the data used for the production of this figure is based on mean values that are computed over all subjects who made incentivized choices in both treatments, the treatment on the x-axis and the treatment on the y-axis.
Games 09 00080 g004
Figure 5. Normalized multidimensional scaling scores from each of the four treatments mapped onto a unidimensional solution. This analysis yields the relative similarity (behavioral consistency) among the different treatments.
Games 09 00080 g005
Table 1. Descriptive analysis on subjects’ SVO scores.
RCT (inc.)RUTDGTMGTRCT (all)RCT (hyp.)
n9619219219219296
Mean16.4617.9817.3018.8317.9819.51
Median11.3616.2614.9416.2614.6216.73
Std13.0614.4013.9716.9214.7416.18
Table 2. Dissimilarity matrix among the different treatments. The entries are 1 minus the correlation between two methods and thus represent dissimilarity coefficients. Higher numbers indicate more inconsistency in subjects’ behavior between two methods.
RCTRUTDGTMGT
RCT0---
RUT0.4840--
DGT0.5440.4660-
MGT0.7410.5860.5910
Table 3. Mean values of absolute differences of SVO scores between treatments.
RCTRUTDGTMGT
RCT0
RUT8.850
DGT9.398.640
MGT13.5412.1412.490
Table 4. Significance levels for pairwise comparisons of absolute differences. Values are p-values from two-sided t-tests, testing whether two values from Table 3 are significantly different from each other. *** if p 0 . 01 .
RCT-RUTRCT-DGTRCT-MGTRUT-DGTRUT-MGTDGT-MGT
RCT-RUT
RCT-DGT0.52
RCT-MGT0.00 ***0.00 ***
RUT-DGT0.790.360.00 ***
RUT-MGT0.00 ***0.01 ***0.100.00 ***
DGT-MGT0.00 ***0.00 ***0.250.00 ***0.67

