Article

Effects of Relatedness on the Evolution of Cooperation in Nonlinear Public Goods Games

1
Department of Mathematics and Mathematical Statistics, Umeå University, 901 87 Umeå, Sweden
2
Evolution and Ecology Program, International Institute for Applied Systems Analysis, 2361 Laxenburg, Austria
*
Author to whom correspondence should be addressed.
These authors contributed equally to this work.
Games 2018, 9(4), 87; https://doi.org/10.3390/g9040087
Submission received: 7 October 2018 / Revised: 27 October 2018 / Accepted: 27 October 2018 / Published: 1 November 2018

Abstract

:
Evolution of cooperation has traditionally been studied by assuming that individuals adopt either of two pure strategies, to cooperate or defect. Recent work has considered continuous cooperative investments, turning full cooperation and full defection into two opposing ends of a spectrum and sometimes allowing for the emergence of the traditionally-studied pure strategies through evolutionary diversification. These studies have typically assumed a well-mixed population in which individuals are encountered with equal probability. Here, we allow for the possibility of assortative interactions by assuming that, with specified probabilities, an individual interacts with one or more other individuals of the same strategy. A closely related assumption has previously been made in evolutionary game theory and has been interpreted in terms of relatedness. We systematically study the effect of relatedness and find, among other conclusions, that the scope for evolutionary branching is reduced by either higher average degree of, or higher uncertainty in, relatedness with interaction partners. We also determine how different types of non-linear dependencies of benefits and costs constrain the types of evolutionary outcomes that can occur. While our results overall corroborate the conclusions of earlier studies, i.e. higher relatedness promotes the evolution of cooperation, our investigation gives a comprehensive picture of how relatedness affects the evolution of cooperation with continuous investments.

1. Introduction

Cooperation, and in particular the willingness to cooperate with relatives, is regularly observed in many species. Observed forms of cooperation include egg trading, cooperative foraging, and predator inspection among fishes; defensive coalitions, cooperative hunting, food sharing, and alarm calls among birds; grooming behaviour, alarm signals, coalitions, alloparenting, and cooperative hunting among various mammals; bloodsharing among vampire bats; care-giving behaviour in dolphins; foraging, anti-predator behaviour, and hive thermoregulation in honeybee colonies; and “social contracts” among paper wasps [1]. Social insects such as ants and bees also cooperate frequently (e.g., [2,3]) and cooperation is observed even among microbes (e.g., [4]). Finally, human societies are striking examples of cooperation.
Since cooperation often involves a cost to the individual without conveying a commensurate immediate benefit, one would naively suspect that cooperation cannot evolve to any higher degree. This, however, is not the case, and several mechanisms capable of promoting and supporting cooperation has been proposed and explored [5,6]. An influential explanation of cooperation between related individuals is kin selection, which states that there can be positive selection for a gene conveying cooperative behavior if the beneficiaries of that behavior are likely to share the same gene. This is typically the case when interactions occurs between relatives, but the principle applies more generally and assortative interaction between individuals can arise for a range of other reasons such as spatial structure or social dynamics. In certain settings, the principle of kin selection can be formulated quantitatively in a form that is now known as Hamilton’s rule: a cooperative gene is selected for if and only if r b > c , where r is the average degree of relatedness, b is the average benefit to the recipients of the cooperative act, and c is the average cost to the individual actor [7].
Cooperation has often been studied in the setting of evolutionary game theory based on the prisoner’s dilemma or its many-player generalization, the public-goods game (see, e.g., [8,9]). Although the latter game in principle allows for continuous investment, it is often assumed that individuals adopt either of two pure strategies corresponding to cooperation and defection. The evolutionary dynamics are studied with the so-called replicator equations in which strategies with a higher payoff than average in the population increase in frequency. To allow for the possibility of assortative interactions in this framework, Grafen [10] introduced the assumption that a fraction of an individual’s interaction are with individuals of the same type with the remaining interactions occurring with partners drawn at random from the population. This approach and related approaches has since been used to address a range of evolutionary questions [11,12,13,14,15,16,17].
Recently, several studies have moved beyond the traditional cooperative games by considering continuous cooperative investments as well as non-linearity of benefits and costs [4,18,19,20,21,22,23]. With this setting, additional evolutionary outcomes become possible, including evolutionary branching in the cooperative trait under consideration and the emergence of two or more different coexisting strategies. In a landmark study, Doebeli et al. [18] considered a setting in which individuals interact in pairs and each make a cooperative investment for their common good. Their joint benefit is given by a non-linear function of their joint investment and their costs are given by a non-linear function of their respective investments. Finally, their payoffs are determined as the difference of the benefit and their respective costs. By assuming that the benefit and cost function were given by quadrative polynomials, they classified all possible evolutionary outcomes. Building on this framework, Cornforth et al. [4] showed how interaction assortment, interpreted as relatedness, can be incorporated. Though developed independently, the idea is similar to Grafen [10]. Cornforth et al. investigated how assortment affects the evolution of cooperation for three different benefit functions and under the assumption of proportional costs.
Here, we extend the previous results by Cornforth et al. and systematically study the effects of relatedness on the evolution of cooperation in non-linear public-goods games with continuous investment. In Section 2, we present the general model. We consider both quadratic cost and benefit functions and general, increasing, cost and benefit functions. In Section 3, we analyze the dynamics of quadratic cost and benefit functions, and then derive results for general cost and benefit functions. Finally, in Section 4, we recapitulate and discuss our main results and identify important challenges for future research.

2. Model Description

2.1. Demographical Dynamics

We consider a model based upon Doebeli et al. [18] and Cornforth et al. [4]. We assume an infinite population in which the ith individual has trait value x i representing cooperative investment, with 0 x i 1 . At each generation, N random individuals with respective trait values x 1 , , x N are chosen for an interaction, in which the payoff to the ith individual, with 1 i N , is given by
B ( x 1 + + x N ) N C ( x i ) ,
where B : [ 0 , N ] R + { 0 } and C : [ 0 , 1 ] R + { 0 } are two increasing functions such that B ( 0 ) = C ( 0 ) = 0 . B ( x 1 + + x N ) is the collective benefit of the cooperative investment of the entire group, and C ( x i ) is the cost of the individual’s own investment. The collective benefit is assumed to be divided equally among the members of the group, yielding a per capita benefit of B ( x 1 + + x N ) / N .
Each individual is assumed to be identical by descent (i.b.d.) to a random number of individuals in the group including itself. We define Pr ( k ) to be the probability for an individual to be i.b.d. to exactly k individuals in the group including itself. Similar to Cornforth et al. [4], the expected payoff to a rare mutant with trait value m in a monomorphic population of residents with trait value r becomes
P ( m , r ) = k = 1 N Pr ( k ) B ( k m + ( N k ) r ) N C ( m ) .
We assume that the population dynamics follow the replicator equation [8], i.e., that successful strategies increase in frequency at a rate proportional to the difference with the average population-level payoff.
We first carry out a comprehensive analysis of quadratic benefit and cost functions B ( x ) = b 2 x 2 + b 1 x , C ( x ) = c 2 x 2 + c 1 x that typically look like in Figure 1. We restrict the range of possibilities by requiring that B ( x 1 + + x N ) and C ( x i ) should be increasing, i.e., that b 1 > 0 , c 1 > 0 , b 1 2 N b 2 , and c 1 2 c 2 . The signs of b 2 and c 2 will depend on whether the functions are accelerating or decelerating. As a second step, we derive results for general increasing benefit and cost functions.

2.2. Evolutionary Dynamics

We base our analysis of the evolutionary dynamics on adaptive-dynamics techniques [24,25,26]. Readers not familiar with these methods may want to refer to an introductory text such as by Brännström et al. [27]. In brief, we consider the initial growth rate of a rare strategy m in an environment dominated by a resident strategy r. This growth rate is called the invasion fitness and written as S r ( m ) . The sign of the invasion fitness determines whether the rare strategy can grow in numbers and invade. From the invasion fitness, we obtain the selection gradient S r ( r ) . Strategies at which selection ceases, S r ( r ) = 0 are called evolutionary singular. They can be evolutionary attractors, in which case they are called convergence stable. Once established, the subsequent evolutionary dynamics depend on whether the singular strategy is evolutionarily stable or an evolutionary branching point. In the former case, evolution comes to a halt while, in the latter case, the population diversifies and two coexisting strategies emerge.
From the replicator equation, we obtain the following expression for the invasion fitness (see the appendix of Brännström et al. [20] for background and derivation of a similar expression),
S r ( m ) = P ( m , r ) P ( r , r ) = k = 1 N Pr ( k ) B ( k m + ( N k ) r ) N C ( m ) k = 1 N Pr ( k ) B ( N r ) N C ( r ) .
Differentiating with respect to the mutant trait value and evaluating at m = r yields the selection gradient
S r ( r ) = k = 1 N k Pr ( k ) B ( N r ) N C ( r ) = μ B ( N r ) C ( r ) ,
where μ is the average whole-group relatedness, defined as the expected value of fraction of the group that is i.b.d. to the focal individual (including the focal individual itself), i.e.,
μ = k = 1 N k Pr ( k ) N .
Given this selection gradient, we obtain the condition for convergence stability of an evolutionarily singular strategy
N B ( N r * ) μ C ( r * ) < 0 ,
and the condition for evolutionary stability
N B ( N r * ) [ μ 2 + σ 2 ] C ( r * ) < 0 ,
where σ 2 = Var K / N , with K being the random variable with probability density function Pr ( k ) . For a derivation of these conditions, see Cornforth et al. [4], as well as Appendix A.1.

3. Results

We first carry out a comprehensive analysis of the effect of assortment on the evolution of cooperation with quadratic benefit and cost functions and then derive results for general cost and benefit functions. Our key findings are illustrated in Figure 2 and Figure 3. These show the effects of increased average relatedness and increased variance in relatedness on the direction of selection and evolutionary stability of the cooperative investment. Note, in particular, that a singular strategy increases with increased relatedness if and only if it is convergence stable, and that increased relatedness as well as increased uncertainty in relatedness can change the evolutionary stability of singular strategies. Finally, we corroborate selected results using numerical simulations.

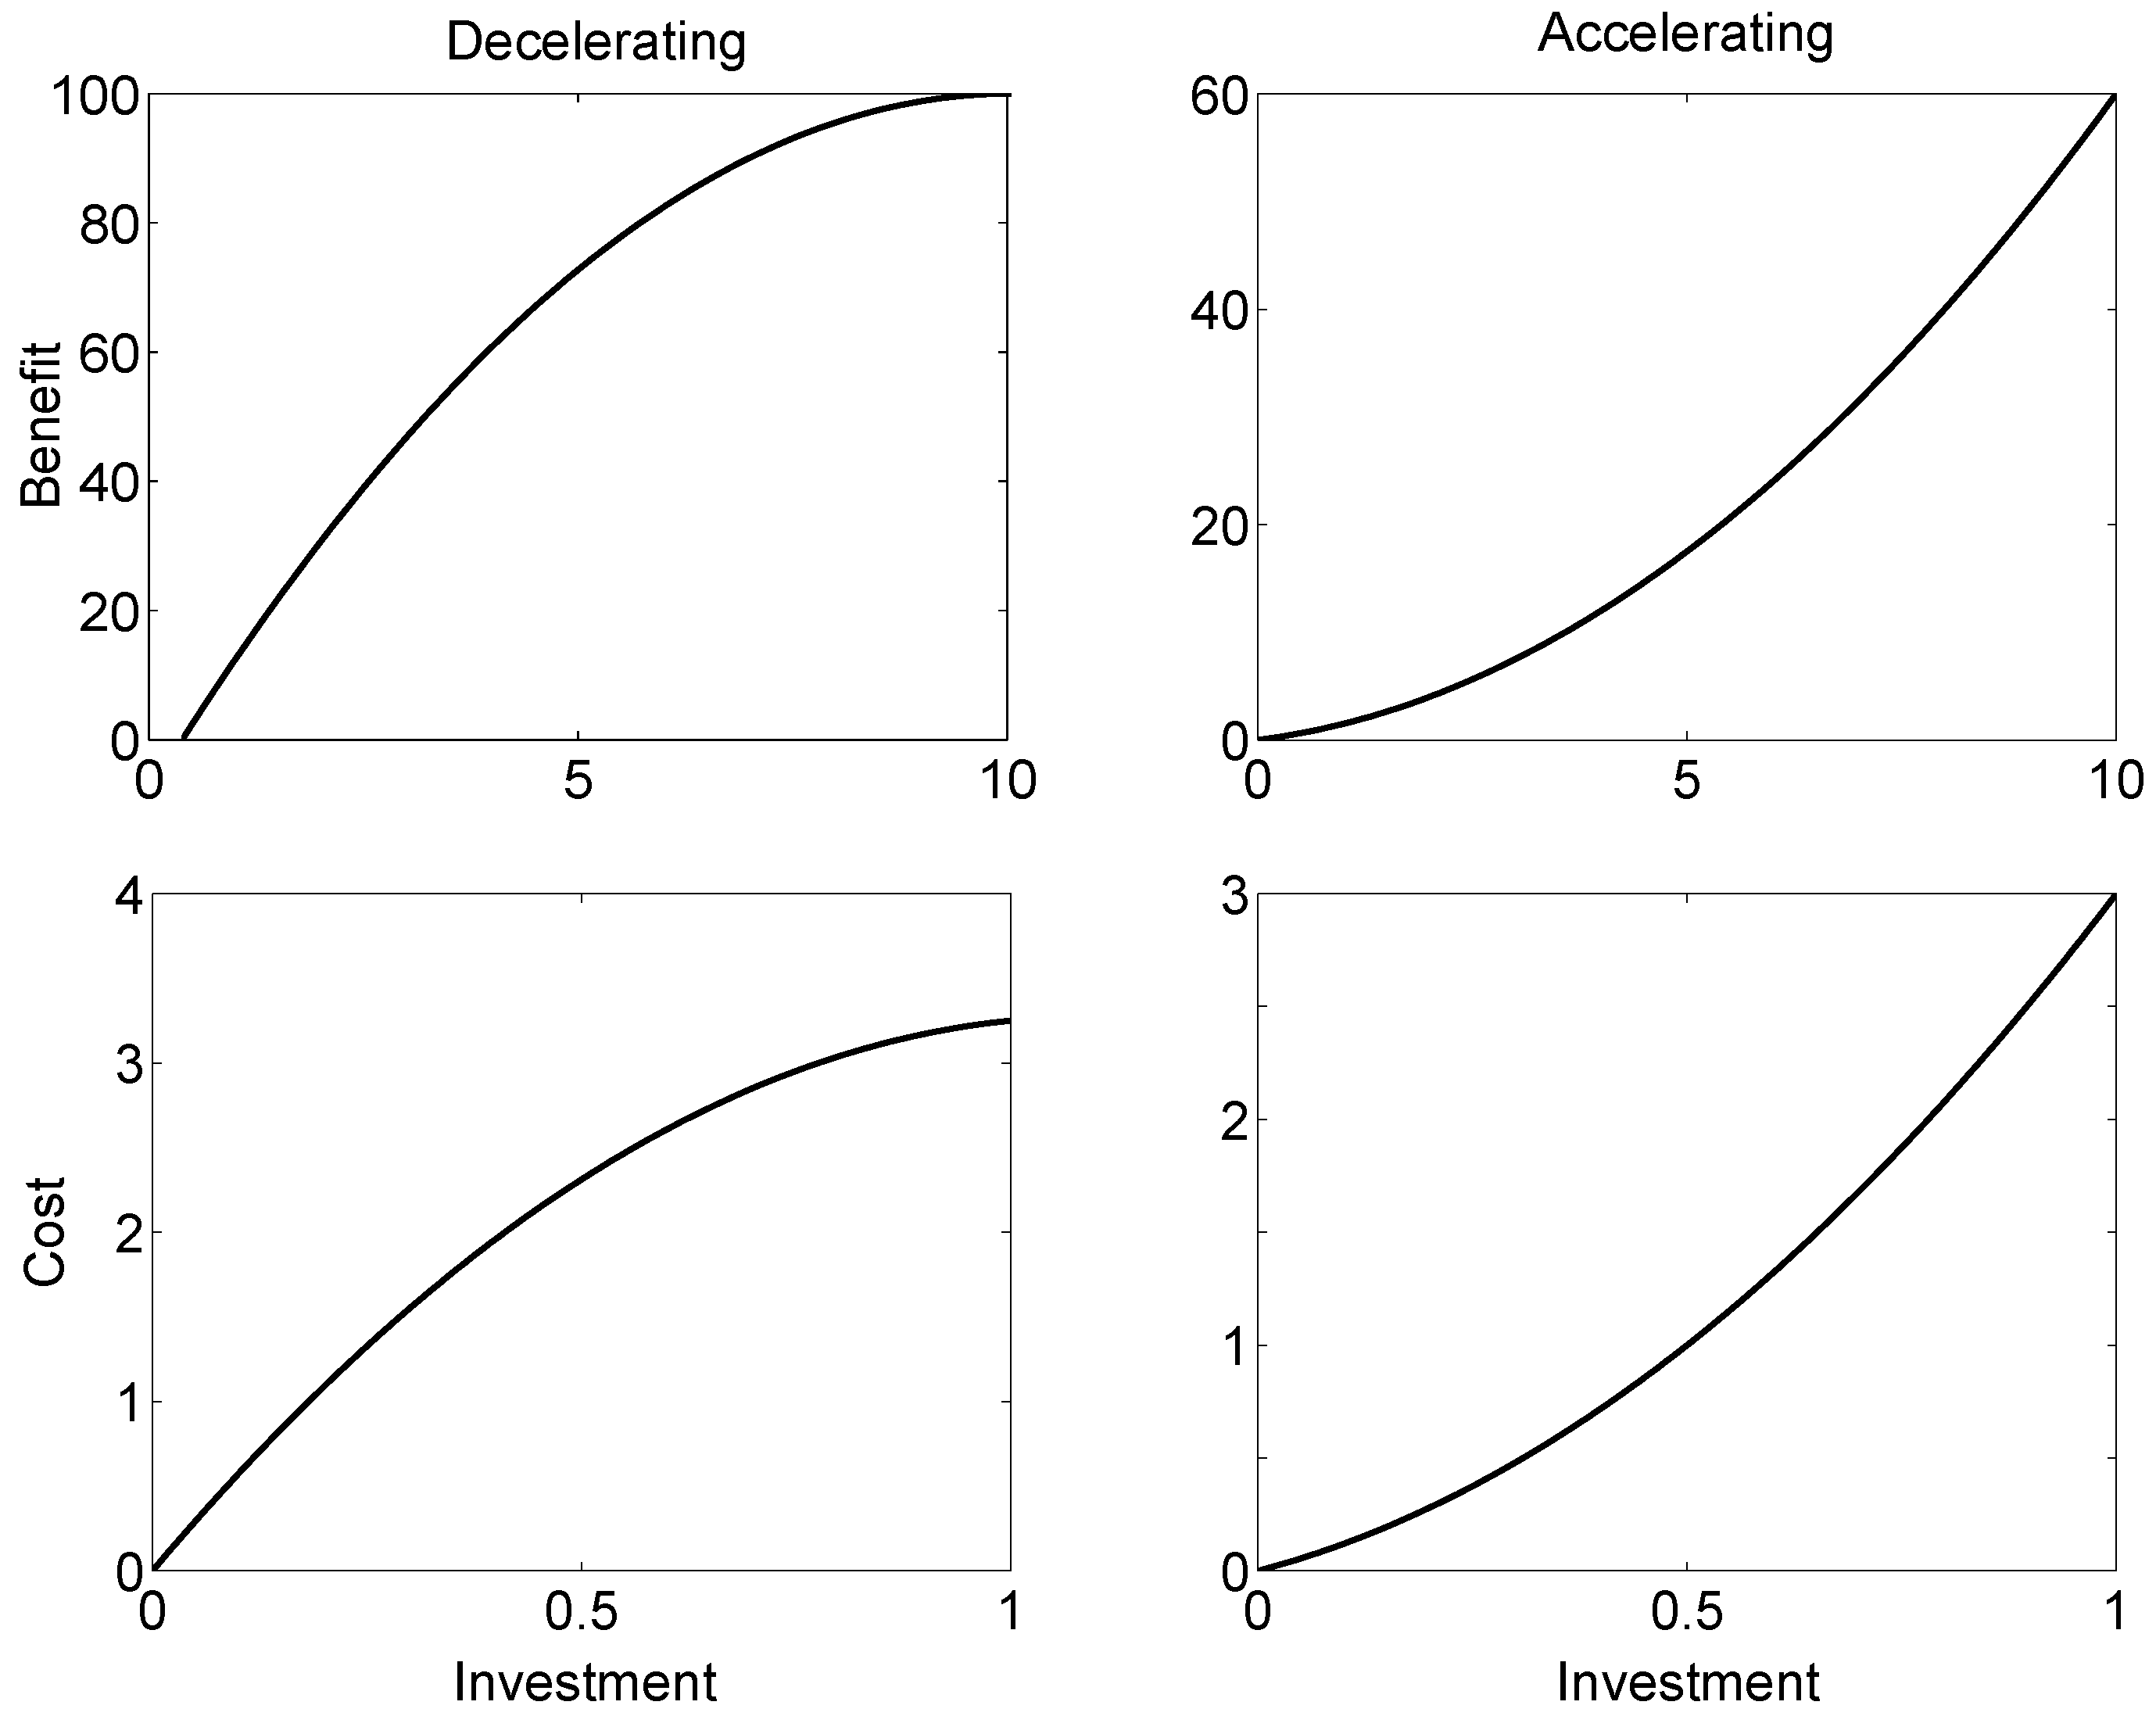
3.1. Quadratic Benefit and Cost Functions
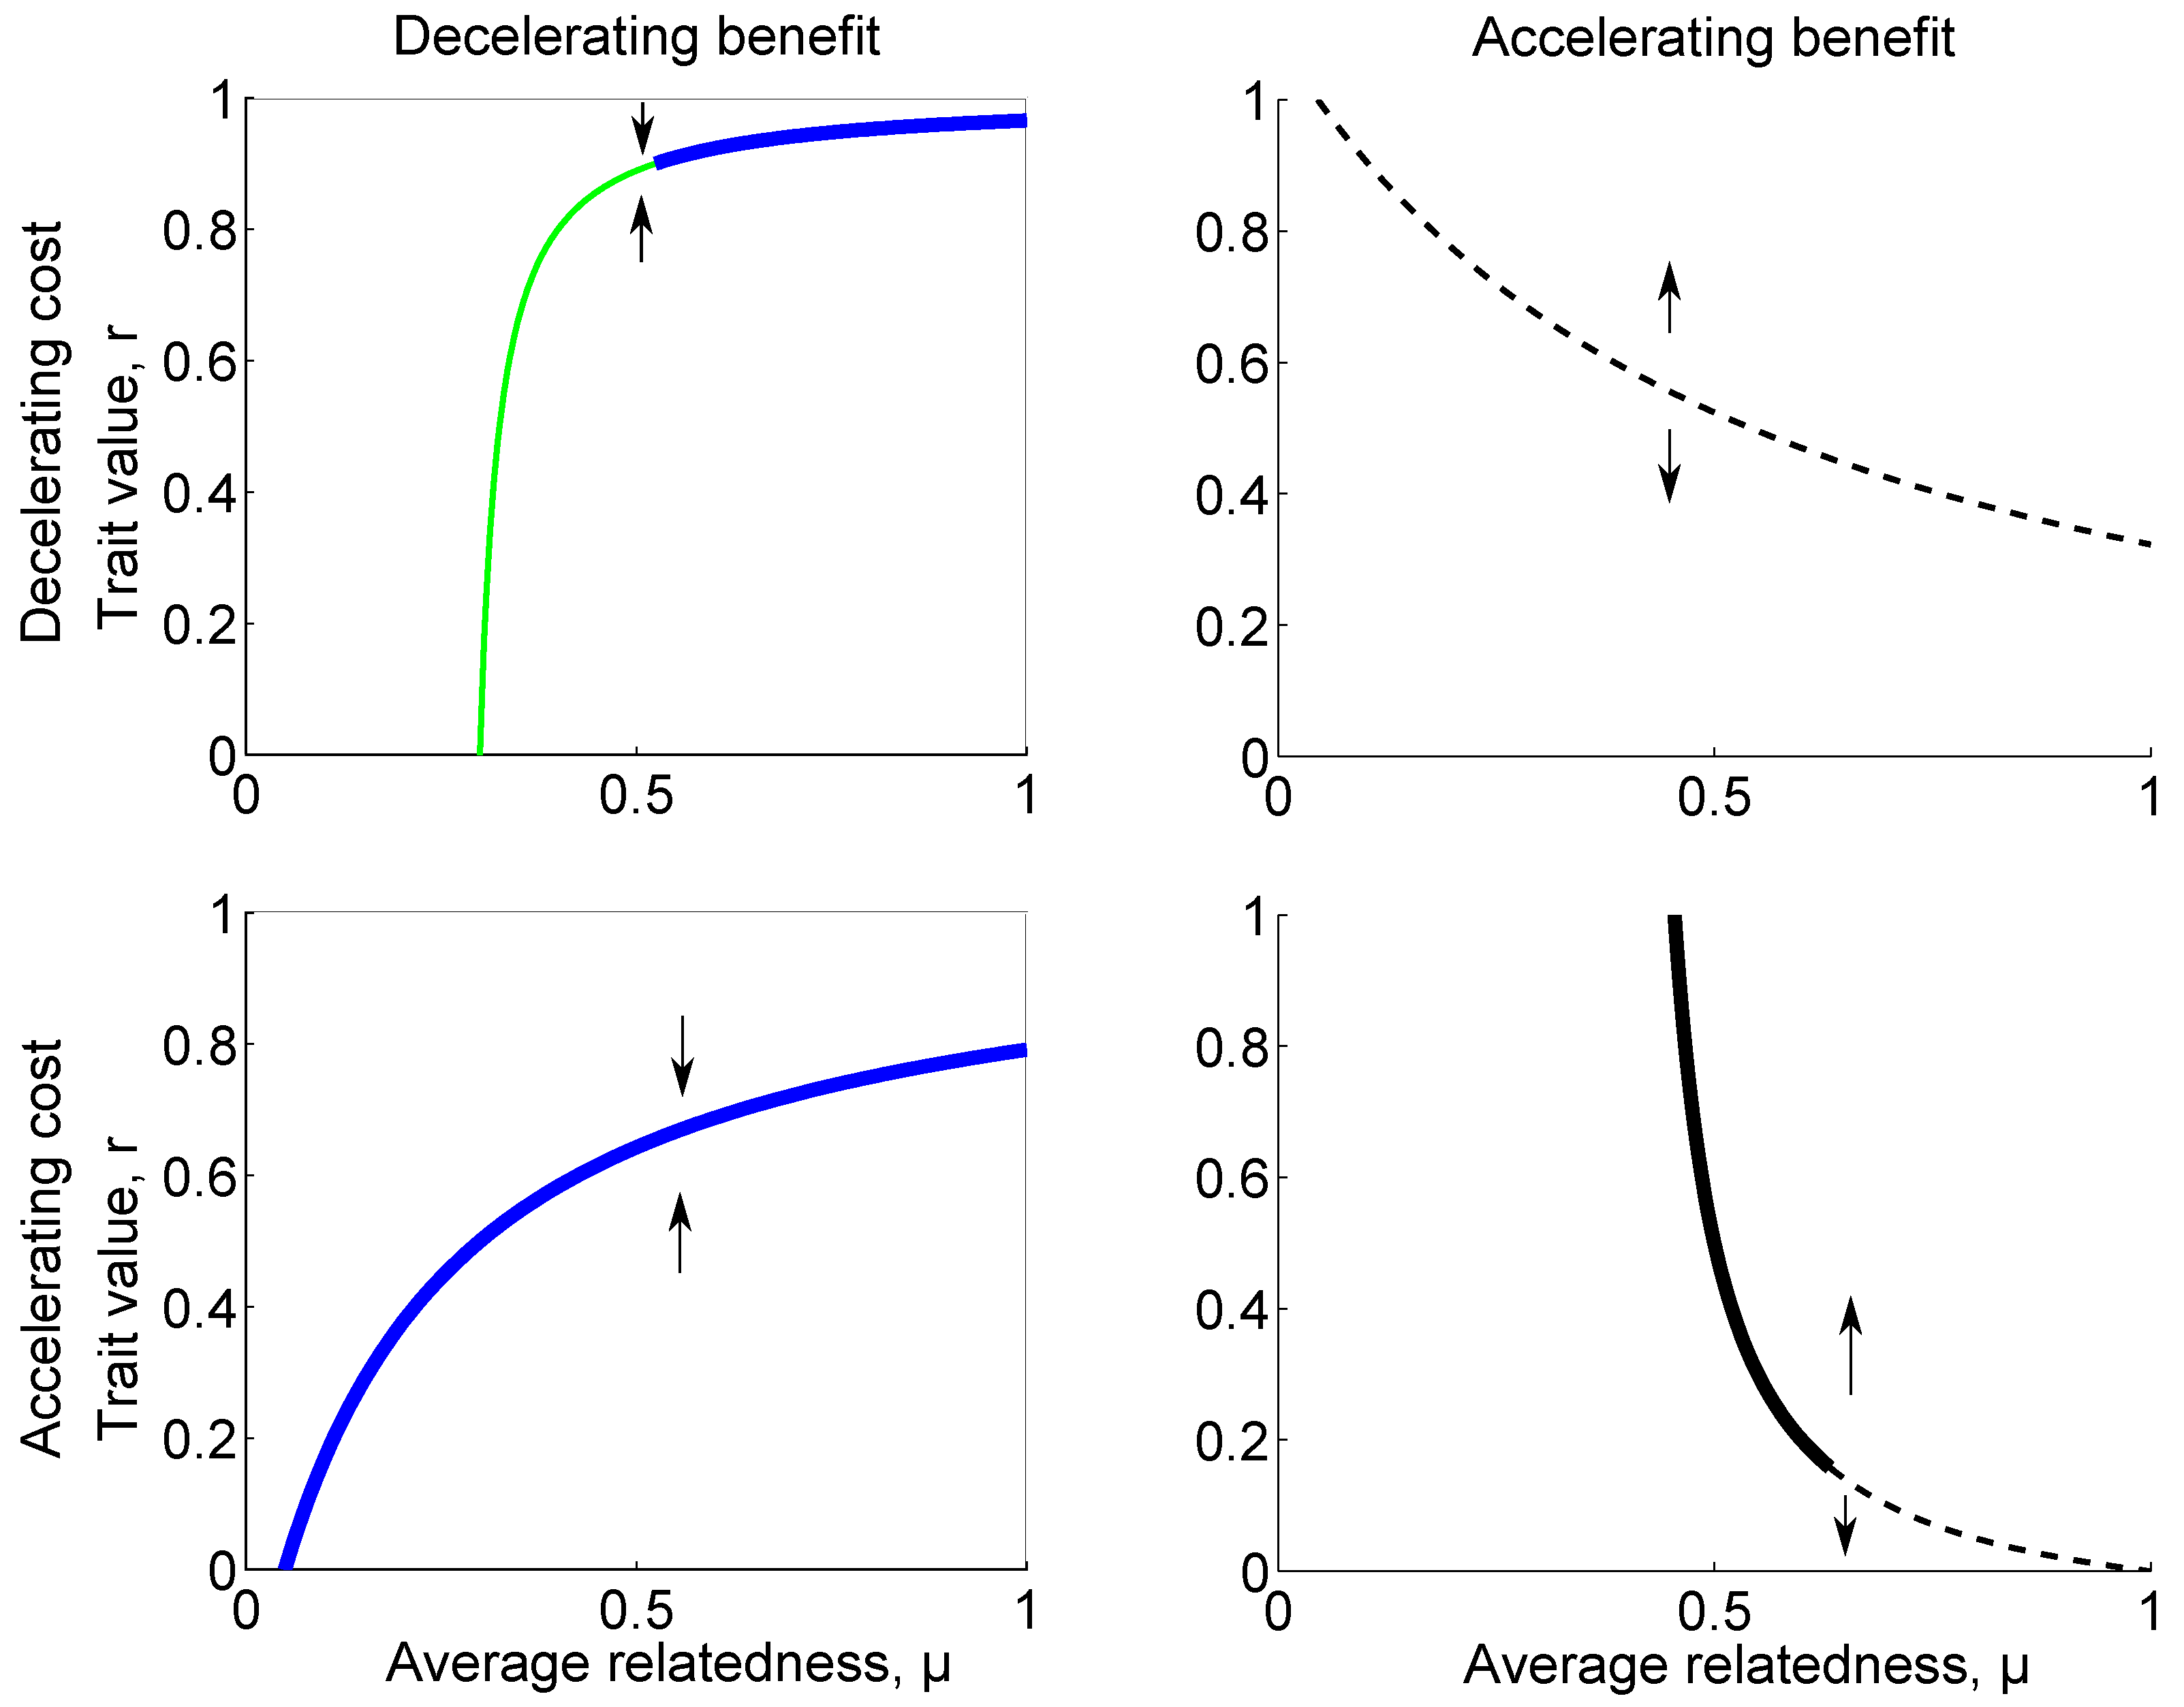
Recall that we assume benefit and cost functions, B and C, that are increasing, satisfy B ( 0 ) = C ( 0 ) = 0 , and are given by quadratic polynomials, as shown in Figure 1. For these functions, we completely classify the evolutionary dynamics and its dependence on on the mean and variance of relatedness. Our conclusions are corroborated by numerical investigations (Figure 4).
With quadratic polynomials, the selection gradient, Equation (4), is given by
S r ( r ) = μ B ( N r ) C ( r ) = μ ( 2 N b 2 r + b 1 ) 2 c 2 r c 1 .
Recalling from Section 2.1 that that we must have b 1 2 N b 2 for B to be increasing, we have 2 N b 2 r + b 1 > 0 and it follows as expected that increased relatedness always alters selection pressures in the direction of higher cooperative investments.
From Equation (8), we solve for the singular strategies, i.e., the values of r at which the selection gradient vanishes, and find that, for each μ , there is at most one interior evolutionarily singular strategy in the allowed range of cooperative investments. It is given by
r * ( μ ) = c 1 b 1 μ 2 ( N b 2 μ c 2 ) ,
whenever this value lies between 0 and 1.
Momentarily leaving aside the constraints on μ and r * imposed by their biological interpretation, we note that the graph of r * ( μ ) crosses zero at μ 0 = c 1 / b 1 , has a vertical asymptote at μ V = c 2 / ( N b 2 ) and a horizontal asymptote at r H = b 1 / ( 2 N b 2 ) . The graph consists of two curves that are located above and below the horizontal asymptote, respectively. Recalling from Section 2.1 that we must have b 1 2 N b 2 for B to be increasing, we see that the horizontal asymptote is located outside of the range 0 r < 1 . Specifically, for accelerating benefits we have r H > 1 and for decelerating benefits we have r H < 1 . It follows that only one of the curves can be biologically relevant and this is the curve that crosses zero at μ 0 = c 1 / b 1 .
The evolutionary dynamics now depends on whether the horizontal asymptote is located above or below the allowed trait range and on whether the graph of r * crosses zero before or after the vertical asymptote, i.e., on whether μ H > μ 0 . As we have already noted, the answer to the former question depends on whether benefits are accelerating or decelerating. We have not found a similar straightforward interpretation of the latter condition, but we note that μ 0 > μ V whenever benefits and costs are not simultaneously accelerating or simultaneously decelerating. For each of the four possible combinations, we can characterize the evolutionary dynamics.
Theorem 1.
Let μ 0 , μ V , and r H be as defined above. Let r * ( μ ) be the interior strategy given by Equation (9) whenever 0 < r * ( μ ) < 1 . Otherwise, let r * ( μ ) be the boundary strategy that results from directional selection. The following conclusions then hold.
  • Assume B is accelerating and that μ 0 > μ V , as is the case if C is decelerating. For μ < μ V , we have r * ( μ ) = 0 and selection is thus towards no cooperation. For μ V < μ < μ 0 , r * ( μ ) is decreasing and the evolutionary dynamics is bistable. For μ > μ 0 , we have r * ( μ ) = 1 and selection is thus towards full cooperation.
  • Assume B is accelerating and that μ 0 < μ V . For μ < μ 0 , we have r * ( μ ) = 0 and selection is thus towards no cooperation. For μ 0 < μ < μ V , we have r * ( μ ) is increasing and convergence stable, i.e., an evolutionary attractor. For μ > μ V , we have r * ( μ ) = 1 and selection is thus towards full cooperation.
  • Assume B is decelerating and μ 0 > μ V , as is the case if C is accelerating. For μ < μ 0 , we have r * ( μ ) = 0 and selection is thus towards no cooperation. For μ > μ V , r * ( μ ) is increasing and convergence stable, i.e., an evolutionary attractor.
  • Assume B is decelerating and μ 0 < μ V . For μ 0 < μ < μ V , r * ( μ ) is increasing and convergence stable, i.e., an evolutionary attractor. For μ > μ V , we have r * ( μ ) = 1 and selection is thus towards full cooperation.
Proof. 
The conclusions follow from the geometric observations that precede the theorem and the fact, also discussed above, that the selection gradient is increasing function of μ . ☐
We next investigate the effects of relatedness on evolutionary stability. The condition for evolutionary stability, Equation (7), is
N b 2 ( μ 2 + σ 2 ) c 2 < 0 .
We thus see that both increased average relatedness ( μ ) and increased variance in relatedness ( σ 2 ) can affect the evolutionary stability of a singular strategy. We consider four cases depending on the signs of b 2 and c 2 . When benefits are accelerating ( b 2 > 0 ) and costs decelerating ( c 2 < 0 ), the singular strategy is never evolutionarily stable. As Theorem 1 shows, any interior singular strategy will lack convergence stability and there will thus not be any evolutionary branching points. Diversification may still be possible, but would have to be established through a large change in strategy. When benefits are decelerating ( b 2 < 0 ) and costs accelerating ( c 2 > 0 ), any interior singular strategy is always evolutionarily stable. If benefits and costs are both accelerating ( b 2 > 0 , c 2 > 0 ), either is possible and any change with increased relatedness μ or variance σ 2 is a loss of evolutionary stability. Finally, if benefits and costs are both decelerating ( b 2 < 0 , c 2 < 0 ), either is possible and any change with increased relatedness μ or variance σ 2 is a gain of evolutionary stability.
Figure 2 shows typical outcomes for four combinations of accelerating and decelerating costs and benefits. The outcomes are typical and consistent with our conclusions, although it should be noted that Theorem 1 allows for alternative outcomes of directional selection when benefits and costs are both accelerating or both decelerating.
Finally, we investigate the potential for evolutionary branching when benefits and costs are both accelerating or both decelerating. Solving Equation (6) for μ , the boundary between convergence stability and not convergence stability becomes
μ c = c 2 N b 2 ,
assuming b 2 0 . If B is decelerating, then μ > μ c implies convergence stability, and if B is accelerating, then μ < μ c implies convergence stability.
Solving Equation (10) for σ 2 , we get the boundary between evolutionary stability and instability
σ e 2 = c 2 N b 2 μ 2 N b 2 ,
once again assuming b 2 0 . If B is decelerating, then σ 2 > σ e 2 implies evolutionary stability, and if B is accelerating, then σ 2 < σ e 2 implies evolutionary stability. By instead solving Equation (10) for μ we see that the singular strategy gains evolutionary stability at
μ e = c 2 N b 2 σ e 2 N b 2 ,
If B is decelerating, then μ > μ e implies evolutionary stability, and if B is accelerating, then μ < μ e implies evolutionary stability. For μ e to equal μ c implies σ e 2 = μ c ( 1 μ c ) , that is, with maximum variance (see Appendix A.2), convergence stability and evolutionary stability switch at the same time. Assuming on the other hand that μ e < μ c , this would imply σ e 2 > μ e ( 1 μ e ) which is not possible (see Appendix A.2). In other words, evolutionary stability will switch as soon as or after convergence stability switches when increasing the average relatedness, depending on whether the variance is at its maximum or not.
There is a region in the b 2 c 2 -plane where μ e is undefined. This is when b 2 < 0 , c 2 > N b 2 σ 2 ; or b 2 > 0 , c 2 < N b 2 σ 2 . When the first one of these is the case, the condition for evolutionary stability will always hold, and hence the strategy will always be evolutionarily stable. Conversely, when the second is the case, the strategy will never be evolutionarily stable.
Using Equation (12), we can plot σ 2 against μ to find out the effects of increased variance in relatedness on the evolutionary stability, as in Figure 3. We see that increased variance has a noticeable effect: The higher the variance, the sooner the switch to evolutionary stability. We also see that increased relatedness can make the evolutionary dynamics bistable.
We have carried out numerical simulations to corroborate our findings results, using the method described in Appendix B. Our analytical investigation predicts evolutionary branching at μ = 0.4 and evolutionary stability at μ = 0.8 for B and C decelerating, and bistability when μ = 0.5 for B and C accelerating. This is consistent with the results from the simulations (see Figure 4).

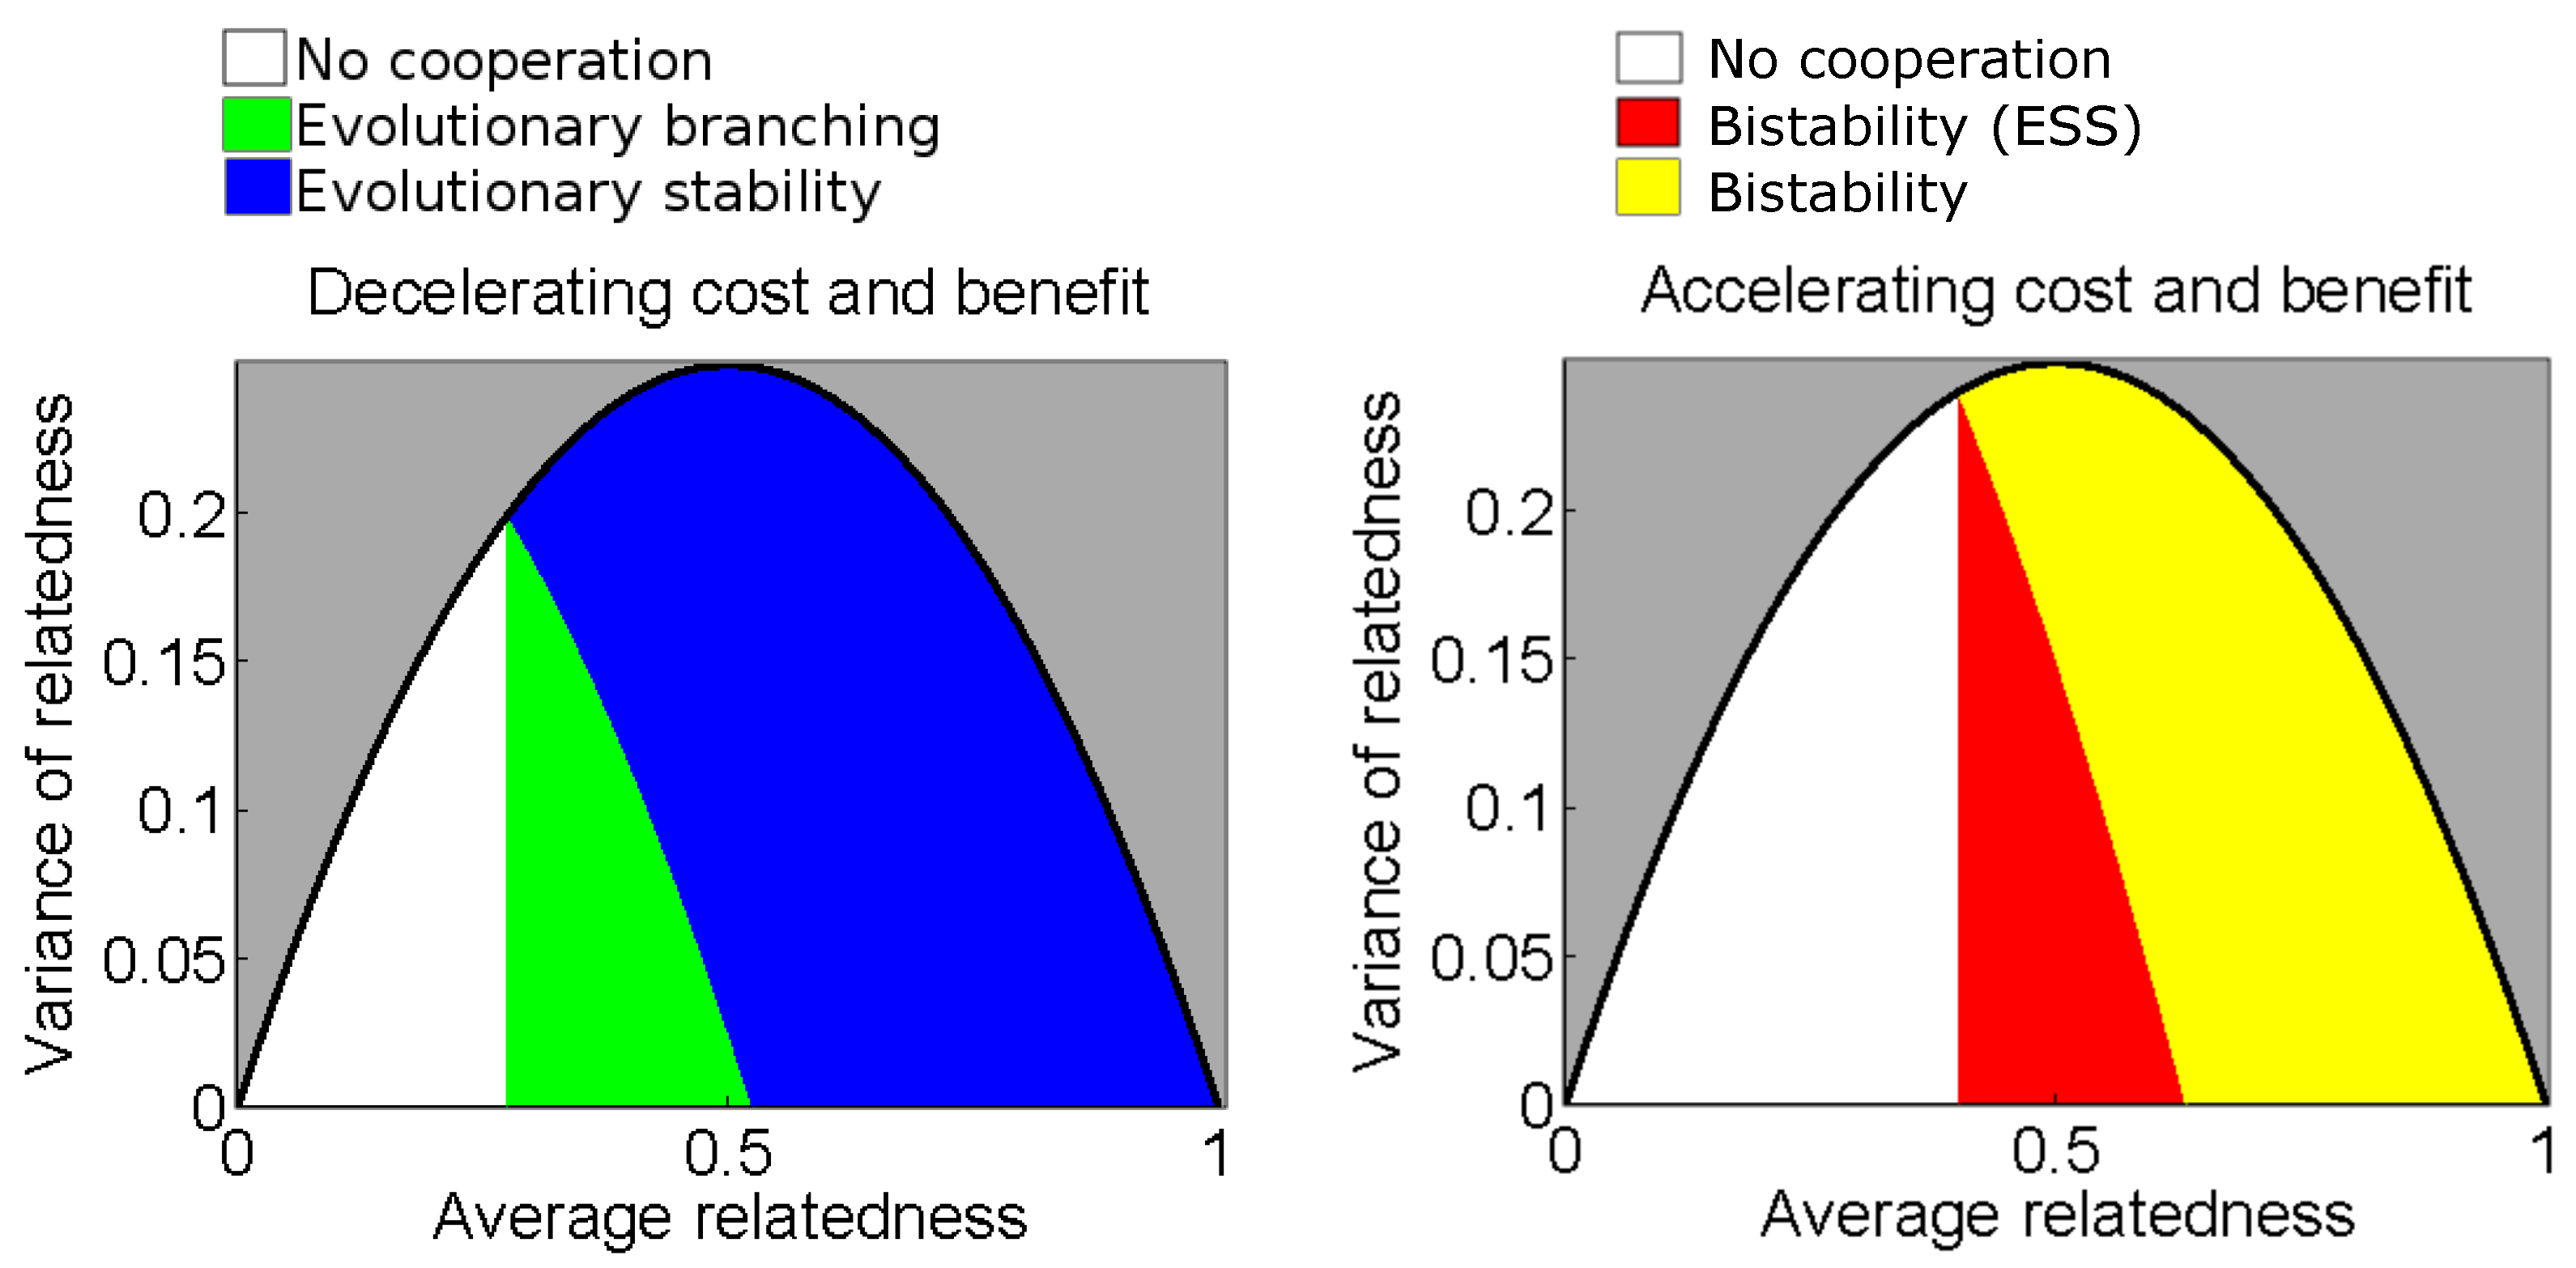
3.2. General Cost and Benefit Functions

Having analyzed the case of quadratic cost and benefit functions, we now turn to the case of general strictly increasing non-linear functions. As our first result, we note that the position of an interior singular strategy, if it exists, depends only on the average relatedness and not on any higher moment of the probability distribution. To see this, we recall that an interior singular strategy r * is by definition a point at which the selection gradient, Equation (4), vanishes,
μ B ( N r * ) C ( r * ) = 0 .
To see how increased relatedness affects an interior singular strategy, we differentiate implicitly with respect to μ which gives,
r * ( μ ) = B ( N r * ) C ( r * ) μ N B ( N r * ) .
From Equation (6) we see that the denominator is positive if and only if the interior singular strategy is convergence stable. Since the benefit function is strictly increasing, we conclude that increased relatedness has opposite effect on interior singular strategies depending on whether they are evolutionary attractors or repellers. As illustrated in Figure 2, evolutionary attractors increase with relatedness while evolutionary repellers decrease with relatedness.
Next, we restrict attention to benefit and cost functions that are either accelerating or decelerating for the full range of strategies considered, giving a total of four combinations to be explored. For two cases, we give a full classification of the evolutionary dynamics, allowing for the possibility of large mutational steps.
Theorem 2.
Assume that benefits are decelerating and costs are accelerating, more specifically that B ( x ) < 0 and C ( x ) > 0 for all x [ 0 , 1 ] . Then, there is exactly one continuously stable strategy r * . Furthermore, we have that S r ( m ) < 0 if m < r r * or m > r r * . The continuously stable strategy is always evolutionarily stable and increases with the degree of relatedness.
In short, the theorem asserts that the evolutionary dynamics will lead to a monomorphic population that, once established, cannot be invaded by any other strategy.
Proof. 
We have already shown in the analysis of quadratic benefit and cost functions that all three outcomes can in fact occur, hence we only need to assert that no additional outcomes are possible. To first see that there can never be more than one interior singular strategy, we show that the selection gradient is a strictly declining function of the resident strategy. Differentiating the selection gradient, Equation (4), with respect to the resident trait value gives,
d d r S r ( r ) = μ N B ( N r ) C ( r ) < 0   for   all   r [ 0 , 1 ] .
Thus, we see that there can be maximally one interior singular strategy which can be either a boundary strategy, r * = 0 (no investment) and r * = 1 (maximal investment), or an interior strategy, 0 < r * < 1 (intermediate investment). As the selection gradient is a declining function of the resident strategy, we also conclude that directional selection will small evolutionary steps will eventually lead to the vicinity of this strategy, i.e., the singular strategy is convergence stable. To see that large mutational steps will also leads towards the strategy and that, once established, it cannot be invaded by any other strategy, we write the invasion fitness as
S r ( m ) = r m S r ( x ) d x = r m S r ( r ) + r x S r ( y ) d y d x = ( r m ) S r ( r ) + r m r x S r ( y ) d y d x .
It is easily seen that S r ( m ) < 0 and hence the double integral in the second term is always negative since x is intermediate between r and m. It follows that S r ( m ) < 0 whenever ( r m ) S r ( r ) < 0 , which is precisely when m < r r * or m > r r * . Thus, the strategy is continuously stable as asserted. ☐
The other case which can similarly be classified is that of accelerating costs and decelerating benefits. In this case, coexistence of cooperators and defectors is possible whenever the evolutionary dynamics is bistable.
Theorem 3.
Assume that benefits are accelerating and costs are decelerating, more specifically that B ( x ) < 0 and C ( x ) > 0 for all x [ 0 , 1 ] . Then, selection is either towards full cooperation, towards no cooperation, or there is exactly one interior singular stable strategy r * in the sense that S r ( m ) > 0 if m < r r * or m > r r * . In the case of an interior singular strategy, we have that S 0 ( 1 ) > 0 and S 1 ( 0 ) > 0 , enabling a protected dimorphism or cooperators and defectors. The interior singular strategy is never evolutionarily stable and decreases with the degree of relatedness.
Proof. 
The first part of the proof is nearly identical to the previous case, but with opposite signs. Specifically, we show by differentiation that the selection gradient is increasing which implies that there can be at most one interior singular strategy, r * . Noting that S r ( m ) > 0 , we conclude from Equation (17) with r = r * that S r ( m ) > 0 if m < r r * or m > r r * .
It remains to show that a protected dimorphism of cooperators and defectors is possible whenever we have an interior singular strategy, 0 < r * < 1 . Note that, in this case, S 1 ( 1 ) > 0 and S 0 ( 0 ) < 0 due to the bistable evolutionary dynamics. Furthermore, noting that the double integral in Equation (17) is positive independent of whether m > r or r < m , we have that
S 1 ( 0 ) = ( 1 0 ) S 1 ( 1 ) + 0 1 x 1 S r ( y ) d y d x > 0 ,
and
S 0 ( 1 ) = ( 0 1 ) S 0 ( 0 ) + 0 1 0 x S r ( y ) d y d x > 0 ,
showing that a protected dimorphism of cooperators and defectors is possible. ☐

4. Discussion

In this paper, we have carried out a systematic investigation of the effects of relatedness on the evolution of cooperation in non-linear public goods game with continuous investments. As expected, we found that relatedness is beneficial for cooperation. When the evolutionary outcome is a single intermediate level of cooperation, higher relatedness increases that level. If, on the other hand, the evolutionary outcome is bistable such that an initially uncooperative population evolves to lower levels of cooperation and an initially cooperative society evolves to higher levels of cooperation, higher relatedness decreases the threshold level of cooperation that separates the two outcomes. The degree of relatedness also affects the potential for evolutionary branching, i.e., the emergence of two or more coexisting strategies. We find that relatedness reduces the scope for evolutionary branching, making it more likely that all individual evolve the same strategy.
Our framework allows us to also investigate the consequences of uncertainty in the degree to which an individual is related with his or her interaction partners, and we find that such uncertainty also reduces the scope for evolutionary branching. This can be compared with an earlier result showing that uncertainty in the size of interaction groups reduces the scope for evolutionary branching when the payoff structure has an additive form but not when it has a multiplicative form [20]. In this study, we have considered only payoff functions with an additive form and by analogy it appears plausible that uncertainty in relatedness might increase the scope for evolutionary branching under multiplicative payoff structures.
In a related study, Molina and Earn [23] rigorously analyzed a similar public goods game with non-linear benefits and linear costs. While they did not consider relatedness or assortment per se, one of their results, Theorem 4.4, in which they give conditions for the existence of a continuously stable strategy, allows for finite proportions of mutants and can be recast as a result of assortment. Our results differ by asserting global convergence stability and global evolutionary stability as well as in allowing for non-linear cost functions. The latter is important, as one cannot reduce to the case of linear costs by measuring investments in units of fitness costs, i.e., by redefining trait values as x ˜ : = C ( x ) , with C being the cost function. Although this change of unit would make the cost function linear, the benefit function B would no longer depend on the sum of individual investments. Hence, the results by Molina and Earn [23] do not extend to public goods games with non-linear costs.
There are several directions in which the work presented here could be extended and we particularly wish to highlight two. First, our assumptions that the public goods are formed by adding individual contributions and that the payoff can be expressed as a difference of benefit and cost function are rather limiting and are unlikely to adequately describe all relevant settings involving public goods. Recently, Ito et al. [21] introduced and considered a large class of possible interaction structures in cooperative games. We think it would be interesting to extend our work to this larger framework and, in particular, systematically explore the effects of relatedness under the different options for aggregating rewards. Second, we base our results on a simplified representation of assortment. While simple representations have advantages, we think it would be good to complement our approach with more mechanistically-grounded studies of how assortment arises and influences the evolution of cooperation.
Our conclusion that increased assortment facilitates the evolution of cooperation is expected, in-line with empirical studies (e.g., [28]), and only a few exceptions to this rule has been reported in the literature (see, for example, [29], which shows how increased competition may prevent selection for altruistic genes). The value of our study thus does not lie as much in its overall conclusion as in revealing in detail how increased assortment helps to promote cooperation, for example by showing how thresholds in bistable evolutionary regimes shift and revealing that the scope for evolutionary diversification is reduced by both increased assortment and increased uncertainty in assortment. As such, our findings should prove valuable to both theoreticians and empiricists striving to interpret results on the evolution of cooperation from laboratory experiments and field observations.

Author Contributions

The material presented here builds on a Bachelor thesis by K.C.G. written under an earlier name. Å.B. conceived and designed the study; K.C.G. performed the numerical investigations. Å.B. and K.C.G. jointly analysed the case of quadratic cost and benefit functions. Å.B. proved the results on general benefit and cost functions. Å.B. and K.C.G. jointly discussed the results and wrote the paper.

Funding

This research was supported by the Swedish Research Council with grant number 2015-03917.

Acknowledgments

We thank Mats Bodin, Daniel Cooney, Daniel Cornforth, and Chai Molina for discussion and advice that helped to improve this manuscript.

Conflicts of Interest

The authors declare no conflict of interest.

Appendix A. Analytical Investigations

Appendix A.1. Condition for Evolutionary Stability

We aim to determine a condition for evolutionary stability in terms of average relatedness, μ , and variance in the degree of relatedness, σ 2 . We write K for the random variable having probability density function Pr ( k ) , and use the notation K for expected value. Following the Appendix from [4], we get to the condition
B ( N r * ) N ( K 2 + Var [ K ] ) C ( r * ) < 0 .
Changing variables from K to ρ = K / N , we get
B ( N r * ) N ( N ρ 2 + Var [ N ρ ] ) C ( r * ) < 0 .
Thus,
B ( N r * ) N ( N 2 ρ 2 + N 2 Var [ ρ ] ) C ( r * ) < 0 ,
which we simplify to
N B ( N r * ) ( ρ 2 + Var [ ρ ] ) C ( r * ) < 0 ,
and the desired form is achieved after noticing that ρ = μ and Var ( ρ ) = σ 2 .

Appendix A.2. Impossible Region in the μ − σ2-Plane

We want to find the upper bound on σ 2 in terms of μ . Firstly, since μ and σ 2 are defined through the fraction k / N where N k and k 1 , we note that μ , σ 2 [ 0 , 1 ] . Next, given μ [ 0 , 1 ] , by the definition of variance, the maximum variance will be achieved when all the values are at the endpoints. This is because, as long as any value is in the interior of [ 0 , 1 ] , the sum of the squares of the distances from μ , and hence the variance, will be lower. In other words, the maximum variance is achieved when we are dealing with a Bernoulli distribution, in which case σ 2 = μ ( 1 μ ) . Thus, given μ [ 0 , 1 ] , we must have σ 2 [ 0 , μ ( 1 μ ) ] .

Appendix A.3. Implicit Differentiation

We want to find the effects of relatedness on the location of the singular strategy in the general case, but, having no explicit formula for r * in terms of μ , we need to differentiate implicitly. We view r * as a function of μ and we want to find the derivative r * ( μ ) . To do this, we use the relationship μ B ( N r * ) C ( r * ) = 0 , and differentiate both sides implicitly with respect to μ : B ( N r * ) + μ B ( N r * ) N r * ( μ ) C ( r * ) r * ( μ ) = 0 , from which we get
r * ( μ ) = B ( N r * ) C ( r * ) μ N B ( N r * ) .

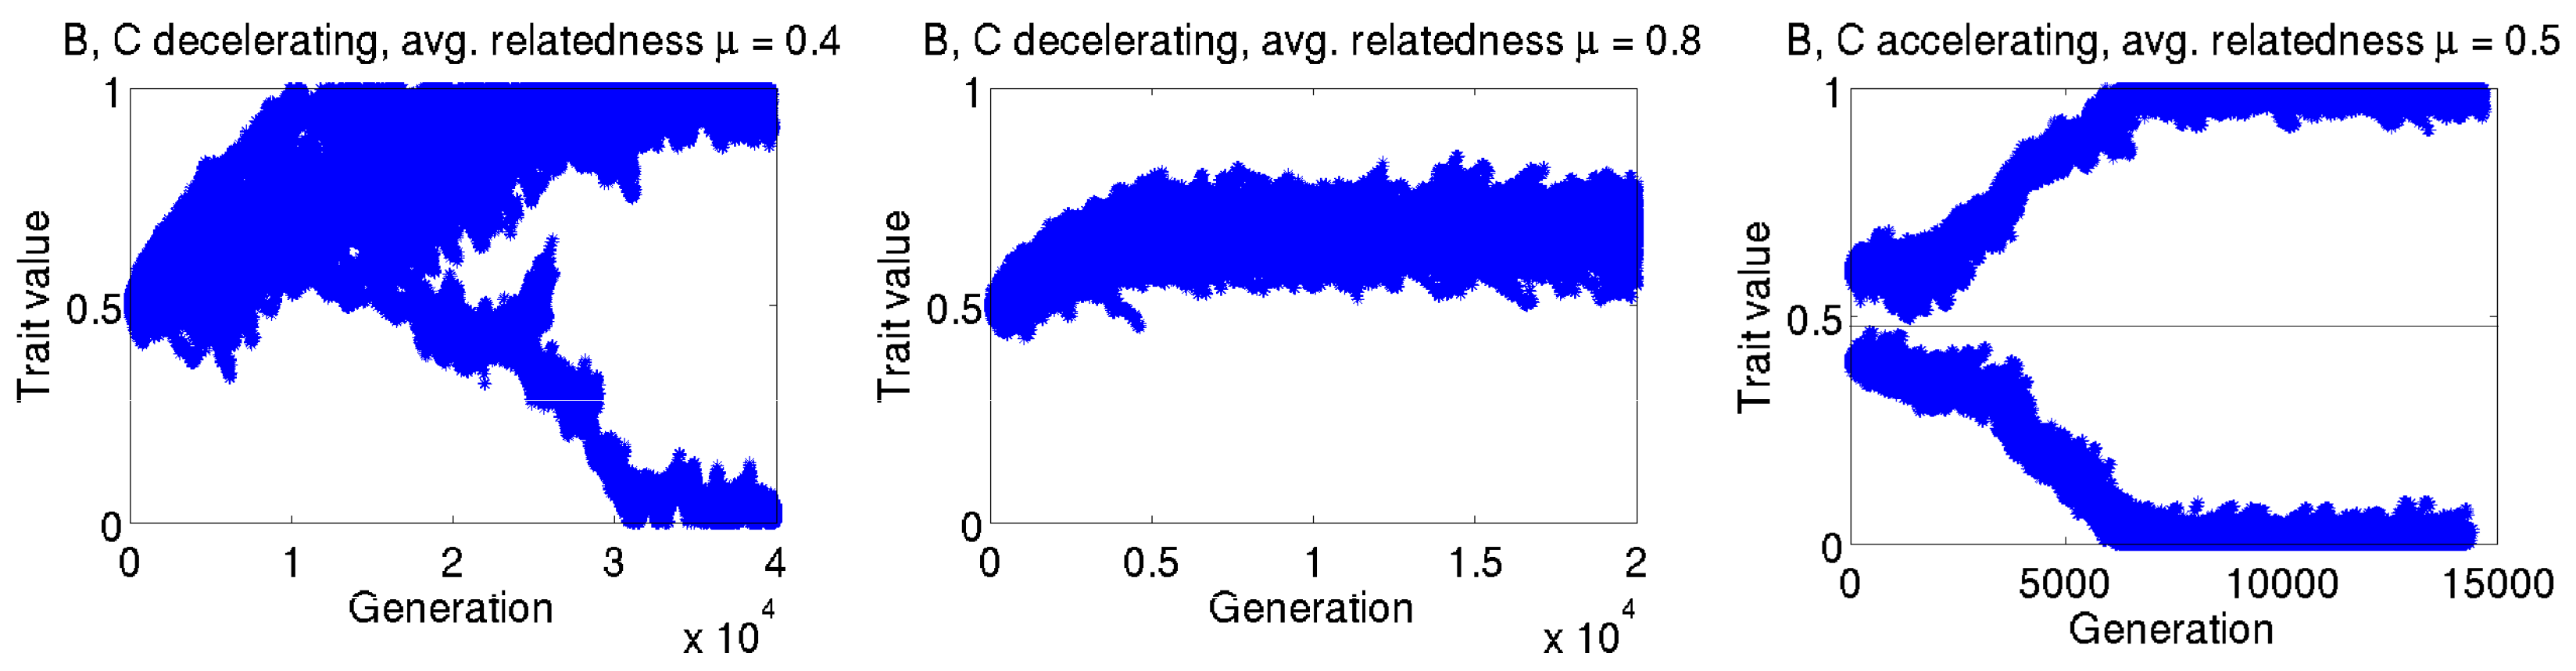
Appendix B. Individual-Based Simulations

We follow the method from Doebeli et al. [18], with a few alterations. A population size N p o p and a virtual group size N is fixed, and each player has the two attributes generation and trait value. Next, the following procedure is repeated until the generation of the offspring is higher than a chosen bound: A random focal individual with trait value x is chosen to be replaced by an offspring. The x individual gets to interact with another random individual with trait value u. The payoff to the focal individual, P x = P ( x , u ) , is then computed as
P ( x , u ) = k = 1 N Pr ( k ) N B ( k x + ( N k ) u ) C ( x ) ,
where the probabilities Pr ( k ) are chosen such that k = 1 N Pr ( k ) = 1 , and k = 1 N k Pr ( k ) / N gets the desired value (e.g., 0.4 or 0.8 ). A third random individual with trait value y is chosen for an interaction with a fourth random individual with trait value v. The payoff to this other individual, P y , is computed in a similar way as P x . P x is then compared to P y to see which individual is the parent to the offspring replacing the x individual. If P y < P x , then the x individual is the parent. Otherwise, the y individual is the parent with a probability w = ( P y P x ) / α , where
α = max 0 x , u , y , v 1 | P ( x , u ) P ( y , v ) |
to ensure w [ 0 , 1 ] . The offspring inherits the parent’s trait value at a high probability, otherwise the offspring’s trait value is taken from a normal distribution centred on the parent’s trait value. If the trait value gets lower than 0 then it is set to 0, and if it gets higher than 1 then it is set to 1. The generation and trait value of each individual is saved to a text file in order to keep the time complexity at a minimum.

References

  1. Dugatkin, L.A. Cooperation in animals: An evolutionary overview. Biol. Philos. 2002, 17, 459–476. [Google Scholar] [CrossRef]
  2. Hölldobler, B.; Wilson, E.O. The Ants. 1990. Available online: http://www.hup.harvard.edu/catalog.php?isbn=9780674040755 (accessed on 31 October 2018).
  3. Hamilton, W.D. Altruism and related phenomena, mainly in social insects. Ann. Rev. Ecol. Syst. 1972, 3, 193–232. [Google Scholar] [CrossRef]
  4. Cornforth, D.M.; Sumpter, D.J.T.; Brown, S.P.; Brännström, Å. Synergy and group size in microbial cooperation. Am. Nat. 2012, 180, 296–305. [Google Scholar] [CrossRef] [PubMed] [Green Version]
  5. Sachs, J.L.; Mueller, U.G.; Wilcox, T.P.; Bull, J.J. The evolution of cooperation. Q. Rev. Biol. 2004, 79, 135–160. [Google Scholar] [CrossRef] [PubMed]
  6. Nowak, M.A. Five rules for the evolution of cooperation. Science 2006, 314, 1560–1563. [Google Scholar] [CrossRef] [PubMed]
  7. Hamilton, W.D. The evolution of altruistic behaviour. Am. Nat. 1963, 97, 354–356. [Google Scholar] [CrossRef]
  8. Hofbauer, J.; Sigmund, K. Evolutionary Games Population Dynamics. 1998. Available online: https://www.cambridge.org/core/books/evolutionary-games-and-population-dynamics/A8D94EBE6A16837E7CB3CED24E1948F8 (accessed on 31 October 2018).
  9. Hofbauer, J.; Sigmund, K. Evolutionary game dynamics. Bull. Am. Math. Soc. 2003, 40, 479–519. [Google Scholar] [CrossRef]
  10. Grafen, A. The hawk-dove game played between relatives. Anim. Behav. 1979, 27, 905–907. [Google Scholar] [CrossRef]
  11. Eshel, I.; Cavalli-Sforza, L.L. Assortment of encounters and evolution of cooperativeness. Proc. Natl. Acad. Sci. USA 1982, 79, 1331–1335. [Google Scholar] [CrossRef] [PubMed] [Green Version]
  12. Tao, Y.; Lessard, S. Frequency-dependent selection in sexual family-structured populations. J. Theor. Biol. 2002, 217, 525–534. [Google Scholar] [CrossRef] [PubMed]
  13. Bergstrom, T.C. The algebra of assortative encounters and the evolution of cooperation. Int. Game Theor. Rev. 2003, 5, 211–228. [Google Scholar] [CrossRef]
  14. Taylor, C.; Nowak, M.A. Evolutionary game dynamics with non-uniform interaction rates. Theor. Popul. Biol. 2006, 69, 243–252. [Google Scholar] [CrossRef] [PubMed] [Green Version]
  15. Allen, B.; Nowak, M.A. Games among relatives revisited. J. Theor. Biol. 2015, 378, 103–116. [Google Scholar] [CrossRef] [PubMed]
  16. Cooney, D.; Allen, B.; Veller, C. Assortment and the evolution of cooperation in a Moran process with exponential fitness. J. Theor. Biol. 2016, 409, 38–46. [Google Scholar] [CrossRef] [PubMed] [Green Version]
  17. Brush, E.; Brännström, Å.; Dieckmann, U. Indirect reciprocity with negative assortment and limited information can promote cooperation. J. Theor. Biol. 2018, 443, 56–65. [Google Scholar] [CrossRef] [PubMed]
  18. Doebeli, M.; Hauert, C.; Killingback, T. Evolutionary origin of cooperators and defectors. Science 2004, 306, 859–862. [Google Scholar] [CrossRef] [PubMed]
  19. Deng, K.; Chu, T. Adaptive evolution of cooperation through Darwinian dynamics in public goods games. PLoS ONE 2011, 6, e25496. [Google Scholar] [CrossRef] [PubMed]
  20. Brännström, Å.; Gross, T.; Blasius, B.; Dieckmann, U. Consequences of fluctuating group size for the evolution of cooperation. J. Math. Biol. 2011, 63, 263–281. [Google Scholar] [CrossRef] [PubMed]
  21. Ito, K.; Ohtsuki, H.; Yamauchi, A. Relationship between aggregation of rewards and the possibility of polymorphism in continuous snowdrift games. J. Theor. Biol. 2015, 372, 47–53. [Google Scholar] [CrossRef] [PubMed] [Green Version]
  22. Sasaki, T.; Okada, I. Cheating is evolutionarily assimilated with cooperation in the continuous snowdrift game. Biosystems 2015, 131, 51–59. [Google Scholar] [CrossRef] [PubMed] [Green Version]
  23. Molina, C.; Earn, D.J. Evolutionary stability in continuous nonlinear public goods games. J. Math. Biol. 2017, 74, 499–529. [Google Scholar] [CrossRef] [PubMed]
  24. Geritz, S.A.H.; Kisdi, É.; Meszéna, G.; Metz, J.A.J. Evolutionarily singular strategies and the adaptive growth and branching of the evolutionary tree. Evolut. Ecol. 1998, 12, 35–57. [Google Scholar] [CrossRef] [Green Version]
  25. Metz, J.A.J.; Geritz, S.A.H.; Meszéna, G.; Jacobs, F.J.A.; Van Heerwaarden, J.S. Adaptive dynamics: A geometrical study of the consequences of nearly faithful reproduction. In Stochastic and Spatial Structures of Dynamical Systems; van Strien, S.J., Verduyn, L.S.M., Eds.; Amsterdam: New York, NY, USA, 1995; pp. 183–231. [Google Scholar]
  26. Dercole, F.; Rinaldi, S. Analysis of Evolutionary Processes: The Adaptive Dynamics Approach and Its Applications. 2008. Available online: https://press.princeton.edu/titles/8703.html (accessed on 31 October 2018).
  27. Brännström, Å.; Johansson, J.; von Festenberg, N. The hitchhiker’s guide to adaptive dynamics. Games 2013, 4, 304–328. [Google Scholar] [CrossRef] [Green Version]
  28. Gilbert, O.M.; Foster, K.R.; Mehdiabadi, N.J.; Strassmann, J.E.; Queller, D.C. High relatedness maintains multicellular cooperation in a social amoeba by controlling cheater mutants. Proc. Natl. Acad. Sci. USA 2007, 104, 8913–8917. [Google Scholar] [CrossRef] [PubMed] [Green Version]
  29. West, S.A.; Pen, I.; Griffin, A.S. Conflict and cooperation—Cooperation and competition between relatives. Science 2002, 296, 72–75. [Google Scholar] [CrossRef] [PubMed]
Figure 1. Examples of cost and benefit functions. Parameters used are for decelerating benefit b 2 = −1, b 1 = 20 ; for accelerating benefit b 2 = 0 . 5 , b 1 = 1 ; for decelerating cost c 2 = 2 . 75 , c 1 = 6 ; and for accelerating cost c 2 = 2 , c 1 = 1 . In choosing the horizontal range for the plots of the benefit functions, we have assumed N = 10 .
Games 09 00087 g001
Figure 2. Bifurcation diagrams showing how the evolutionary dynamics depend on average relatedness for all four possible combinations of the accelerating and decelerating benefit and cost functions in Figure 1. Green thin line represents convergence stability without evolutionary stability, blue thick line represents convergence stability with evolutionary stability, black dotted line represents neither convergence stability nor evolutionary stability, and black thick line represents evolutionary stability without convergence stability. We see that the four cases are qualitatively different. We also see that, when B and C are both decelerating, a certain range of relatedness leads to evolutionary branching. The parameters used were in all cases N = 10 , and b 1 , b 2 , c 1 , c 2 as in Figure 1.
Games 09 00087 g002
Figure 3. Plots of variance in relatedness against average relatedness. The grey region represents combinations of mean and variance that are not logically possible (see Appendix A.2). We see that for decreasing cost and benefit, the region with evolutionary branching shrinks with increased variance in relatedness. We also see that. for increasing cost and benefit, the region with neither convergence stability nor evolutionary stability shrinks with increased variance in relatedness. In the latter case, with increased average relatedness or variance in relatedness, the singular strategy moves from evolutionary stability (ESS) without convergence stability to neither evolutionary stability nor convergence stability. The parameters used are in both cases N = 10 , and b 1 , b 2 , c 1 , c 2 as in Figure 1.
Games 09 00087 g003
Figure 4. Simulations using group size N = 10 , and B and C both decelerating or both accelerating. As predicted by the analytical investigation, when B and C are decelerating, the population undergoes evolutionary branching when μ = 0 . 4 , and it reaches evolutionary stability when μ = 0 . 8 . When B and C are accelerating, bistability occurs when μ = 0 . 5 . In all three cases, σ 2 = 0 .
Games 09 00087 g004

