Rate Parameter Distributions for Isobutane Dehydrogenation and Isobutene Dimerization and Desorption over HZSM-5

Abstract
:1. Introduction
2. Kinetics of Steady-State, Low-Pressure Catalysis
2.1. Mechanism


2.2. Rate Laws


3. Results and Discussion


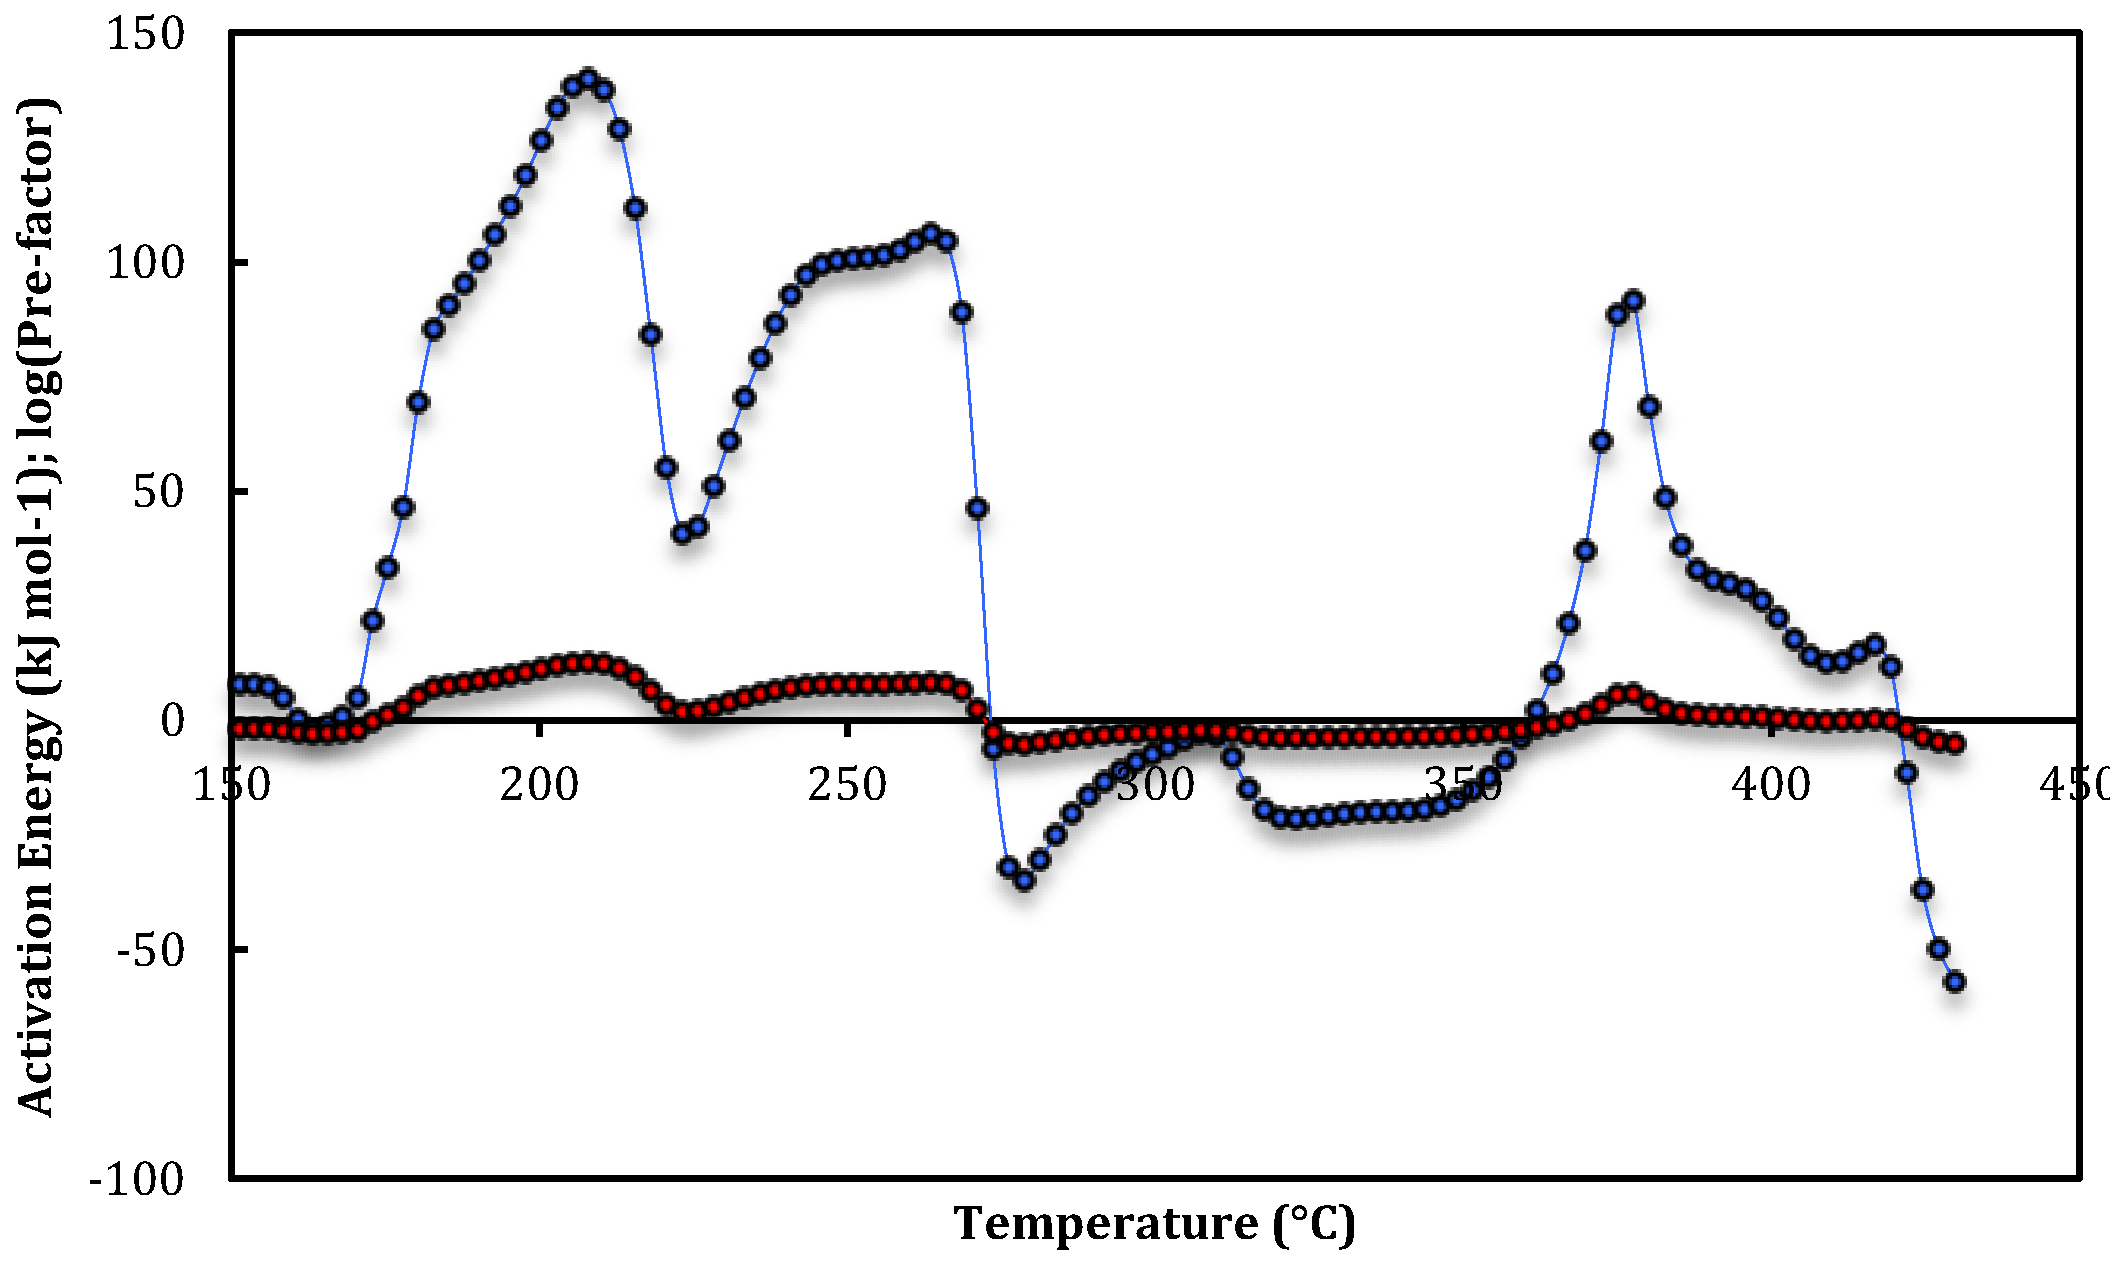
| Run 1 | T-range (°C) | E app(T) (KJ mol-1) | log10(Aapp(T))(s−1) |
|---|---|---|---|
| Site-1 | 140–156 | 7.9 ± 0.3 | −2.49 ± 0.03 |
| Site-1 | 173–178 | 34 ± 12 | 0.6 ± 1.4 |
| Site-2a | 183–190 | 93 ± 6 | 7.2 ± 0.6 |
| Site-2a | 205–211 | 138.5 ± 1.2 | 11.80 ± 0.15 |
| Site-2b | 243–251 | 99.4 ± 1.6 | 7.09 ± 0.12 |
| Site-2b | 261–266 | 105.0 ± 1.0 | 7.44 ± 0.10 |
| Site-3a | 276–281 | −32 ± 2 | −5.7 ± 0.2 |
| Site-3a | 305–310 | −3.5 ± 0.7 | −2.91 ± 0.06 |
| Site-3b | 318–344 | −20.4 ± 0.7 | −4.30 ± 0.11 |
| Site-2c | 375–378 | 90 ± 2 | 5.05 ± 0.18 |
| Site-1 | 388–393 | 31.1 ± 1.6 | 0.42 ± 0.10 |
| Site-1 | 406–419 | 13.7 ± 1.7 | −0.69 ± 0.15 |
| Run 2 | T-range (°C) | E app(T) (KJ mol-1) | log10(Aapp(T))(s−1) |
|---|---|---|---|
| Site-1 | 141−155 | 10.7 ± 1.8 | −1.9 ± 0.2 |
| Site-1 | 177−182 | 41.3 ± 0.8 | 1.72 ± 0.07 |
| Site-2a | 189−194 | 74 ± 3 | 5.3 ± 0.3 |
| Site-2a | 207−213 | 111 ± 2 | 9.0 ± 0.3 |
| Site-2b | 250−256 | 116 ± 9 | 8.9 ± 0.9 |
| Site-2b | 266−271 | 171 ± 6 | 13.8 ± 0.5 |
| Site-3a | 278−284 | −80 ± 10 | −10.0 ± 0.9 |
| Site-3a | 310−312 | 8.2 ± 0.7 | −1.71 ± 0.06 |
| Site-3b | 320−357 | −24.8 ± 1.9 | −4.50 ± 0.19 |
| Site-2c | 380−383 | 140 ± 7 | 9.1 ± 0.5 |
| Site-1 | 406−411 | 8.5 ± 0.6 | −1.11 ± 0.07 |
| Site-1 | 419−424 | 21.8 ± 1.9 | 0.04 ± 0.15 |
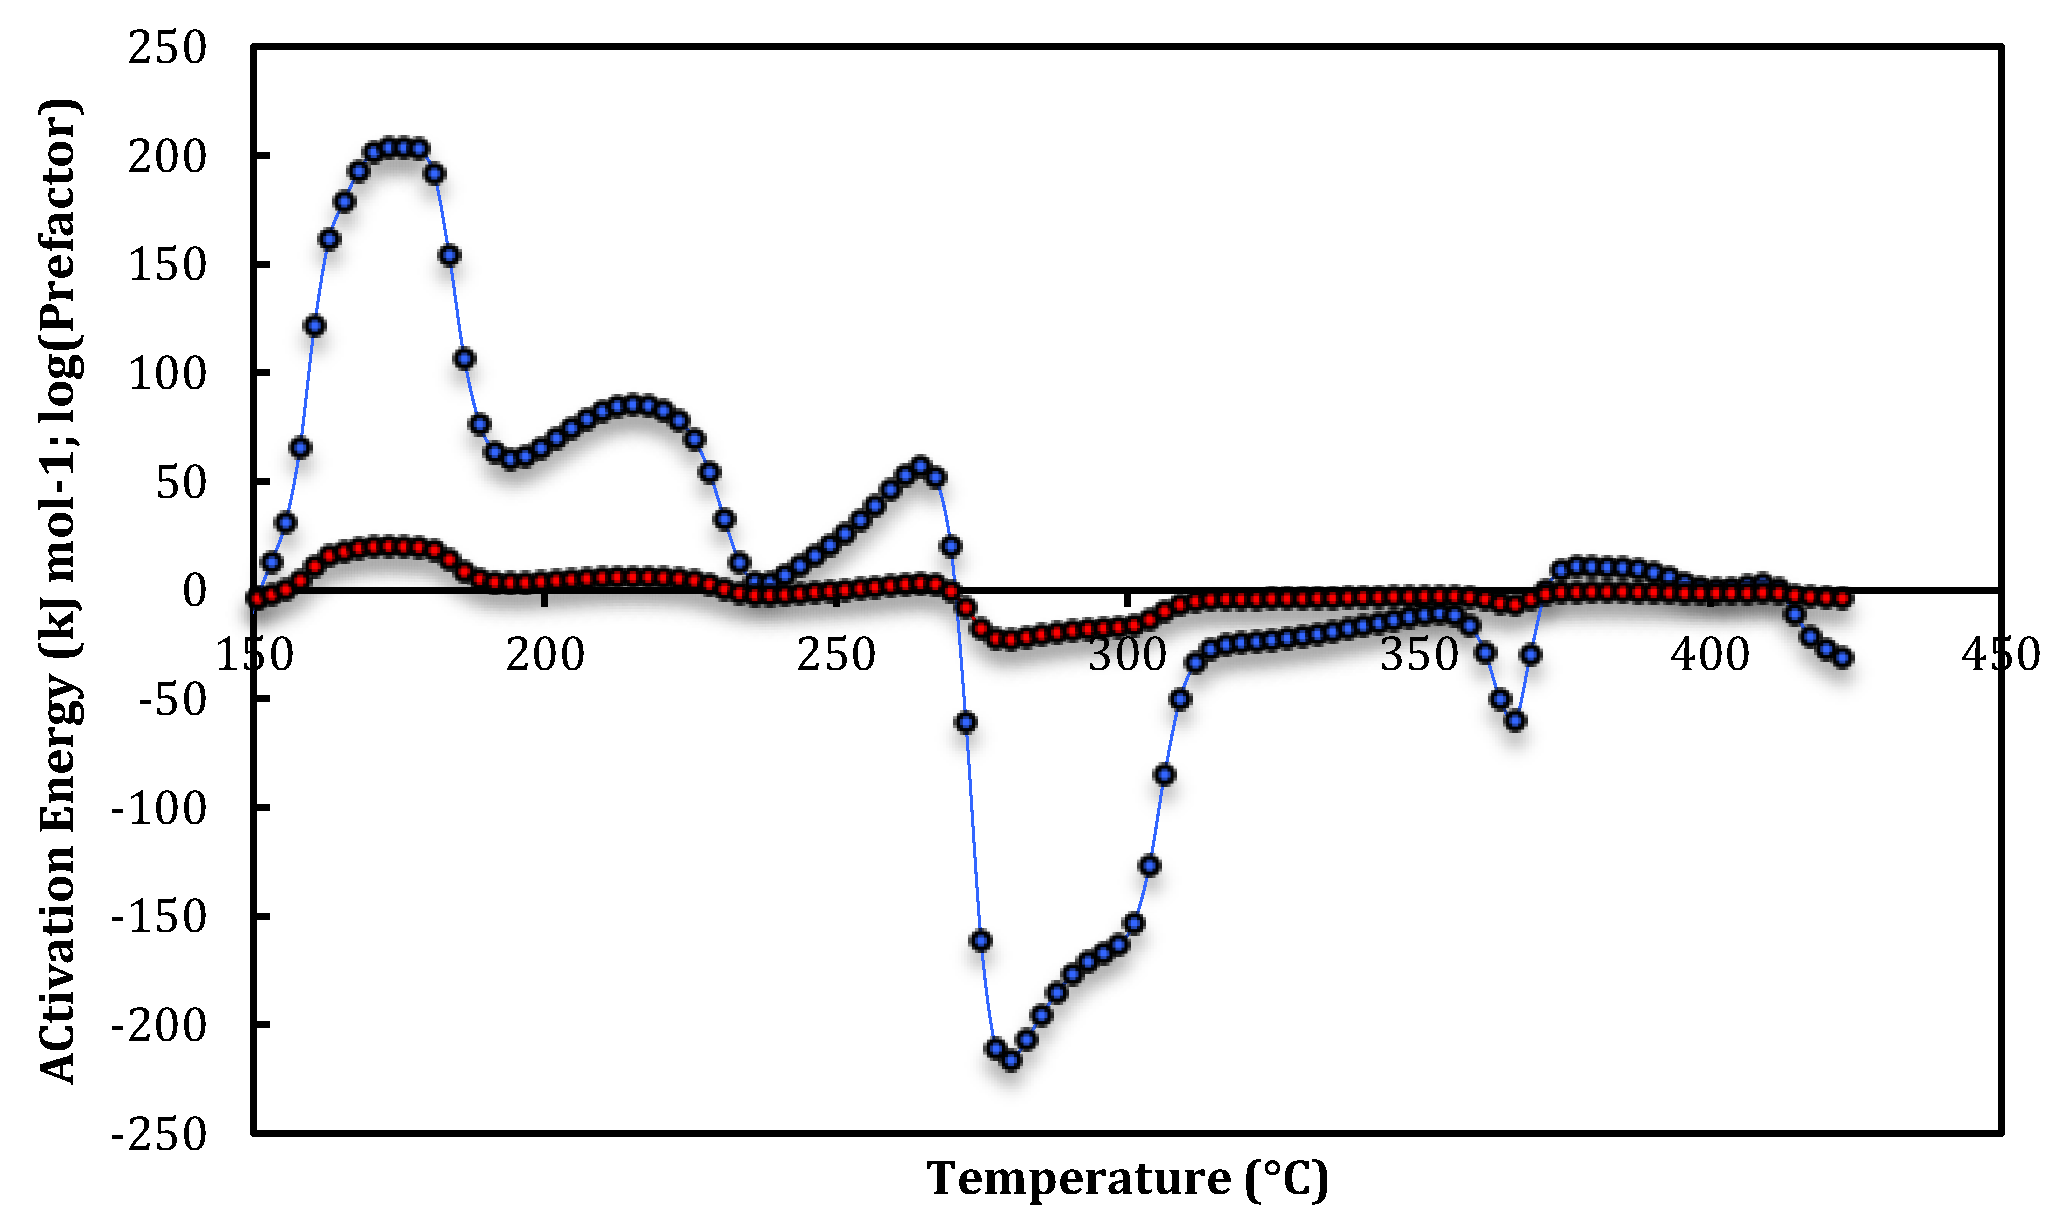
| Run 3 | T-range (°C) | E app(T)(KJ mol-1) | log10(Aapp(T))(s−1) |
|---|---|---|---|
| Site-2b | 163–166 | 170 ± 12 | 16.7 ± 1.4 |
| Site-2b | 171–178 | 203.0 ± 1.0 | 20.03 ± 0.15 |
| Site-2a | 210–220 | 84.0 ± 1.4 | 5.91 ± 0.15 |
| Site-1 | 249–254 | 26 ± 6 | 0.1 ± 0.6 |
| Site-2a | 262–267 | 54 ± 3 | 2.9 ± 0.3 |
| Site-3a | 277–283 | −211 ± 5 | −22.2 ± 0.5 |
| Site-3a | 293–298 | −167 ± 4 | −17.5 ± 0.5 |
| Site-3b | 314–322 | −25.0 ± 1.6 | −4.2 ± 0.4 |
| Site-3b | 351–356 | −11.1 ± 0.5 | −3.25 ± 0.04 |
| Site-3c | 367–369 | −47 ± 15 | –5.6 ± 1.1 |
| Site-1 | 374–388 | 10.3 ± 0.7 | −0.82 ± 0.06 |
3.1. Isobutene Desorption


| Site-1 (Low T) | Site-1 (High T) | |
|---|---|---|
| E6 (kJ mol-1) | E6 (kJ mol-1) | |
| Run 1 | 64.4 ± 0.3; 90.5 ± 12 | 87.6 ± 1.6; 70.2 ± 1.7 |
| Run 2 | 67.2 ± 1.8; 97.8 ± 0.8 | 65.0 ± 0.6; 78.3 ± 1.9 |
| Run 3 | 83 ± 6 | 66.8 ± 0.7 |
| Average | 77 ± 12 | |
| log10A1(s-1) | log10A1(s-1) | |
| Run 1 | –2.49 ± 0.03; 0.6 ± 1.4 | 0.42 ± 0.10; –0.69 ± 0.15 |
| Run 2 | –1.9 ± 0.2; 1.72 ± 0.07 | –1.11 ± 0.07; 0.04 ± 0.15 |
| Run 3 | 0.1 ± 0.6 | –0.82 ± 0.06 |
| Average | –0.4 ± 1.2 | |
3.2. Isobutane Dehydrogenation


| Site-2a | Site-2b | Site-2c | |
|---|---|---|---|
| E3 (kJ mol−1) | E3 (kJ mol−1) | E3 (kJ mol−1) | |
| Run 1 | 125 ± 6 to 170.7 ± 1.2 | 131.6 ± 1.6 to 137.2 ± 1.0 | 122.2 ± 2.0 |
| Run 2 | 106 ± 3 to 143 ± 2 | 148 ± 9 to 203 ± 6 | 172 ± 7 |
| Run 3 | 86 ± 3 to 116.2 ± 1.4 | 202 ± 12 to 235.2 ± 1.0 | – |
| Range | 86 ± 3 to 170.7 ± 1.2 | 131.6 ± 1.6 to 235.2 ± 1.0 | 122.2 ± 2.0 to 172 ± 7 |
| log10A1(s−1) | log10A1(s−1) | log10A1(s−1) | |
| Run 1 | 7.2 ± 0.6 to 11.80 ± 0.15 | 7.09 ± 0.12 to 7.44 ± 0.10 | 5.05 ± 0.18 |
| Run 2 | 5.3 ± 0.3 to 9.0 ± 0.3 | 8.9 ± 0.9 to 13.8 ± 0.5 | 9.1 ± 0.5 |
| Run 3 | 2.9 ± 0.3 to 5.91 ± 0.15 | 16.7 ± 1.4 to 20.03 ± 0.15 | – |
| Range | 2.9 ± 0.3 to 11.80 ± 0.15 | 7.09 ± 0.12 to 20.03 ± 0.15 | 5.05 ± 0.18 to 9.1 ± 0.5 |
3.3 Isobutene Dimerization (or Hydrogenation)


| Site-3a | Site-3b | Site-3c | |
|---|---|---|---|
| E4 (kJ mol−1) | E4 (kJ mol−1) | E4 (kJ mol−1) | |
| Run 1 | 88 ± 2 to 60.0 ± 0.7 | 76.9 ± 0.7 | – |
| Run 2 | 136 ± 10 to 48.3 ± 0.7 | 81.3 ± 1.9 | – |
| Run 3 | 267 ± 5 to 223 ± 4 | 81.5 ± 1.6 to 67.6 ± 0.5 | 104 ± 15 |
| Range | 48.3 ± 0.7 to 267 ± 5 | 67.6 ± 0.5 to 81.5 ± 1.6 | 104 ± 15 |
| log10A1(s−1) | log10A1(s−1) | log10A1(s−1) | |
| Run 1 | 5.7 ± 0.2 to 2.91 ± 0.06 | 4.30 ± 0.11 | – |
| Run 2 | 10.0 ± 0.9 to 1.71 ± 0.06 | 4.50 ± 0.19 | – |
| Run 3 | 22.2 ± 0.5 to 17.5 ± 0.5 | 4.2 ± 0.4 to 3.25 ± 0.04 | 5.6 ± 1.1 |
| Range | 1.71 ± 0.06 to 22.2 ± 0.5 | 3.25 ± 0.04 to 4.50 ± 0.19 | 5.6 ± 1.1 |
4. Experimental and Data Analysis
4.1. Experimental Technique and Materials


| Knudsen cell (5 reactors) | |
|---|---|
| Volumes | 8,000 to 10,000 mm3 |
| Internal surface areas | 2,000 to 3,000 mm2 |
| Exit aperture areas | 0.8 to 1.6 mm2 |
| Maximum isobutane flow rate (500°C) | 4.2 × 10¹⁵ molecules s−1 |
| Pressure in cell | 7 to 10 Pa |
| Collisions/molecule | 2500 to 1900 |
| Escape rate constant, kesc | 0.12 to 0.18 × (T/M)1/2s−1 |
| Mass spectrometer calibration | |
| Isobutane mass spec. sensitivity factor, α58 | 2.3 ± 1.5 × 10⁻¹⁶ I58 s molecule−1 |
| Isobutene mass spec. sensitivity factor, α56 | 3.5 ± 2.3 × 10⁻¹⁶ I56 s molecule−1 |
| I56 correction for isobutane | 0.1377 ± 0.0028 × I58 |
4.2. Wavelet Shrinkage Denoising
- (i)
- Decompose the signal using a discrete wavelet transform; linear forward wavelet transform.
- (ii)
- Perform thresholding in the wavelet domain; non-linear shrinkage denoising.
- (iii)
- Perform a linear inverse wavelet transform.
4.3. Time-Varying Flexible Least Squares


5. Conclusions


Nomenclature:
| IA(g) and IE(g) | gas-phase isobutane and isobutene |
| S and S* | non-specific sites and acidic sites on the zeolite surface |
| IA-S and IE-S | isobutane and isobutene adsorbed on non-specific sites |
| IA-S*, IE-S* and IE2-S* | isobutane, isobutene and isobutene dimers adsorbed on acidic sites |
| ki and k−i | forward and reverse intrinsic rate constants for reaction Ri |
| kapp | apparent rate constants |
| Ai, A−i and Aapp | intrinsic and apparent prefactors |
| Ei, E−i and Eapp | intrinsic and apparent activation energies (kJ mol−1) |
| Run 1, 2 and 3 | consecutive temperature-programmed, steady-state, low-pressure experiments |
| Site-1, Site-2a, -2b, -2c and Site-3a, -3b, -3c | proposed active sites for desorption, dehydrogenation and dimerization |
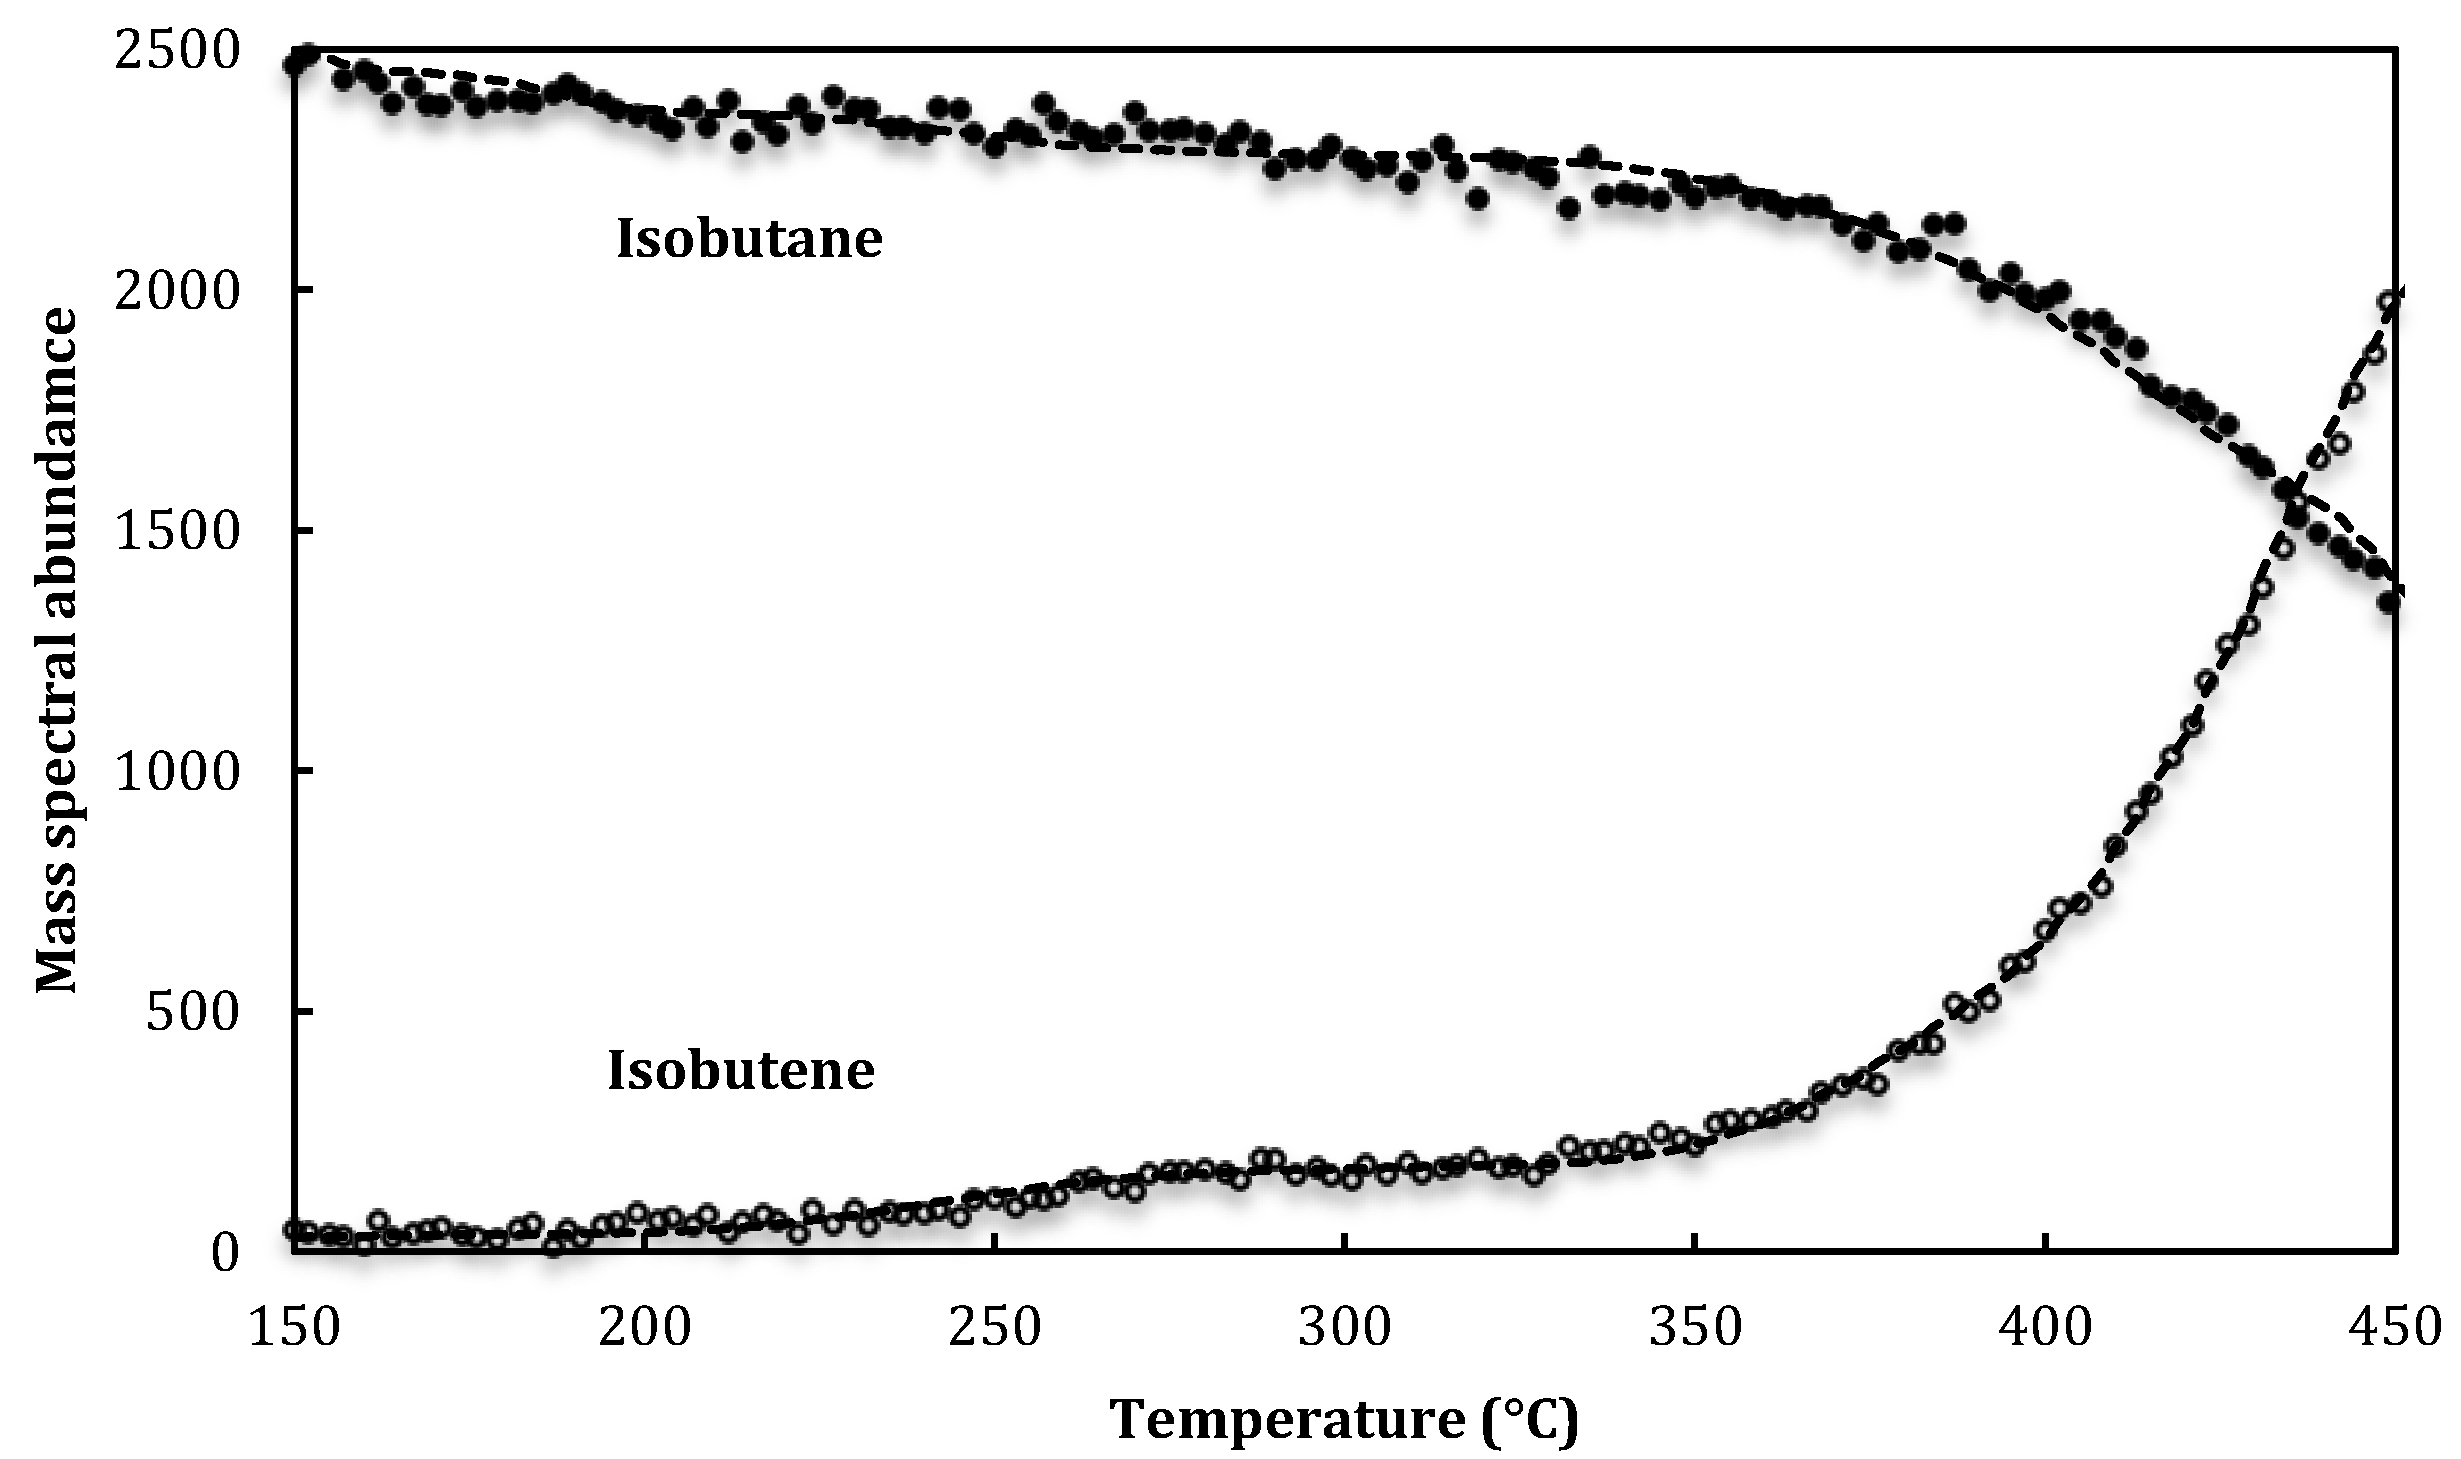
| I56 and I58 | mass-spectral abundances for isobutene (m/e = 56) and isobutane (m/e = 58) |
| α56 and α58 | mass-spectral sensitivity factors for isobutene and isobutane |
| kesc1A and kesc1E | Knudsen cell escape rate constants for isobutane and isobutene (s−1) |
| Ah | area of the Knudsen cell escape aperture (mm2) |
| V and T | volume (mm3) of and temperature (K) within the Knudsen cell |
| c and M | mean molecular speed and molar mass of isobutane or isobutene |
| Aesc | Knudsen cell escape rate constant prefactor for isobutane (K−1/2 s−1) |
| yt, ht, bm,t, N: | functions and parameters for time-varying flexible least squares |
Conflicts of Interest
References
- Le Minh, C.; Brown, T.C. Rate parameters from low-pressure steady-state protolytic cracking and dehydrogenation of isobutane over zeolite catalysts. Appl. Catal. A 2006, 310, 145–154. [Google Scholar] [CrossRef]
- Yanping, S.; Brown, T.C. Kinetics of isobutane dehydrogenation and cracking over HZSM-5 at low pressures. J. Catal. 2000, 194, 301–308. [Google Scholar] [CrossRef]
- Kalaba, R.; Tesfatsion, L.C. Time-varying linear regression via flexible least squares. Compt. Math. Appl. 1989, 17, 1215–1245. [Google Scholar] [CrossRef]
- Le Minh, C.; Alanazi, A.K.; Miron, D.J.; Brown, T.C. Carbon-carbon bond cleavage and dehydrogenation of isobutane over HZSM-5 at low pressures and temperatures. Catal. Lett. 2012, 142, 1470–1473. [Google Scholar] [CrossRef]
- Miron, D.J.; Kendell, S.M.; Munshi, A.M.; Alanazi, A.K.; Brown, T.C. Time-varying flexible least squares for thermal desorption of gases. Int. J. Chem. Kinet. 2013, 45, 374–386. [Google Scholar] [CrossRef]
- Nieskens, D.L.S.; van Bavel, A.P.; Niemantsverdriet, J.W. The analysis of temperature programmed desorption experiments of systems with lateral interactions; implications of the compensation effect. Surface Sci. 2003, 546, 159–169. [Google Scholar] [CrossRef]
- Budrugeac, P.; Segal, E. Some methodological problems concerning nonisothermal kinetic analysis of heterogeneous solid-gas reactions. Int. J. Chem. Kinet. 2001, 33, 564–573. [Google Scholar] [CrossRef]
- Smit, B.; Maesen, T.L. Molecular simulations of zeolites: Adsorption, diffusion, and shape selectivity. Chem. Rev. 2008, 108, 4125–4184. [Google Scholar] [CrossRef]
- Zhdanov, V.P.; Kasemo, B. Surface restructuring, thermal desorption and kinetic bistability, and chemical waves. J. Stat. Phys. 1998, 90, 79–101. [Google Scholar] [CrossRef]
- Percival, D.B.; Walden, A.T. Wavelet Methods for Time Series Analysis; Cambridge University Press: New York, NY, USA, 2006. [Google Scholar]
- Kulprathipanja, S. Zeolites in Industrial Separation and Catalysis; Wiley-VCH Verlag GmbH & Co. KGaA: Weinheim, Germany, 2010. [Google Scholar]
- Stefanadis, C.; Gates, B.C.; Haag, W.O. Rates of isobutane cracking catalyzed by HZSM-5: The carbonium ion route. J. Mol. Catal. 1991, 67, 363–367. [Google Scholar] [CrossRef]
- Liu, D.; Bhan, A.; Tspatsis, M.; Al Hashimi, S. Catalytic behavior of Brønsted acid sites in MWW and MFI zeolites with dual meso- and microporosity. ACS Catal. 2011, 1, 7–17. [Google Scholar]
- Narbeshuber, T.F.; Brait, A.; Seshan, K.; Lercher, J.A. Dehydrogenation of light alkanes over zeolites. J. Catal. 1997, 172, 127–136. [Google Scholar] [CrossRef]
- Gounder, R.; Iglesia, E. Effects of partial confinement on the specificity of monomolecular alkane reactions for acid sites in side pockets of mordenite. Angew. Chem. Int. Ed. 2010, 49, 808–811. [Google Scholar] [CrossRef]
- Honkela, M.L.; Krause, A.O.I. Kinetic modeling of the dimerization of isobutene. Ind. Eng. Chem. Res. 2004, 43, 3251–3260. [Google Scholar] [CrossRef]
- Honkela, M.L.; Krause, A.O.I. Influence of linear butenes in the dimerization of isobutene. Ind. Eng. Chem. Res. 2005, 44, 5291–5297. [Google Scholar] [CrossRef]
- Talwalkar, S.; Chauhan, M.; Aghalayam, P.; Qi, Z.; Sundmacher, K.; Mahajani, S. Kinetic studies on the dimerization of isobutene with ion-exchange resin in the presence of water as a selectivity enhancer. Ind. Eng. Chem. Res. 2006, 45, 1312–1323. [Google Scholar] [CrossRef]
- Talwalkar, S.; Chauhan, M.; Katariya, A.; Aghalayam, P.; Ivanova, M.; Sundmacher, K.; Mahajani, S. Selectivity engineering with reactive distillation for dimerization of C4 olefins: Experimental and theoretical studies. Ind. Eng. Chem. Res. 2007, 46, 3024–3034. [Google Scholar] [CrossRef]
- Hauge, K.; Bergene, E.; Chen, D.; Fredriksen, G.R.; Holmen, A. Oligomerization of isobutene over solid acid catalysts. Catal. Today 2005, 100, 463–466. [Google Scholar] [CrossRef]
- Gounder, R.; Iglesia, E. Catalytic hydrogenation of alkenes on acidic zeolites: Mechanistic connections to monomolecular alkane dehydrogenation reactions. J. Catal. 2011, 277, 36–45. [Google Scholar] [CrossRef]
- Milas, I.; Nascimento, M.A.C. The dehydrogenation and cracking reactions of isobutane over the ZSM-5 zeolite. Chem. Phys Lett. 2003, 373, 379–384. [Google Scholar] [CrossRef]
- Zheng, B.; Blowers, P. Reactivity of isobutane on zeolites: A first principles study. J. Phys. Chem. A 2006, 110, 2455–2460. [Google Scholar] [CrossRef]
- Mota, C.J.A.; Bhering, D.L.; Ramirez-Solis, A. Activation of alkanes on zeolites: A DFT study of hydride abstraction and dehrydrogenation on extra-framework aluminium species. Int. J. Quantum Chem. 2005, 105, 174–185. [Google Scholar] [CrossRef]
- Milas, I.; Silva, A.M.; Nascimento, A.C. A density functional study on the nature of the adsorption complex between isobutane and H-ZSM5 and its implication for the mechanism of activation of alkane molecules over H-ZSM5. Appl. Catal. A 2008, 336, 17–22. [Google Scholar] [CrossRef]
- Weitkamp, J.; Hunger, M. Acid and base catalysis on zeolites. In Studies in Surface Science and Catalysis; Čejka, J., van Bekkum, H., Corma, A., Schüth, F., Eds.; Elsevier: Amsterdam, The Netherlands, 2007; Volume 168, pp. 787–835. [Google Scholar]
- Golden, D.M.; Spokes, G.N.; Benson, S.W. Very low-pressure pyrolysis (VLPP); A versatile kinetic tool. Angew. Chem. Int. Ed. 1973, 12, 534–546. [Google Scholar] [CrossRef]
- Hufton, J.R.; Ruthven, D.M.; Danner, R.P. Adsorption and diffusion of hydrocarbons in silicalite at very low concentration: Effect of defect sites. Microporous Mater. 1995, 5, 39–52. [Google Scholar] [CrossRef]
- Saravanan, C.; Auerbach, S.M. Modelling the concentration of diffusion in zeolites. 1. Analytical theory for benzene in Na-Y. Chin. J. Chem. Phys. 1997, 107, 8120–8131. [Google Scholar] [CrossRef]
- Truitt, M.J.; Toporek, S.S.; Rovira-Truitt, R.; White, J.L. Alkane C–H bond activation in zeolites: Evidence for direct protium exchange. J. Am. Chem. Soc. 2006, 128, 1847–1852. [Google Scholar] [CrossRef]
- R Core Team. R: A Language and Environment for Statistical Computing; R Foundation for Statistical Computing: Vienna, Austria, 2012. [Google Scholar]
- Nason, G. Wavethresh: Wavelet Statistics and Transforms, R package version 4.6.2.; Available online: http://cran.r-project.org/web/packages/wavethresh/index.html (accessed on 2 April 2013).
- Kalaba, R.; Tesfatsion, L. A Multicriteria approach to model specification and estimation. Comput. Stat. Data Anal. 1996, 21, 193–214. [Google Scholar] [CrossRef]
- Montana, G.; Triantafyllopoulos, K.; Tsagaris, T. Flexible least squares for temporal data mining and statistical arbitrage. Expert Syst. Appl. 2009, 36, 2819–2830. [Google Scholar] [CrossRef]
© 2013 by the authors; licensee MDPI, Basel, Switzerland. This article is an open access article distributed under the terms and conditions of the Creative Commons Attribution license (http://creativecommons.org/licenses/by/3.0/).
Share and Cite
Brown, T.C.; Miron, D.J.; Alanazi, A.K.; Le Minh, C. Rate Parameter Distributions for Isobutane Dehydrogenation and Isobutene Dimerization and Desorption over HZSM-5. Catalysts 2013, 3, 922-941. https://doi.org/10.3390/catal3040922
Brown TC, Miron DJ, Alanazi AK, Le Minh C. Rate Parameter Distributions for Isobutane Dehydrogenation and Isobutene Dimerization and Desorption over HZSM-5. Catalysts. 2013; 3(4):922-941. https://doi.org/10.3390/catal3040922
Chicago/Turabian StyleBrown, Trevor C., David J. Miron, Abdullah K. Alanazi, and Cam Le Minh. 2013. "Rate Parameter Distributions for Isobutane Dehydrogenation and Isobutene Dimerization and Desorption over HZSM-5" Catalysts 3, no. 4: 922-941. https://doi.org/10.3390/catal3040922