Cu Nanoparticles/Fluorine-Doped Tin Oxide (FTO) Nanocomposites for Photocatalytic H2 Evolution under Visible Light Irradiation

Key Laboratory of Functional Molecular Engineering of Guangdong Province, School of Chemistry & Chemical Engineering, South China University of Technology, Guangzhou 510640, China
*
Authors to whom correspondence should be addressed.
Catalysts 2017, 7(12), 385; https://doi.org/10.3390/catal7120385
Submission received: 12 August 2017
/
Revised: 29 September 2017
/
Accepted: 29 September 2017
/
Published: 12 December 2017
(This article belongs to the Special Issue Nanomaterials for Environmental Purification and Energy Conversion)
Abstract
:Copper nanoparticles/fluorine-doped tin oxide (FTO) nanocomposites were successfully prepared by a simple hydrothermal method. The synthesized nanocomposites were characterized by X-ray diffraction (XRD), UV-visible diffuse-reflectance spectrum (UV-VIS DRS), energy dispersive X-ray (EDX), transmission electron microscopy (TEM), Raman spectra, and X-ray photoelectron spectroscopy (XPS). The obtained Cu/FTO nanocomposites exhibit high photocatalytic activity for H2 evolution under visible light (λ > 420 nm) irradiation. When the content of Cu is 19.2 wt % for FTO, the Cu/FTO photocatalyst shows the highest photocatalytic activity and the photocatalytic H2 evolution rate is up to 11.22 μmol·h−1. Meanwhile, the photocatalyst exhibits excellent stability and repeatability. It is revealed that the transfer efficiency of the photogenerated electrons is improved greatly because of the intense interaction between Cu NPs and FTO. Furthermore, a possible mechanism is proposed for enhanced photocatalytic H2 evolution of Cu/FTO photocatalysts under visible light irradiation.
1. Introduction
Hydrogen (H2) is regarded as one of the most promising energy sources because of its high energy content per mass. Photocatalytic H2 evolution using solar energy has attracted much attention, which is a feasible method to solve energy shortages and environmental crises [1,2,3]. Since Fujishima and Honda firstly reported the photolysis of water based on TiO2 electrodes in 1972 [4], semiconductor materials as photocatalysts have been extensively studied for highly-efficient solar water splitting. Subsequently, many semiconductor materials have been developed as efficient photocatalystys to make the utmost of solar energy for photocatalytic H2 evolution [5,6].
It is well known that tin oxide (SnO2) is one of the most promising semiconductors for photocatalytic H2 evolution due to its excellent chemical and physical properties [7]. In the past few decades, SnO2 has been extensively used in gas sensing, photoelectric conversion and photcatalysis, etc. However, because of the intrinsic band gap (ca. 3.6 eV), SnO2 cannot fully use solar radiation in visible spectrum [8]. Many researchers have been trying to modify SnO2 to increase its absorption of visible light, which accounts for 45% of sunlight [9]. Many different approaches can be used to promote visible light absorption, such as metal doping, ion doping, carbon materials doping, etc. [10,11,12]. Especially, fluorine (F) has been considered as one of the most effective dopants for enhancing light absorption. Fluorine-doped tin oxide (FTO) is widely used as conducting electrodes for photoelectrochemical reactions [13]. However, owing to the rapid recombination that photoinduction carries, the photocatalytic activity of fluorine-doped tin oxide (FTO) for H2 evolution is usually very low, or non-existent, in the presence of a sacrificial agent [14].
As it is well known, loading metal nanoparticles (NPs) as co-catalysts on the surface of catalysts is one of the most effective ways to increase the separation efficiency of photoinduced electron-hole pairs [15]. Many researchers reported that metals, such as Au, Ag, Pt, Cu, and Pd, could be used to promote the migration efficiency of electrons [16,17,18,19,20]. Among of them, Cu has attracted much more attention because of its low cost and abundance [21]. Additionally, Cu NPs can generate the localized surface plasmon resonance (LSPR) effect and it is beneficial for the separation of photoinduced electron-hole pairs, which can greatly enhance the photocatalytic activity [22]. Therefore, Cu NPs as co-catalyst-modified semiconductor photocatalysts may be a promising system to promote the migration of photoinduced electrons for enhancing photocatalytic H2 evolution. Though there are many reports about growth of copper or copper oxides on FTO for photoelectrochemical hydrogen evolution reaction (HER) and oxygen evolution reaction (OER) [23,24]. To the best of our knowledge, there is no report about Cu NP-modified FTO (Cu/FTO) nanocomposites for photocatalytic H2 evolution under visible light irradiation.
Here, based on our previous research [15,22,25,26], we reported that FTO nanopowders were fabricated by a typical sol-gel method and then modified with Cu further by a facile hydrothermal method. The Cu/FTO nanocomposites were characterized by X-ray diffraction (XRD), UV-VIS, energy dispersive X-ray (EDX), transmission electron microscopy (TEM), X-ray photoelectron spectroscopy (XPS) and so forth. The photacatalytic H2 evolution of Cu/FTO nanocomposites was evaluated under visible light illumination. The F dopant can greatly enhance the absorption ability of the visible light of SnO2 and the Cu/FTO nanocomposites exhibit high photocatalytic activity for H2 evolution. Furthermore, the possible factors in the improvement of photocatalytic activity were also investigated and discussed in this paper.
2. Results
2.1. Crystal Structure and Composition
Figure 1 shows the XRD patterns of as-prepared samples. For pure SnO2, the diffraction peaks are indexed to the crystalline tetragonal structure of SnO2 (JCPDS No. 41-1445) [27]. The FTO sample exhibits similar diffraction peaks with pure SnO2, which indicates FTO has the similar crystal structure with pure SnO2. For Cu/FTO samples, the diffraction peaks at 43.3°, 50.5°, and 74.1° are assigned to the (111), (200), and (220) planes of face-centered cubic Cu (JCPDS No. 04-0836) [26]. As the content of Cu increases, the intensity of characteristic peaks becomes stronger. No diffraction peak of CuO or Cu2O is observed, which is in agreement with the result of the XPS analysis below. Additionally, the XRD patterns of FTO after the introduction of Cu show no significant change indicating that the introduction of Cu does not influence the crystal structure of FTO.
To elaborate on the information of the as-prepared samples, Fourier transform infrared spectroscopy (FTIR) was carried out. Figure 2 depicts the FTIR spectra of pure SnO2, FTO, and 19.2% Cu/FTO. The peaks at 924 cm−1 and 1530 cm−1 can be ascribed to the N–H out-of-plane bending vibration and in-plane bending vibration. The peak at 1678 cm−1 is attributed to the C=O stretching vibration [28]. The peaks around 3400–3800 cm−1 correspond to the N–H stretching vibration of amino groups and the O–H stretching vibrations of absorbed molecular water [6]. The characteristic peaks at 495 cm−1 and 642 cm−1 are ascribed to the O–Sn–O stretching vibration and the Sn–O stretching vibration, respectively [29]. The main characteristic peaks of SnO2 are apparent in Cu/FTO nanocomposites, indicating the structure of SnO2 remains relatively intact. Moreover, no peak of Cu is observed because Cu is not active for infrared spectra.
Figure 3 displays the Raman spectra of pure SnO2, FTO, and Cu/FTO. There are three fundamental Raman scattering peaks in good agreement with those of rutile SnO2 single crystal [7]. For pure SnO2, the characteristic and strong band at 625 cm−1 is attributed to A1g vibration mode of SnO2. The weak bands around 478 cm−1 and 772 cm−1 correspond to Eg and B2g vibration modes of SnO2 [30]. After doping F ions, the dominant bands of SnO2 broaden and have a slight shift, which might be evidence that F ions have substituted for a portion of O2− in the SnO2. Compared with FTO, the intensity of Cu/FTO samples become stronger, indicating that there may be an intense interaction between Cu NPs and FTO [22]. Especially, the 19.2% Cu/FTO sample exhibits the strongest intensity and this SERS enhancement may be due to surface plasmon resonance [31]. Moreover, Figure S1 shows the Raman spectra at low wavelength region. Compared with FTO, there is no other band appearing for 19.2% Cu/FTO, which may exclude the presence of oxidized Cu [32].
Morphologies and microstructures of the samples were studied by scanning electron microscopy (SEM), transmission electron microscopy (TEM), and high resolution TEM (HRTEM). Figure 4a shows the SEM image of the FTO sample. The morphology looks like irregular particles and many aggregations exist. Figure 4b–e shows the SEM images of Cu/FTO (7.4%, 19.2%, and 28.4%) samples, respectively. After the introduction of Cu, the particle size of Cu/FTO samples seems to be larger and there appear to be more aggregations. Especially for the 28.4% Cu/FTO sample, bulk agglomeration appears in the image (Figure 4e). The EDX spectrum (Figure 4f) and the elemental mapping patterns (Figure 4g) confirm that C, O, Sn, Cu, and F exist, which is consistent with the result of XPS below. Meanwhile, we can see that the main elements are uniformly distributed. The TEM images (Figure S2a–c) shows that the size distribution of 19.2% Cu/FTO sample is about 40–80 nm and there are some particles joining together. The HRTEM image of 19.2% Cu/FTO is presented in Figure S2d. The lattice spacing of d = 0.209 nm corresponds to the (111) plane of Cu [15]. The lattice spacing of d = 0.237 nm and 0.335 nm are attributed to the (200) plane and the (110) plane of SnO2 (JCPDS No. 41-1445), respectively [33]. It can be found that Cu NPs and FTO have a close contact for developing the heterogeneous interface and this can promote the migration efficiency of photoinduced electrons.
The XPS spectra of the as-prepared 19.2% Cu/FTO sample were analyzed to further determine the chemical composition and the chemical state of elements. The results are shown in Figure 5. The standard C 1s peak at 284.8 eV was used as a reference to correct the peak shifts. The survey spectra of Cu/FTO sample (Figure 5a) suggest the presence of C, O, F, Sn, and Cu elements. Figure 5b shows the high-resolution XPS spectra of C 1s, the peaks at 284.8 eV, 285.9 eV, and 288.6 eV correspond to C–C, C–O, and O–C=O, respectively [34]. The XPS spectrum of O 1s (Figure 5c) exhibits two fitted peaks located at 531.1 eV and 532.2 eV, which are assigned to Sn–O and C–O. The XPS spectrum of Sn 3d (Figure 5d) shows two peaks attributed to Sn 3d5/2 and Sn 3d3/2. The first signal peak can be fitted into two peaks at 486.9 eV and 487.4 eV, which can be ascribed to Sn–O and Sn–F, respectively. The F 1s spectrum (Figure S3) exhibits only one major peak, which is assigned to F–Sn bond [14,35]. As shown in Figure 5f, the characteristic peaks of Cu 2p at 932.5 eV and 952.6 eV correspond to the binding energy of Cu 2p3/2 and Cu 2p1/2, respectively. The characteristic satellite peaks are not observed, suggesting that the high value state of Cu2+ is inexistence. Giving that the XPS spectra of Cu 2p is not able to distinguishing Cu+ or Cu0, Cu 2p Auger electron spectroscopy (AES) was carried out by XPS. As illustrated in Figure 5f, the only peak at 918.6 eV is assigned to Cu0 rather than Cu+, which is accordance with the result of the XRD analysis [15,25,27]. The abovementioned results show that the Cu2+ species are fully reduced to Cu0 rather than Cu+, which is consistent with the results of the XRD and Raman analysis.
2.2. Optical and Photoelectrochemical Properties
To investigate the optical property of pure SnO2, FTO, and Cu/FTO samples, UV-VIS diffuse reflectance spectra was carried out. As displayed in Figure S4a, pure SnO2 has a limited visible light absorption for itself because of its intrinsic band gap. However, after doping F ions, FTO exhibits strong absorption in the visible light range, which is beneficial for enhancing the H2 evolution under visible light irradiation.
The optical band gap of semiconductors was determined by the Tauc equation [36]:
where α is the absorption coefficient, hv is the photon energy, A and n are constant, Eg is the optical band energy. The value of n is 0.5 and 2 for the indirect and direct band gap, respectively [37]. The Eg was calculated by the intercept of the extrapolated linear part of the curve with the energy axis. As presented in Figure S4b, the value of n is 2 and the band gap values of pure SnO2 and FTO are 3.51 eV and 2.26 eV, respectively. As depicted in Figure 6, after the introduction of Cu, the absorption intensity of Cu/FTO samples is improved greatly in the visible light region. Furthermore, the 19.2% Cu/FTO sample exhibits the best absorption in the visible light region.
(αhv)n = A(hv − Eg)
To study the interaction between Cu NPs and FTO, we performed photoluminescence (PL) spectra and the results are presented in Figure 7. As displayed, all the samples of FTO and Cu/FTO exhibit a similar emission spectra shape with different intensities. The FTO shows the highest emission peak attributed to its higher recombination of the photogenerated electron-hole pairs. The emission intensity decreases with the introduction of Cu, indicating that the recombination of photogenerated electron-hole pairs is restrained in the Cu/FTO. This phenomenon could be due to the fast transfer of electrons from the FTO to the Cu and this could enhance the photocatalytic activity. Especially, the 19.2% Cu/FTO sample has the lowest emission intensity, suggesting that it may have the optimal content of Cu to inhibit carrier recombination, and this is consistent with the result of the photocatalytic H2 evolution experiment. Due to the lower charge’s recombination, more electrons will participate in photacatalytic reaction and, thus, enhance photocatalytic H2 evolution. However, when further increasing the content of Cu, the Cu/FTO samples exhibit an increase tendency in emission intensity. The reason may be that the introduction of excessive Cu results in serious agglomeration, which could inhibit the fast migration of electrons [11].
As we know, the photocurrent test of semiconductors can be used to evaluate the separation and transfer efficiency of photogenerated electron–hole pairs. Figure 8a shows the transient photocurrent response of FTO and Cu/FTO film electrodes for six on-off cycles under visible light irradiation. Upon light irradiation, the photocurrent response appears in all FTO and Cu/FTO samples, but when the light is turned off, the value of the photocurrent decreases quickly to zero, which is reproducible in the six on-off cycles. The Cu/FTO samples show higher photocurrent density than that of FTO, indicating that there is less carrier recombination and much faster transfer of charges due to the intense surface interaction between Cu and FTO. Moreover, the 19.2% Cu/FTO sample exhibits the highest photocurrent density and the value is about 4.5 times as high as that of bare FTO. All these results evidently indicate the separation efficiency and transfer of the photogenerated electron–hole pairs are enhanced significantly by the introduction of Cu.
In order to further investigate the charge transfer capability, the EIS (electrochemical impedance spectra) Nyquist plots of both FTO and Cu/FTO samples were obtained and presented in Figure 8b. Generally, the smaller the diameter is, the lower charge transfer resistance and the faster interface charge transfer are. Compared with FTO, the Cu/FTO samples show smaller diameter, indicating that the introduction of Cu can diminish the impedance. Furthermore, the 19.2% Cu/FTO sample shows the smallest diameter due to its lower impedance. This result is consistent with that received by the photocurrent analysis.
2.3. Photocatalytic Hydrogen Evolution
The photocatalytic hydrogen evolution of samples is evaluated under visible light irradiation with lactic acid as the sacrificial agent. There is no H2 evolution of all samples to be detected without light irradiation, suggesting that H2 evolution arises from photocatalytic reactions.
On one hand, when the content of Cu is 19.2%, we performed a series of photocatalytic H2 evolution experiments under visible light irradiation to determine the optimal content of F. Figure 9 shows photocatalytic H2 evolution rates of 19.2% Cu/SnO2 and 19.2% Cu/FTO with different Sn/F molar ratios under visible light irradiation. Compared with 19.2% Cu/SnO2, all the 19.2% Cu/FTO samples with different Sn/F molar ratios exhibit higher photocatalytic activity of H2 evolution. Moreover, when the Sn/F molar ratios is 10:5, the 19.2% Cu/FTO sample achieves the highest photocatalytic H2 evolution rate (11.22 μmol h−1), which could be ascribed to the appropriate band gap and fewer defect sites of FTO (Sn/F = 10:5) than other FTO samples [37].
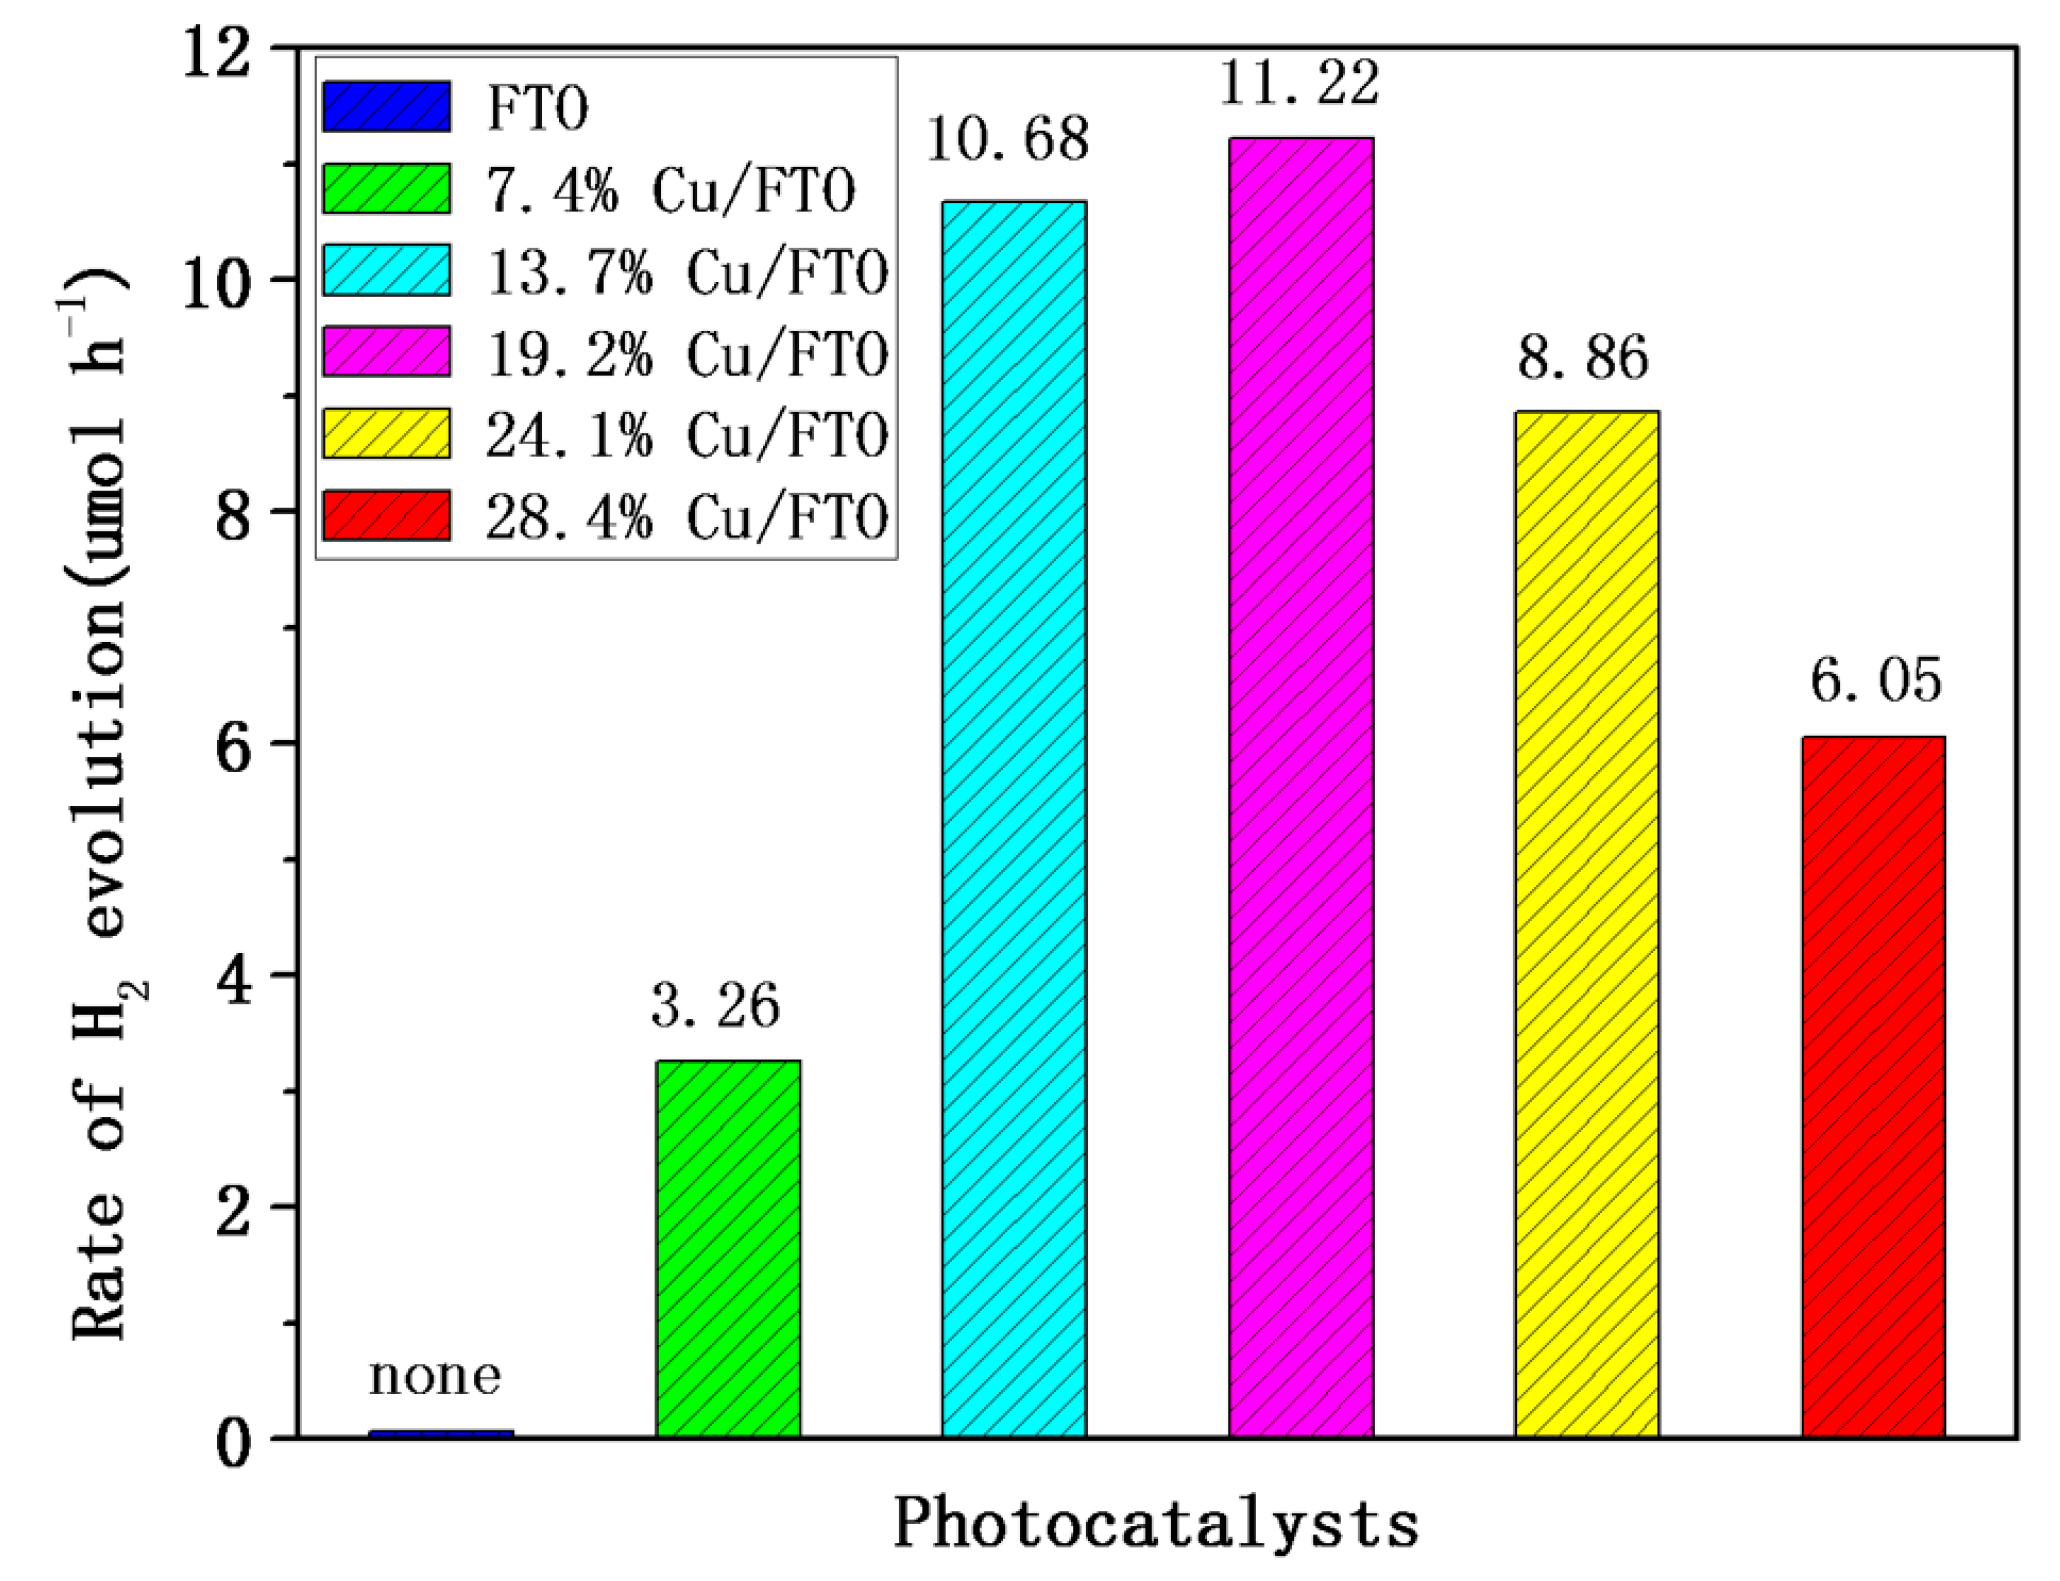
On the other hand, when the Sn/F molar ratio is 10:5, we performed a series of photocatalytic H2 evolution experiments under visible light irradiation to determine the optimal content of Cu in the Cu/FTO samples and the results were shown in Figure 10. The bare FTO sample does not show any photocatalytic activity of H2 evolution, which may be due to the fast recombination of photoinduced electron-hole pairs. However, after the introduction of Cu, the Cu/FTO samples exhibit excellent photocatalytic activity of H2 evolution. The H2 evolution rate of Cu/FTO samples increases with the content of Cu and the highest photocatalytic H2 evolution rate is up to 11.22 μmol·h−1 when the content of Cu is 19.2 wt % for FTO. However, when the content of Cu reach 19.2%, the H2 evolution rate of Cu/FTO decreases with further increasing content of Cu. The results suggest the appropriate content of Cu can enhance photocatalytic activity because of the high absorption of light and the faster transfer of electrons. However, the introduction of excessive Cu may aggregate together and become new recombination centers of photogenerated electron-hole pairs, which could inhibit the photocatalytic activity of H2 evolution [38]. This result is consistent with the result of the PL spectra (Figure 7).
Considering practical applications, the representative 19.2% Cu/FTO sample was selected to investigate the recycling and stability of Cu/FTO samples. As shown in Figure 11, the recycling photocatalytic test was carried out for six runs under the same condition. The photocatalytic H2 evolution of the sample is steady for six repeated runs under visible light irradiation, suggesting that the as-prepared Cu/FTO samples have excellent stability and repeatability. Furthermore, no obvious change of XRD patterns (Figure S5) before and after the stability test is observed, indicating the photocatalysts have good stability during photocatalytic H2 evolution [34].
2.4. Mechanism
On the basis of all the above results and discussions, the proposed schematic mechanism of photocatalytic H2 evolution of Cu/FTO photocatalyst is illustrated in Figure 12. Upon visible light irradiation, the electrons (e−) of the valence band (VB) can be excited to the conduction band (CB) and the holes (h+) remain in the valence band (VB). Due to the fast recombination of photogenerated electron-hole pairs, the photocatalytic activity of naked FTO is very low. However, after the introduction of Cu NPs, the recombination of photogenerated electron-hole pairs is greatly inhibited. Due to the existence of trapping centers (Cu NPs), the electrons (e−) from the conduction band (CB) are tend to transfer quickly to Cu NPs and then react with H+ for H2 more easily. Meanwhile, the holes (h+) are consumed by the sacrificial reagents (lactic acid). Thereby, the as-prepared Cu/FTO photocatalyst is beneficial for photocatalytic H2 evolution.
3. Materials and Methods
3.1. Materials
All the chemical reagents and solvents were analytical grade and used without further purification. Deionized water was supplied by a Millipore Milli-Q system (Millipore, Suzhou, China). Copper acetate hydrate (Cu(CH3COO)2·H2O, ≥99.0%), tin chloride dehydrate (SnCl2·2H2O, ≥98.0%), hydrofluoric acid (HF, ≥40%), ammonium hydroxide (NH3.H2O, ≥25%), lactic acid (C3H6O3, ≥97.0%) and glucose (C6H12O6, ≥98.0%) were purchased from Sinopharm Chemical Reagent Co. Ltd. (Dalian, China).
3.2. Synthesis of FTO Nanopowders
A typical synthesis process is as following. Firstly, 15 g of tin chloride dehydrate (SnCl2·2H2O) was dissolved in 10 mL of deionized water and then ammonium hydroxide (NH3·H2O) was added dropwise into the solution under vigorous stirring until the pH value of the solution was up to 7. The solution was centrifuged at 9000 rpm to obtain the precipitation and the precipitation was washed three times with deionized water. Secondly, a certain amount of hydrofluoric acid (HF) was slowly dropped into the precipitation under vigorous stirring and obtained the sol mixture. Then the sol mixture was dried in a drying oven at 200 °C for 4 h and the gel mixture obtained. Finally, the gel mixture was calcined at 450 °C for 2 h under air in a muffle furnace and subsequently ground into fine nanopowders. Similarly, The FTO nanopowders with different Sn/F molar ratios (10:0, 10:1, 10:3, 10:5, 10:7, 10:9) were synthesized by following the same method. The Sn/F molar ratios (10:0, 10:1, 10:3, 10:5, 10:7, 10:9) are theoretical values calculated by the precursor ratios. If there is no special instructions in the paper, the Sn/F molar ratio of FTO is 10:5.
3.3. Synthesis of Cu/FTO Nanocomposites
In a typical synthesis process, 10 mL of deionized water, 15 mL of copper acetate (0.2 M Cu(CH3COO)2), 1.2 g of glucose (C6H12O6) and 800 mg of FTO nanopowders were mixed together to form a homogeneous suspension by sonicating for 30 min. Then the suspension was transferred to a Teflon-lined autoclave (SX2-12-10Q, Suzhou Jiangdong Precision Instrument Co. Ltd., Shanghai, China) and heated at 120 °C for 12 h. Finally, the resulting solution was centrifuged to obtain the solid product. The solid product was washed three times by deionized water and ethanol, respectively. The obtained product was dried in a vacuum drying oven at 50 °C for 5 h. The Cu/FTO nanocomposites with different contents of Cu (0%, 7.4%, 13.7%, 19.2%, 24.1%, 28.4%) were prepared by following the same method. Cu wt % (0%, 7.4%, 13.7%, 19.2%, 24.1%, 28.4%) is the theoretical value calculated by the precursor ratios.
3.4. Characterization
The crystalline structure of the samples was characterized by using D8 Advantage X-ray diffraction (XRD, Bruker, Beijing, China) with Cu Kα radiation. Fourier transform infrared spectroscopy (FTIR) was recorded in the wave number range from 400 cm−1 to 4000 cm−1 by a FTIR spectrometer (Nicolet 670, Bruker, Beijing, China). The morphology of the samples was characterized by scanning electron microscopy (Merlin, Zeiss, Beijing, China). Transmission electron microscopy (TEM) test was conducted by an electron microscope (JEOL, JEM-2100, Bruker, Beijing, China) equipped with energy dispersive X-ray (EDX) spectrometer. X-ray photoelectron spectroscopy (XPS) was recorded on a Kratos Axis-Ultra DLD (Axis Ultra DLD, Bruker, Beijing, China). UV-VIS diffuse reflectance absorption spectra were obtained by a Hitachi U-3010 spectrophotometer (Shimadzu, Beijing, China). The photoluminescence spectra (PL) was conducted on a Hitachi F-4500 fluorescence spectrophotometer (Shimadzu, Beijing, China). Raman spectra were obtained by Laser Confocal Raman Microscopy system (LabRAM Aramis, H.J.Y, Beijing, China). The photocurrents and electrochemical impedance spectra (EIS) were recorded on an electrochemical workstation (CHI660C, CH Instruments, Inc., Beijing, China).
3.5. Photocatalytic Hydrogen Evolution Experiment
The photocatalytic experiment was performed by using a Xe lamp with an ultraviolet cut-off filter (PLS-SXE300CUV, Perfect light Co. Ltd., Beijing, China) (λ > 420 nm) as a light source in a quartz reaction cell, which was connected to a closed gas circulation. Based on our previous research, the as-synthesized photocatalyst (50 mg), lactic acid (10 mL), and water (60 mL) were mixed together by constant magnetic stirring (85-2, Gongyi yuhua Instrument Co. Ltd., Zhengzhou, China) to form a homogeneous suspension. The solution was evacuated with N2 before every photocatalytic reaction. The evolved H2 under irradiation was analyzed by online gas chromatography (GC-7900, Tianmei Co. Ltd., Beijing, China) with a thermal conductivity detector (TCD).
3.6. Photoelectrochemical Measurements
Electrochemical measurements were performed by using an electrochemical workstation (CHI660C Instruments, Shanghai, China). FTO and Cu/FTO electrodes served as the working electrode, platinum wire was used as the counter electrode, and Ag/AgCl as the reference electrode. The 0.5 M Na2SO4 aqueous solution served as the electrolyte and a 300 W Xe lamp was used as the light source. The working electrode was prepared as follows: 0.1 g of as-synthesized catalyst was dispersed in 1 mL of ethanol solution by sonication to get slurry. Then the slurry was spread onto the cleaned ITO glass and the as-prepared electrolyte was dried at 323 K for 4 h under vacuum.
4. Conclusions
In summary, we prepared a series of FTO nanopowders with different Sn/F molar ratios by a typical sol-gel method and then they were modified with different contents of Cu via a facile hydrothermal method. Compared with pure SnO2, the fluorine-doped tin oxide (FTO) exhibits stronger absorption in the visible light range, but it does not show any photocatalytic activity for H2 evolution because of the fast recombination of photogenerated electron-hole pairs. However, after the introduction of Cu, the Cu/FTO nanocomposites show excellent photocatalytic activity for H2 evolution. When the loading content of Cu is 19.2 wt % for FTO, the highest H2 evolution rate is up to 11.22 μmol h−1 under visible light irradiation. The photocatalysts exhibit excellent stability and repeatability for H2 evolution. Moreover, the introduction of Cu could greatly promote the separation and transfer efficiency of the photogenerated electron-hole pairs and, thus, can enhance photocatalytic H2 evolution. This work provides an insight for developing effective photocatalysts, which could be used for the conversion of solar energy to new energy sources.
Supplementary Materials
The following are available online at www.mdpi.com/2073-4344/7/12/385/s1, Figure S1. Raman spectra of FTO and 19.2% Cu/FTO. Figure S2. TEM (a) and HRTEM (b) of as-prepared 19.2% Cu/FTO sample. Figure S3. F 1s spectra of 19.2% Cu/FTO with XPS characterization. Figure S4. UV-VIS diffuse reflectance spectra (a) and optical band gap spectra (b) of pure SnO2 and FTO. Figure S5. XRD patterns of 19.2% Cu/FTO before and after the stability test of hydrogen evolution.
Acknowledgments
We gratefully acknowledge financial support from the National Natural Science Foundation of China (Nos. 21571064, 21371060) and the Fundamental Research Funds for the Central Universities (No. 2015ZM162).
Author Contributions
Heping Zeng and Hui Liu conceived and designed the experiments; Hui Liu performed the experiments; Hui Liu, An Wang, Quan Sun and Tingting Wang analyzed the data; Hui Liu wrote the paper.
Conflicts of Interest
The authors declare no conflict of interest.
References
- Wang, Y.; Wang, Q.; Zhan, X.; Wang, F.; Safdar, M.; He, J. Visible light driven type II heterostructures and their enhanced photocatalysis properties: A review. Nanoscale 2013, 5, 8326–8339. [Google Scholar] [CrossRef] [PubMed]
- Jafari, T.; Moharreri, E.; Amin, A.; Miao, R.; Song, W.Q.; Suib, S. Photocatalytic Water Splitting—The Untamed Dream: A Review of Recent Advances. Molecules 2016, 21, 900. [Google Scholar] [CrossRef] [PubMed]
- Huo, J.P.; Zeng, H.P. A novel triphenylamine functionalized bithiazole–metal complex with C60 for photocatalytic hydrogen production under visible light irradiation. J. Mater. Chem. A 2015, 3, 6258–6264. [Google Scholar] [CrossRef]
- Fujishima, A.; Honda, K. Photolysis-decomposition of water at the surface of an irradiated semiconductor. Nature 1972, 238, 37–38. [Google Scholar] [CrossRef] [PubMed]
- Huo, J.P.; Fang, L.T.; Lei, Y.L.; Zeng, G.C.; Zeng, H.P. Facile preparation of yttrium and aluminum co-doped ZnO via a sol–gel route for photocatalytic hydrogen production. J. Mater. Chem. A 2014, 2, 11040–11044. [Google Scholar] [CrossRef]
- Qin, J.Y.; Huo, J.P.; Zhang, P.Y.; Zeng, J.; Wang, T.T.; Zeng, H.P. Improving the photocatalytic hydrogen production of Ag/g-C3N4 nanocomposites by dye-sensitization under visible light irradiation. Nanoscale 2016, 8, 2249–2259. [Google Scholar] [CrossRef] [PubMed]
- Chen, Z.W.; Pan, D.Y.; Li, Z.; Jiao, Z.; Wu, M.H.; Shek, C.; Wu, C.M.L.; Lai, J.K.L. Recent Advances in Tin Dioxide Materials: Some Developments in Thin Films, Nanowires, and Nanorods. Chem. Rev. 2014, 114, 7442–7486. [Google Scholar] [CrossRef] [PubMed]
- Khan, M.M.; Ansari, S.A.; Khan, M.E.; Ansari, M.O.; Min, B.K. Visible light-induced enhanced photoelectrochemical and photocatalytic studies of gold decorated SnO2 nanostructures. New J. Chem. 2015, 39, 2758–2766. [Google Scholar] [CrossRef]
- Babu, B.; Kadam, A.N.; Ravikumar, R.; Chan, B. Enhanced visible light photocatalytic activity of Cu-doped SnO2 quantum dots by solution combustion synthesis. J. Alloys Compd. 2017, 703, 330–336. [Google Scholar] [CrossRef]
- Ghimbeu, C.M.; Lumbreras, M.; Siadat, M.; van Landschoot, R.C.; Schoonman, J. Electrostatic sprayed SnO2 and Cu-doped SnO2 films for H2S detection. Sens. Actuators B Chem. 2008, 133, 694–698. [Google Scholar] [CrossRef]
- Chandra, S.; George, G.; Ravichandran, K.; Thirumurugan, K. Influence of simultaneous cationic (Mn) and anionic (F) doping on the magnetic and certain other properties of SnO2 thin films. Surf. Interface 2017, 7, 39–46. [Google Scholar] [CrossRef]
- Seema, H.; Christian, K.K.; Chandra, V.; Kim, K.S. Graphene-SnO2 composites for highly efficient photocatalytic degradation of methylene blue under sunlight. Nanotechnology 2012, 23, 355705. [Google Scholar] [CrossRef] [PubMed]
- Kent, C.A.; Concepcion, J.J.; Dares, C.J.; Torelli, D.A.; Rieth, A.J.; Miller, A.S.; Meyer, T.J. Water Oxidation and Oxygen Monitoring by Cobalt-Modified Fluorine-Doped Tin Oxide Electrodes. J. Am. Chem. Soc. 2013, 135, 8432–8435. [Google Scholar] [CrossRef] [PubMed]
- Samad, W.Z.; Goto, M.; Kanda, H.; Nordin, N.; Liew, K.H.; Yarmo, M.A.; Yusop, M.R. Fluorine-doped tin oxide catalyst for glycerol conversion to methanol in sub-critical water. J. Supercrit. Fluids 2017, 120, 366–378. [Google Scholar] [CrossRef]
- Zhang, P.Y.; Song, T.; Wang, T.T.; Zeng, H.P. In-situ synthesis of Cu nanoparticles hybridized with carbon quantum dots as a broad spectrum photocatalyst for improvement of photocatalytic H2 evolution. Appl. Catal. B Environ. 2017, 206, 328–335. [Google Scholar] [CrossRef]
- He, W.; Kim, H.K.; Wamer, W.G.; Melka, D.; Callahan, J.H. Photogenerated Charge Carriers and Reactive Oxygen Species in ZnO/Au Hybrid Nanostructures with Enhanced Photocatalytic and Antibacterial Activity. J. Am. Chem. Soc. 2014, 136, 750–757. [Google Scholar] [CrossRef] [PubMed]
- Logar, M.; Jancar, B.; Sturm, S.; Suvorov, D. Weak polyion multilayer-assisted in situ synthesis as a route toward a plasmonic Ag/TiO2 photocatalyst. Langmuir 2010, 26, 12215–12224. [Google Scholar] [CrossRef] [PubMed]
- Shiraishi, Y.; Kofuji, Y.; Kanazawa, S.; Sakamoto, H.; Ichikawa, S.; Tanaka, S.; Hirai, T. Platinum nanoparticles strongly associated with graphitic carbon nitride as efficient co-catalysts for photocatalytic hydrogen evolution under visible light. Chem. Commun. 2014, 50, 15255–15258. [Google Scholar] [CrossRef] [PubMed]
- Zou, Y.L.; Kang, S.; Li, X.Q.; Qin, L.X.; Mu, J. TiO2 nanosheets loaded with Cu: A low-cost efficient photocatalytic system for hydrogen evolution from water. Int. J. Hydrog. Energy 2014, 39, 15403–15410. [Google Scholar] [CrossRef]
- Han, C.; Yang, M.Q.; Zhang, N.; Xu, Y.J. Enhancing the visible light photocatalytic performance of ternary CdS–(graphene–Pd) nanocomposites via a facile interfacial mediator and co-catalyst strategy. J. Mater. Chem. A 2014, 2, 19156–19166. [Google Scholar] [CrossRef]
- Liu, E.Z.; Qi, L.L.; Bian, J.J.; Chen, Y.H.; Hu, X.Y.; Fan, J.; Liu, H.C.; Zhu, C.J.; Wang, Q.P. A facile strategy to fabricate plasmonic Cu modified TiO2 nano-flower films for photocatalytic reduction of CO2 to methanol. Mater. Res. Bull. 2015, 68, 203–209. [Google Scholar] [CrossRef]
- Huo, J.P.; Zeng, H.P. Copper nanoparticles embedded in the triphenylamine functionalized bithiazole–metal complex as active photocatalysts for visible light-driven hydrogen evolution. J. Mater. Chem. A 2015, 3, 17201–17208. [Google Scholar] [CrossRef]
- Yang, Y.; Xu, D.; Wu, Q.Y.; Diao, P. Cu2O/CuO Bilayered Composite as a High-Efficiency Photocathode for Photoelectrochemical Hydrogen Evolution Reaction. Sci. Rep. 2016, 6, 35158. [Google Scholar] [CrossRef] [PubMed]
- Liu, X.; Cui, S.S.; Sun, Z.J.; Du, P.W. Copper oxide nanomaterials synthesized from simple copper salts as active catalysts for electrocatalytic water oxidation. Electrochim. Acta 2015, 160, 202–208. [Google Scholar] [CrossRef]
- Zhang, P.Y.; Wang, T.T.; Zeng, H.P. Design of Cu-Cu2O/g-C3N4 nanocomponent photocatalysts for hydrogen evolution under visible light irradiation using water-soluble Erythrosin B dye sensitization. Appl. Surf. Sci. 2017, 391, 404–414. [Google Scholar] [CrossRef]
- Liu, H.Y.; Wang, T.T.; Zeng, H.P. CuNPs for Efficient Photocatalytic Hydrogen Evolution. Part. Part. Syst. Charact. 2015, 32, 869–873. [Google Scholar] [CrossRef]
- Zheng, L.R.; Zheng, Y.H.; Chen, C.Q.; Zhan, Y.Y.; Lin, X.Y.; Zheng, Q.; Wei, K.M.; Zhu, J.F. Network Structured SnO2/ZnO Heterojunction Nanocatalyst with High Photocatalytic Activity. Inorg. Chem. 2009, 48, 1819–1825. [Google Scholar] [CrossRef] [PubMed]
- Zhu, S.J.; Meng, Q.N.; Wang, L.; Zhang, J.H.; Song, Y.B.; Jin, H.; Zhang, K.; Sun, H.C.; Wang, H.Y.; Yang, B. Highly Photoluminescent Carbon Dots for Multicolor Patterning, Sensors, and Bioimaging. Angew. Chem. Int. Ed. 2013, 52, 3953–3957. [Google Scholar] [CrossRef] [PubMed]
- Zhang, B.; Tian, Y.; Zhang, J.X.; Cai, W. The characterization of fluorine doped tin oxide films by Fourier Transformation Infrared spectrum. Appl. Phys. Lett. 2011, 98, 021906. [Google Scholar] [CrossRef]
- Noor, N.; Parkin, I.P. Enhanced transparent-conducting fluorine-doped tin oxide films formed by Aerosol-Assisted Chemical Vapour Deposition. J. Mater. Chem. C 2013, 1, 984–996. [Google Scholar] [CrossRef]
- Liu, E.; Kang, L.; Yang, Y.; Sun, T.; Hu, X. Plasmonic Ag deposited TiO2 nano-sheet film for enhanced photocatalytic hydrogen production by water splitting. Nanotechnology 2014, 25, 165401–165410. [Google Scholar] [CrossRef] [PubMed]
- Deng, Y.L.; Handoko, A.D.; Do, Y.H.; Xi, S.B.; Yeo, B.S. In Situ Raman Spectroscopy of Copper and Copper Oxide Surfaces during Electrochemical Oxygen Evolution Reaction: Identification of CuIII Oxides as Catalytically Active Species. ACS Catal. 2016, 6, 2473–2481. [Google Scholar] [CrossRef]
- Chen, X.; Zhou, B.; Yang, S.; Wu, H.; Wu, Y. In situ construction of an SnO2/g-C3N4 heterojunction for enhanced visible-light photocatalytic activity. RSC Adv. 2015, 5, 68953–68963. [Google Scholar] [CrossRef]
- Song, T.; Huo, J.P.; Liao, T.; Zeng, J.; Qin, J.Y.; Zeng, H.P. Fullerene [C60] modified Cr2−xFexO3 nanocomposites for enhanced photocatalytic activity under visible light irradiation. Chem. Eng. J. 2016, 287, 359–366. [Google Scholar] [CrossRef]
- Wu, S.S.; Yuan, S.; Shi, L.Y.; Zhao, Y.; Fang, J.H. Preparation, characterization and electrical properties of fluorine-doped tin dioxide nanocrystals. J. Colloid Interface Sci. 2010, 346, 12–16. [Google Scholar] [CrossRef] [PubMed]
- Chu, D.M.; Zhang, C.Y.; Yang, P.; Du, Y.K.; Lu, C. WS2 as an Effective Noble-Metal Free Cocatalyst Modified TiSi2 for Enhanced Photocatalytic Hydrogen Evolution under Visible Light Irradiation. Catalysts 2016, 6, 136. [Google Scholar] [CrossRef]
- Yu, J.C.; Yu, J.G.; Ho, W.K.; Jiang, Z.T.; Zhang, L.Z. Effects of F− Doping on the Photocatalytic Activity and Microstructures of Nanocrystalline TiO2 Powders. Chem. Mater. 2002, 14, 3808–3816. [Google Scholar] [CrossRef]
- Chao, Y.G.; Zheng, J.F.; Chen, J.Z.; Wang, Z.J.; Jia, S.P.; Zhang, H.X.; Zhu, Z.P. Highly efficient visible light-driven hydrogen production of precious metal-free hybrid photocatalyst: CdS@NiMoS core–shell nanorods. Catal. Sci. Technol. 2017, 7, 2798–2804. [Google Scholar] [CrossRef]
Figure 1.
XRD (X-ray diffraction) patterns of pure SnO2, FTO (Fluorine-doped tin oxide), and Cu/FTO samples with different contents of Cu.
Figure 1.
XRD (X-ray diffraction) patterns of pure SnO2, FTO (Fluorine-doped tin oxide), and Cu/FTO samples with different contents of Cu.
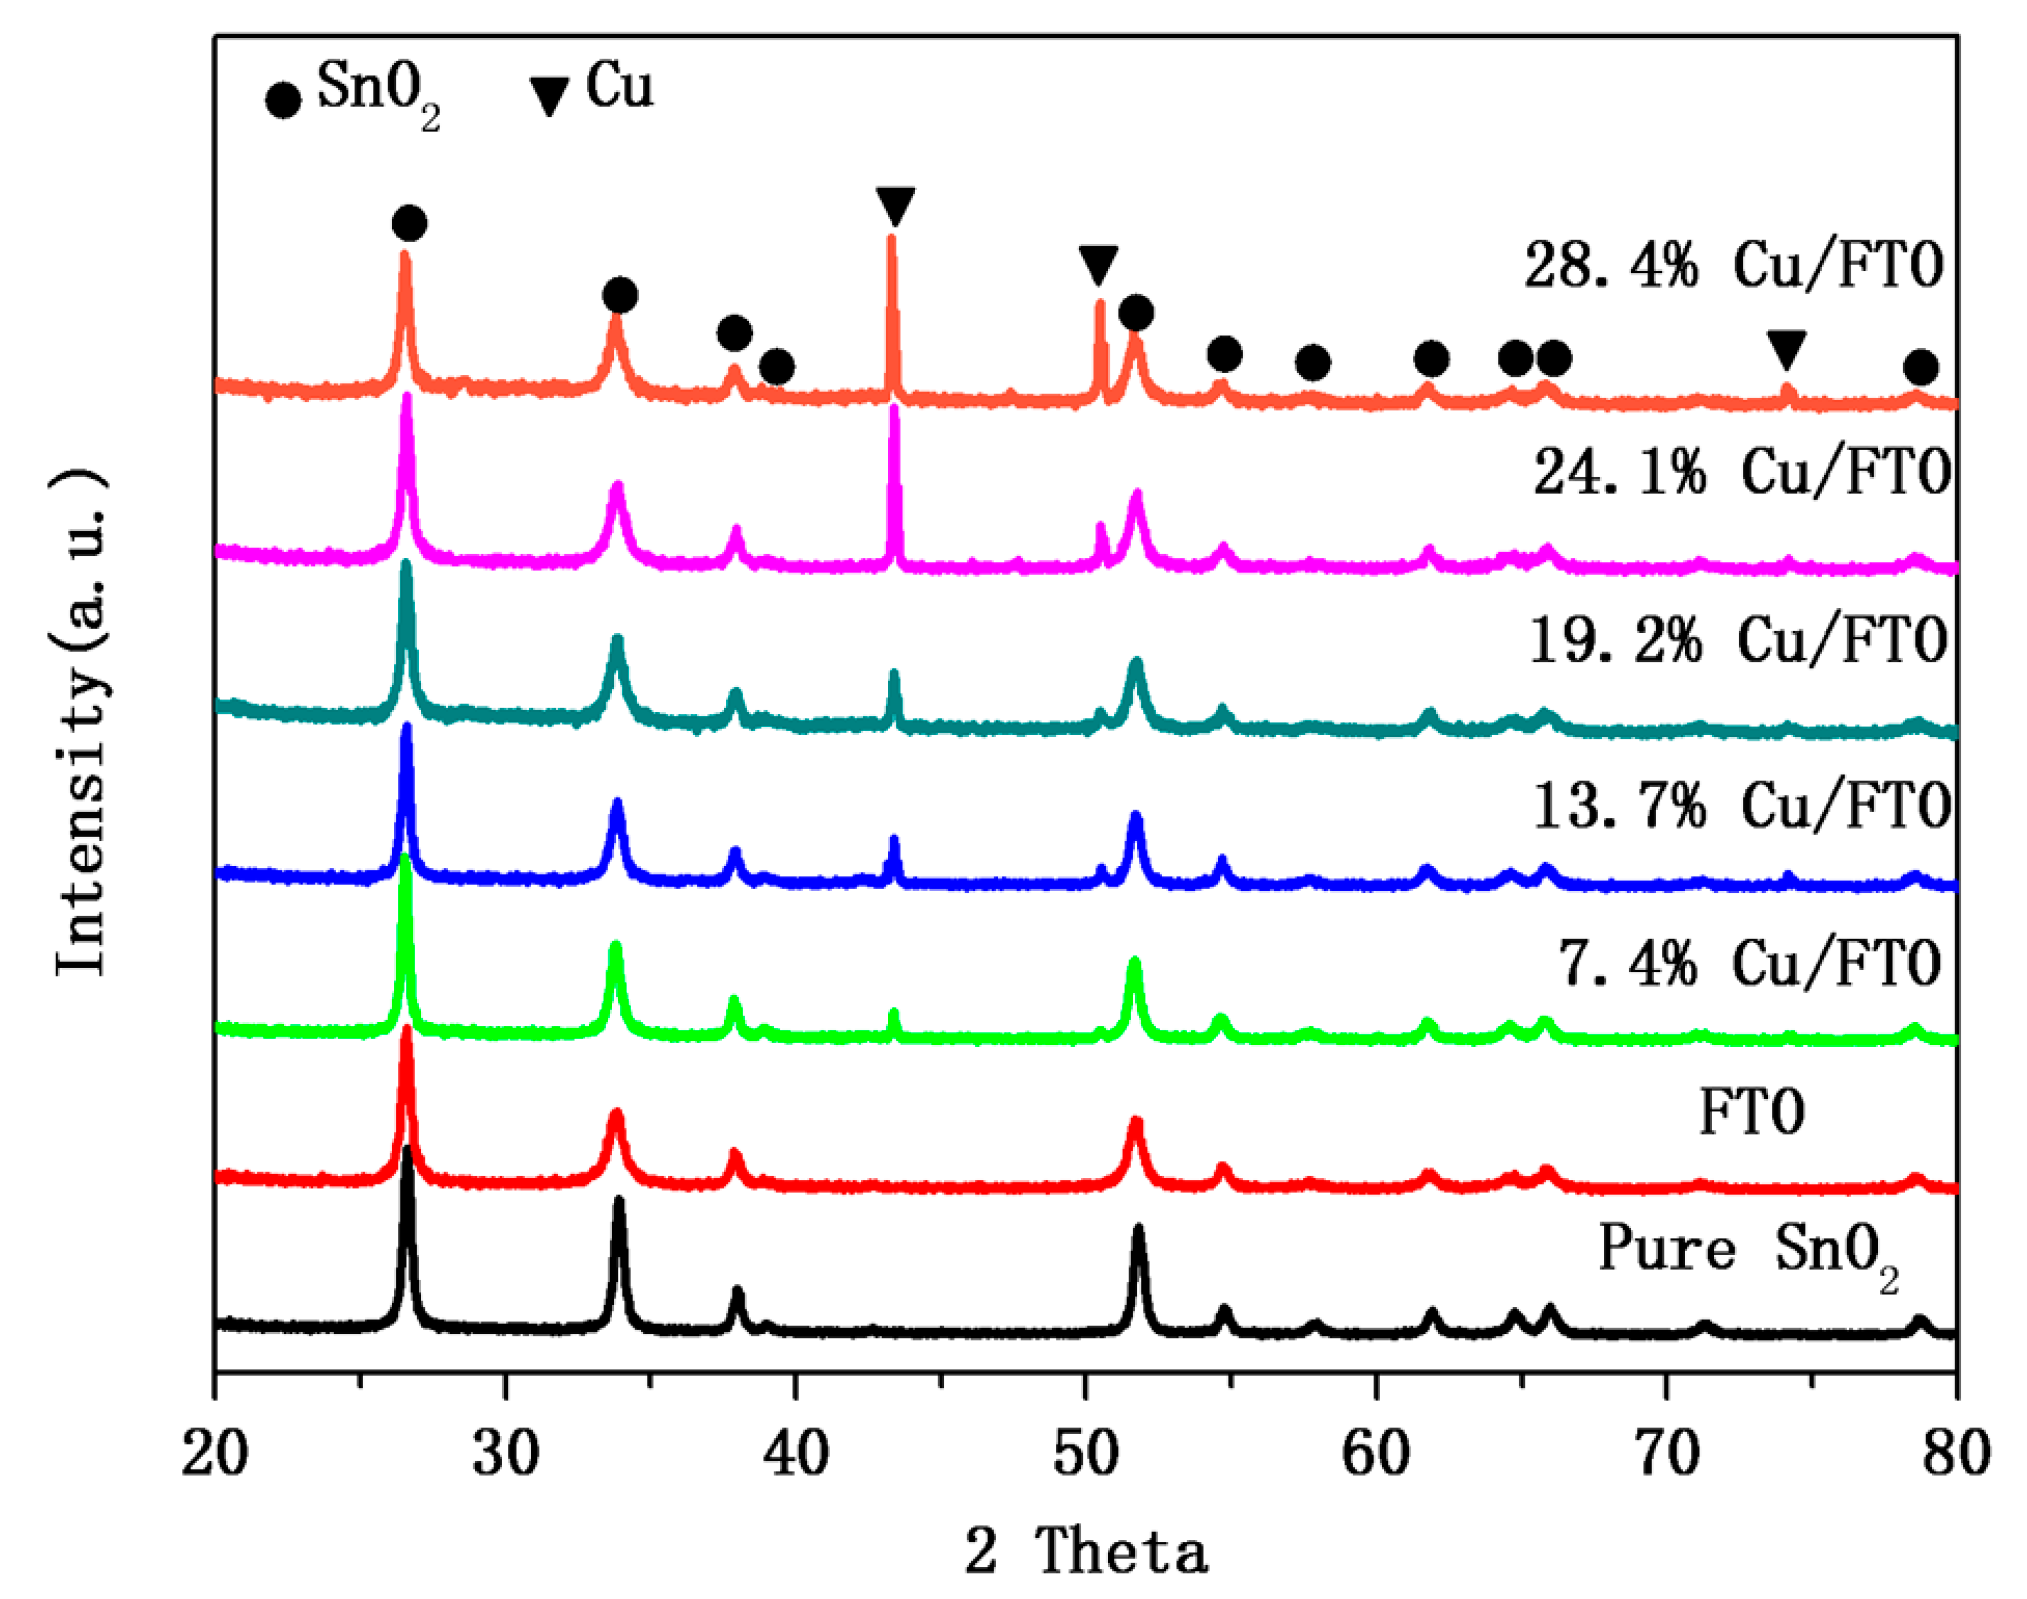
Figure 2.
FTIR (Fourier transform infrared spectroscopy) spectra of pure SnO2, FTO, and Cu/FTO samples.
Figure 2.
FTIR (Fourier transform infrared spectroscopy) spectra of pure SnO2, FTO, and Cu/FTO samples.
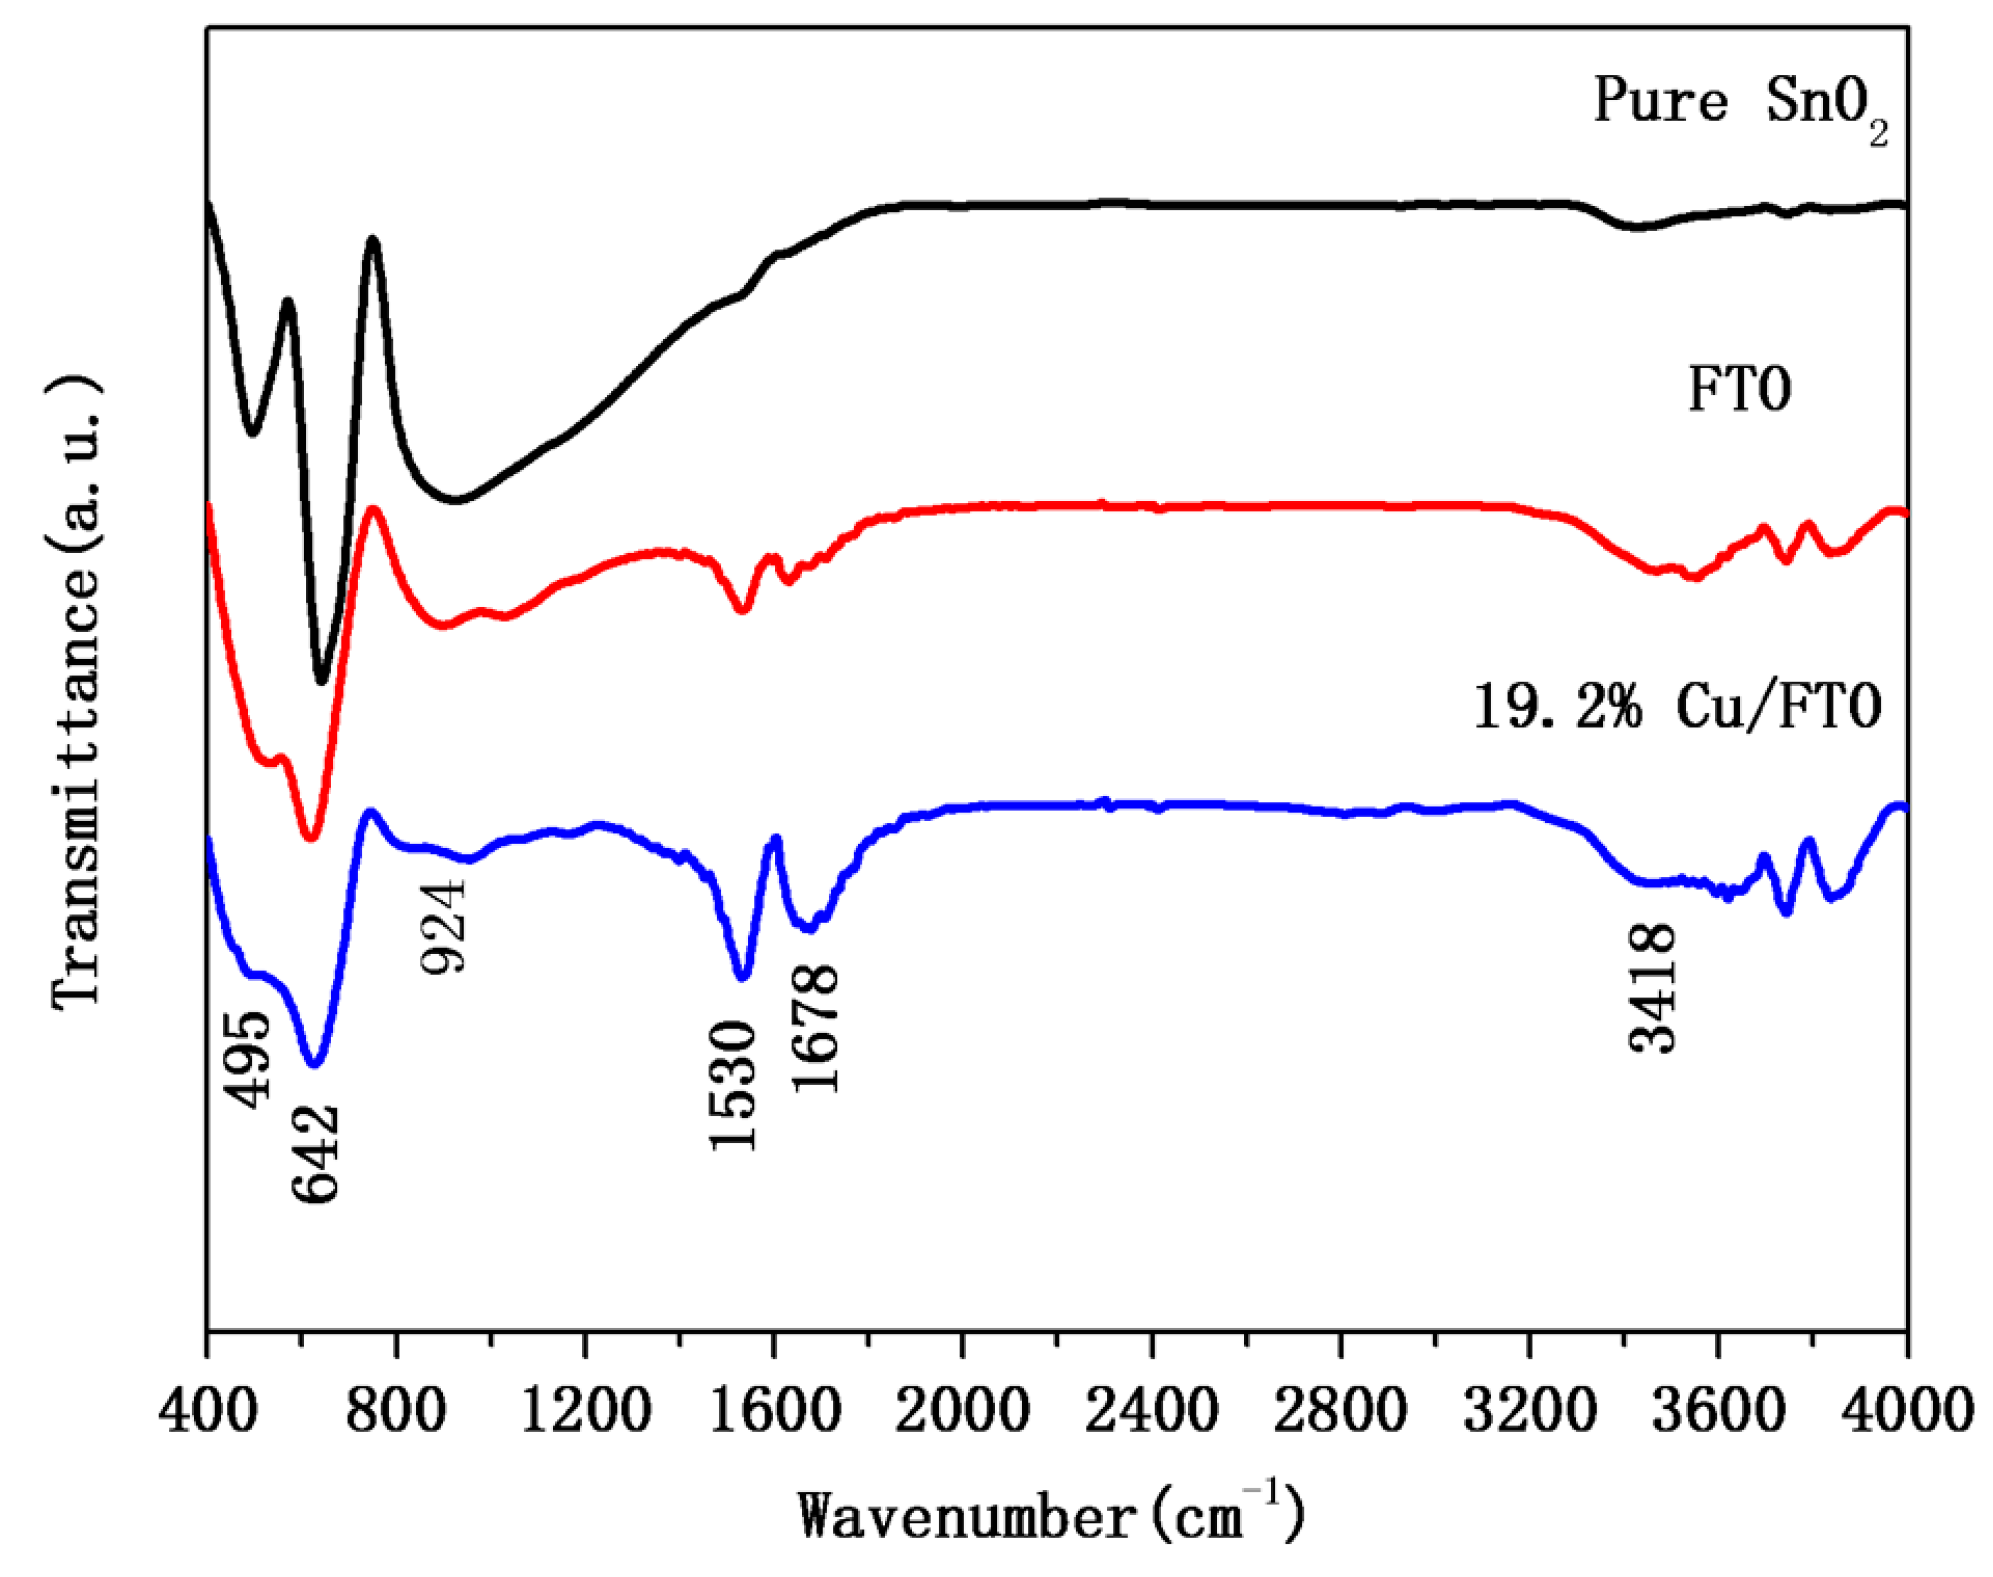
Figure 3.
Raman spectra of pure SnO2, FTO and Cu/FTO samples.
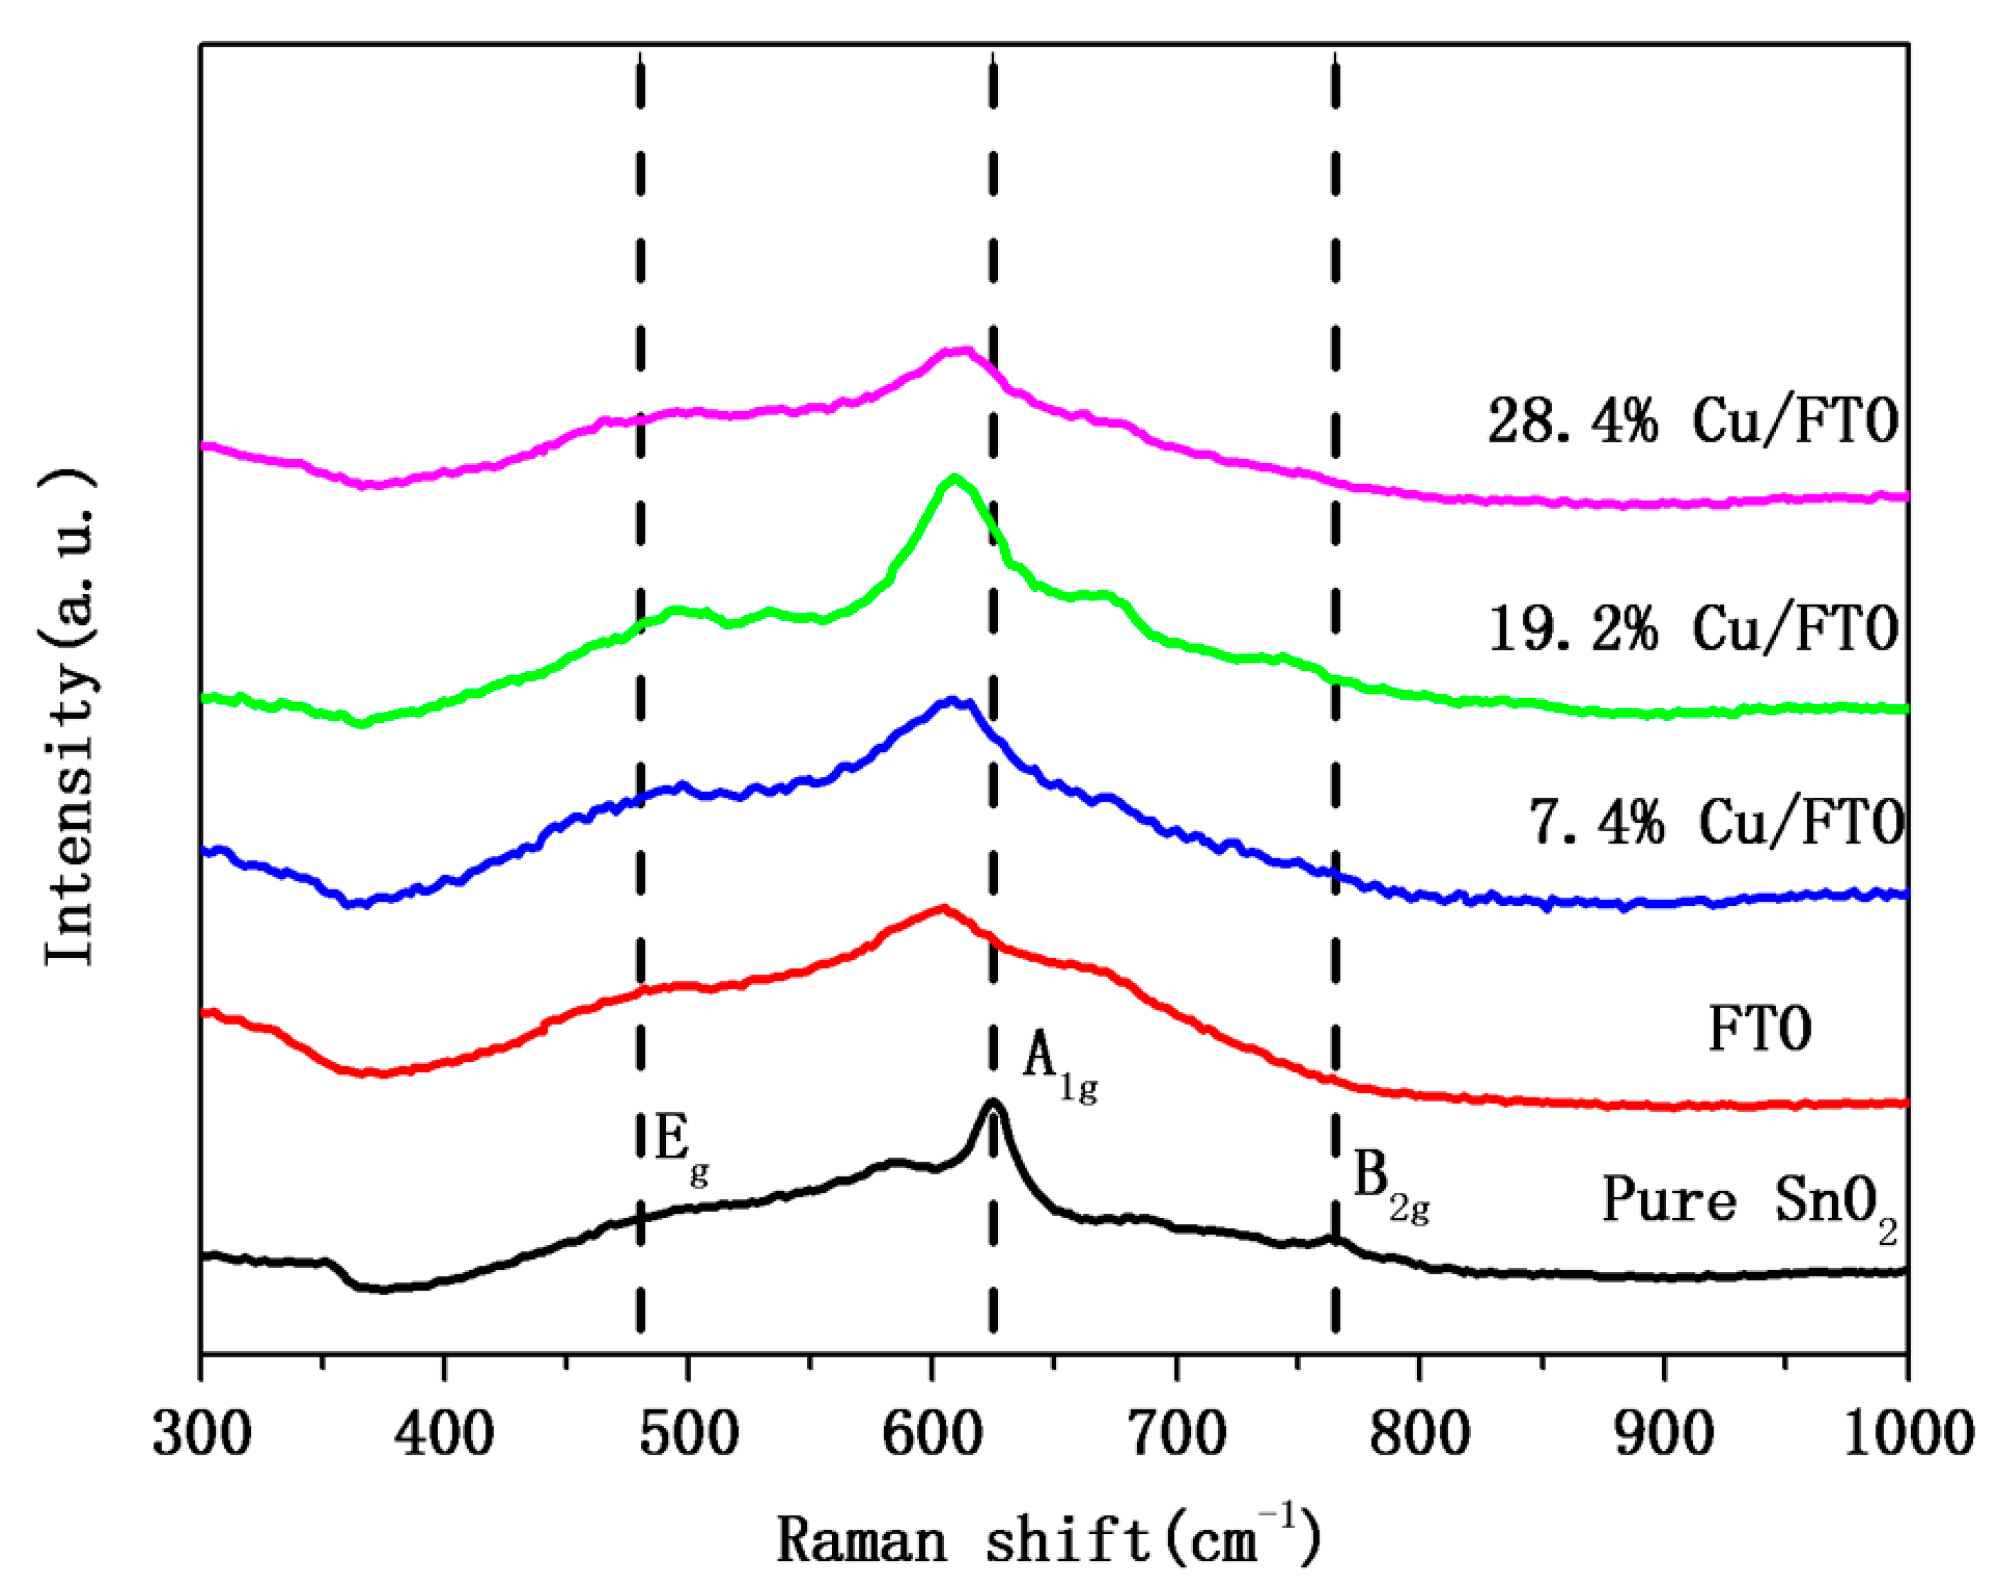
Figure 4.
SEM (scanning electron microscopy) images (a) FTO; (b) 7.4% Cu/FTO; (c,d) 19.2% Cu/FTO; (e) 28.4% Cu/FTO; EDX (energy dispersive X-ray) spectrum (f); and elemental mapping patterns (g) of the 19.2% Cu/FTO sample.
Figure 4.
SEM (scanning electron microscopy) images (a) FTO; (b) 7.4% Cu/FTO; (c,d) 19.2% Cu/FTO; (e) 28.4% Cu/FTO; EDX (energy dispersive X-ray) spectrum (f); and elemental mapping patterns (g) of the 19.2% Cu/FTO sample.
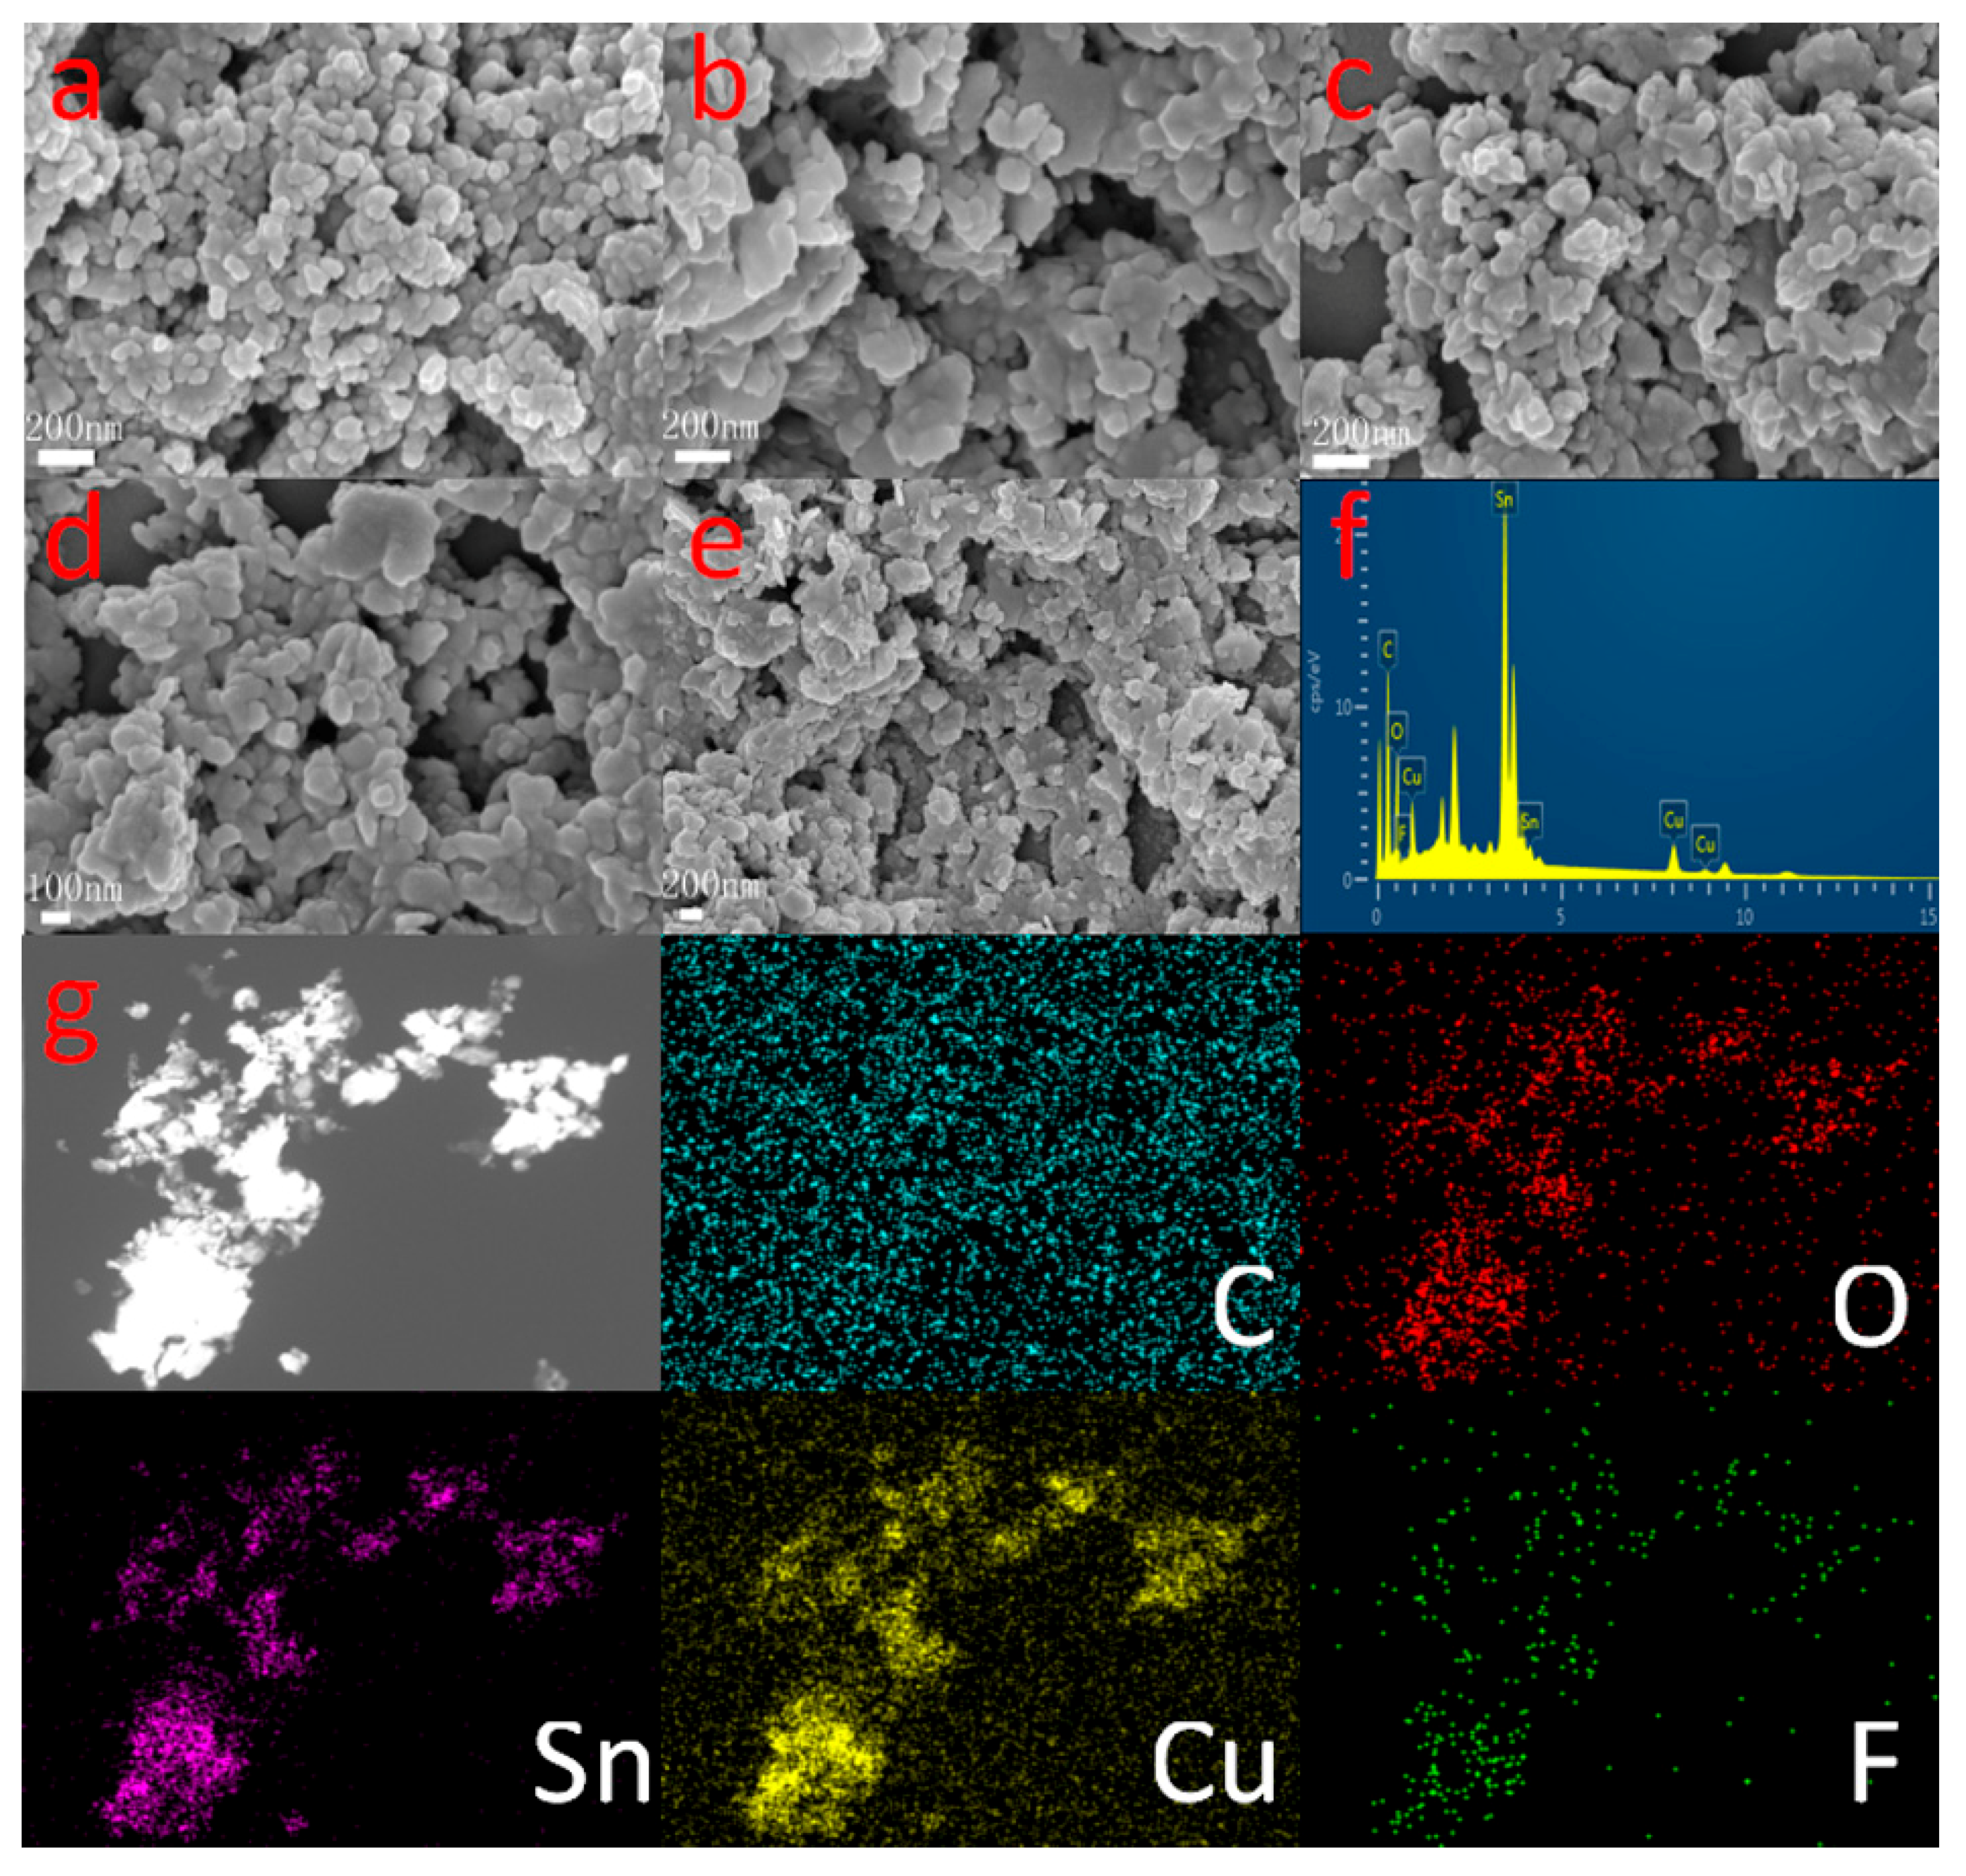
Figure 5.
XPS (X-ray photoelectron spectroscopy) spectra of 19.2% Cu/FTO sample. (a) Survey spectra; (b) C 1s; (c) O 1s; (d) Sn 3d; (e) Cu 2p; and (f) Cu 2p AES (Auger electron spectroscopy).
Figure 5.
XPS (X-ray photoelectron spectroscopy) spectra of 19.2% Cu/FTO sample. (a) Survey spectra; (b) C 1s; (c) O 1s; (d) Sn 3d; (e) Cu 2p; and (f) Cu 2p AES (Auger electron spectroscopy).
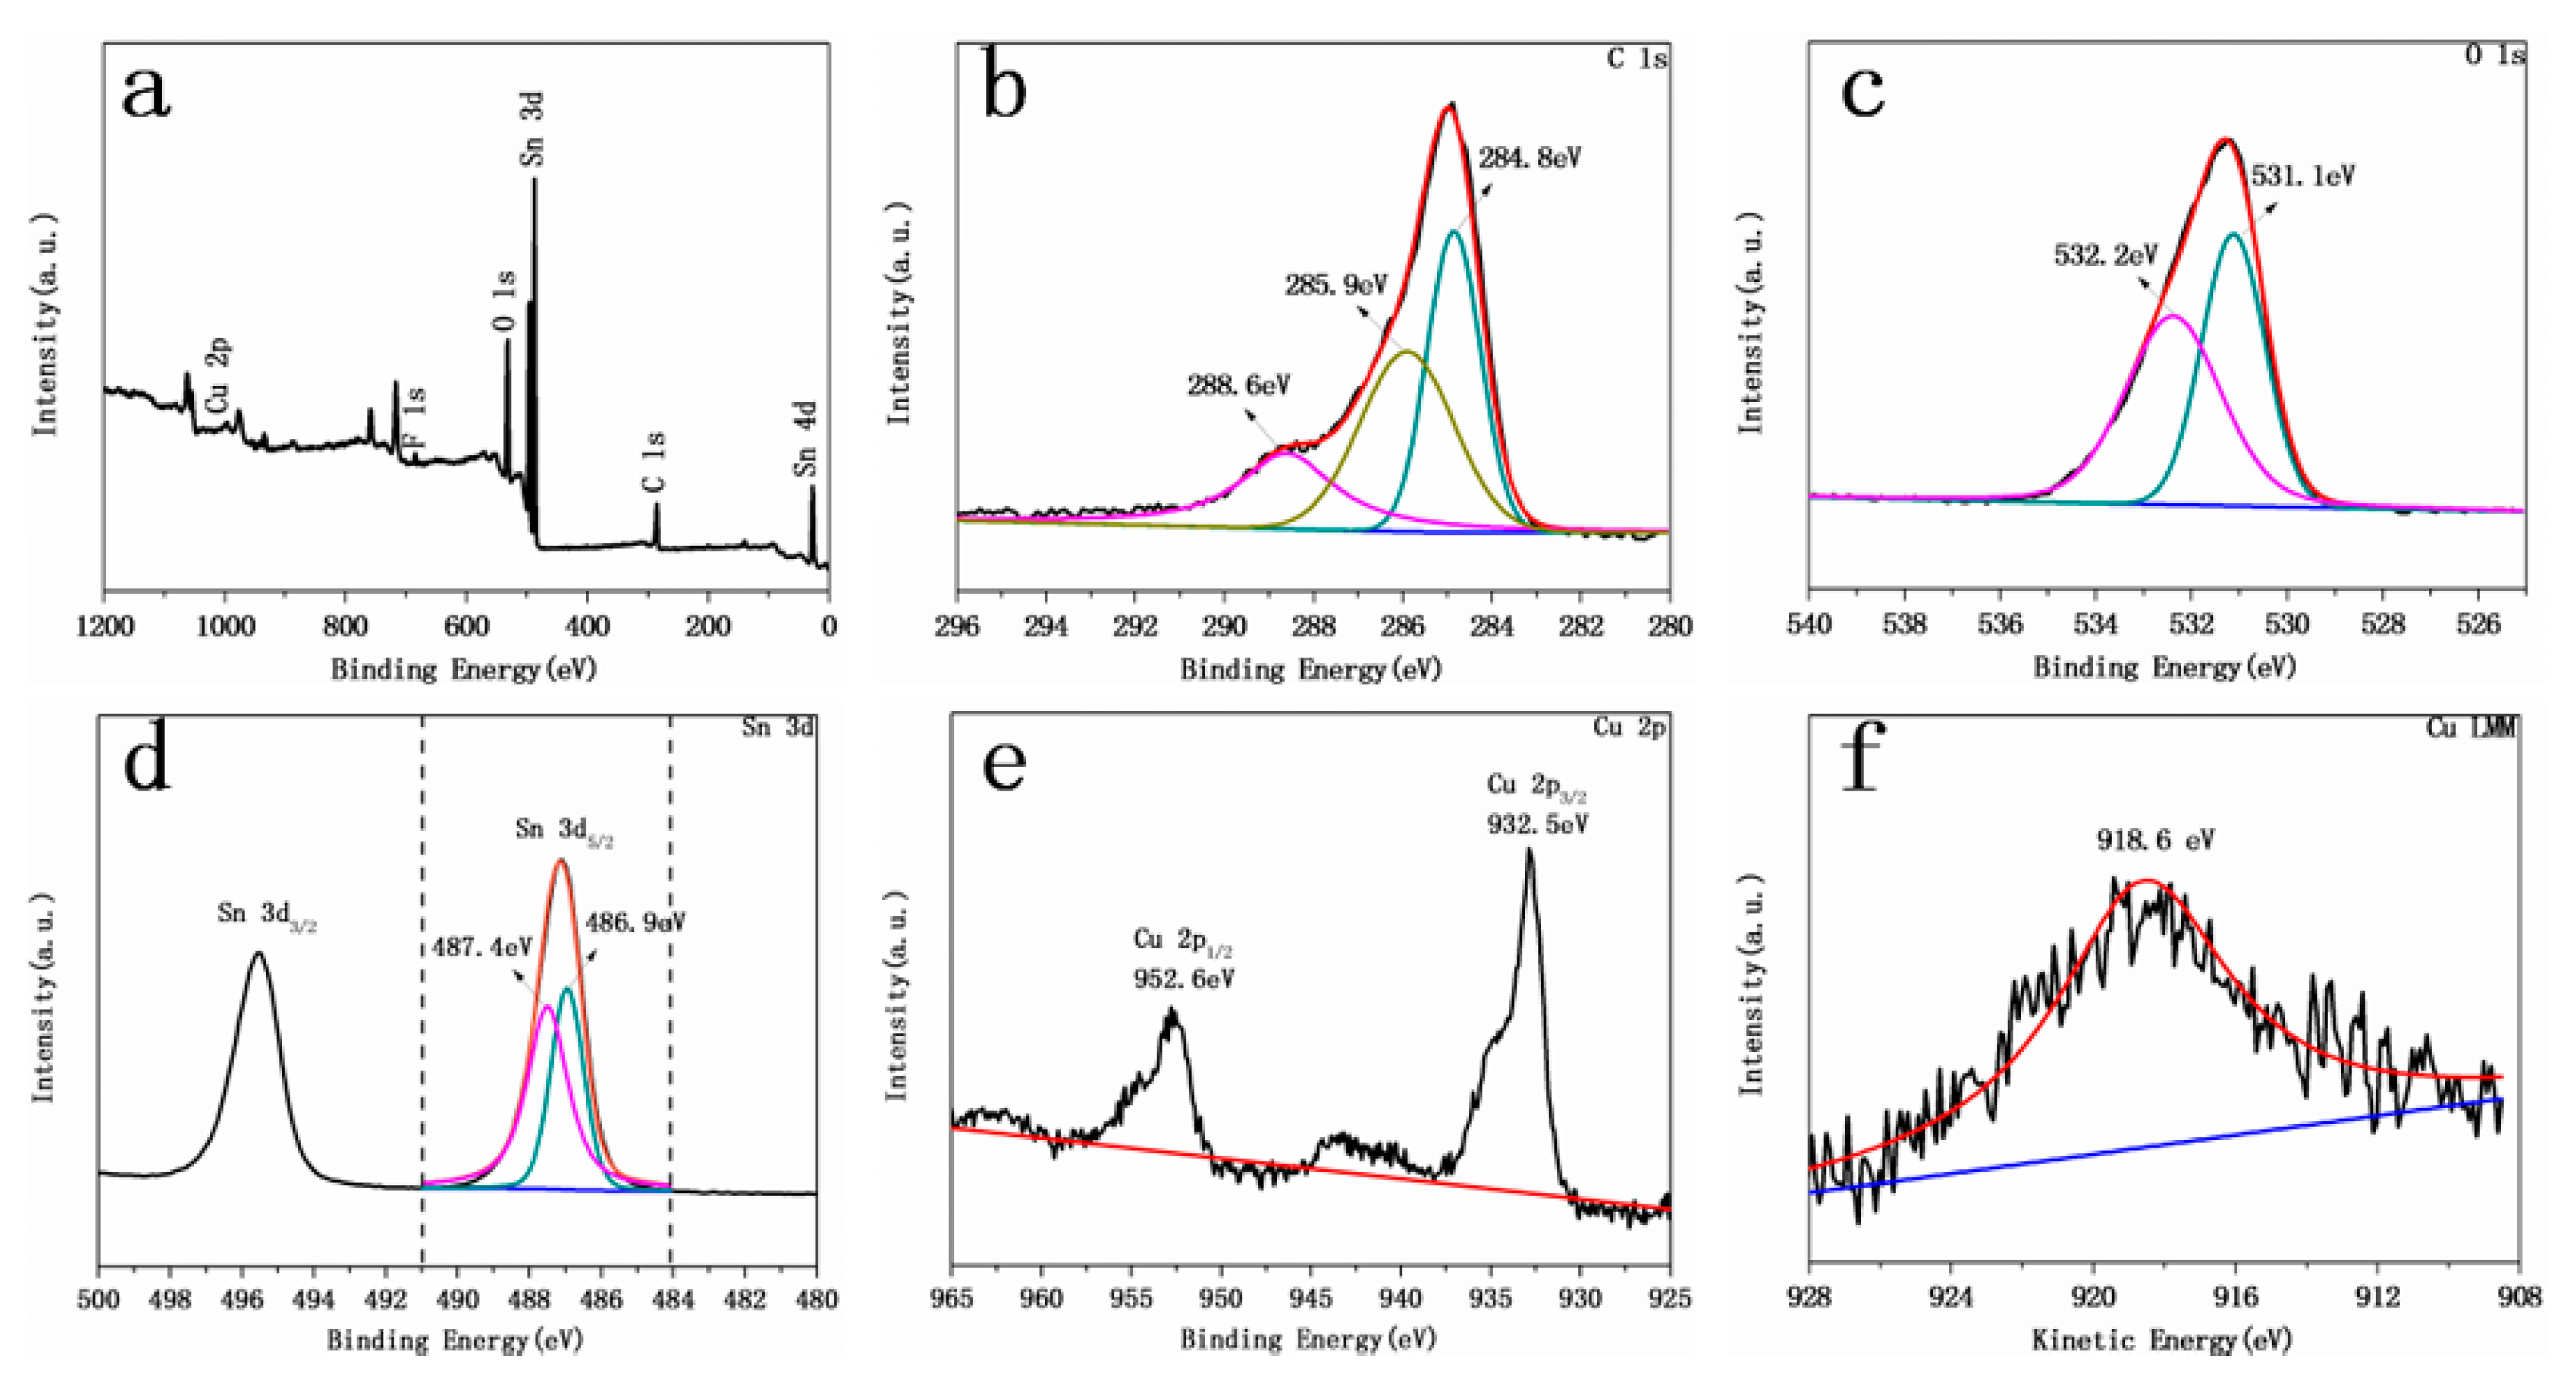
Figure 6.
UV-VIS DRS (UV-visible diffuse-reflectance spectrum) of FTO and Cu/FTO samples.
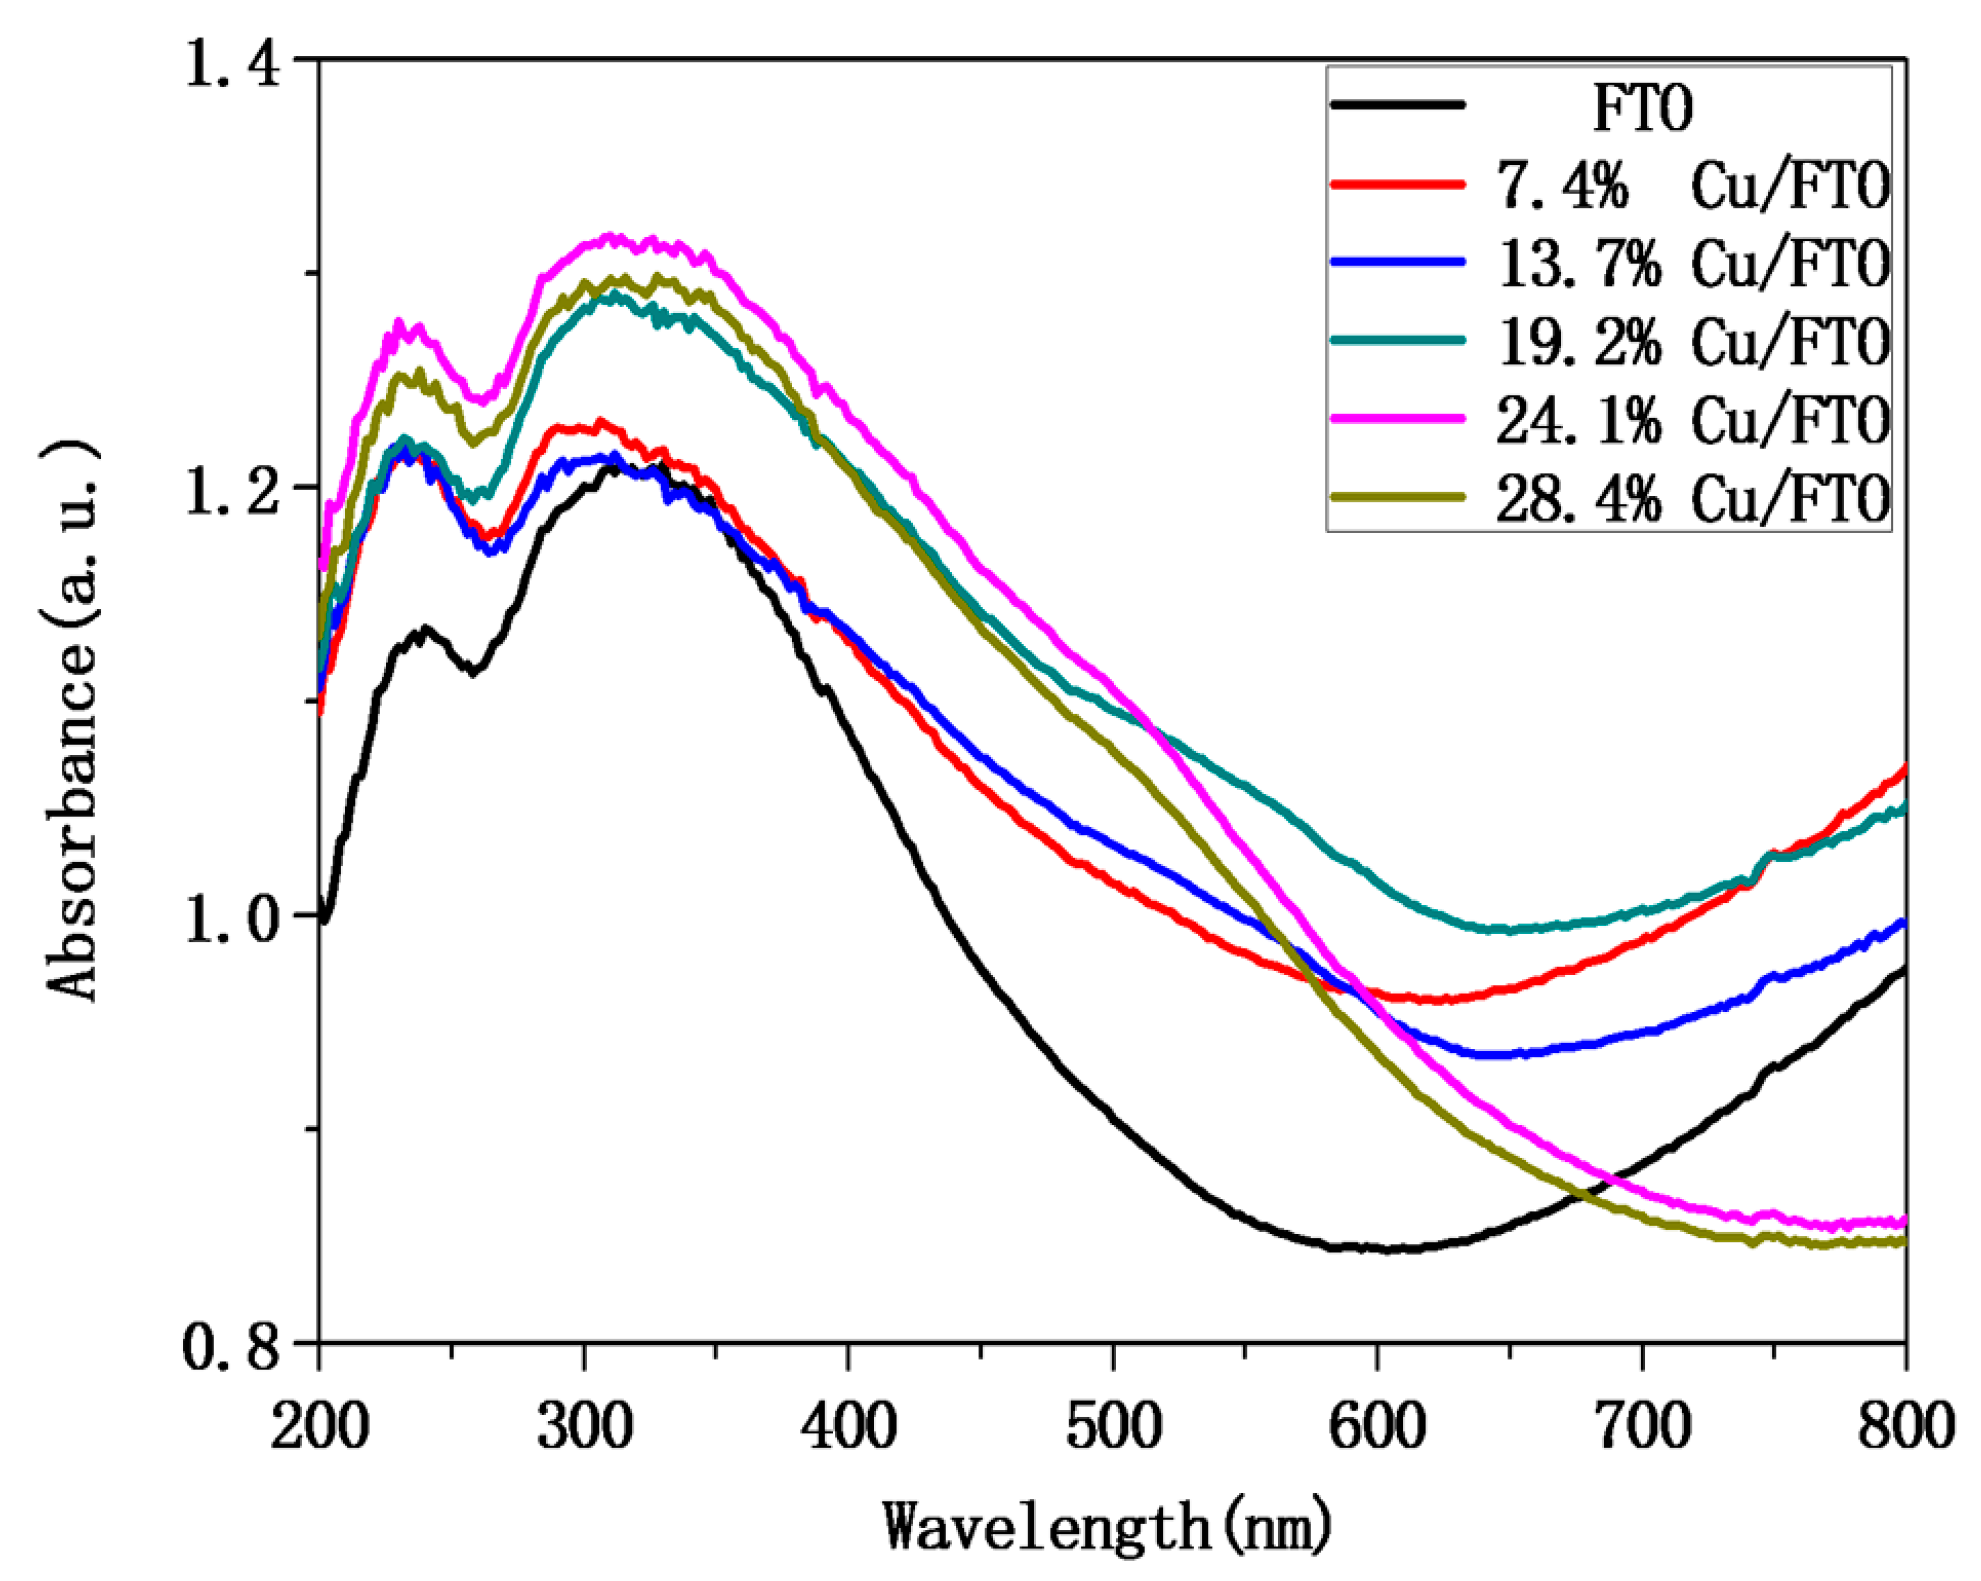
Figure 7.
PL (photoluminescence) spectra of FTO and Cu/FTO samples with different contents of Cu.
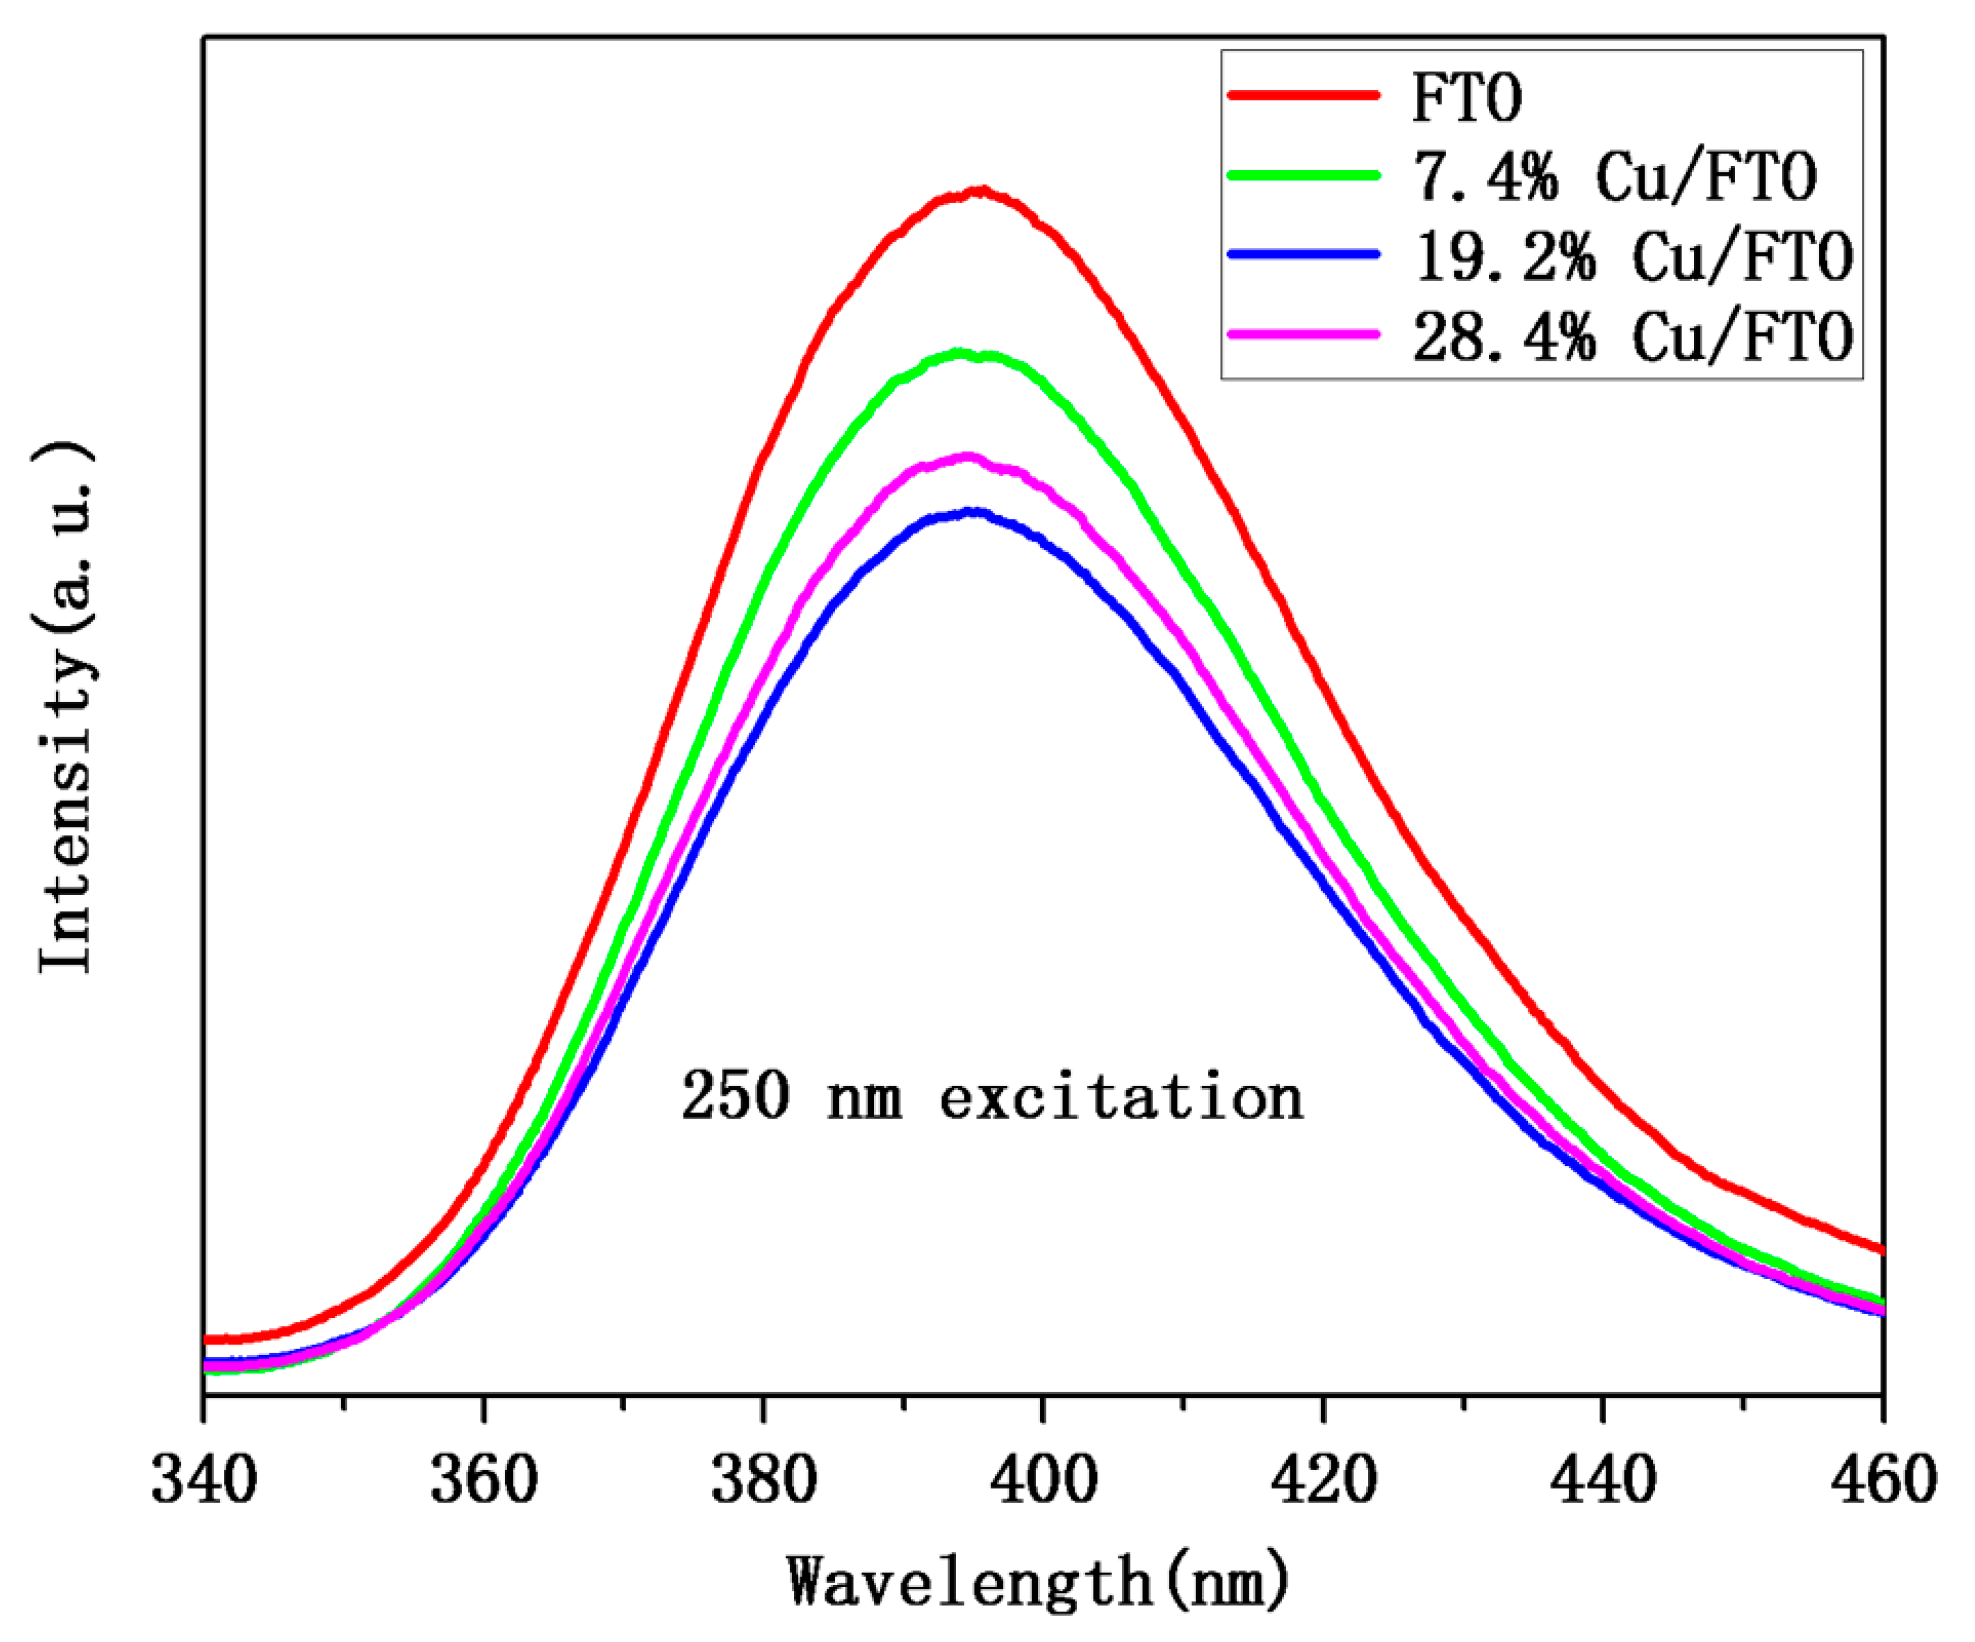
Figure 8.
(a) The transient photocurrent of FTO and Cu/FTO samples with different contents of Cu and (b) EIS (electrochemical impedance spectra) Nyquist plots of FTO and Cu/FTO samples with different contents of Cu under visible light irradiation.
Figure 8.
(a) The transient photocurrent of FTO and Cu/FTO samples with different contents of Cu and (b) EIS (electrochemical impedance spectra) Nyquist plots of FTO and Cu/FTO samples with different contents of Cu under visible light irradiation.
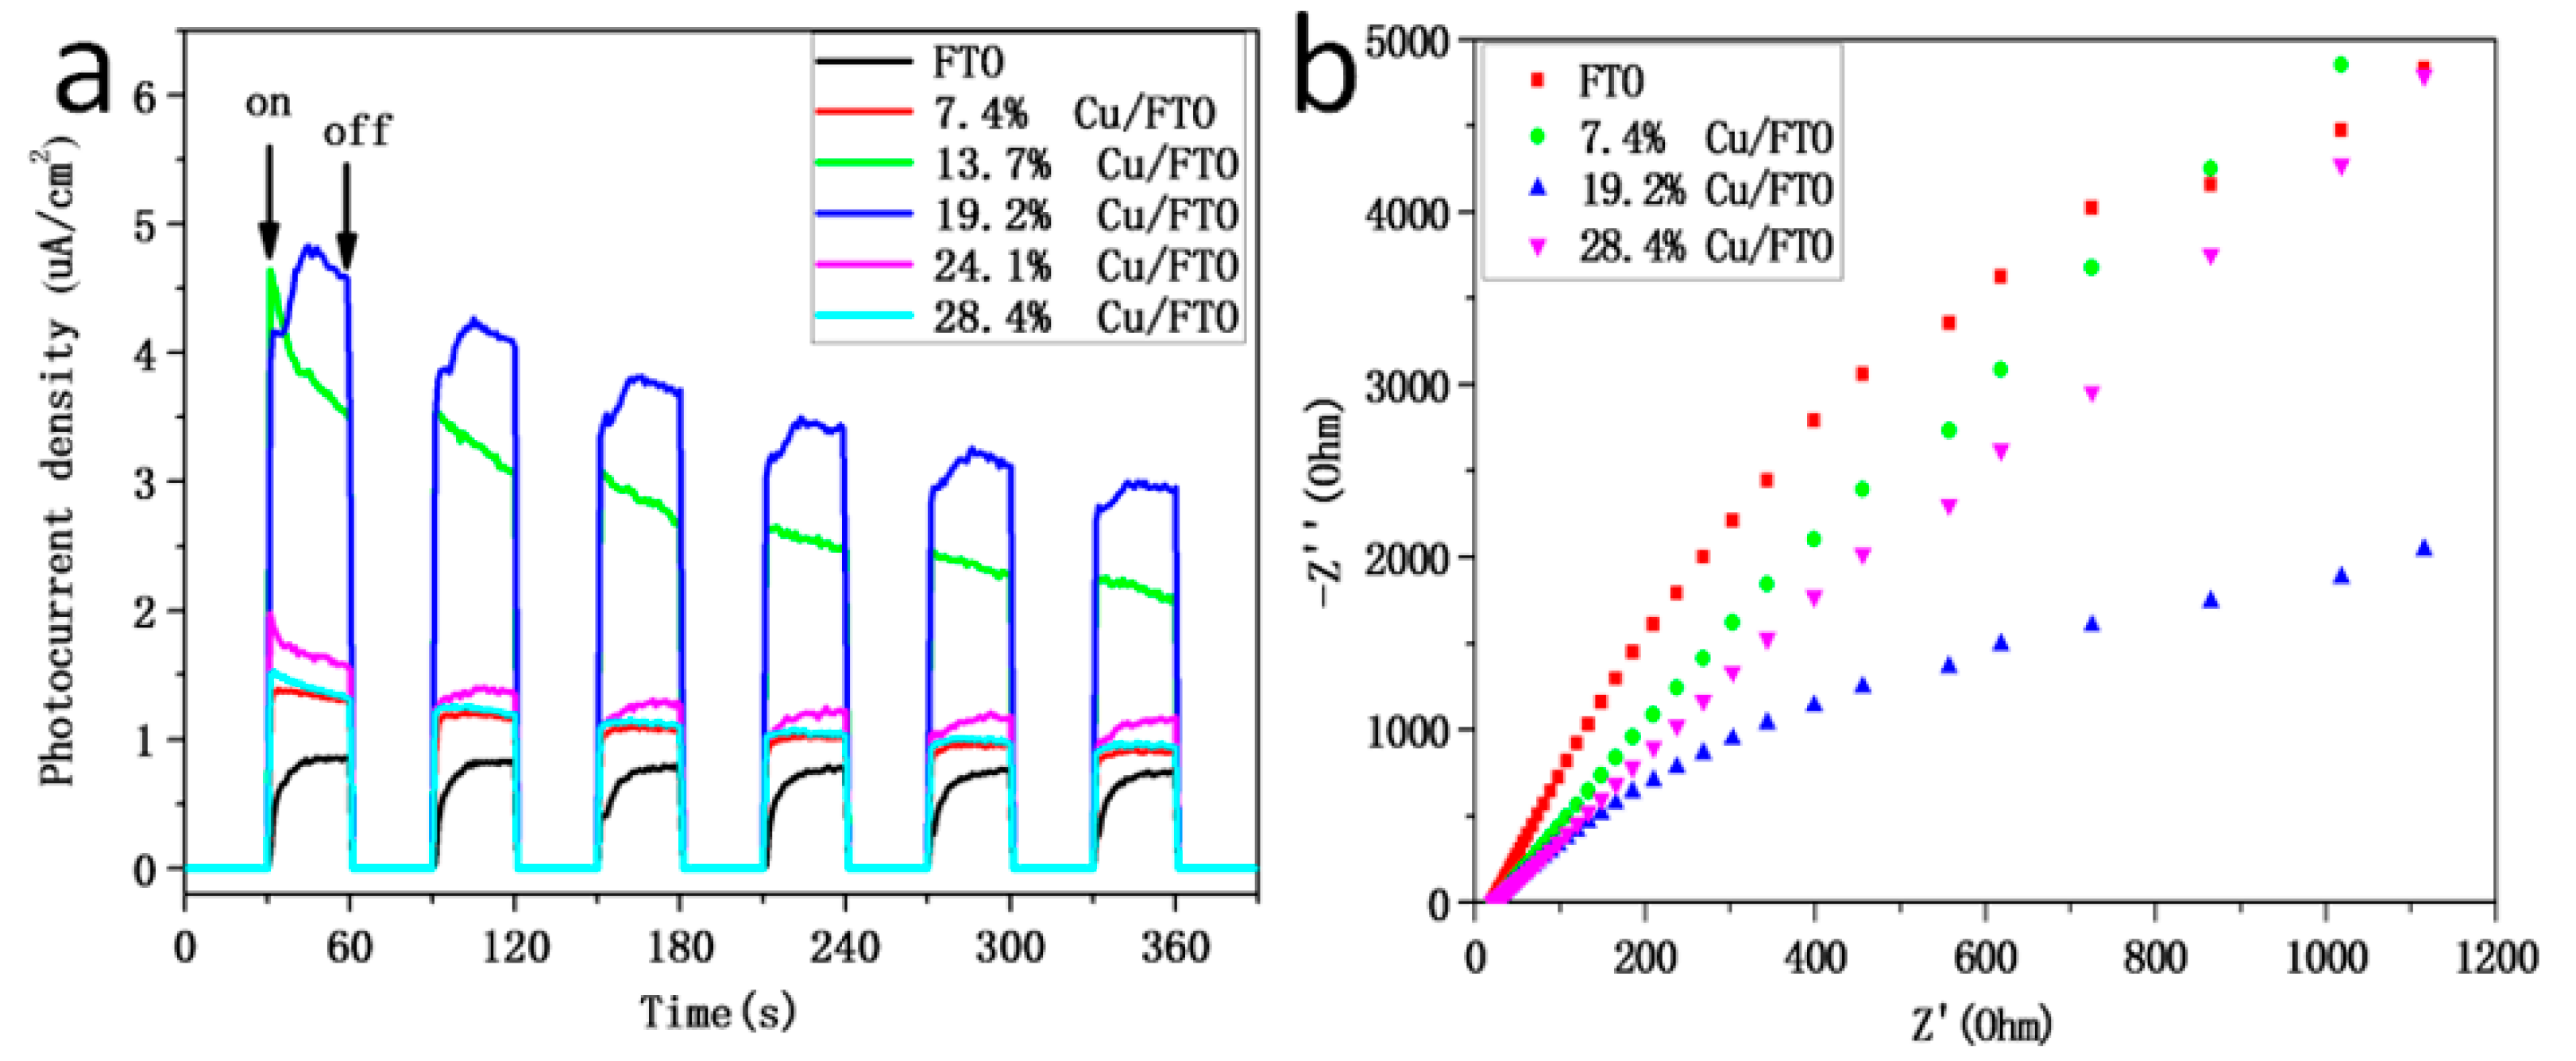
Figure 9.
Photocatalytic H2 evolution rates of 19.2% Cu/SnO2 and 19.2% Cu/FTO samples with different Sn/F molar ratios under visible light irradiation.
Figure 9.
Photocatalytic H2 evolution rates of 19.2% Cu/SnO2 and 19.2% Cu/FTO samples with different Sn/F molar ratios under visible light irradiation.
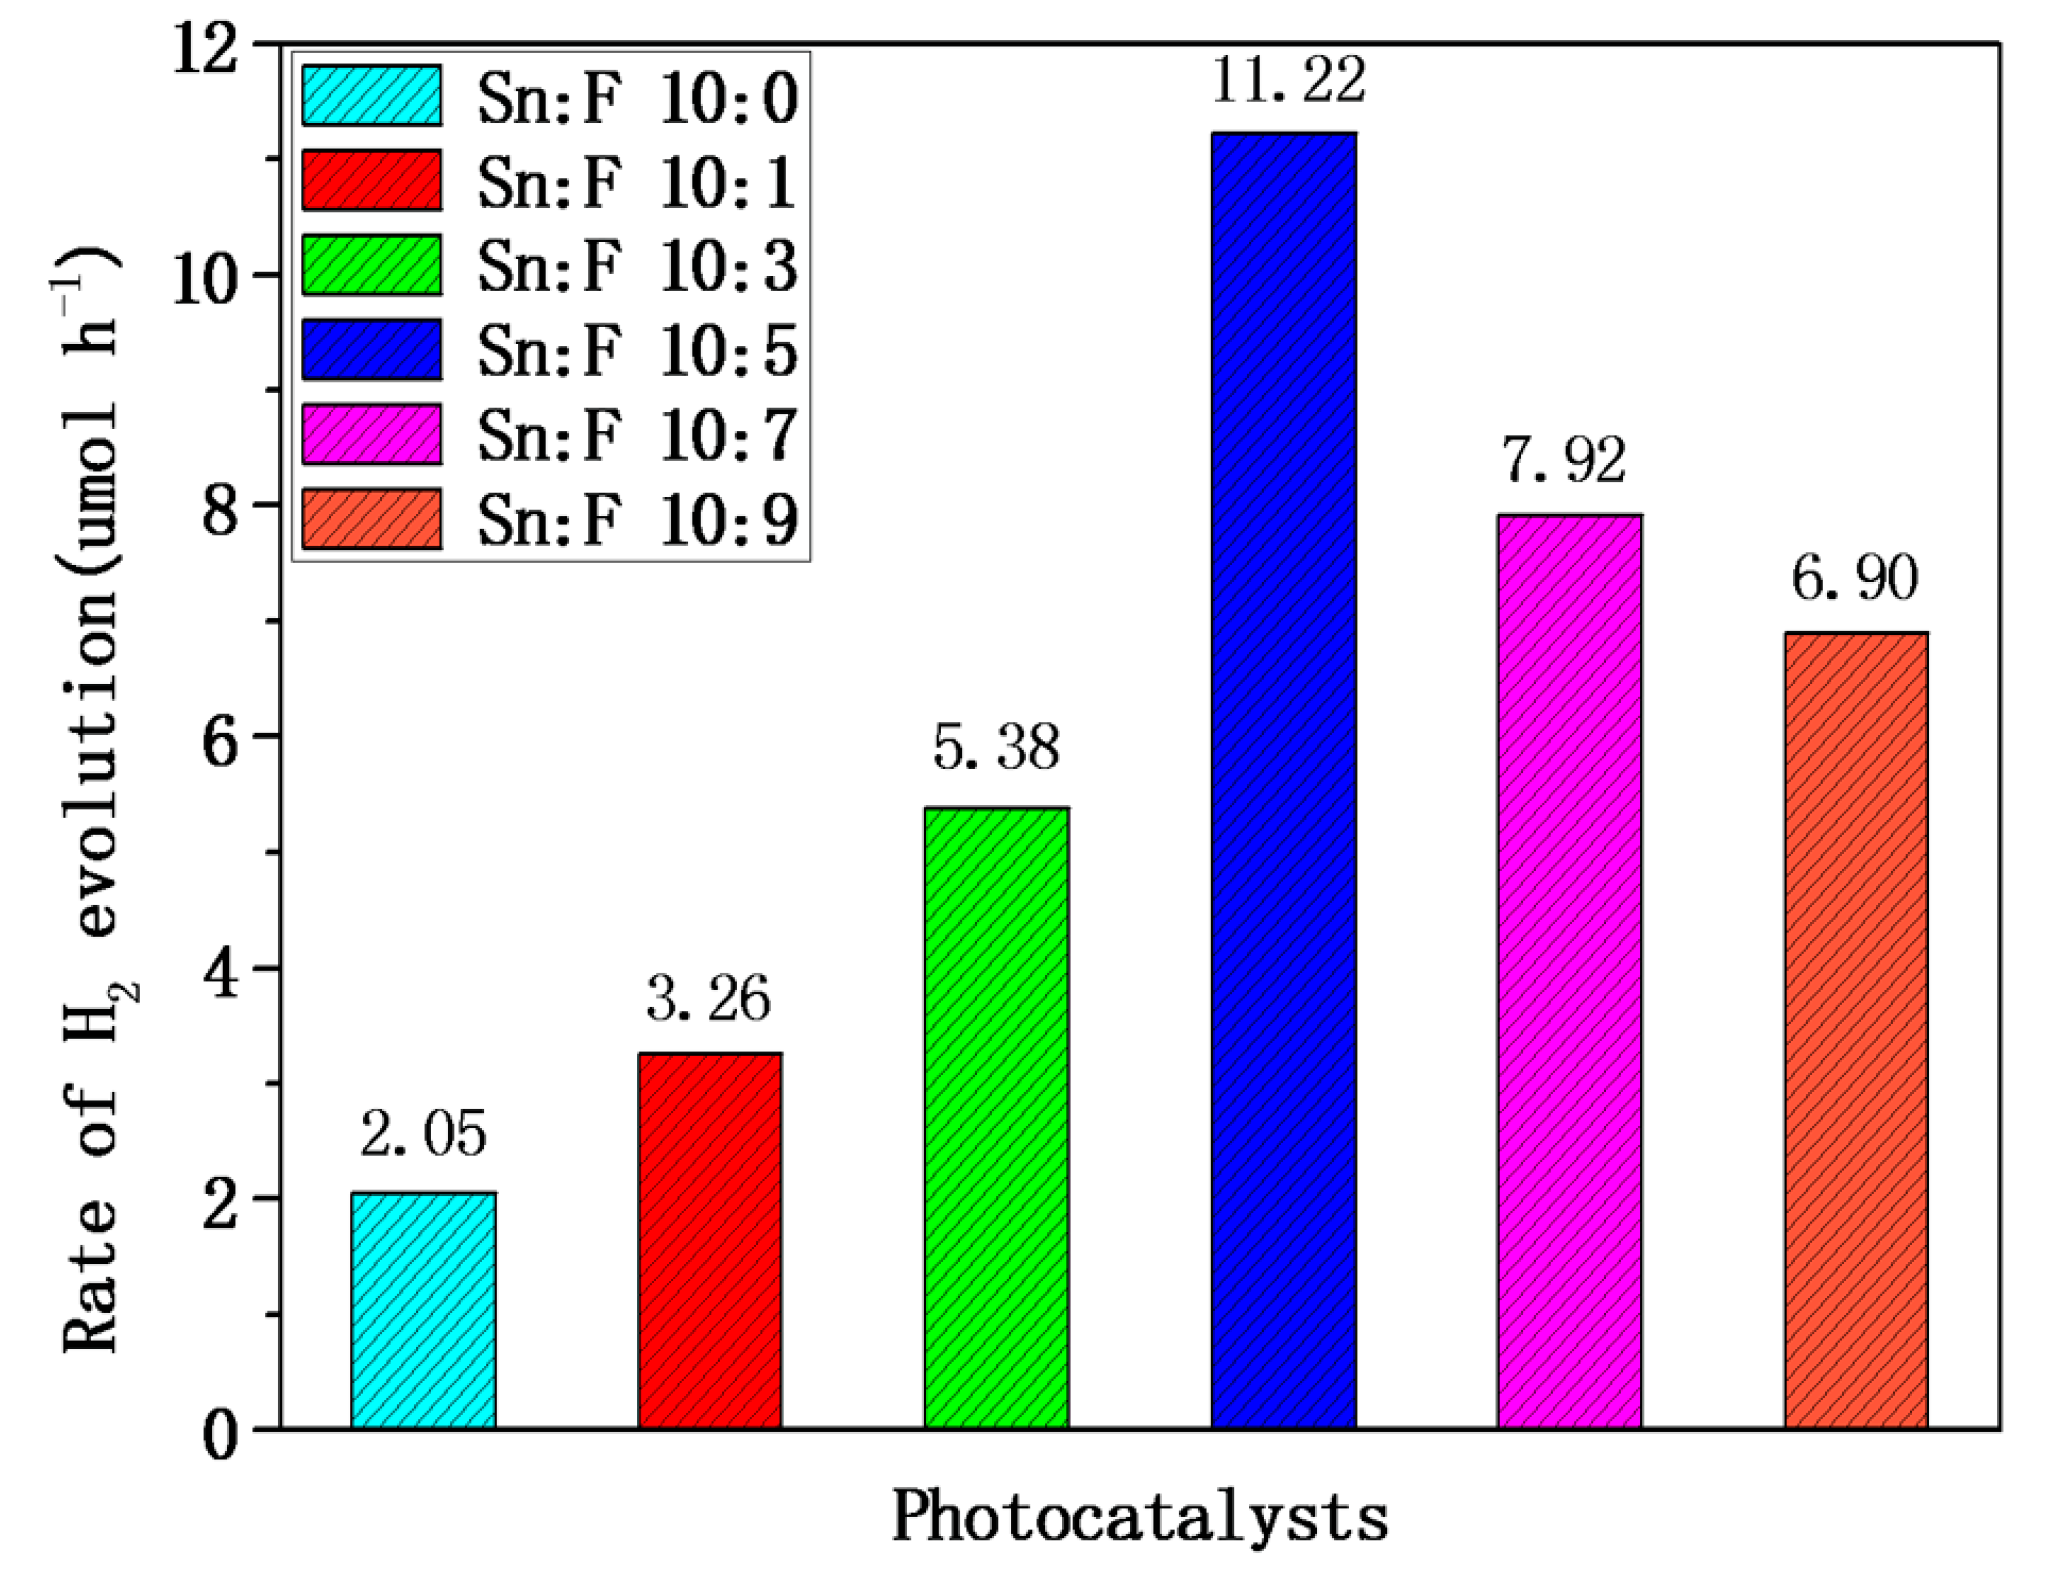
Figure 10.
Photocatalytic H2 evolution rate of FTO (Sn/F = 10/5) and Cu/FTO (Sn/F = 10/5) with different contents of Cu.
Figure 10.
Photocatalytic H2 evolution rate of FTO (Sn/F = 10/5) and Cu/FTO (Sn/F = 10/5) with different contents of Cu.

Figure 11.
Recycling test of as-prepared 19.2% Cu/FTO (Sn/F = 10/5) under visible light irradiation for H2 evolution (irradiation time = 24 h).
Figure 11.
Recycling test of as-prepared 19.2% Cu/FTO (Sn/F = 10/5) under visible light irradiation for H2 evolution (irradiation time = 24 h).
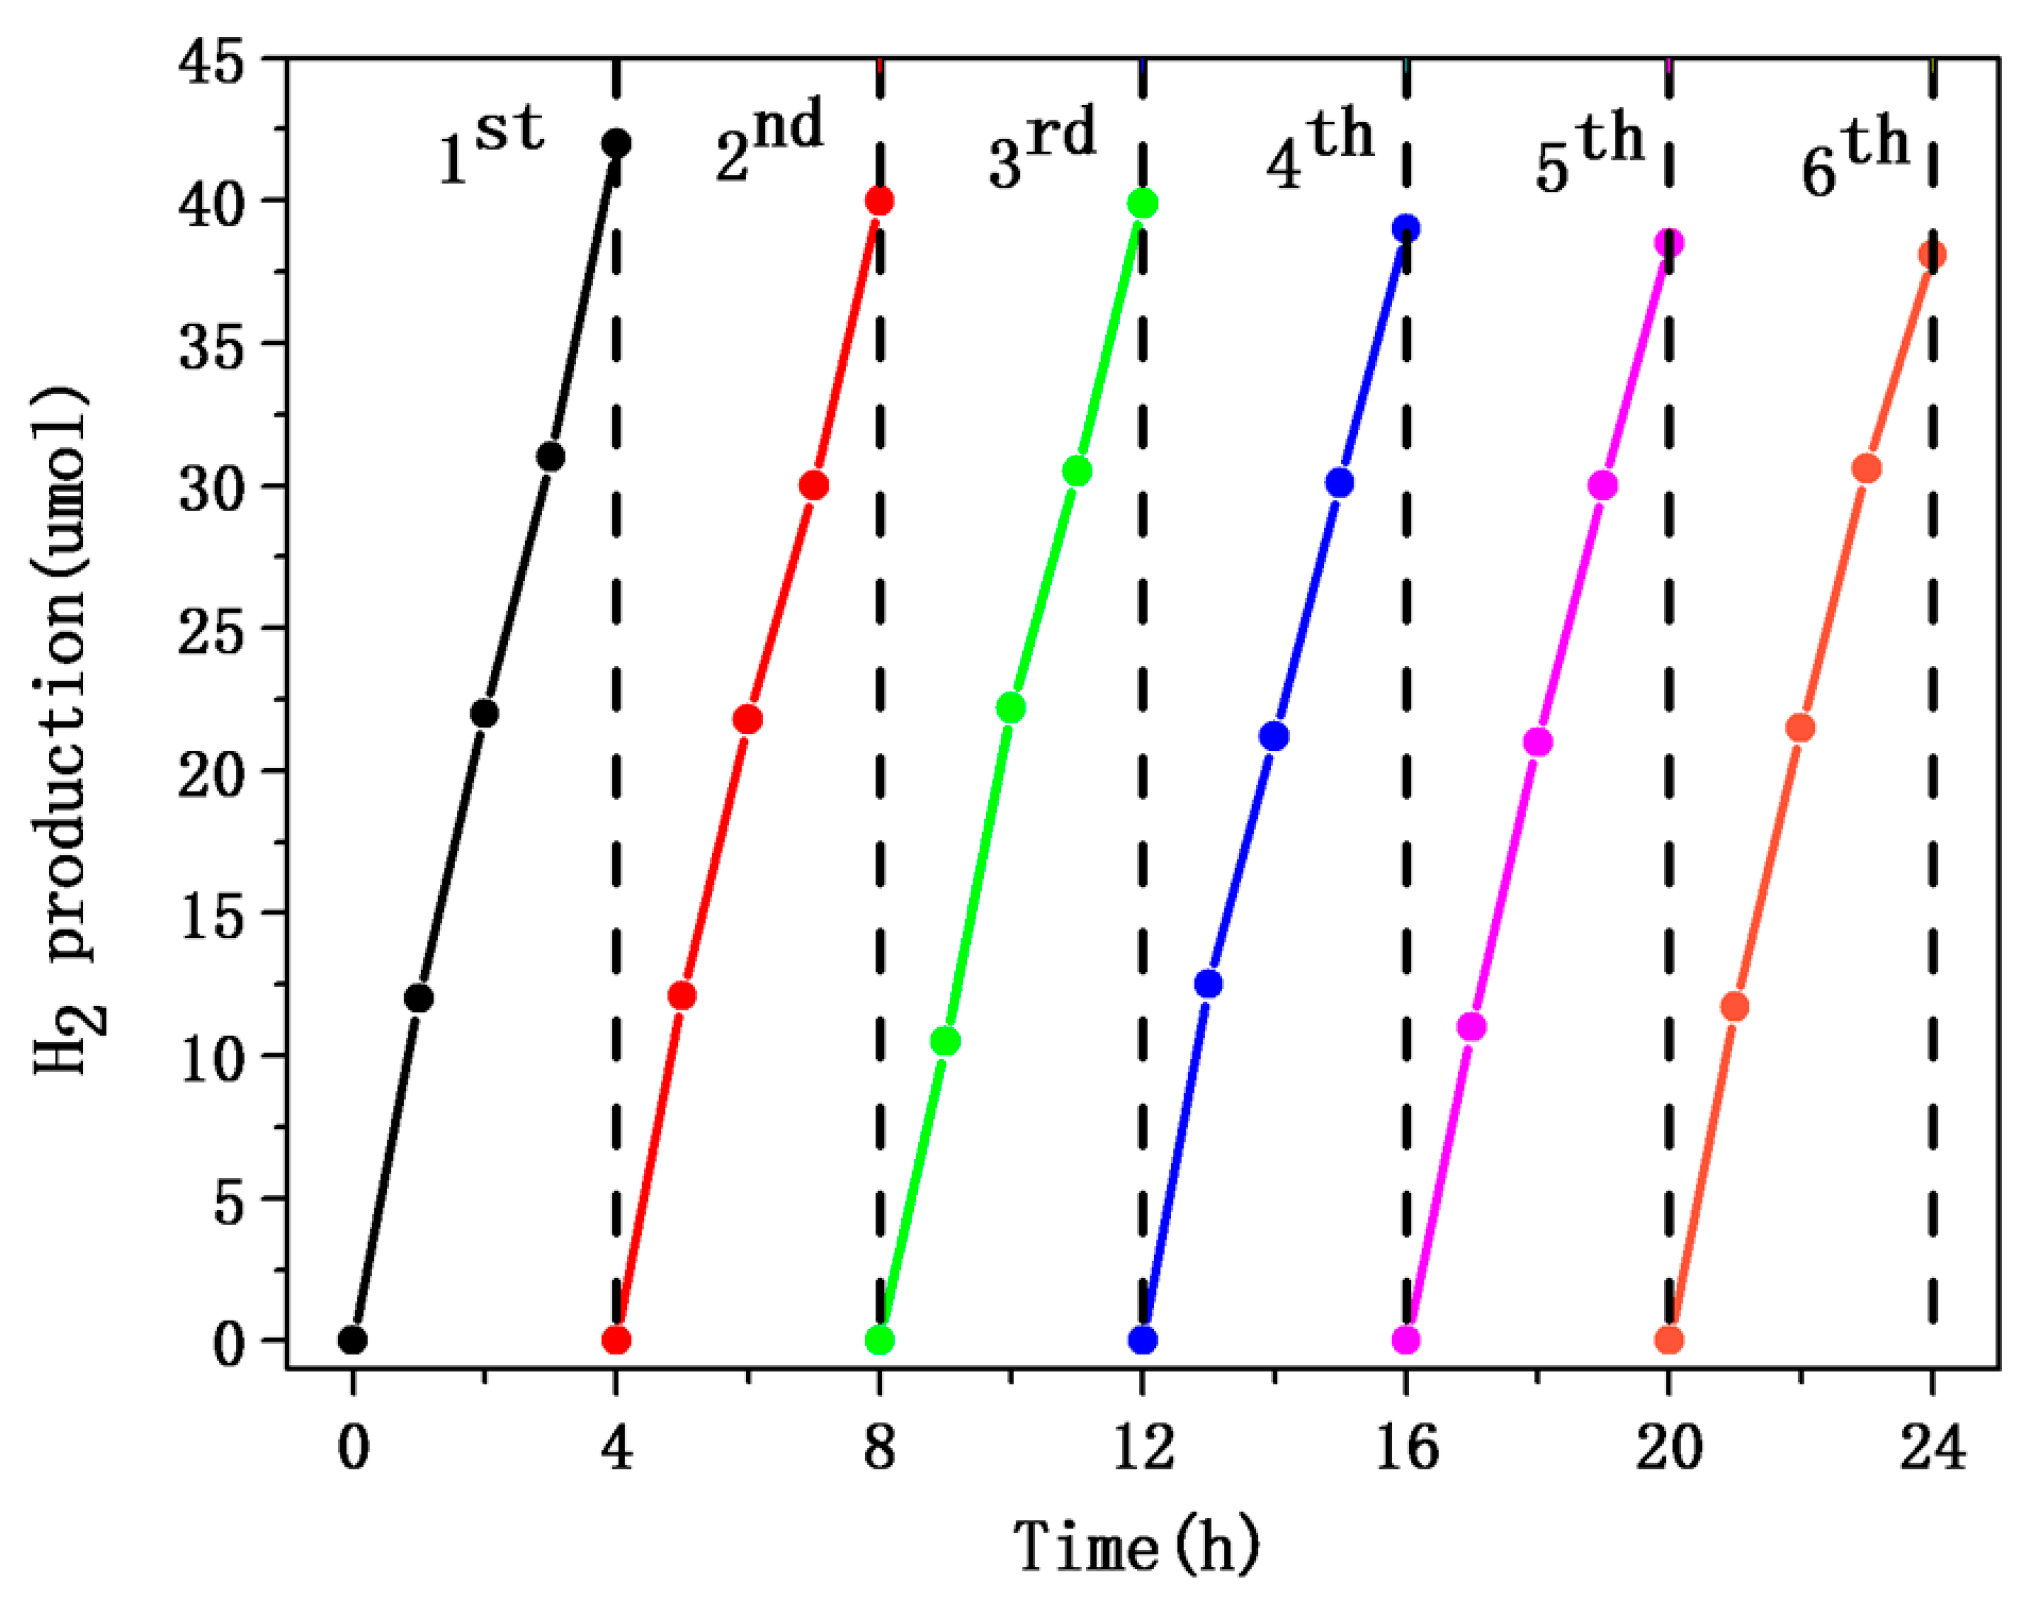
Figure 12.
Schematic mechanism for photocatalytic H2 evolution on the Cu/FTO system.

© 2017 by the authors. Licensee MDPI, Basel, Switzerland. This article is an open access article distributed under the terms and conditions of the Creative Commons Attribution (CC BY) license (http://creativecommons.org/licenses/by/4.0/).
Share and Cite
MDPI and ACS Style
Liu, H.; Wang, A.; Sun, Q.; Wang, T.; Zeng, H. Cu Nanoparticles/Fluorine-Doped Tin Oxide (FTO) Nanocomposites for Photocatalytic H2 Evolution under Visible Light Irradiation. Catalysts 2017, 7, 385. https://doi.org/10.3390/catal7120385
AMA Style
Liu H, Wang A, Sun Q, Wang T, Zeng H. Cu Nanoparticles/Fluorine-Doped Tin Oxide (FTO) Nanocomposites for Photocatalytic H2 Evolution under Visible Light Irradiation. Catalysts. 2017; 7(12):385. https://doi.org/10.3390/catal7120385
Chicago/Turabian StyleLiu, Hui, An Wang, Quan Sun, Tingting Wang, and Heping Zeng. 2017. "Cu Nanoparticles/Fluorine-Doped Tin Oxide (FTO) Nanocomposites for Photocatalytic H2 Evolution under Visible Light Irradiation" Catalysts 7, no. 12: 385. https://doi.org/10.3390/catal7120385
Note that from the first issue of 2016, this journal uses article numbers instead of page numbers. See further details here.