Article

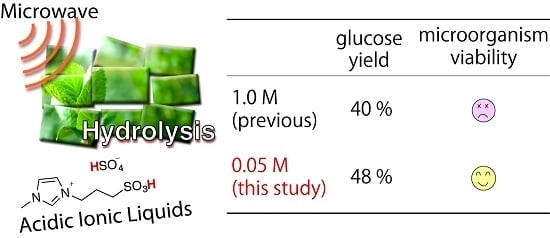
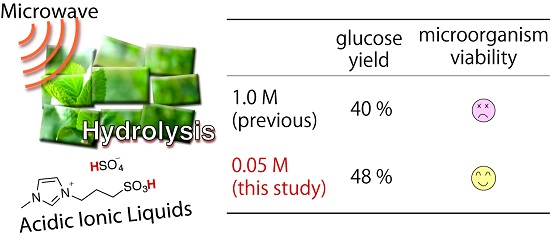
Efficient Hydrolysis of Lignocellulose by Acidic Ionic Liquids under Low-Toxic Condition to Microorganisms

1
Division of Natural System, Graduate School of Natural Science and Technology, Kanazawa University, Kakuma-machi, Kanazawa 920-1192, Japan
2
Department of Chemistry, Faculty of Mathematics and Natural Sciences, University of Lampung, Jl. Soemantri Brojonegoro No.1, Bandar Lampung 35145, Indonesia
3
Institute for Frontier Science Initiative, Kanazawa University, Kakuma-machi, Kanazawa 920-1192, Japan
*
Authors to whom correspondence should be addressed.
Catalysts 2017, 7(4), 108; https://doi.org/10.3390/catal7040108
Submission received: 10 March 2017 / Revised: 4 April 2017 / Accepted: 6 April 2017 / Published: 7 April 2017
(This article belongs to the Special Issue Catalysis in Innovative Solvents)

Abstract

:
Lignocellulose is known as a renewable resource, and acidic ionic liquids have been highlighted as efficient catalysts for hydrolysis of cellulose. To achieve successive hydrolysis and fermentation, efficient hydrolysis with sufficiently diluted acidic ionic liquids is necessary because acidic ionic liquids are toxic to fermentative microorganisms. Escherichia coli was confirmed to grow in 0.05 M dilute acidic ionic liquid—1-(1-butylsulfonic)-3-methylimidazolium hydrogen sulfate ([Sbmim][HSO4])—although the growth was suppressed in more concentrated solutions. Therefore, we applied the 0.05 M [Sbmim][HSO4] solution to hydrolysis of bagasse, leading to a glucose yield of 48% at 190 °C. This value is greater than that obtained with a concentrated [Sbmim][HSO4] solution, which is not suitable for the growth of Escherichia coli (yield: 40% in a 1.0 M solution). Efficient hydrolysis with acidic ionic liquids under low-toxic condition was achieved.

Graphical Abstract

1. Introduction

Carbohydrates account for 75% of annual renewable biomass. Among the various types of carbohydrates, cellulose is the most attractive because it is inedible and inexpensive; furthermore, it can be obtained on a large scale from biomass (ca. 45% of biomass) [1]. Recently, the efficient conversion of cellulose to glucose for the production of ethanol and critical building blocks such as succinic acid and gluconic acid via fermentation has been extensively studied [1,2]. Acidic or enzymatic hydrolysis has been used to obtain glucose from cellulose. Hydrolysis using dilute acid is known to be a simple, cost-effective method; however, it gives low sugar yields and requires a long reaction time [3]. To improve hydrolysis yield, efficient catalysts are strongly requested.
Recently, certain ionic liquids (ILs) have been applied in the processing of cellulose [4,5,6,7,8,9]. Because of their remarkable capacity to delignify and solubilize cellulose, the ILs are often used for pretreating lignocellulosic biomass before hydrolysis [10,11,12,13,14,15]. On the other hand, Davis et al. reported acidic ILs having an acidic group such as a sulfo group in their cationic and/or anionic structures [16,17,18,19,20], and the acidic ILs exhibit higher catalytic activity in cellulose hydrolysis compared to sulfuric acid [21]. Furthermore, it has been reported that microwave heating accelerates hydrolysis of cellulose in 1.0 M acidic IL, 1-(1-butylsulfonic)-3-methylimidazolium hydrogen sulfate ([Sbmim][HSO4]; Figure 1) [22], because the combination of ILs and microwave is known to exert synergistic effects on several reactions [23,24,25]. In the literature, the glucose yield has increased from a few percent after 30 min to 40% after 12 min at 160 °C when using microwave irradiation.
However, the concentrated [Sbmim][HSO4] solution (1.0 M in the previous literature) is not suitable for the successive microbial utilization, e.g., the fermentation of glucose to ethanol or other valuable building blocks, because the concentrated [Sbmim][HSO4] solution is lethal to microorganisms due to its acidity and the intrinsic toxicity of ILs [26,27,28,29]. Especially, the intrinsic toxicity of IL cannot be reduced unlike the toxicity by acidity (reduced by neutralization): sufficiently dilute solution has to be used. Since there is no report satisfying both conditions—microbial viability and a high yield of sugars—with acidic ILs, in this study, we attempted the efficient hydrolysis of cellulose with a [Sbmim][HSO4] solution that is sufficiently dilute to be undisruptive to the growth of Escherichia coli (E. coli).

2. Results and Discussion

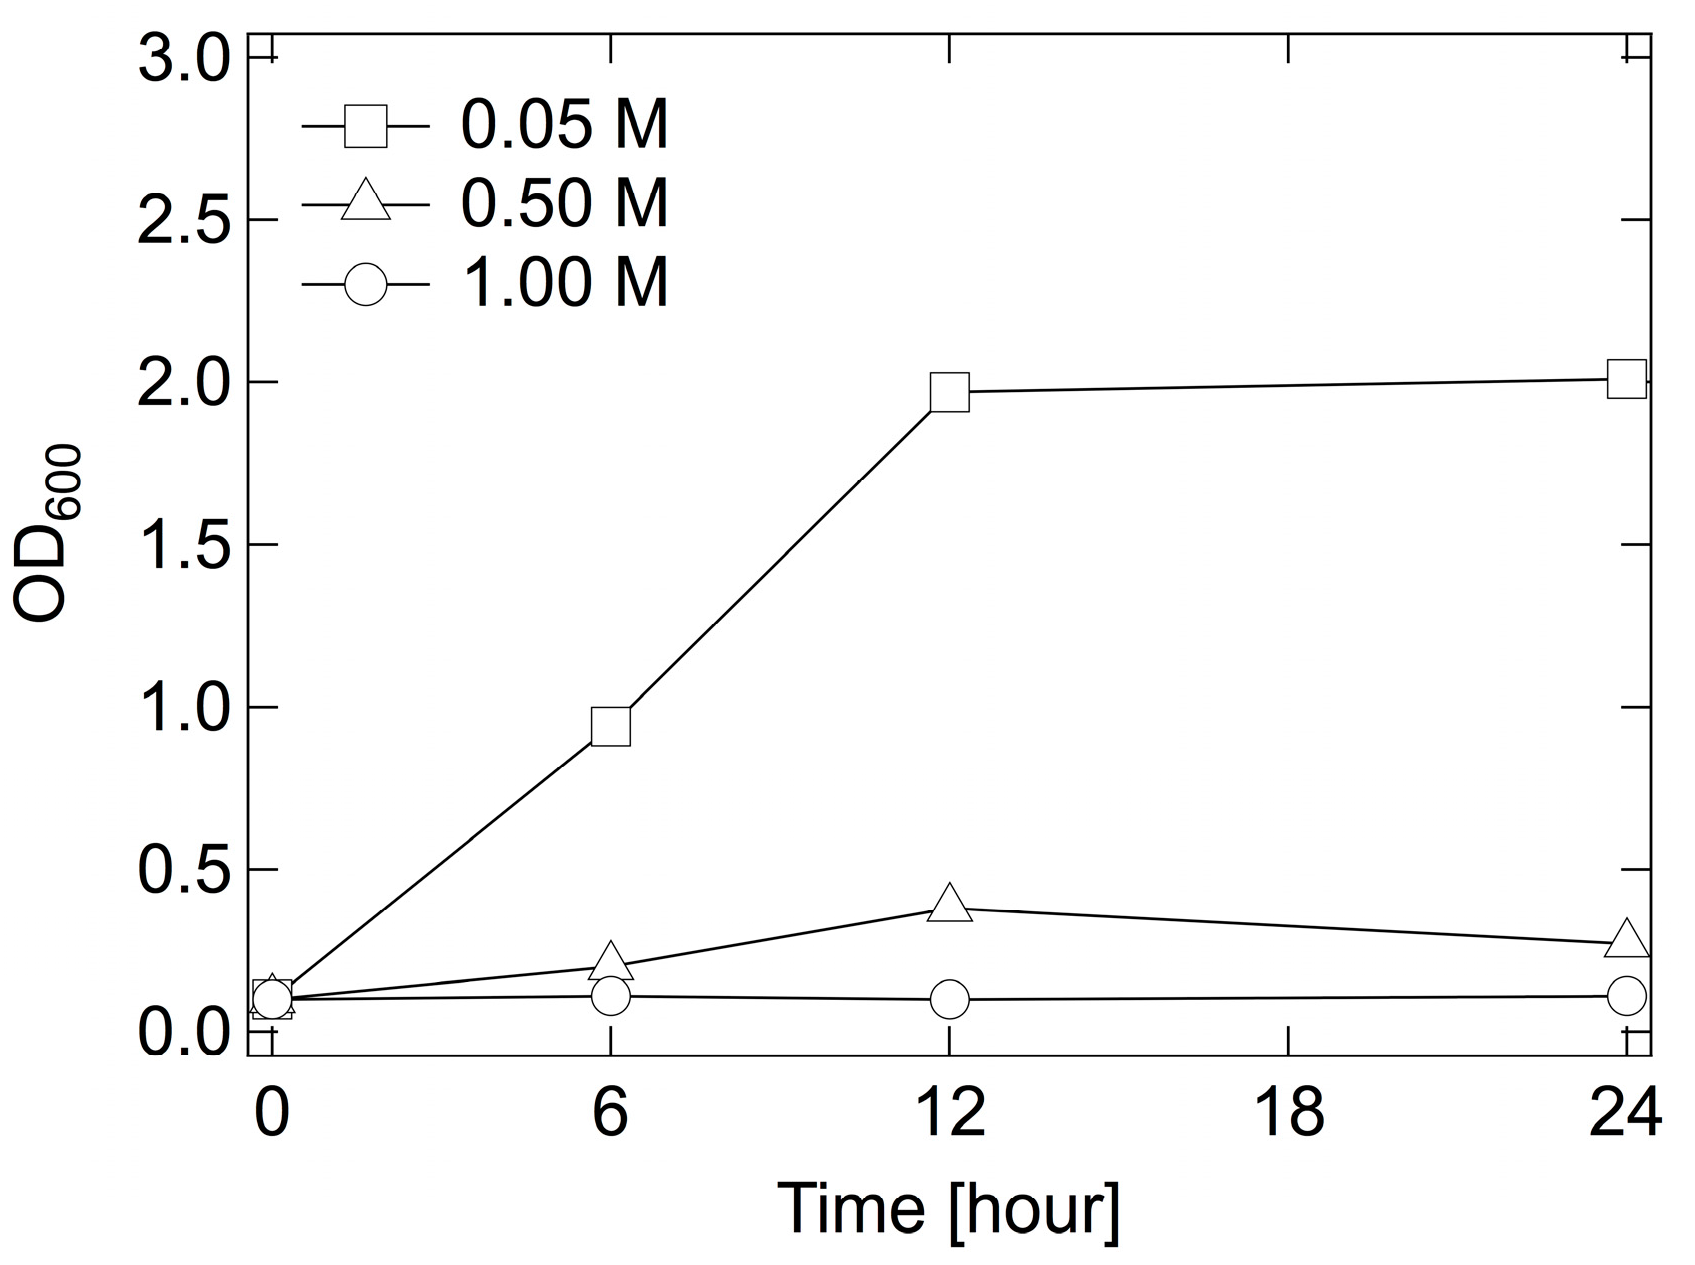
2.1. Effect of [Sbmim][HSO4] on E. coli Growth

First of all, the toxicity of [Sbmim][HSO4] was investigated because the toxicity of acidic ILs has not been studied. Figure 2 shows the time course of the optical density at 600 nm (OD600) of the [Sbmim][HSO4]/medium mixed solutions during culturing E. coli. OD600 is a conventional indicator of the E. coli concentration. At [Sbmim][HSO4] concentrations of 1.00 and 0.50 M, the OD600 after 24 h was 0.1 and 0.3, respectively, indicating severe growth inhibition. In contrast, E. coli grew and the OD600 increased to 2.0 within 24 h in a 0.05 M [Sbmim][HSO4] solution. Although E. coli thrived more in a pure medium without [Sbmim][HSO4], resulting in an OD600 of 5.0 within 24 h (Figure S1, see Supplementary Materials), it is confirmed that E. coli surely grew in the 0.05 M solution with almost half the growth ratio of that in the pure medium. Therefore, we decided to apply the 0.05 M solution to the hydrolysis of cellulose.
As mentioned above, [Sbmim][HSO4] inhibited the growth of E. coli because of the IL structure itself and/or the acidity. To investigate the mechanism of toxicity, the same experiments using H2SO4 and 1-ethyl-3-methylimidazolium acetate, an IL that does not contain any acidic part, were also performed. All three compounds, [Sbmim][HSO4], 1-ethyl-3-methylimidazolium acetate, and H2SO4, exhibited a similar inhibitory effect on E. coli growth (Figures S2 and S3, see Supplementary Materials). Hence, the toxicity of [Sbmim][HSO4] may be attributed to both the IL structure and the acidity.

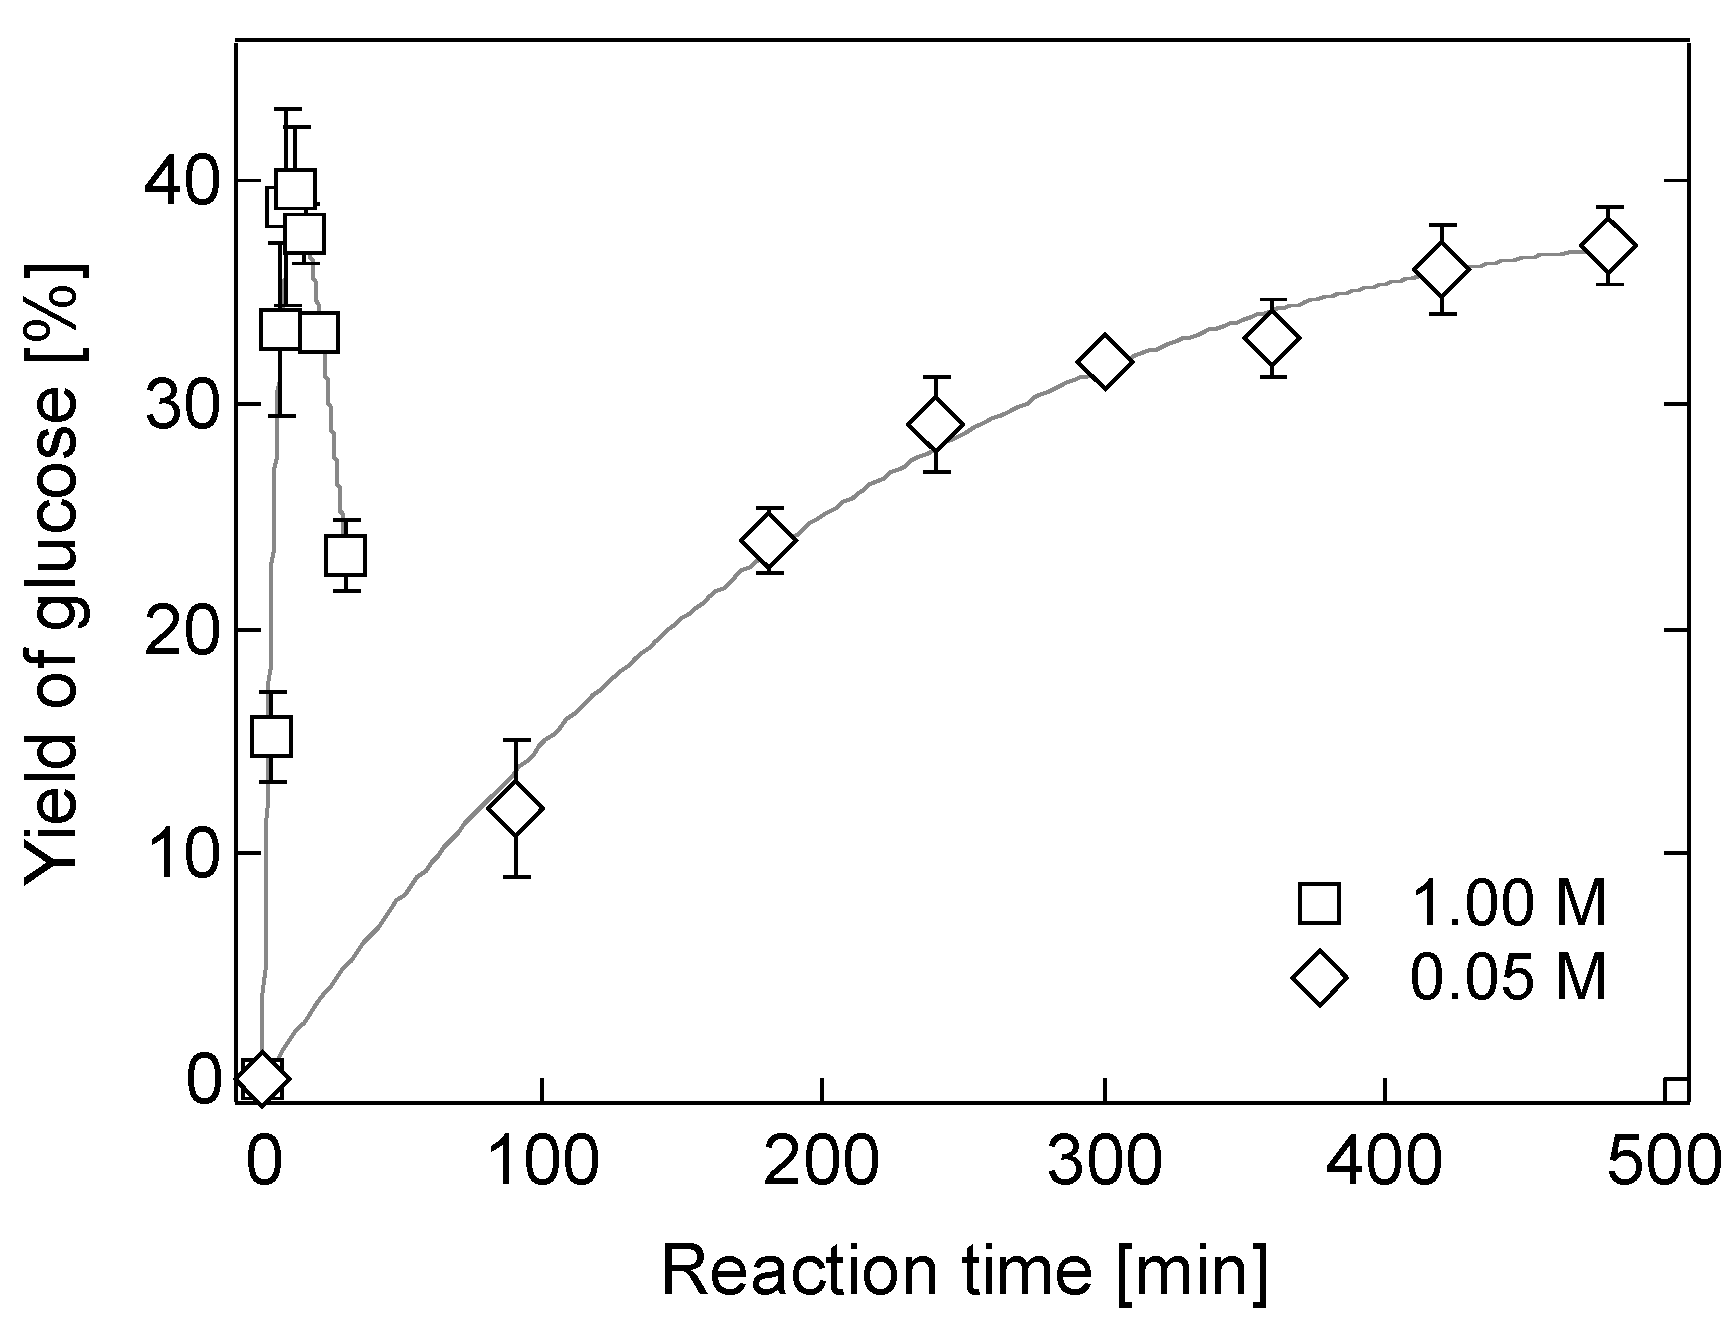
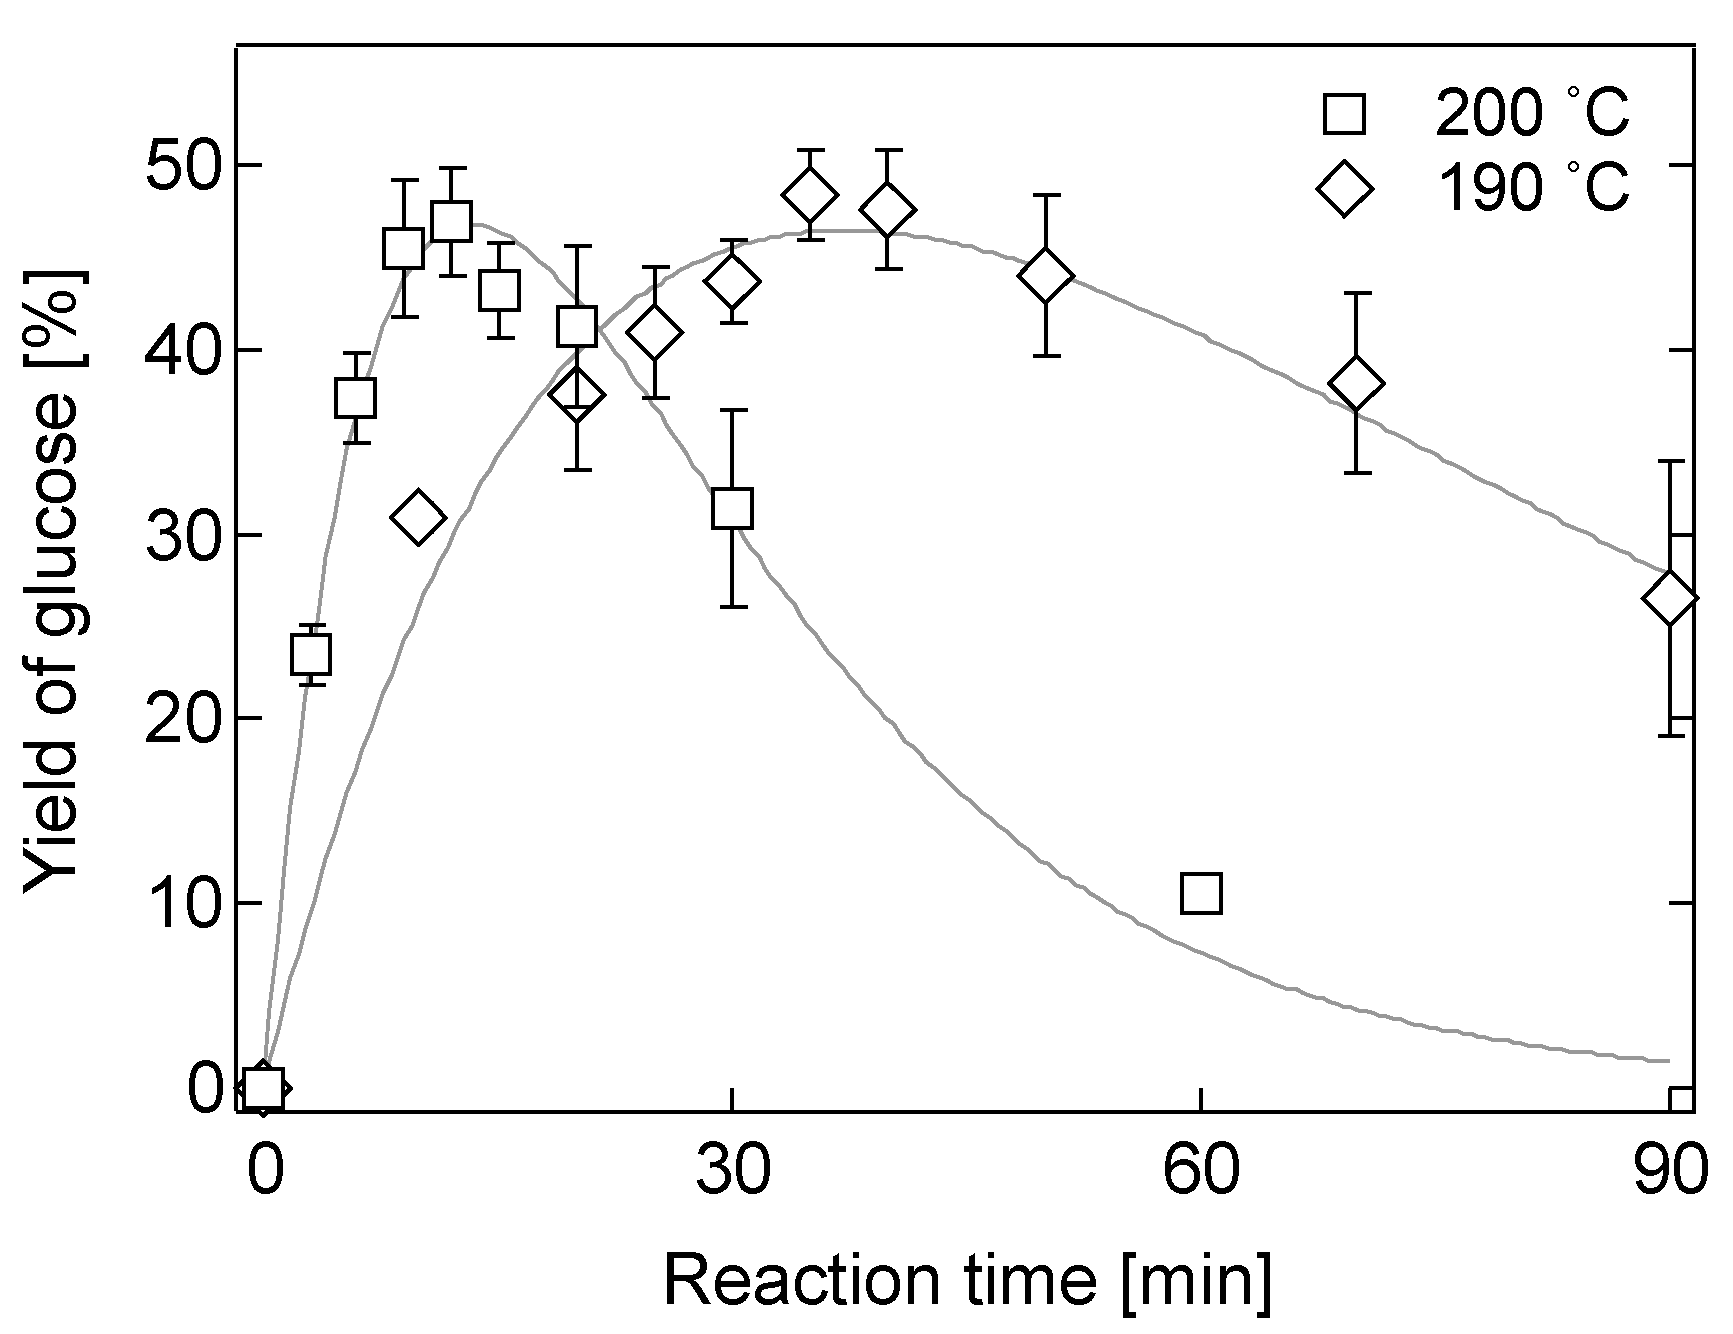
2.2. Hydrolysis of Bagasse in a 0.05 M [Sbmim][HSO4] Solution

Figure 3 shows the glucose yield during hydrolysis using 0.05 M [Sbmim][HSO4] solutions at 160 °C. The glucose yield gradually increased in the 0.05 M solution, and reached a maximum of 37%. In a concentrated solution (1.00 M), the glucose yield reached a maximum of 40%, and then decreased. It is confirmed that the 0.05 M solution can hydrolyze bagasse with a comparable yield to that of the 1.00 M solution.
The reactions in the samples proceeded with different rates. Peak yields in 1.00 and 0.05 M solutions were attained after approximately 12 and 500 min, respectively. The [Sbmim][HSO4] concentration was confirmed to affect the reaction rate, and the low reaction rate at 0.05 M is expected to be improved by elevating the reaction temperature.
Figure 4 shows the time courses of the glucose yields during bagasse hydrolysis in the 0.05 M [Sbmim][HSO4] solutions at 190 and 200 °C. The reaction rate improved in both cases, compared to that at 160 °C (see Figure 3): peak yields at 190 and 200 °C were obtained after 35 and 12 min, respectively. The glucose yield was also improved by increasing temperature: the peak yields at 190 and 200 °C were 48 and 47%, respectively. We were able to reduce the [Sbmim][HSO4] concentration to decrease the toxicity and improve the glucose yield, compared to the hydrolysis using the 1.00 M solution. In addition, the glucose yield at 180 °C was 43% within 40 min (Figure S4; see Supplementary Materials). Reaction temperatures of greater than 190 °C are favorable for attaining a high glucose yield.
To investigate the reason behind the improvement of the glucose yield, we estimated k1 and k2 (based on Equations (1) and (2), see experimental section; results are shown in Table 1). The k1 and k2 depended strongly on both the [Sbmim][HSO4] concentration and the temperature. For example, k1 and k2 obtained with the 0.05 M [Sbmim][HSO4] solution at 190 °C were 3.4 × 10² and 2.1 × 10² min−1 (Entry 3), whereas those obtained with a 1.00 M solution at 160 °C were 8.4 × 10² and 7.5 × 10² min−1 (Entry 5, the optimum condition in 1.00 M [Sbmim][HSO4] solution).
A large k1 and small k2 are necessary for attaining a high glucose yield; hence, we investigated the ratio of k1 to k2 (k1/k2). Using 0.05 M [Sbmim][HSO4] solutions at 160, 180, 190, and 200 °C, we obtained k1/k2 ratios of 1.0, 1.4, 1.7, and 1.7, which correspond to glucose yields of 37%, 43%, 48%, and 47%, respectively (Entries 1–4; Table 1). These results indicate that a high temperature results in a high k1/k2 ratio and thus a high glucose yield. As compared with temperature, the [Sbmim][HSO4] concentration exerts a smaller effect on k1/k2. As shown in Entries 1 and 5, k1/k2 ratios obtained with 0.05 and 1.00 M solutions at 160 °C were 1.0 and 1.1, respectively; the k1/k2 ratios obtained with 0.05 and 0.10 M solutions at 190 °C were both 1.7 (Entries 3 and 6). From these results, the improvement in glucose yield in the 0.05 M solution may be attributed to the high k1/k2 ratio due to high temperature.
The activation energy for hydrolysis of bagasse cellulose in the 0.05 M [Sbmim][HSO4] solution was 167 kJ/mol; this value is less than that for cellulose hydrolysis using a diluted H2SO4 solution (180 kJ/mol for Douglas fir [30] and 190 kJ/mol for corn stover [31]). For glucose decomposition in the 0.05 M [Sbmim][HSO4] solution, the activation energy was 144 kJ/mol; this value is greater than that obtained with a dilute H2SO4 solution (138 kJ/mol for Douglas fir [30] and 137 kJ/mol for corn stover [31]). The differences of the activation energies support that the present method is favorable to an increase in the yield.

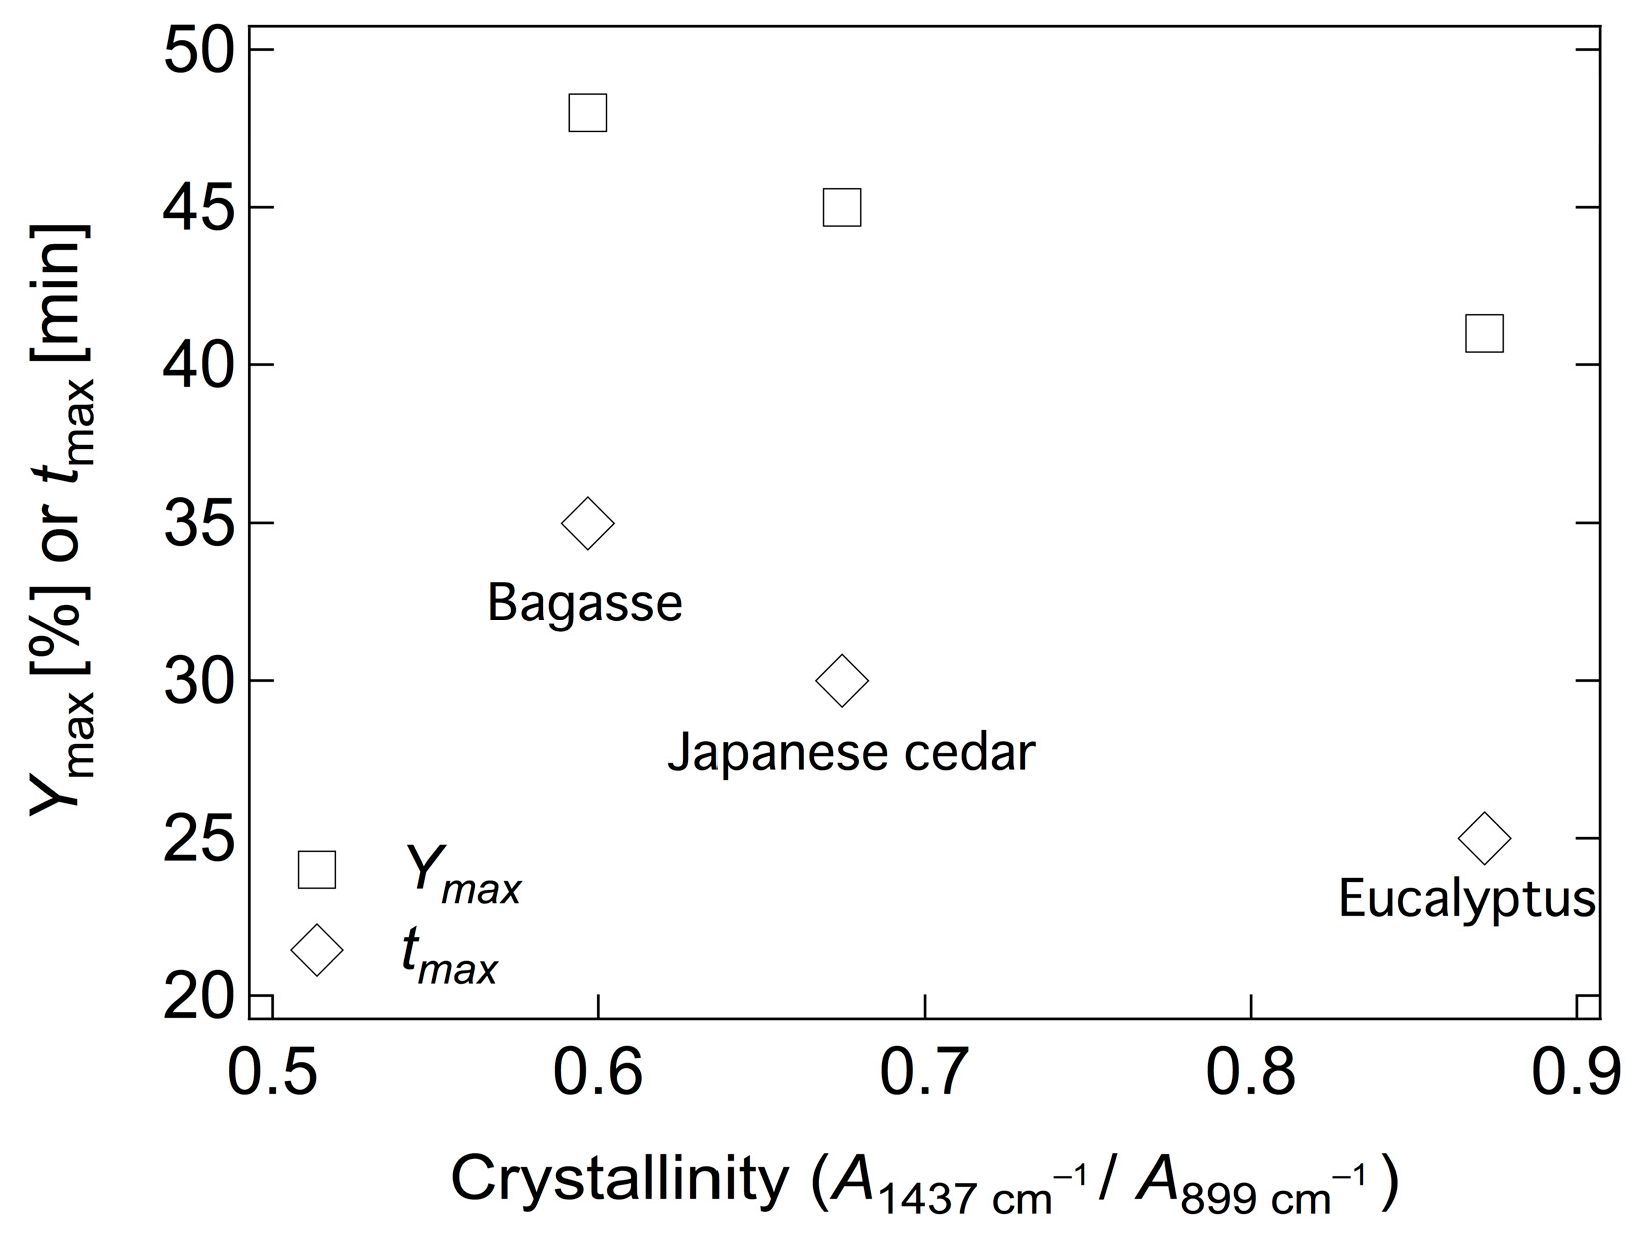
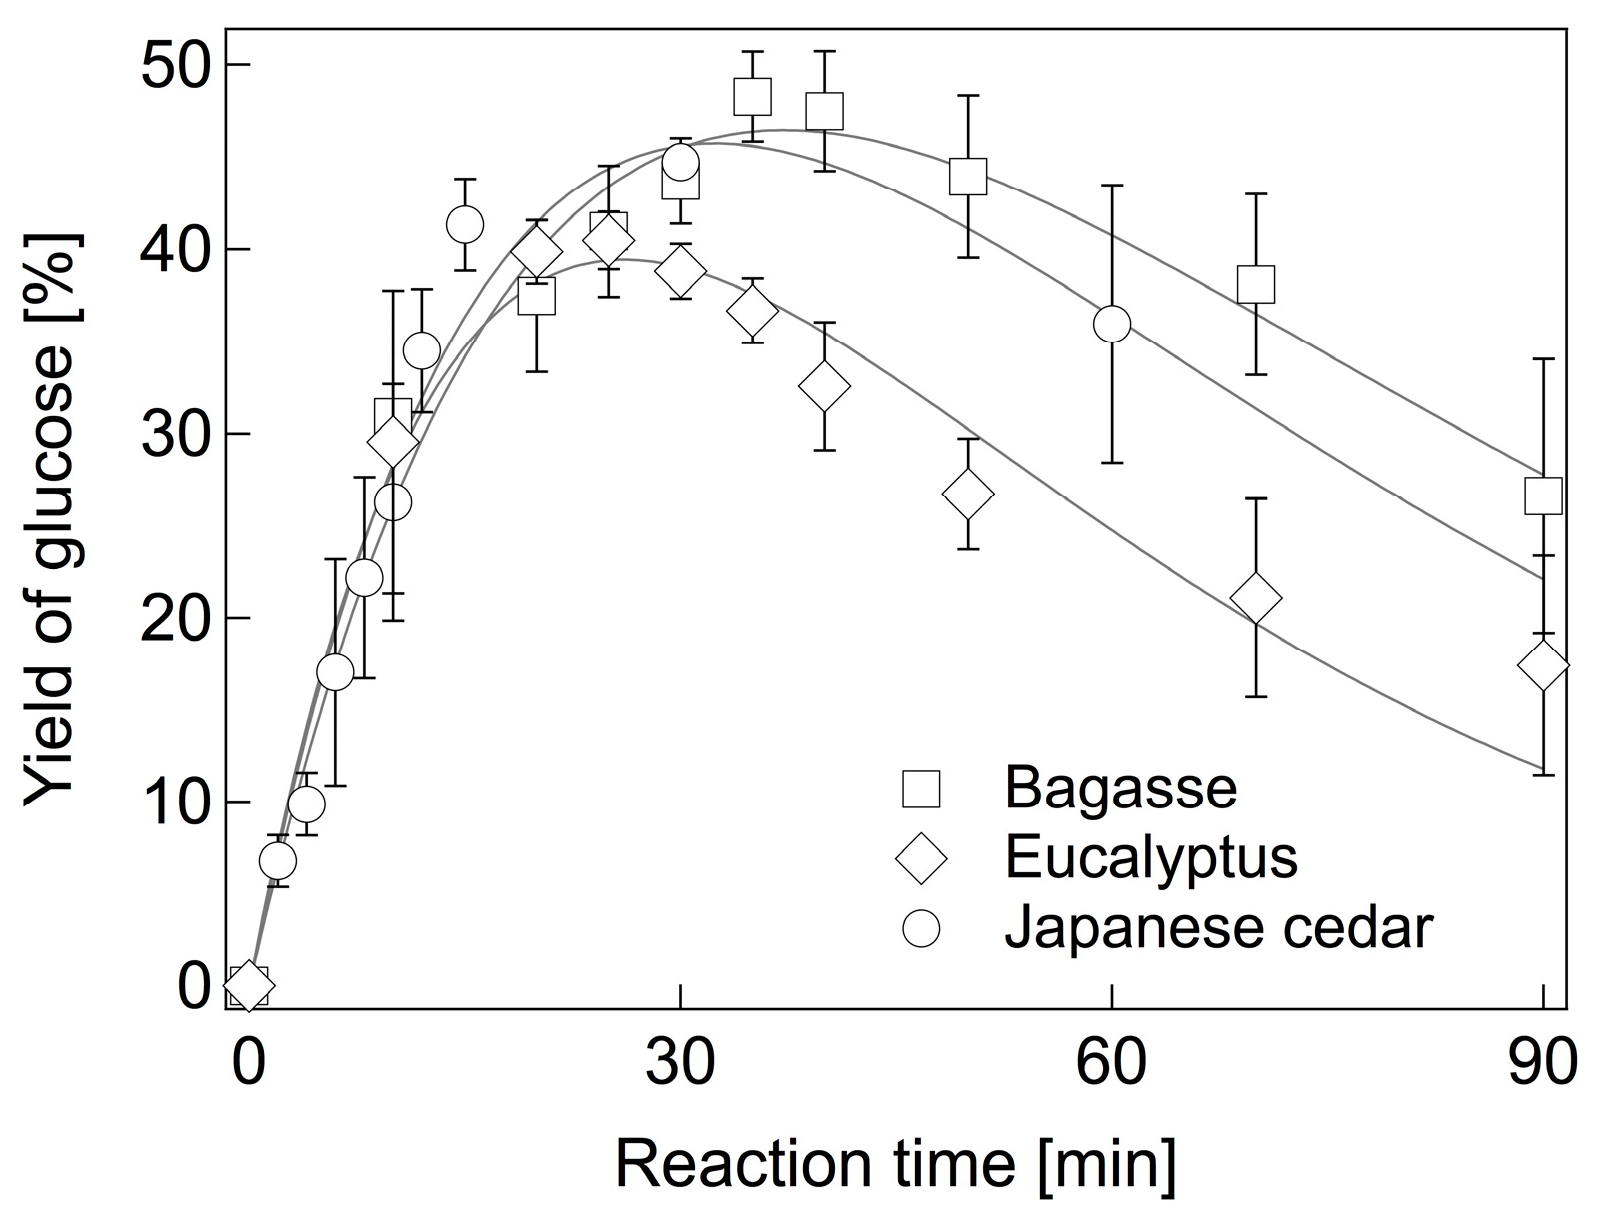
2.3. Hydrolysis of Various Biomass

To confirm the utility of the present method, we hydrolyzed hardwood and softwood samples, eucalyptus and Japanese cedar, respectively, in addition to bagasse. Because of their abundance and their suitability as biomass for glucose production, these materials have attracted significant interest. Figure 5 shows the time courses of the glucose yields during the hydrolysis of bagasse, eucalyptus, and Japanese cedar in the 0.05 M [Sbmim][HSO4] solutions at 190 °C. As mentioned above, bagasse hydrolysis had a peak yield of 48% at 35 min. With eucalyptus and Japanese cedar, glucose yields were 41% after 25 min and 45% after 30 min, respectively. Because lower glucose yields in 1.00 M [Sbmim][HSO4] solutions at 160 °C were obtained (37% for eucalyptus and 30% for Japanese cedar), the diluted [Sbmim][HSO4] solution was effective for the hydrolysis of various biomass sources.
Figure 5 also shows difference in the duration for which the maximum yield was achieved (tmax) and the maximum yields (Ymax), depending on the biomass sources. To investigate the reason behind these different values, we measured the crystallinity of biomass. The crystallinity was determined by Fourier transform infrared (FTIR) spectroscopy by calculating the ratio of absorbance at 1437 and 899 cm1, as reported by O’Connor et al. [32]. The ratio of absorbance was 0.60 (bagasse), 0.87 (Eucalyptus), and 0.67 (Japanese cedar). Figure 6 shows the relation between the crystallinity of the cellulose present in biomass and tmax and Ymax. As the crystallinity decreased, tmax and Ymax increased, indicating that the crystallinity of cellulose in biomass is confirmed to be a factor in resisting hydrolysis. It also indicates that a higher glucose yield is expected if pretreatments such as ball milling are applied.
FTIR measurements may also enable the prediction of tmax and Ymax. The prediction of tmax is particularly useful because excessively short and long reaction times result in a low yield.

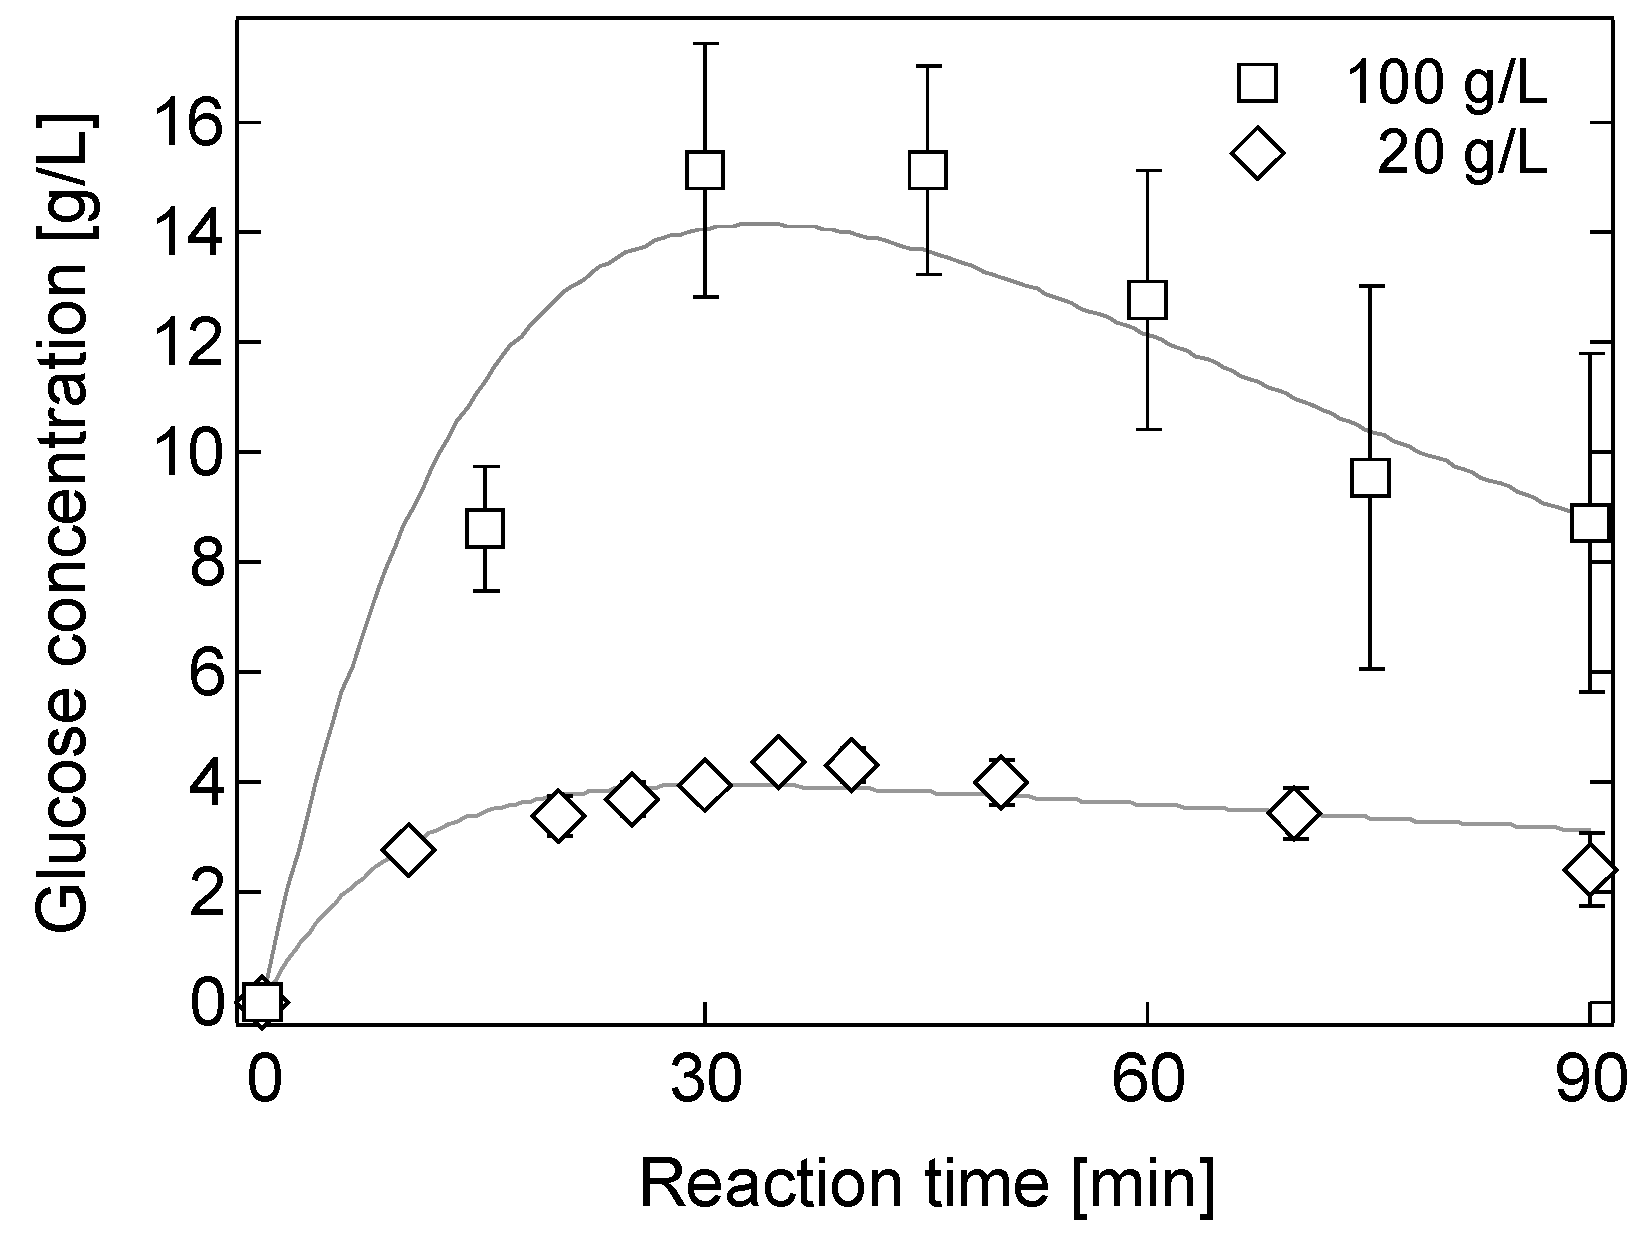
2.4. Effect of Biomass Loading on Hydrolysis

To efficiently utilize biomass, high loading is important. Hence, the loading of bagasse was increased from 20 to 100 g/L. Figure 7 shows the time courses of glucose concentrations during hydrolysis with 20 or 100 g/L bagasse using 0.05 M [Sbmim][HSO4] solutions at 190 °C. Even at 100 g/L loading, the glucose concentration increased within approximately 30 min, suggesting that hydrolysis proceeded despite the absorption of a major part of the [Sbmim][HSO4] solution by the bagasse particles (Table S1 shows photographs of solutions). With the 20 and 100 g/L solutions, the peak glucose concentrations were 4.4 and 15.2 g/L, respectively, corresponding to a 3.5-fold increase in concentration. It is noted that the 100 g/L solution produced a yield of 33%, and the value was less than that obtained with the 20 g/L solution (48%) (Figure S5). In addition, the tmax for both the 20 and 100 g/L solutions was around 30 min, indicating that the present method can process a high loading of biomass within this period.

3. Materials and Methods

3.1. Materials

Bagasse, eucalyptus, and Japanese cedar powder (particle diameter of approximately 3 mm) were purchased from Sanwa Ceruciron (Yokkaichi, Japan). First, the biomass powder was ground in a mill and then sieved to form a powder with a particle diameter of 250–500 μm. The cellulose content of the original lignocellulosic biomass was determined according to a reported method [33]. [Sbmim][HSO4] (Solvionic, Toulouse, France) was used as received. Escherichia coli (E. coli KO11, ATCC 55124) was purchased from Summit Pharmaceuticals International Corporation (Tokyo, Japan).

3.2. The Effect of [Sbmim][HSO4] on E. coli Growth

E. coli was aerobically precultured at 37 °C in a test tube containing 5 mL of medium (5 g/L yeast extract, 5 g/L NaCl, and 10 g/L tryptone; Nacalai Tesque, Kyoto, Japan). The precultured broth was transferred to 2 mL of the medium containing [Sbmim][HSO4]. The initial OD600 was set at 0.1. Each was incubated at 37 °C for 24 h on a reciprocal shaker at 160 rpm. The culture broth was then sampled at 6, 12, and 24 h, and the OD600 was measured.

3.3. Microwave-Assisted Hydrolysis of Biomass in an Aqueous [Sbmim][HSO4] Solution

Biomass (0.30 g) was suspended in [Sbmim][HSO4] solutions (15 mL), and the resulting mixture was then transferred to a 100 mL vessel (HPR-1000/10; Milestone s.r.l., Sorisole, Italy). The vessel was then heated in a microwave synthesizer (StartSYNTH; Milestone s.r.l.).
For sampling, the vessel was removed from the microwave system and immediately cooled in an ice bath to quench the reaction. An aliquot of the sample solution (500 μL) was centrifuged at 15,000 rpm for 2 min to precipitate the solids. The supernatant was filtered and then subjected to glucose analysis as described below.

3.4. Analysis of Glucose Yield

We evaluated the efficacy of hydrolysis by the glucose yield because cellulose is considerably difficult to hydrolyze due to its high crystallinity, as compared with hemicellulose. The glucose concentration in the hydrolyzate was determined using a high performance liquid chromatography equipped with a refractive index detector (Shimadzu Co., Kyoto, Japan). A sugar KS-801 column (Showa Denko K.K., Tokyo, Japan) was used in tandem with a sugar KS-G guard column (Showa Denko K.K.). The volume of the injected sample was 10 μL. The column was operated at 80 °C, and ultrapure water was used as the mobile phase (a flow rate of 1.0 mL/min).

3.5. Determination of Reaction Rate Constants

During acid hydrolysis, cellulose is hydrolyzed to glucose, which is then decomposed. Hydrolysis and decomposition of cellulose may be described by the pseudo-homogeneous consecutive first-order reactions [30]:
Cellulose   k 1   Glucose   k 2   Decomposition   product
where k1 and k2 represent the rate constants for the hydrolysis of cellulose to glucose and for the decomposition of glucose, respectively. The glucose concentration, Cglucose, is expressed as follows:
C glucose = a   k 1 k 2 k 1 [ e k 1 t e k 2 t ]
where the initial cellulose concentration is expressed as glucose equivalents. The reaction rate constants, k1 and k2, were determined by fitting Equation (2) to the experimental data according to the nonlinear least-squares method by using Igor Pro software (WaveMetrics, Inc., Portland, OR, USA).

4. Conclusions

In this study, cellulose present in lignocellulosic biomass was hydrolyzed by using a 0.05 M [Sbmim][HSO4] solution under microwave heating. The 0.05 M [Sbmim][HSO4] solution was sufficiently low to allow for the growth of E. coli. The glucose yield during hydrolysis in the 0.05 M solution (48%) was higher than that obtained in the 1.00 M [Sbmim][HSO4] solution (40%), under the optimized conditions. The higher yield was attributed to a high k1/k2 ratio due to the maximum temperatures applicable to the 1.00 M and 0.05 M solutions, namely 160 °C and 190 °C, respectively. The dilute [Sbmim][HSO4] solution was also applicable to softwood and hardwood, which is more recalcitrant than herbaceous biomass. The yield at 190 °C was 41% for eucalyptus and 45% for Japanese cedar.

Supplementary Materials

The following are available online at www.mdpi.com/2073-4344/7/4/108/s1, Figure S1: Time courses of OD600 of a pure medium during culturing E. coli, Figure S2: time courses of OD600 of 1-ethyl-3-methylimidazolium acetate/medium mixed solutions during culturing E. coli, Figure S3: Time courses of OD600 of H2SO4/medium mixed solutions during culturing E. coli, Figure S4: time course of glucose yield during bagasse hydrolysis in the 0.05 M [Sbmim][HSO4] solution at 180 °C, Figure S5: Time courses of glucose yields during hydrolysis of 20 and 100 g/L bagasse solutions in the 0.05 M [Sbmim] [HSO4] solutions at 190 °C, Table S1: photographs of the [Sbmim][HSO4] solutions with different bagasse loadings.

Acknowledgments

This research was supported in part by the Center of Innovation (COI) program “Construction of next-generation infrastructure using innovative materials–Realization of a safe and secure society that can coexist with the Earth for centuries,” the Advanced Low Carbon Technology Research and Development Program (ALCA) (No. 2100040 to K.T.), and the Cross-Ministerial Strategic Innovation Promotion Program (SIP) by JST. This study was also partly supported by a Grant-in-Aid for Scientific Research from the Japan Society for the Promotion of Science.

Author Contributions

K.K., K. Takada, K.N., and K. Takahashi conceived and designed the experiments and thoroughly discussed the results and hypotheses; K.I., K.M. and H.S. performed the experiments; K.K. wrote the paper.

Conflicts of Interest

The authors declare no conflict of interest.

References

  1. Song, J.; Fan, H.; Ma, J.; Han, B. Conversion of Glucose and Cellulose into Value-Added Products in Water and Ionic Liquids. Green Chem. 2013, 15, 2619–2635. [Google Scholar] [CrossRef]
  2. Werpy, T.; Petersen, G. Top Value Added Chemicals From Biomass Volume I—Results of Screening for Potential Candidates from Sugars and Synthesis Gas; U.S. Department of Energy: Oak Ridge, TN, USA, 2004.
  3. Amarasekara, A.S.; Wiredu, B. Aryl Sulfonic Acid Catalyzed Hydrolysis of Cellulose in Water. Appl. Catal. A Gen. 2012, 417–418, 259–262. [Google Scholar] [CrossRef]
  4. Swatloski, R.P.; Spear, S.K.; Holbrey, J.D.; Rogers, R.D. Dissolution of Cellose with Ionic Liquids. J. Am. Chem. Soc. 2002, 124, 4974–4975. [Google Scholar] [CrossRef] [PubMed]
  5. Fukaya, Y.; Hayashi, K.; Wada, M.; Ohno, H. Cellulose Dissolution with Polar Ionic Liquids under Mild Conditions: Required Factors for Anions. Green Chem. 2008, 10, 44–46. [Google Scholar] [CrossRef]
  6. Fukaya, Y.; Sugimoto, A.; Ohno, H. Superior Solubility of Polysaccharides in Low Viscosity, Polar, and Halogen-Free 1,3-Dialkylimidazolium Formates. Biomacromolecules 2006, 7, 3295–3297. [Google Scholar] [CrossRef] [PubMed]
  7. Brandt, A.; Gräsvik, J.; Hallett, J.P.; Welton, T. Deconstruction of Lignocellulosic Biomass with Ionic Liquids. Green Chem. 2013, 15, 550–583. [Google Scholar] [CrossRef]
  8. Armand, M.; Endres, F.; MacFarlane, D.R.; Ohno, H.; Scrosati, B. Ionic-Liquid Materials for the Electrochemical Challenges of the Future. Nat. Mater. 2009, 8, 621–629. [Google Scholar] [CrossRef] [PubMed]
  9. Kilpeläinen, I.; Xie, H.; King, A.; Granstrom, M.; Heikkinen, S.; Argyropoulos, D.S. Dissolution of Wood in Ionic Liquids. J. Agric. Food Chem. 2007, 55, 9142–9148. [Google Scholar] [CrossRef] [PubMed]
  10. Ninomiya, K.; Kamide, K.; Takahashi, K.; Shimizu, N. Enhanced Enzymatic Saccharification of Kenaf Powder after Ultrasonic Pretreatment in Ionic Liquids at Room Temperature. Bioresour. Technol. 2012, 103, 259–265. [Google Scholar] [CrossRef] [PubMed]
  11. Ninomiya, K.; Ohta, A.; Omote, S.; Ogino, C.; Takahashi, K.; Shimizu, N. Combined Use of Completely Bio-Derived Cholinium Ionic Liquids and Ultrasound Irradiation for the Pretreatment of Lignocellulosic Material to Enhance Enzymatic Saccharification. Chem. Eng. J. 2013, 215, 811–818. [Google Scholar] [CrossRef]
  12. Ninomiya, K.; Kohori, A.; Tatsumi, M.; Osawa, K.; Endo, T.; Kakuchi, R.; Ogino, C.; Shimizu, N.; Takahashi, K. Ionic Liquid/Ultrasound Pretreatment and in Situ Enzymatic Saccharification of Bagasse Using Biocompatible Cholinium Ionic Liquid. Bioresour. Technol. 2015, 176, 169–174. [Google Scholar] [CrossRef] [PubMed]
  13. Dadi, A.P.; Varanasi, S.; Schall, C.A. Enhancement of Cellulose Saccharification Kinetics Using an Ionic Liquid Pretreatment Step. Biotechnol. Bioeng. 2006, 95, 904–910. [Google Scholar] [CrossRef] [PubMed]
  14. Kamiya, N.; Matsushita, Y.; Hanaki, M.; Nakashima, K.; Narita, M.; Goto, M.; Takahashi, H. Enzymatic in Situ Saccharification of Cellulose in Aqueous-Ionic Liquid Media. Biotechnol. Lett. 2008, 30, 1037–1040. [Google Scholar] [CrossRef] [PubMed]
  15. Shi, J.; Balamurugan, K.; Parthasarathi, R.; Sathitsuksanoh, N.; Zhang, S.; Stavila, V.; Subramanian, V.; Simmons, B.A.; Singh, S. Understanding the Role of Water During Ionic Liquid Pretreatment of Lignocellulose: Co-Solvent or Anti-Solvent? Green Chem. 2014, 16, 3830–3840. [Google Scholar] [CrossRef]
  16. Cole, A.C.; Jensen, J.L.; Ntai, I.; Tran, K.L.T.; Weaver, K.J.; Forbes, D.C.; Davis, J.H. Novel Brønsted Acidic Ionic Liquids and Their Use as Dual Solvent−Catalysts. J. Am. Chem. Soc. 2002, 124, 5962–5963. [Google Scholar] [CrossRef] [PubMed]
  17. Zhao, G.; Jiang, T.; Gao, H.; Han, B.; Huang, J.; Sun, D. Mannich Reaction Using Acidic Ionic Liquids as Catalysts and Solventselectronic. Green Chem. 2004, 6, 75–77. [Google Scholar] [CrossRef]
  18. Joseph, T.; Sahoo, S.; Halligudi, S.B. Brönsted Acidic Ionic Liquids: A Green, Efficient and Reusable Catalyst System and Reaction Medium for Fischer Esterification. J. Mol. Catal. A Chem. 2005, 234, 107–110. [Google Scholar] [CrossRef]
  19. Han, X.-X.; Du, H.; Hung, C.-T.; Liu, L.-L.; Wu, P.-H.; Ren, D.-H.; Huang, S.-J.; Liu, S.-B. Syntheses of Novel Halogen-Free Brønsted–Lewis Acidic Ionic Liquid Catalysts and Their Applications for Synthesis of Methyl Caprylate. Green Chem. 2015, 17, 499–508. [Google Scholar] [CrossRef]
  20. Kuroda, K.; Miyamura, K.; Satria, H.; Takada, K.; Ninomiya, K.; Takahashi, K. Hydrolysis of Cellulose Using an Acidic and Hydrophobic Ionic Liquid and Subsequent Separation of Glucose Aqueous Solution from the Ionic Liquid and 5-(Hydroxymethyl)Furfural. ACS Sustain. Chem. Eng. 2016, 4, 3352–3356. [Google Scholar] [CrossRef]
  21. Amarasekara, A.S.; Wiredu, B. Degradation of Cellulose in Dilute Aqueous Solutions of Acidic Ionic Liquid 1-(1-Propylsulfonic)-3-Methylimidazolium Chloride, and P-Toluenesulfonic Acid at Moderate Temperatures and Pressures. Ind. Eng. Chem. Res. 2011, 50, 12276–12280. [Google Scholar] [CrossRef]
  22. Kuroda, K.; Inoue, K.; Miyamura, K.; Takada, K.; Ninomiya, K.; Takahashi, K. Enhanced Hydrolysis of Lignocellulosic Biomass Assisted by a Combination of Acidic Ionic Liquids and Microwave Heating. J. Chem. Eng. Jpn. 2016, 49, 809–813. [Google Scholar] [CrossRef]
  23. Martínez-Palou, R. Ionic Liquid and Microwave-Assisted Organic Synthesis: A “Green” and Synergic Couple. J. Mex. Chem. Soc. 2007, 51, 252–264. [Google Scholar]
  24. Hoffmann, J.; Nüchter, M.; Ondruschka, B.; Wasserscheid, P. Ionic Liquids and Their Heating Behaviour during Microwave Irradiation—A State of the Art Report and Challenge to Assessment. Green Chem. 2003, 5, 296–299. [Google Scholar] [CrossRef]
  25. Guerrero-Sanchez, C.; Hoogenboom, R.; Schubert, U.S. Fast and “Green” Living Cationic Ring Opening Polymerization of 2-Ethyl-2-Oxazoline in Ionic Liquids under Microwave Irradiation. Chem. Commun. 2006, 36, 3797–3799. [Google Scholar] [CrossRef] [PubMed]
  26. Zhao, D.; Liao, Y.; Zhang, Z. Toxicity of Ionic Liquids. CLEAN Soil Air Water 2007, 35, 42–48. [Google Scholar] [CrossRef]
  27. Lim, G.S.; Zidar, J.; Cheong, D.W.; Jaenicke, S.; Klähn, M. Impact of Ionic Liquids in Aqueous Solution on Bacterial Plasma Membranes Studied with Molecular Dynamics Simulations. J. Phys. Chem. B 2014, 118, 10444–10459. [Google Scholar] [CrossRef] [PubMed]
  28. Couling, D.J.; Bernot, R.J.; Docherty, K.M.; Dixon, J.K.; Maginn, E.J. Assessing the Factors Responsible for Ionic Liquid Toxicity to Aquatic Organisms via Quantitative Structure-Property Relationship Modeling. Green Chem. 2006, 8, 82–90. [Google Scholar] [CrossRef]
  29. Pernak, J.; Sobaszkiewicz, K.; Mirska, I. Anti-Microbial Activities of Ionic Liquids. Green Chem. 2003, 5, 52–56. [Google Scholar] [CrossRef]
  30. Saeman, J.F. Kinetics of Wood Saccharification—Hydrolysis of Cellulose and Decomposition of Sugars in Dilute Acid at High Temperature. Ind. Eng. Chem. 1945, 37, 43–52. [Google Scholar] [CrossRef]
  31. Bhandari, N.; Macdonald, D.G.; Bakhshi, N.N. Kinetic Studies of Corn Stover Saccharification Using Sulphuric Acid. Biotechnol. Bioeng. 1984, 26, 320–327. [Google Scholar] [CrossRef] [PubMed]
  32. O’Connor, R.T.; DuPré, E.F.; Mitcham, D. Applications of Infrared Absorption Spectroscopy to Investigations of Cotton and Modified Cottons: Part I: Physical and Crystalline Modifications and Oxidation. Text. Res. J. 1958, 28, 382–392. [Google Scholar] [CrossRef]
  33. Suliter, A.; Hames, B.; Ruiz, R.; Scarlata, C.; Sluiter, J.; Templeton, D.; Crocker, D. Determination of Structural Carbohydrates and Lignin in Biomass; Technical Report; National Renewable Energy Laboratory: Golden, CO, USA, 2008.
Figure 1. The structure of [Sbmim][HSO4].
Catalysts 07 00108 g001
Figure 2. Time course of OD600 of [Sbmim][HSO4]/medium mixed solutions during E. coli culturing.
Catalysts 07 00108 g002
Figure 3. Time courses of glucose yields during bagasse hydrolysis in 1.00 and 0.05 M [Sbmim][HSO4] solutions at 160 °C.
Catalysts 07 00108 g003
Figure 4. Time courses of glucose yields during the hydrolysis of bagasse in the 0.05 M [Sbmim][HSO4] solution at 190 and 200 °C.
Catalysts 07 00108 g004
Figure 5. Time courses of glucose yields during the hydrolysis of bagasse, eucalyptus, and Japanese cedar in the 0.05 M [Sbmim][HSO4] solutions at 190 °C.
Catalysts 07 00108 g005
Figure 6. Relationship between the crystallinity of biomass and Ymax (square) and tmax (diamond).
Catalysts 07 00108 g006
Figure 7. Time courses of glucose concentrations during hydrolysis of 20 and 100 g/L bagasse solutions in the 0.05 M [Sbmim][HSO4] solutions at 190 °C.
Catalysts 07 00108 g007
Table 1. k1, k2, k1/k2, and glucose yield of the samples hydrolyzed in [Sbmim][HSO4] solutions.
EntryTemperature (°C)Concentration (M)k1 (min−1)k2 (min−1)k1/k2Yield (%)
11600.051.8 × 10−30.17 × 10−21.037
21800.052.3 × 10−21.7 × 10−21.443
31900.053.4 × 10−22.1 × 10−21.748
42000.059.6 × 10−25.7 × 10−21.747
51601.008.4 × 10−27.5 × 10−21.140
61900.109.8 × 10−25.9 × 10−21.750

