
A Study of Low-Temperature CO Oxidation over Mesoporous CuO-TiO2 Nanotube Catalysts


1
Department of Chemistry and Earth Sciences, College of Arts and Sciences, Qatar University, Doha 2713, Qatar
2
Energy Materials Laboratory (EML), School of Sciences and Engineering, the American University in Cairo, New Cairo 11835, Egypt
*
Author to whom correspondence should be addressed.
†
Permanent address: National Institute of Laser Enhanced Science, Cairo University, Giza 12613, Egypt.
Catalysts 2017, 7(5), 129; https://doi.org/10.3390/catal7050129
Submission received: 5 April 2017
/
Revised: 20 April 2017
/
Accepted: 21 April 2017
/
Published: 28 April 2017
(This article belongs to the Special Issue Heterogeneous Catalysis for Environmental Remediation)
Abstract
:Supported copper oxide nanoparticles have attracted considerable attention as active and non-precious catalysts for many catalytic oxidation reactions. Herein, mesoporous xCuO-TiO2 nanotube catalysts were fabricated, and their activity and kinetics toward CO oxidation were studied. The morphology and structure of the prepared catalysts were systematically studied using SEM, TEM, EDS, EDX, XRD, TGA, BET, XPS, H2-TPR, and Raman techniques. The BET surface area study revealed the effect of the large surface area of the mesoporous TiO2 nanotubes on promoting the catalytic activity of prepared catalysts. The results also revealed the existence of strong metal-support interactions in the CuO-TiO2 nanotube catalyst, as indicated by the up-shift of the E2g vibrational mode of TiO2 from 144 cm−1 to 145 cm−1 and the down-shift of the binding energy (BE) of Ti 2p3/2 from 458.3 eV to 458.1 eV. The active phase of the catalyst consists of fine CuO nanoparticles dispersed on a mesoporous anatase TiO2 nanotube support. The 50-CuO-TiO2 nanotube catalyst demonstrated the highest catalytic activity with 100% CO conversion at T100 = 155 °C and a reaction rate of 36 µmole s−1 g−1. Furthermore, the catalyst demonstrated excellent long-term stability with complete CO conversion that was stable for 60 h under a continuous stream. The enhanced catalytic activity is attributed to the interplay at the interface between the active CuO phase and the TiO2 nanotubes support.

1. Introduction
The heterogeneous catalytic oxidation of carbon monoxide (CO) is an important reaction for CO removal in many environmental and industrial applications such as air purification, closed-cycle CO2 lasers, the purification of hydrogen from CO traces in polymer electrolyte membrane fuel cell systems [1], and the removal of toxic CO from flue and exhaust gas emissions [2,3]. Precious noble metals such as Ru, Pt, Au, and Pd supported on reducible metal oxides are known for their high catalytic activity for CO oxidation. However, they are expensive and their activity is subject to deactivation, particularly at high temperatures due to the sintering of particles [4]. Therefore, there is a great need to develop non-expensive, active, and durable catalysts for catalytic CO oxidation at low temperatures. TiO2 is an important reducible oxide material that is widely used as a catalyst-support in various heterogeneous catalytic reactions [5,6,7,8]. Of particular interest, supported Cu nanoparticles have attracted considerable attention for many catalytic oxidation reactions including CO oxidation owing to their low cost and significant catalytic activity [9,10,11,12,13,14,15]. For example, Anil et al. [9] have shown that Cu-doping increases the catalytic activity of Mn3O4 for CO oxidation. Chen et al. [15] have shown that the interaction between Cu and the Ti3+ species in rutile TiO2 can enhance the turnover rate for CO oxidation. Studies have shown that the activation energies for CO oxidation strongly depend on the metal oxidation state, the metal-support interactions, and the amount of oxygen vacancies [13,15,16]. In order to understand the promoting effect of Cu content on the catalytic activity of the TiO2 nanotubes support, a series of xCuO-TiO2 nanotube catalysts with x = 2–65 wt % were prepared and evaluated for CO oxidation. We demonstrated the influence of CuO modification in the increased metal-support interactions in the CuO-TiO2 nanotube catalysts, which could increase the catalytic activity for CO conversion due to the synergy between active CuO and TiO2 entities at the interface.
2. Results and Discussion
2.1. Morphology and Elements Distribution
Titanium dioxide nanotubes with different microstructures and surface morphologies can be synthesized by various techniques such as rapid anodic oxidation [17], template-assisted growth [18], and the hydrothermal method [19]. Of particular interest, the hydrothermal treatment method has received great attention owing to the fairly simple synthesis, low cost processing, chemical versatility, and scalability [19,20,21,22,23]. Figure 1 shows the SEM images of precursor anatase TiO2 particles (Figure 1a), pristine TiO2 nanotubes prepared by hydrothermal treatment at 140 °C for 48 h with subsequent acid treatment in diluted HCl aqueous solution to pH 6 (Figure 1b), and the CuO-TiO2 nanotubes (Figure 1c,d). The TEM images of TiO2 before and after the CuO modification are shown in Figure 2. The TiO2 exhibits multi-walled nanotubular morphology with open-ends, an average length of 500 nm, and an average diameter of 10 nm (Figure 2a).
Figure 3 shows the Energy-dispersive X-ray spectroscopy (EDS) elemental mapping (Figure 3a–e) and elemental analysis (Figure 3f) of CuO-TiO2 NT catalysts prepared by the hydrothermal method and followed by deposition precipitation. The EDS mapping (Figure 3a–c) reveals that those CuO nanoparticles are highly dispersed on the TiO2 NT support. The EDX analysis (Figure 3f) indicates a 1:1 at % of Cu:Ti, which confirms the nominal Cu content and the homogenous distribution of the CuO on the TiO2 NT support. It can also be seen that the Na ratio for the acid treated TiO2 nanotubes is ca. 0.02. The low Na ratio can be attributed to the replacement of Na+ with H+ during the acid rinse [22].
2.2. The Crystal Structure and Thermal Stability
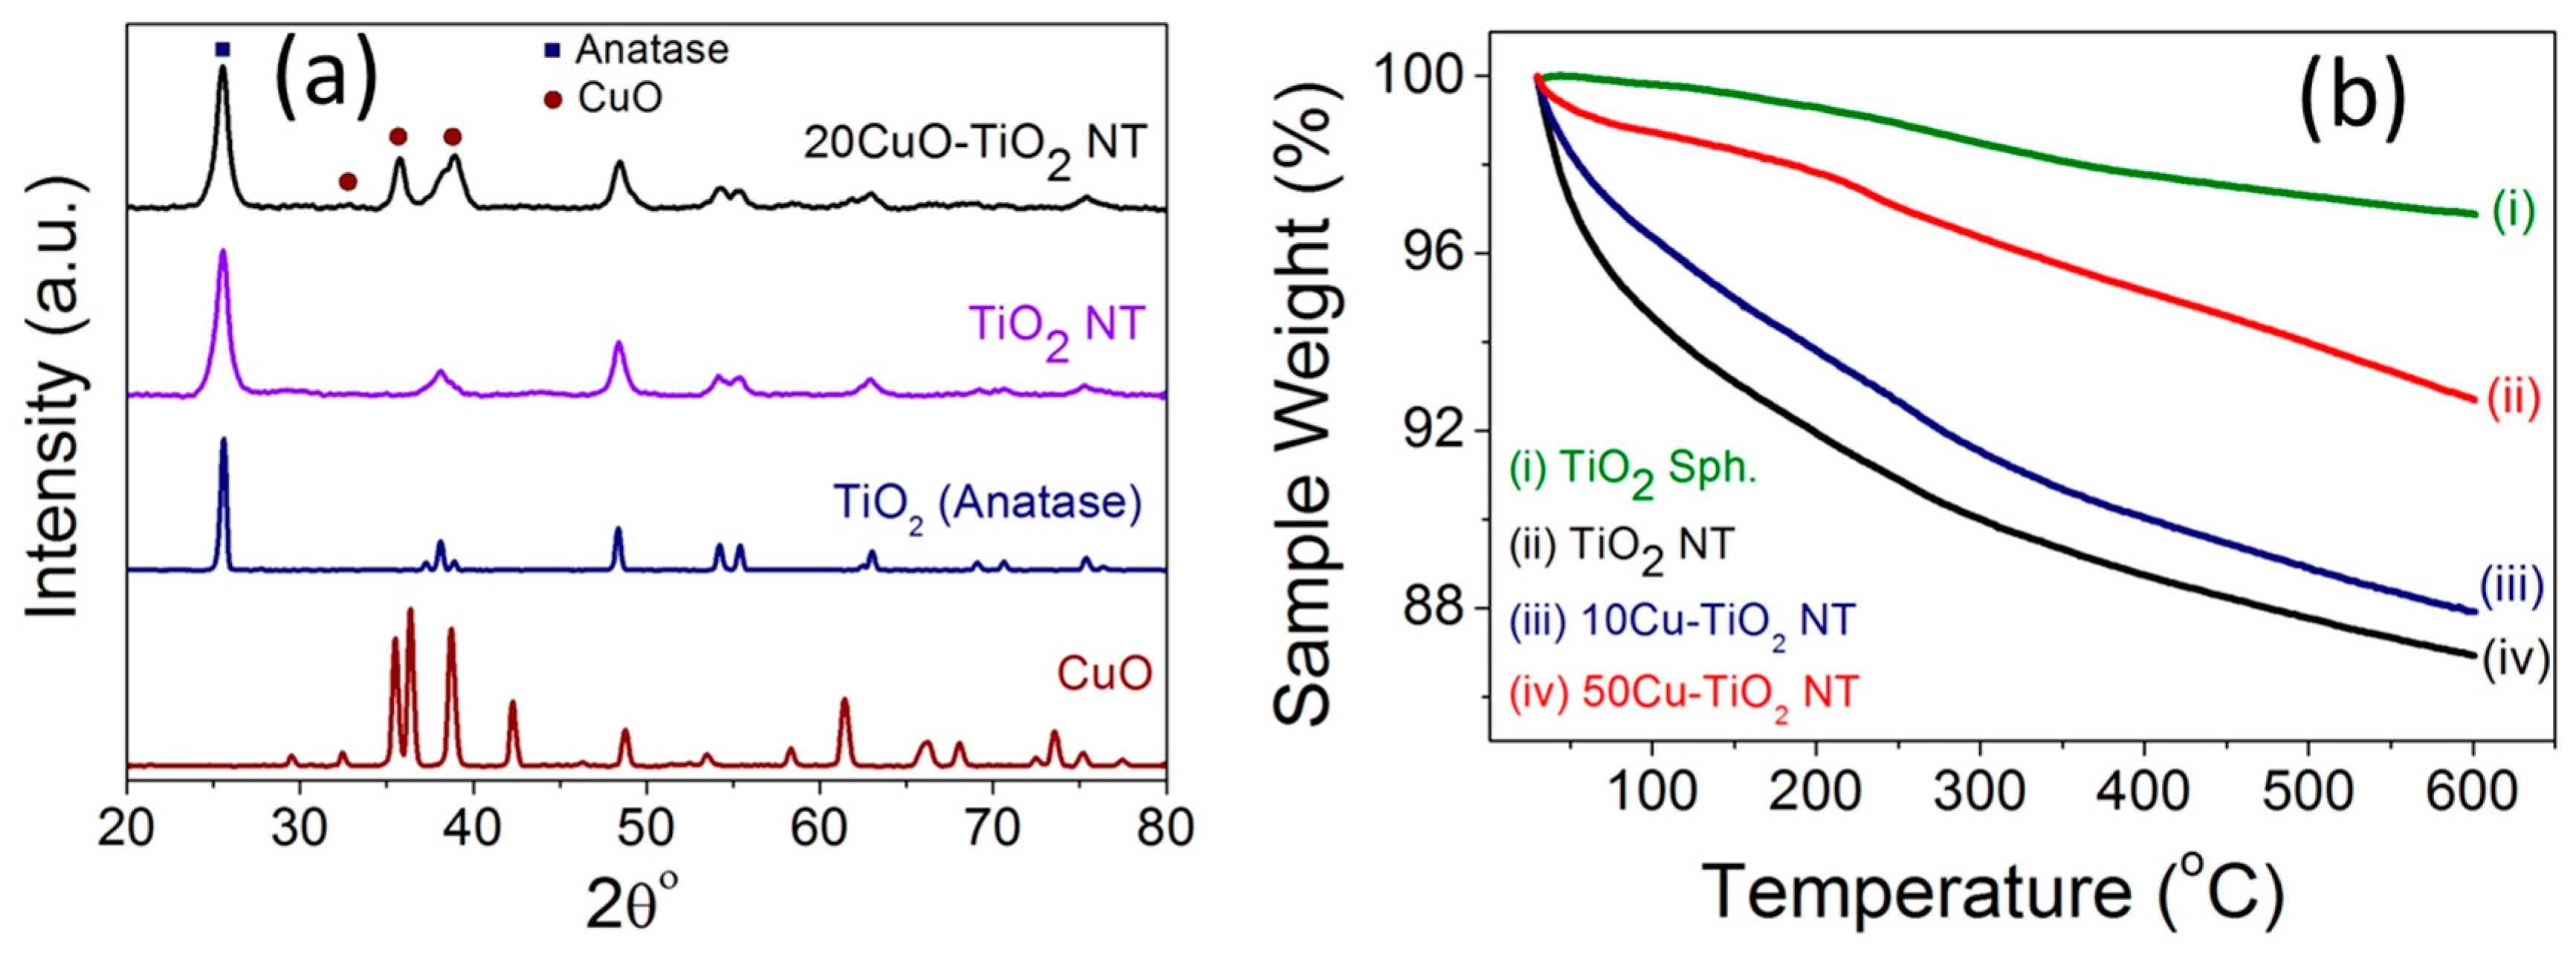
Figure 4a compares the XRD patterns of pristine TiO2 NTs and 20CuO-TiO2 NTs with the counterpart CuO and the precursor anatase TiO2 particles. The diffraction pattern of the TiO2 NTs exhibits diffraction peaks at 25.3° (101), 38.1° (112), 48.4° (200), 54.1° (105), 55.3° (211), and 62.8° (204), typical of anatase phase as correlated with (Card JCPDS No. 01-071-1166) [24].
For the CuO-TiO2 NT catalysts, the XRD patterns of the catalysts with CuO content up to 5 wt % do not show diffraction peaks of copper oxide phase and only the anatase phase of TiO2 is observed (Figure S1). A similar behavior was reported for CuO-incorporated TiO2 samples with less than 3% Cu species content [25]. The XRD patterns of the CuO-TiO2 NT catalysts with a Cu content larger than 5 wt % (Figure 4a and Figure S1) exhibit diffraction peaks at 35.5° (−111) and 38.6° (111), characteristic of CuO phase in correlation with the reference pattern of tenorite CuO (Card JCPDS No. 00-001-1117) and that reported in the literature for monoclinic phase CuO [26,27,28]. The strong diffraction peaks of all samples indicate the purity and high crystalline nature of the TiO2 and CuO phases in the different xCuO-TiO2 NT catalysts.
The thermal gravimetric (TGA) graphs of the anatase TiO2, pristine TiO2 NTs, 10CuO-TiO2 NT, and 50CuO-TiO2 NT catalysts are compared in Figure 4b. The TiO2 NTs possessed a weight loss of ~12% upon heating to 600 °C, compared to ~3% weight loss in case of the precursor TiO2 particles. This weight loss in the case of TiO2 NTs is attributed to space shrinkage due to the dehydration of the water located in the interlayer spacing and that adsorbed on the TiO2 NTs surface at temperatures lower than 300 °C, as well as the dehydration of the interlayered OH groups [29,30]. On the other hand, the CuO-TiO2 NTs demonstrated a higher thermal stability compared to the pristine TiO2 NTs support, with a weight loss of about 8% and 4% for the 10CuO-TiO2 NT and 50CuO-TiO2 NT catalysts, respectively. The increased heating tolerance of the TiO2 nanotubes modified with CuO nanoparticles can be attributed to the reduction of the total number of OH groups hydrated in the interlayers of the TiO2 NTs, since Cu is hydrated with fewer OH groups relative to those hydrated at the Ti surface [31].
2.3. Surface Properties
Figure 5a–c displays the multipoint BET nitrogen gas adsorption-desorption isotherms of precursor TiO2 particles, pristine TiO2 NTs, and a series of xCuO-TiO2 NT catalysts with different Cu loading (x). Overall, the TiO2 NTs and the different xCuO-TiO2 NT catalysts exhibit type-IV isotherms with a distinct hysteresis loop in the range of 0.65–1.0 relative pressure, typical of mesoporous structured materials [24,32]. The BET surface area of TiO2 increased from 10 m2/g in the case of the precursor TiO2 spherical particles, to 183 m2/g for the TiO2 NTs prepared by the hydrothermal treatment at 140 °C for 48 h. This indicates that the tubular morphology enlarged the surface area of the support material due to the contribution from the interstice and the internal space of the TiO2 NTs [22]. The surface area of 183 m2/g obtained for TiO2 NTs is a little lower than that reported for TiO2 NTs by Nakahira et al. [22], but is similar to the value reported for defective TiO2 (188 m2/g) by Shah et al. [24]. For xCuO-TiO2 NT catalysts, there is no significant change in the shape of the adsorption-desorption isotherms from that of the pristine TiO2 NTs, but there is a change in the BET surface area. The BET surface area of the different xCuO-TiO2 NT catalysts is lower than that of the pristine TiO2 NTs and the BET surface area decreases when increasing the Cu loading ratio (Figure 5d and Table 1). The decrease in the BET surface area of TiO2 NTs upon modification with CuO is attributed to the occupation of the porous features with CuO nanoparticles, in agreement with the literature [28,33]. Unlike the decrease of the BET surface area, there is no significant change in the corresponding average pore size (21–23 nm) when increasing the Cu loading (Table 1). This behavior is in agreement with the literature [28] and indicates that the mesoporous nature of the xCuO-TiO2 NT catalysts did not significantly change, which makes them suitable for various catalytic applications based on their porous structure.
2.4. Valence States
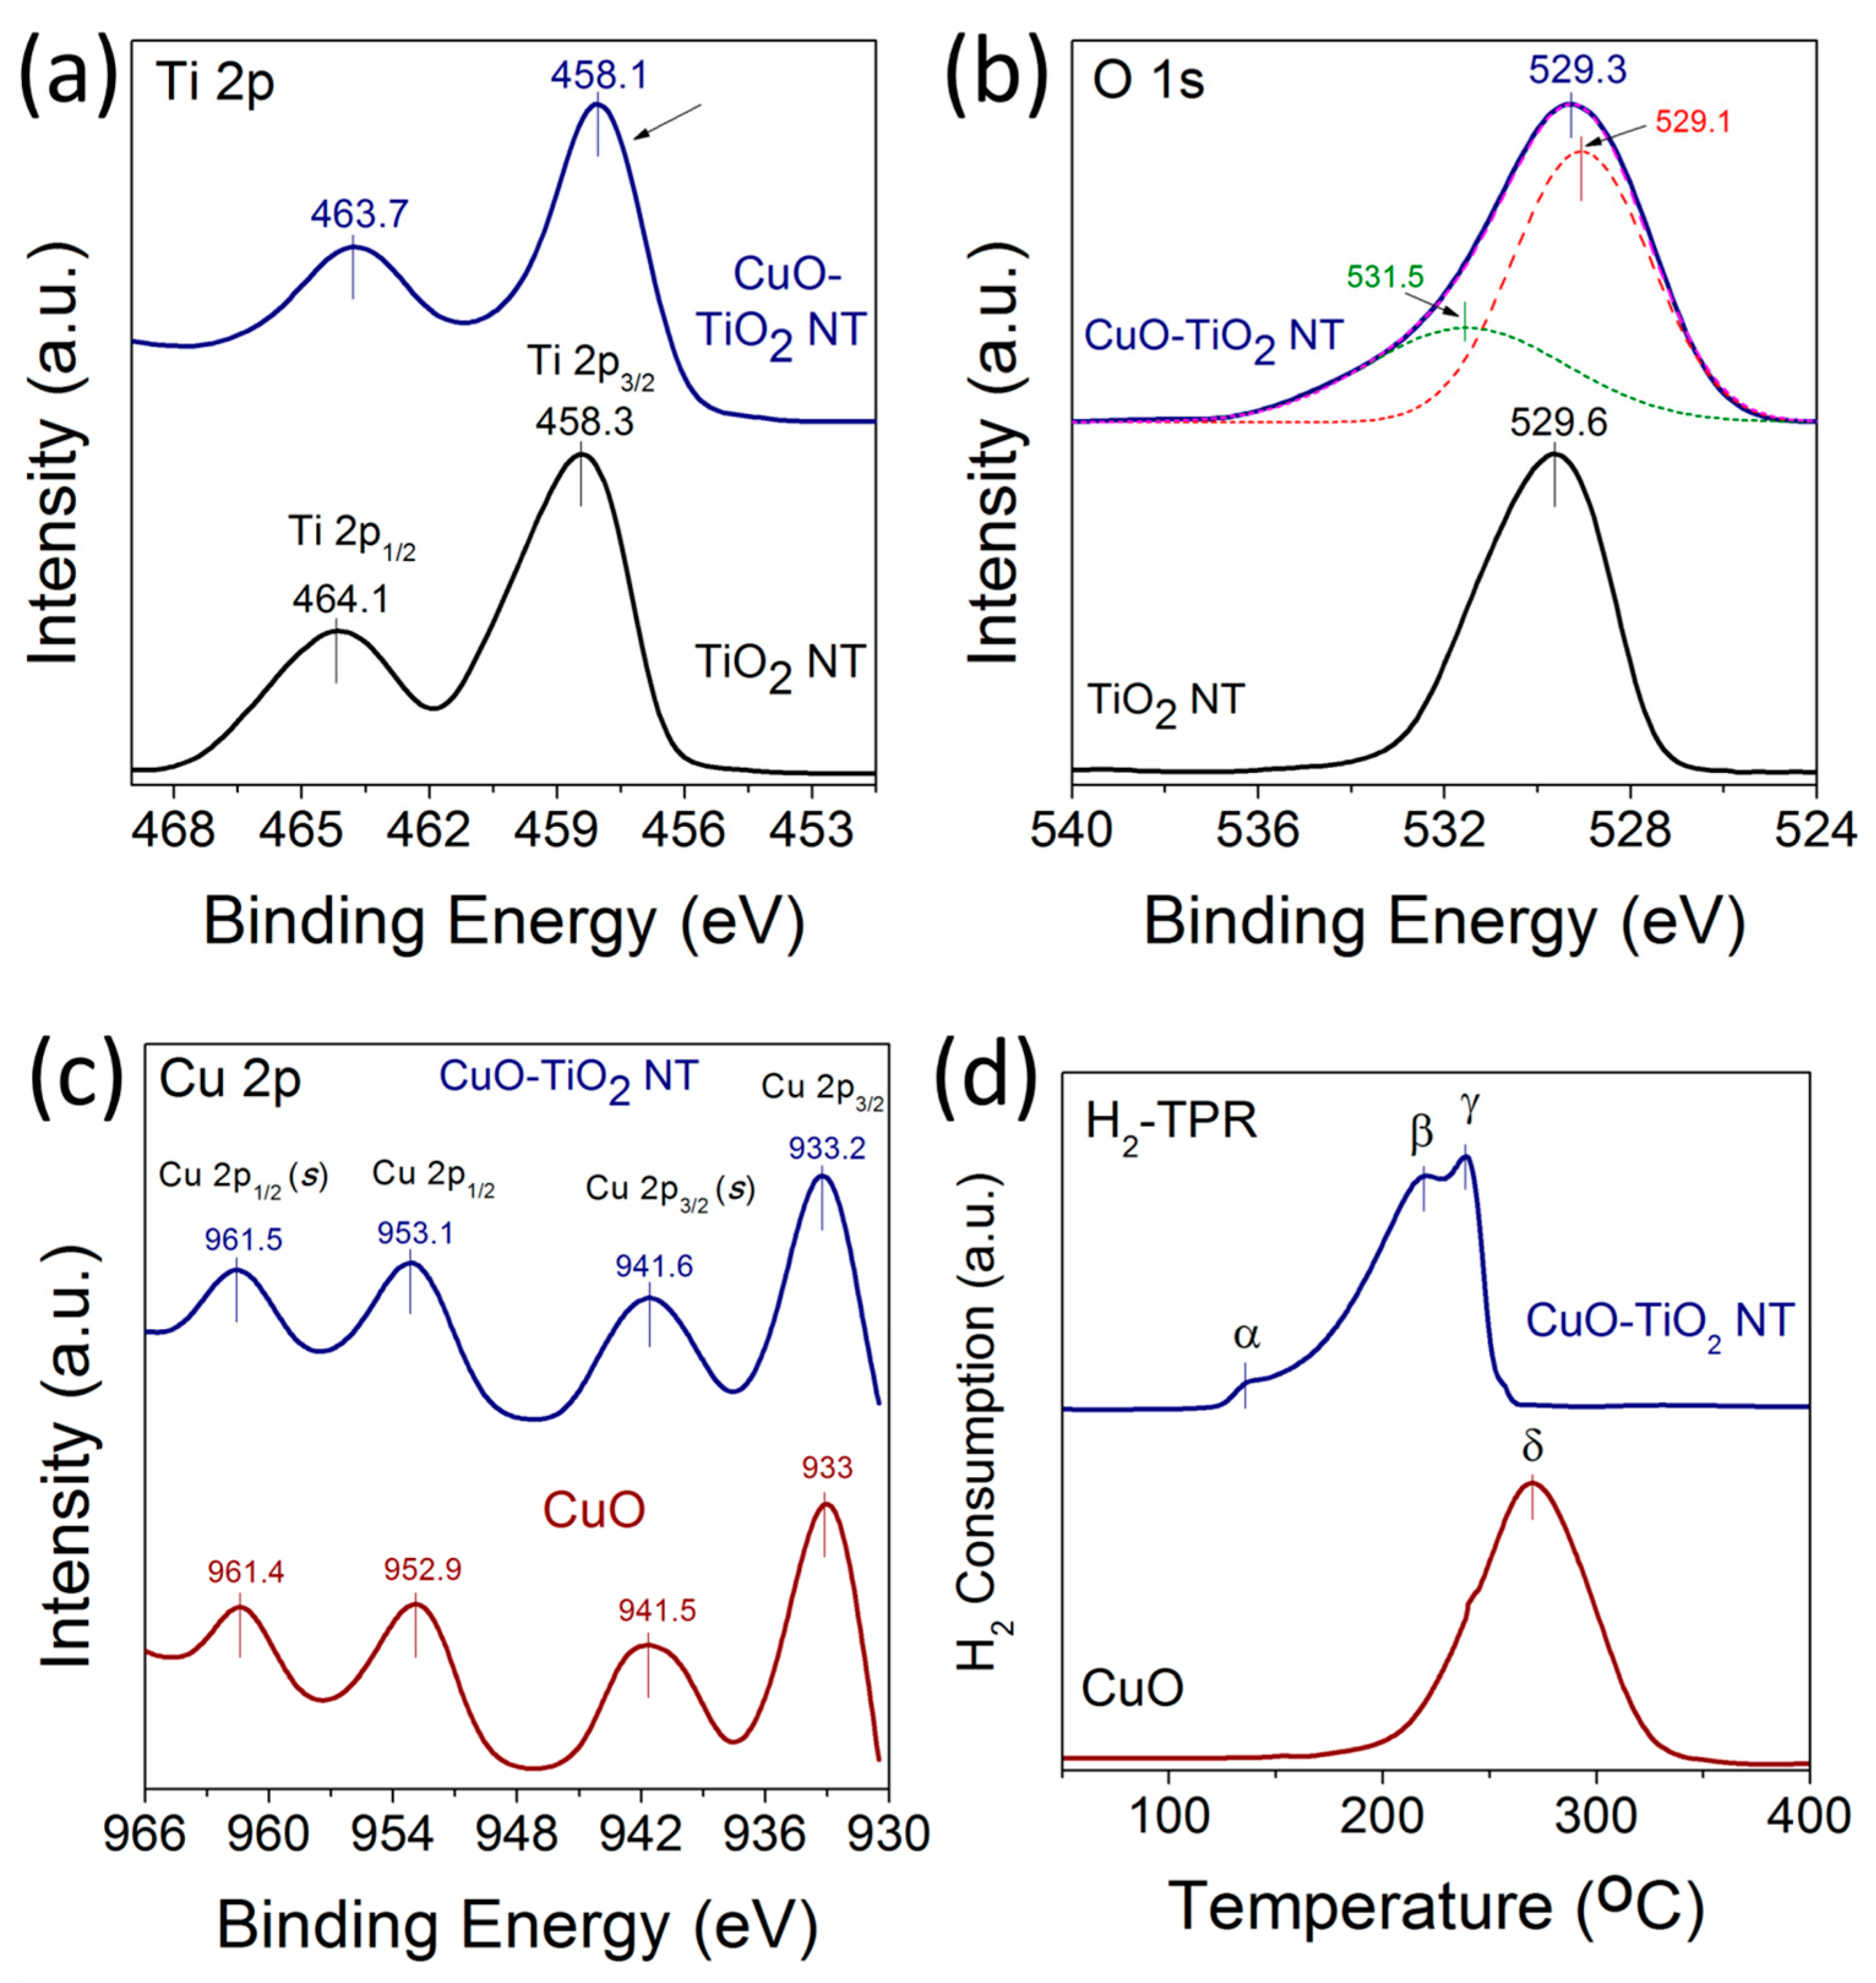
X-ray photoelectron spectroscopy (XPS) measurements were carried out to investigate the chemical environment and electronic structure of Ti, O, and Cu in the TiO2 NTs, CuO nanoparticles, and CuO-TiO2 NTs catalysts. Figure 6a–c displays the high-resolution XPS spectra of Ti 2p, O 1s. and Cu 2p of TiO2 NTs and CuO-TiO2 NTs. The HR-XPS scan for the Ti 2p in TiO2 was acquired from 450 to 470 eV. For Cu 2p and O 1s, the HR-XPS scan was acquired from 930 to 970 eV and from 520 to 544 eV, respectively. The binding energy values can be used to derive information on the chemical and electronic structure state of Ti cations in TiO2 [32]. As shown in Figure 6a, the Ti 2p3/2 peak shifts from 458.3 eV for pristine TiO2 NTs to 458.1 eV for CuO-TiO2 NTs, corresponding to a shift of −0.2 eV to a lower binding energy. This shift of the Ti 2p3/2 peaks is accompanied with another −0.4 eV shift of the Ti 2p1/2 peak from 464.1 eV to 463.7 eV for pristine TiO2 NTs and CuO-TiO2 NTs, respectively. The negative shift of both Ti 2p3/2 and Ti 2p1/2 is meaningful of two distinguished TiO2 entities and suggests the change of electronic structure of TiO2 in CuO-TiO2 NTs due to the possible formation of Ti3+ species and oxygen vacancies in the support. The binding energies of the Ti 2p peak at 458.1 and 463.7 eV in CuO-TiO2 aligns well with values reported for Cu-modified TiO2 [34,35,36,37]. Moreover, the negative shift of Ti 2p peaks is in agreement with a similar trend observed for Ti3+-doped TiO2 with increased oxygen vacancies [32,37,38].
Figure 6b shows the high resolution XPS spectra of O 1s for the pristine TiO2 and CuO-TiO2 NTs catalyst. For TiO2 NTs, an intense O 1s peak centered at 529.6 eV is observed and is attributed to the lattice O2− anions bonding to the metal cations in the Ti-O bond [35,36,39]. For CuO-TiO2 NTs, the O 1s peak broadens and shifts from 529.6 eV to 529.3 eV. Additionally, a weak shoulder peak is observed at 531.5 eV, which can be attributed to the adsorbed oxygen anions in the (OH–) groups on the surface [35,36] or to the oxygen in CuO [40]. The binding energies of the Cu2+ XPS peaks are slightly higher for CuO supported on TiO2 NTs compared to the unsupported CuO nanoparticles, as shown in Figure 5c. The Cu 2p3/2 and Cu 2p1/2 peaks for supported CuO were centered at 933.2 and 953.1 eV, compared to 933 and 952.9 eV in the case of unsupported CuO, respectively. The upshift of the Cu 2p peaks to a higher binding energy for CuO-TiO2 NTs indicates the strong interaction between the CuO nanoparticles and the TiO2 NTs support, and is in agreement with the literature [7,25,28,33].
Figure 6d displays the H2-TPR profiles of CuO and CuO-TiO2 NT catalysts, comparing the reduction behavior of the unsupported and TiO2 NT-supported CuO catalysts. Three reduction peaks denoted α, β, and γ—at temperatures lower than 250 °C in the CuO-TiO2 NT catalyst were observed at 136 °C, 218 °C and 236 °C, respectively, compared to a single reduction peak denoted δ observed at 270 °C for unsupported CuO. The two α and β reduction peaks in the case of CuO-TiO2 NTs can be attributed to the reduction of the small-sized CuO species finely dispersed on the surface of the TiO2 NTs support in the form of Cu2+ →Cu+ and Cu+ →Cu0. The γ reduction peak at a higher temperature can be ascribed to the reduction of the larger sized-CuO nanoparticles interacting deeply with the TiO2 NTs lattice [41].
2.5. Metal-Support Interactions
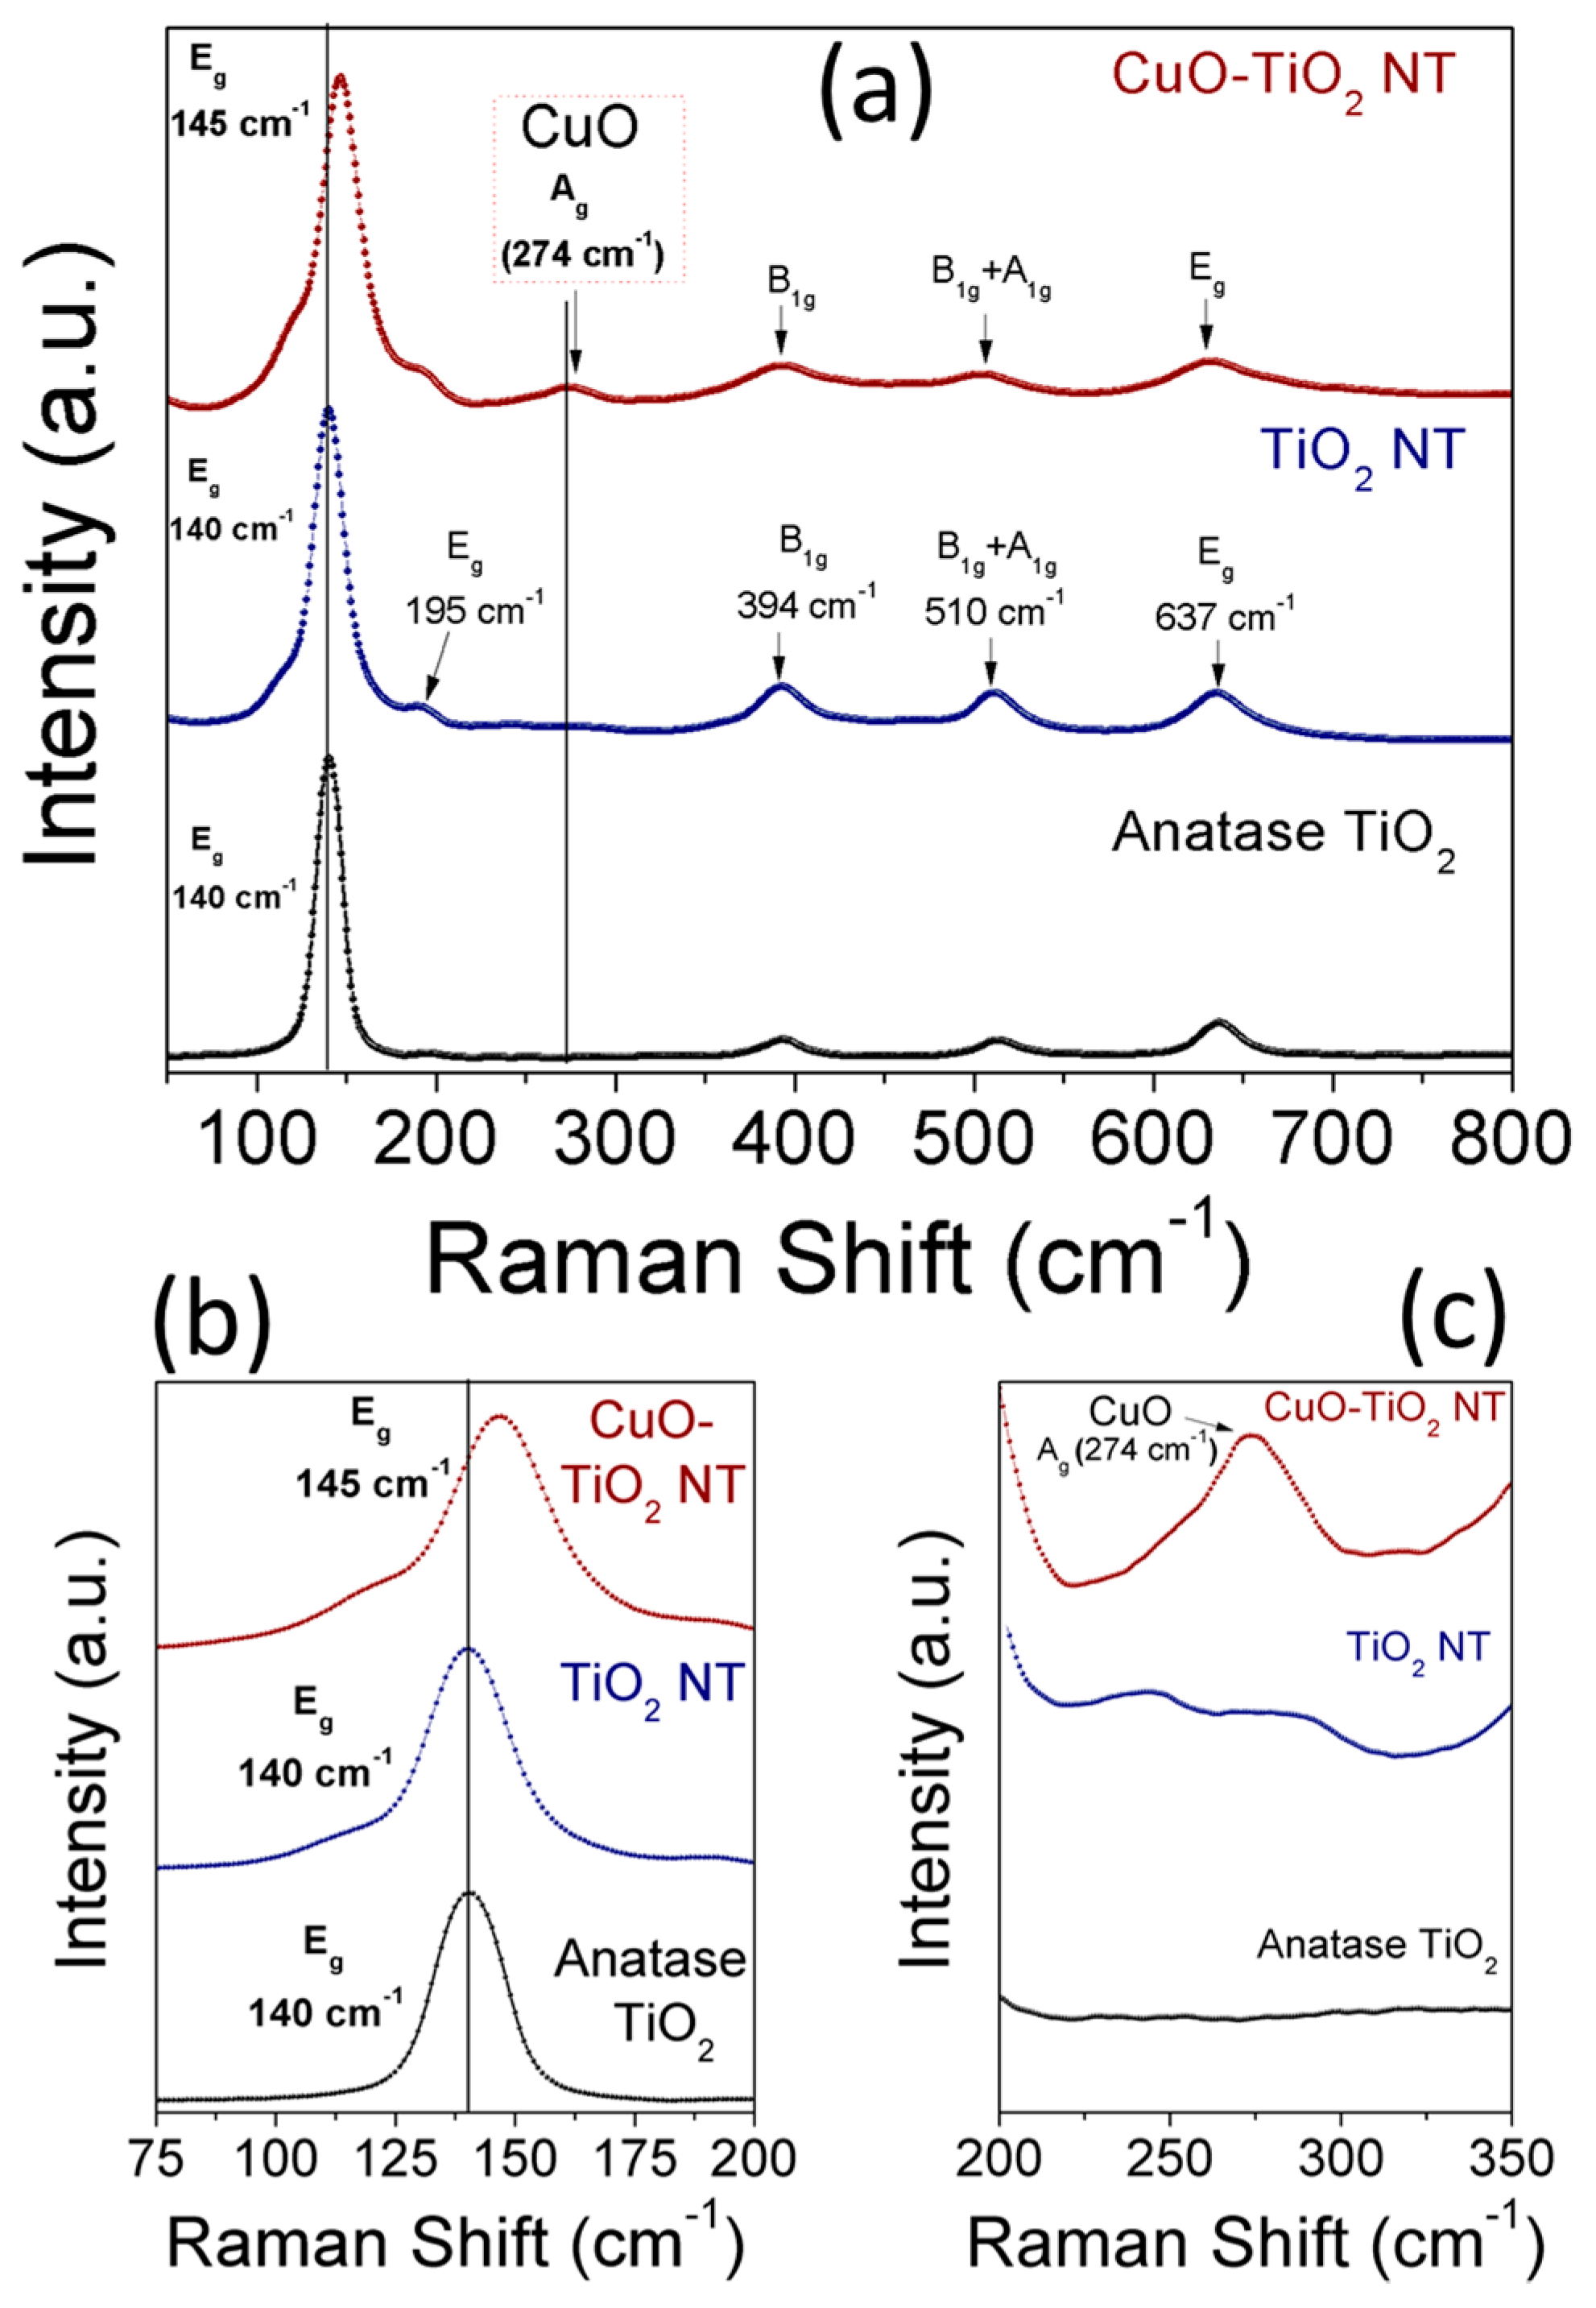
Raman scattering analysis was performed to confirm the strong metal-support interaction existing in CuO-TiO2 NTs and to reveal the structural phases of TiO2 and CuO. Figure 7a–c shows the full (Figure 7a) and enlarged (Figure 7b,c) Raman spectra of anatase TiO2, TiO2 NTs, and CuO-TiO2 NTs. The tetragonal anatase TiO2 belongs to the space group D4h with two TiO2 chemical formula units (six atoms) in each primitive unit cell. Accordingly, there are three infrared active modes and six Raman active modes, namely (1A1g + 2B1g + 3Eg) associated with the Ti-O stretching and bending vibration [42,43,44]. The six allowed vibrational modes in the first-order Raman spectrum of anatase TiO2 are identified as: (i) three Eg modes associated with the symmetric vibration of O-Ti-O in TiO2; (ii) two B1g modes due to the symmetric bending vibration of O-Ti-O; and (iii) one A1g mode resulting from the antisymmetric bending vibration of O-Ti-O [43]. The Raman spectrum of the TiO2 NTs shown in Figure 7a exhibits five pronounced peaks at 140 cm−1 (Eg), 194 cm−1 (Eg), 393 cm−1 (B1g), 514 cm−1 (A1g + B1g), and 637 cm−1 (Eg), in addition to a weak combination broad band at 125 cm−1. The intense E2g peak at 140 cm−1, the two low-intense Eg peaks at 195 cm−1 and 637 cm−1, and other broad peaks at 394 cm−1 and 510 cm−1 corresponding to the B1g and A1g+B1g, respectively, confirm the anatase phase of the TiO2 NTs as reported in the literature [42]. In the case of CuO-TiO2 NTs, the intense E2g peak associated with the symmetric stretching vibration of O-Ti-O is broadened and shifted to a higher wavenumber along with an increased FWHM line width (Figure 7b) upon CuO modification. The upshift of the Eg mode characteristic to crystalline anatase TiO2 from 140 cm−1 to 145 cm−1 in CuO-TiO2 NTs can be attributed to the presence of oxygen vacancies [24,45,46]. The CuO modification resulted in changes in the structural and vibrational properties of the TiO2 lattice, which indicates the strong interaction between the CuO and TiO2 NTs support [35,46,47,48]. The position of the Raman peaks associated with the B1g and A1g vibration modes of TiO2 was influenced by the CuO modification in CuO-TiO2 NTs compared to pristine TiO2 NTs, as can be seen in Figure 7b. However, in addition to the scattering peaks which are assigned to the anatase phase of TiO2, another peak centered at 274 cm−1 is clearly observed (Figure 7c) and is attributed to the CuO phase [49] which is dispersed on TiO2 NTs (Figure 1c,d and Figure 2b). Because of the negative shift of the XPS peaks of Ti 2p to a lower binding energy and the blue shift of the Eg Raman mode of TiO2, it is reasonable to conclude the slight formation of partially-reduced Ti species (Ti4+) by the free electrons left from the oxygen vacancies formed in the CuO-TiO2 NTs. As can be seen in Figure 6a, it should be noted that the energy difference between the XPS Ti 2p3/2 and Ti 2p1/2 peaks for the CuO-TiO2 NTs (5.5 eV) is comparable to that of the pristine TiO2 nanotubes (5.4.eV), which confirms that the anatase phase is maintained upon CuO loading [48].
2.6. Catalytic Activity, Stability and Kinetics
2.6.1. Effect of Cu Content on CO Oxidation
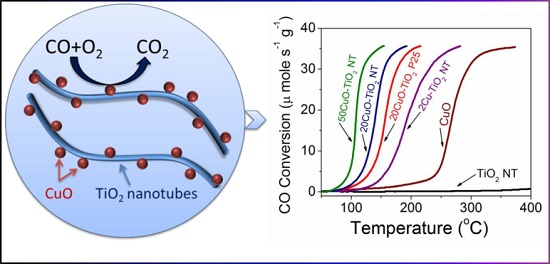
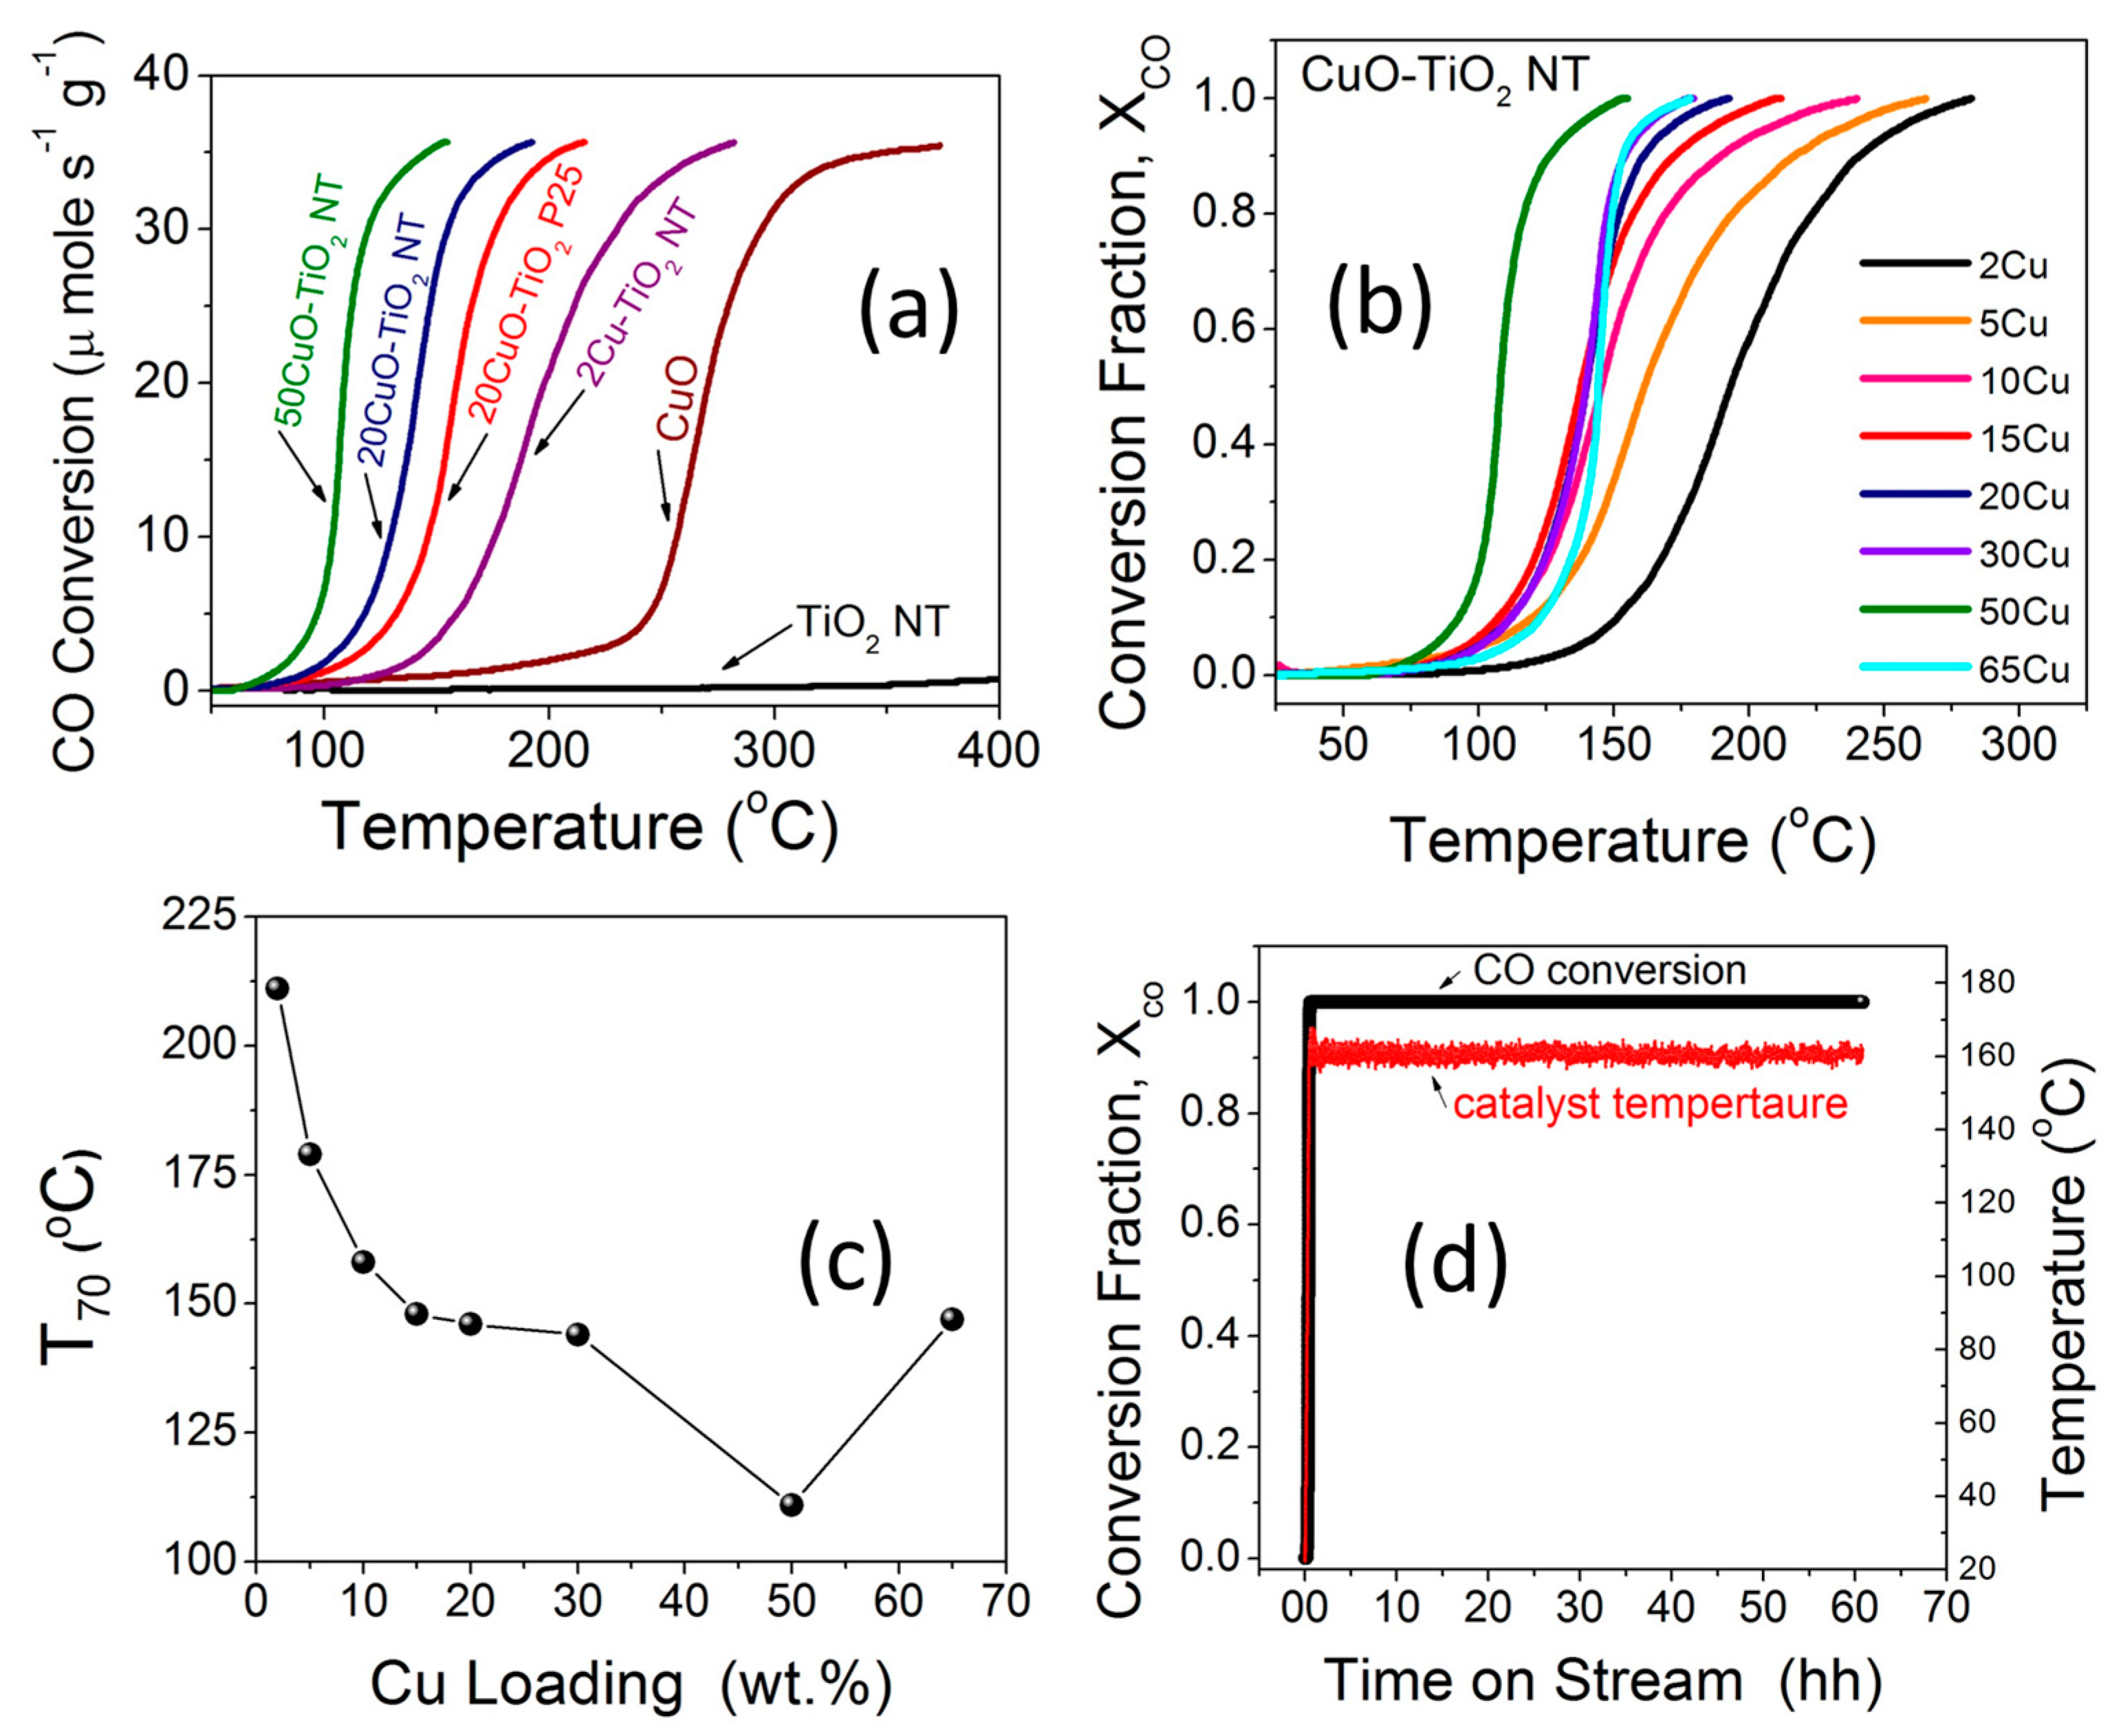
The catalytic activity of the different catalysts towards CO oxidation was evaluated using a continuous flow fixed-bed catalytic reactor. Figure 8a,b compares the catalytic activities of TiO2 NTs, CuO, and xCuO-TiO2 NT catalysts with different Cu loading (x = 2–65 wt %) under the feed gas containing 4% CO and 20% O2 in a He balance. It is generally accepted that the catalytic activity strongly depends on the composition, size, shape, and dispersion of particles which, in turn, is very sensitive to the procedure of preparation and pre- or post-synthesis treatments [50,51,52]. As can be seen in Figure 8a, the CO oxidation light-off curve for the CuO nanoparticles only revealed an appreciable activity at temperatures higher than 250 °C and that for the pristine TiO2 NTs did not reveal significant activity below 400 °C. Therefore, the catalytic activity observed for CO oxidation over CuO-TiO2 NT catalysts can be ascribed to the interplay between the CuO and TiO2 counterparts and the strong metal-support interaction at the interface, aligning with the XPS and Raman studies (Figure 6a–c and Figure 7a–c). For the sake of comparison, a 20CuO-TiO2 (P25) particles catalyst was prepared using the same method and evaluated for CO oxidation under the same experimental conditions. The CO oxidation light-off curve shown in Figure 8a shows that the 20CuO-TiO2 NT catalyst demonstrated higher catalytic activity for CO oxidation with T70 = 146 °C (T70 is the temperature corresponding to 70% CO conversion) compared to T70 = 166 °C in the case of the 20CuO-TiO2 (P25) catalyst. The enhanced CO conversion rate at a lower relative temperature can be attributed to the larger surface area of the mesoporous TiO2 NTs compared to that of TiO2 P25 (Table 1).
When comparing the T70 values for different CuO-TiO2 NT catalysts, it can be seen that the T70 decreased from 211 °C to 146 °C when the CuO content is increased from 2 wt % to 20 wt %. The further increase in the CuO content to 50 wt % led to enhanced activity and the T70 was further lowered to 111 °C (Figure 8b and Table 2). Overall, the xCuO-TiO2 NT catalysts with different CuO loading from x = 2–50 wt % demonstrated complete CO conversion at T100 values smaller than 250 °C. The light-off temperature for CO conversion decreases remarkably when increasing the CuO ratio in the range from 2 wt % to 20 wt %. The CuO-TiO2 nanotube catalysts with CuO loading from 20 to 50 wt % yielded slightly undifferentiated CO conversion rates. The 50CuO-TiO2 NT catalyst demonstrated the highest catalytic activity with 100% CO conversion at T100 = 155 °C achieved under a weigh-hourly space velocity (WHSV) of 72,000 cm3 g−1 h−1, which is 2.4 times larger than that reported in the literature (30,000 cm3 g−1 h−1 ) [53]. This indicates that larger CO volumes can be converted per unit time per unit weight of the catalyst at a lower residing time. When the CuO ratio is further increased to 65 wt %, the catalyst performance was lowered and the T100 increased to 177 °C for 65CuO-TiO2 NT compared to 155 °C for the 50CuO-TiO2 NT catalyst. The lower catalytic activity for the 65CuO-TiO2 NT catalyst might be due to the lower surface area (Table 1 and Table 2) or the aggregation of CuO on the TiO2 NTs support. A correlation between the 100% CO conversion temperatures (T100) and the CuO loading is presented in Figure 8c. From the catalytic activity measurements (Figure 8b), it can be concluded that the increased CuO promoters increase the strong metal-support interactions and thus results in lower CO conversion temperatures [6]. This strong metal-support interaction arising from the oxygen vacancies in CuO-TiO2 NT catalysts was evidenced from XPS, H2-TPR, and Raman studies, as explained earlier. Compared to other supported plasmonic metal-based catalysts, these CuO-TiO2 NT catalysts exhibit high catalytic activity for CO conversion at a favorable low temperature and can be simply produced at a low cost. Our CuO-TiO2 NT catalysts demonstrated complete CO conversion at a temperature comparable to that reported by Carabineiro et al. [54] for CuO-supported Au catalysts. Furthermore, our CuO-TiO2 NT catalysts exhibited 100% CO conversion at a lower temperature compared to the TiO2-supported Au catalysts reported in the same study [54]. Moreover, comparing our catalysts to Pd catalysts supported on a CeO2-TiO2 mixed oxide [55] and that supported on ZrO2 [56] with a T100 value close to 150 °C, the merit of the non-plasmonic CuO-TiO2 NT catalyst with T100 = 155 °C is notable given the comparable CO oxidation potency, lower cost, and the long-term thermal stability.
2.6.2. Long-Term Stability
The long-term stability of the 50CuO-TiO2 NT catalyst for CO oxidation was evaluated under a continuous stream of the 4% CO feed gas mixture for 60 h. After the exposure of the catalyst to the feed gas mixture and increasing temperature, a steady state is reached and the 100% CO conversion remains essentially constant after 60 h of operation under a continuous feed gas stream. The high activity demonstrated by the 50CuO-TiO2 NT catalyst at a low-temperature window is not subject to deactivation, as indicated by the stable performance of the of CO conversion for more than 60 h at 160 ± 5 °C (Figure 8d). Moreover, the catalyst maintained the same performance after storage in a closed vial for more than six months in ambient conditions. The CuO-TiO2 NT catalysts could be used as highly stable, efficient, durable, and non-expensive catalysts for CO oxidation at a low temperature window.
2.6.3. Kinetic Studies
Kinetic studies were performed on three selected catalysts, namely 2CuO-TiO2 NT, 20CuO-TiO2 NT, and 50CuO-TiO2 NT, in order to further reveal the effect of Cu content on the catalytic behavior of the different catalysts. For each catalyst, the effect of varying the temperature and the catalyst loading at a fixed molar gas flow rate was studied. CO oxidation experiments were performed by varying the catalyst loadings as 15, 30, 50, 75, and 100 mg, while keeping the catalysts’ bed length and the gas hourly space velocity of the feed gas mixture fixed (3600 cm3 h−1). The CO fractional conversion was calculated from the molar flow of CO at the inlet and outlet , as:
To collect kinetic data, experiments were carried out under atmospheric pressure and oxygen-rich conditions, at a steady state and in a differential regime (assumed for CO conversion below 0.2). Therefore, the CO oxidation reaction rates (in mol g−1 s−1) were calculated using the formula:
where () is the rate of reaction of CO oxidation and is the weight of the catalyst (in gram). The apparent activation energy (Ea) of selected catalysts were determined from the Arrhenius plots (ln () vs. 1/T) using reaction rate data obtained in the linear region of <20% CO conversion [3,57,58].
Figure 9a–c compares the plots of the CO fractional conversion ( vs. at different temperatures in the range of 60–125 °C for the three selected catalysts. In each case, at a fixed ratio, a monotonic increase of CO conversion with increasing temperature can be seen, indicating that CO oxidation is enhanced at relatively higher temperatures. The increased CO oxidation can be attributed to the activation of the oxygen adsorbed on the surface of the catalysts, which results in an enhanced diffusion of active oxygen species leading to enhanced CO oxidation rates. This behavior aligns well with the results from the Raman, XPS, and H2-TPR studies, which indicates the existence of reducible oxygen species on these catalysts at a mid-temperature range. The effect of the contact time in the term of , (W = catalyst weight (g) and = molar flow rate (µmol s−1)) on the CO conversion is also presented in Figure 9a–c. For each catalyst at a given temperature, the fractional CO conversion increases when increasing the contact time from to 0.008 to 0.056 g s µmol−1 at a fixed gas hourly space velocity (GHSV = 3600 h−1). At the low contact time of 0.008 g s µmol−1, a minimal CO conversion fraction is observed because of the high molar flow rate and the small catalyst weight. This could be due to the relatively lower number of active sites available for the adsorption of reacting gaseous species and thus minimal CO oxidation is observed. When the contact time is increased to 0.016, 0.028, 0.042, and 0.056 g s µmol−1 by increasing the catalyst loading mass, sufficient active sites can be realized, leading to increased CO conversion. The CO oxidation reactions present a wide range of kinetic situations with positive- or negative-order reaction rates and a large range of activation energy values [58]. For CuO-TiO2 mixed-oxide catalysts, a Langmuir-Hinshelwood (L-H) reaction model involving the chemisorption of O2 on the TiO2 surface and the chemisorption of CO on the Cu surface and the two chemisorbed species, are reacting at the CuO-TiO2 interface [59]. Figure 9d–f shows the Arrhenius plots obtained for 2CuO-TiO2 NT, 20CuO-TiO2 NT, and 50CuO-TiO2 NT catalysts under differential reaction conditions, as described in the experimental section. The apparent activation energies (Ea) determined from the Arrhenius plots for the 2CuO-TiO2 NT, 20CuO-TiO2 NT, and 50CuO-TiO2 NT catalysts are presented in Table 2. The order of the apparent activation energy of the three catalysts is: Ea (50CuO-TiO2 NT) > Ea (20CuO-TiO2 NT) > Ea (2CuO-TiO2 NT) catalyst. The order of the calculated CO oxidation reaction rates at 155 °C (Table 2) is: (50CuO-TiO2 NT) > (20CuO-TiO2 NT) > (2CuO-TiO2 NT). The higher activation energy of the 50CuO-TiO2 NT catalyst might suggest that its catalytic activity is lower than that of the 20CuO-TiO2 NT or 2CuO-TiO2 NT catalyst, which contradicts the order of the CO oxidation reaction rates where the 50CuO-TiO2 NT catalyst demonstrated the highest reaction rate of 36 µmole s−1 g−1 compared to 30 µmole s−1 g−1 and 4.8 µmole s−1 g−1 for the 20CuO-TiO2 NT and 2CuO-TiO2 NT catalysts, respectively. However, the experimentally-determined Arrhenius parameters and activation energies represent the apparent values and the apparent activation energy for a bimolecular catalyzed reaction that does not only depend on the true surface activation energy and the heat of adsorption of the reactants [60]. Therefore, the high values of the apparent activation energies might be due to the strong CO adsorption bond energy to the catalyst surface which increases with increasing Cu loading and is not actually due to a hindered surface reaction, as the order of the apparent activation energy may indicate [61].
Based on the spectroscopic results and the performance of the catalysts, it can be concluded that the modification of the mesoporous anatase TiO2 NTs with CuO nanoparticles could influence the nature of the defects in the CuO-TiO2 NT catalysts. This led to a strong electronic interaction between the CuO and anatase TiO2 NTs and enhanced catalytic activity [15,16]. In summary, the CuO supported on TiO2 NTs is more active than that supported on commercial TiO2 (P25) particles, indicating the role of the high surface area in promoting the catalytic activity. The activity of CuO-TiO2 NT catalysts can be controlled by changing the Cu:Ti ratio which affects the extent of the metal-support interaction in the mixed oxide catalyst.
3. Materials and Methods
3.1. Materials
Chemicals and reagents were purchased from Sigma-Aldrich (Taufkirchen, Germany) and used without further purification, including titanium (IV) oxide (anatase powder, −325 mesh, ≥99% trace metals basis, Sigma-Aldrich), sodium hydroxide (reagent grade, ≥98%, pellets, anhydrous, Sigma-Aldrich), hydrochloric acid (ACS reagent, 37% deionized water, Sigma-Aldrich), copper (II) nitrate trihydrate (purum, 98%, Sigma-Aldrich), sodium carbonate (ACS reagent, anhydrous, 99.95%, Sigma-Aldrich).
3.2. Methods
3.2.1. Synthesis of TiO2 Nanotubes Support
The TiO2 nanotube support (TiO2 NT) was prepared by the hydrothermal treatment of anatase TiO2 powder in concentrated aqueous NaOH solution followed by acid treatment in HCl solution [19,21,22,62]. In a typical synthesis, 2 g of commercial anatase TiO2 particles was added to 40 mL of 10 M NaOH aqueous solution in a 100 mL Teflon vessel. The mixture was stirred for 30 min and then the Teflon-lined stainless steel autoclave was placed in an electric oven (Isotemp, Model 282A, Fisher Scientific, Marietta, OH, USA) and kept at 140 °C for 48 h. After the hydrothermal treatment, the products were separated by filtration and rinsed three times with DI water. Then, the products were soaked in an aqueous solution for 2 h at room temperature after adjusting the pH to 6 with 0.1 M HCl. Finally, the products were separated by filtration and dried in an oven at 80 °C overnight. Dried samples were calcined at 450 °C for 2 h with a heating rate of 2° min−1.
3.2.2. Synthesis of CuO-TiO2 NT Catalysts
The different CuO-TiO2 NT catalysts were synthesized by the DP method at ambient conditions of temperature. Precipitates of xCuO-TiO2 NT catalysts with various Cu loading in the range of x = 2–65 wt % were generally prepared by mixing an aqueous suspension of TiO2 nanotubes with a predetermined volume of aqueous Cu(NO3)2·3H2O solution, followed by the addition of the precipitating agent solution (0.2 m/L Na2CO3) at constant pH. In a typical synthesis, a 100 mg TiO2 nanotube powder was suspended in 100 mL DI water and the suspension was sonicated for 10 min. Then, a pre-determined volume of Cu(NO3)2·3H2O aqueous solution with the desired Cu content was added to the TiO2 NTs suspension and the mixture was sonicated for 10 min, followed by stirring at room temperature for 2 h. Following this, an appropriate volume of 0.2 mole/L Na2CO3 aqueous solution was added dropwise to the above suspension, until the pH of the suspension reached ca. 9. The reaction mixture was finally aged under stirring for another 5 h. Upon completion, the resulting precipitate was separated by centrifuge, washed three times with DI water, and dried at 80 °C in an electric oven overnight. The dried powder was calcined in a closed muffle furnace at 450 °C for 2 h with a ramp rate of 2 °C min−1. For the sake of comparison with xCuO-TiO2 NT catalysts, CuO nanoparticles unsupported and supported on commercial TiO2 (P25) particles were prepared using the same method.
3.2.3. Catalysts Characterization
The different catalysts were characterized with a toolbox of physical techniques. Transmission electron microscopy (TEM) images were acquired using TECNAI G2 F20 S-TWIN transmission electron microscope (FEI, Brno, Czech Republic) with an accelerated voltage of 200 kV. Powder samples for TEM were dispersed in ethanol by ultrasonication and a droplet of the colloid suspension was dipped onto a Formvar carbon-coated 200-mesh copper grid (Ted Pella) and finally allowed to dry in air at room temperature. Scanning electron microscopy (SEM) images and energy dispersive X-ray spectroscopy (EDX) measurements were carried out using NOVA NANOSEM 450 scanning electron microscope (FEI, Brno, Czech Republic). The powder was sputter coated with gold prior to the SEM analysis, whenever needed. The powder X-ray diffraction (XRD) measurements were carried out at room temperature using a Rigaku MiniFlex II powder diffraction system (Rigaku, Tokyo, Japan) with Cu KαR radiation at 30 kV and 20 mA between 2θ angles of 5° and 80° with a scanning rate of 0.025° per step per second. Nitrogen adsorption and desorption isotherms of different samples were obtained at 77 K using a Micrometrics instrument ASAP 2420 pore size analyzer (Norcross, GA, USA) in the range of 0.05 to 1 relative pressure (). The specific surface area was derived using the BET (Brunauer-Emmett-Teller) method, and the pore size distribution and average pore size were estimated from the adsorption branch using the BJH (Barret-Joyner-Halenda) method. Prior to analysis measurement, all samples were degassed in an N2-He mixture at 90 °C for 1 h and at 150 °C for an additional 1 h. Thermal analysis was conducted using a Perkin Elmer thermal gravimetric analyzer (Pyris 6 TGA) (Groningen, Netherlands) from 50 °C to 600 °C in air at a linear heating rate of 10 °C min−1. X-ray photoelectron spectroscopy (XPS) measurements were carried out on a KRATOS AXIS Ultra XPS with a monochromatic Al Kα radiation source (1486.6 eV) in a UHV environment (ca. 5 × 10⁻⁹ Torr) (KRATOS Analytical, Manchester, UK). The operating conditions were kept at constant high resolution pass energy of 20 eV, emission current of 10 mA, and anode HT of 15 kV. In order to subtract the surface charging effect, the C1s peak at 284.8 eV was used for calibration. Temperature-programmed reduction (H2-TPR) analysis was carried out using a Micromeritics Chemisorb 2750 instrument with ChemiSoft TPx Option (Norcross, GA, USA) equipped with a built-in thermal conductivity detector (TCD) to detect H2 consumption. For each analysis, 50 mg of the calcined catalyst was heated from ambient temperature to 600 °C, with a heating rate of 10 °C min−1 under 10% H2/Ar balance at a flow rate of 30 mL min−1. Raman spectra were recorded using a DXR 2 Raman Microscope (Thermo Fisher Scientific, Madison, WI, USA) equipped with a 780 nm LASER source for excitation. The spectrum acquisition consisted of 20 accumulations with a total acquisition time of 5 min at a spectral resolution of 4 cm−1 and laser power of 5 mW.
3.2.4. Catalytic Activity, Stability and Kinetics Measurements
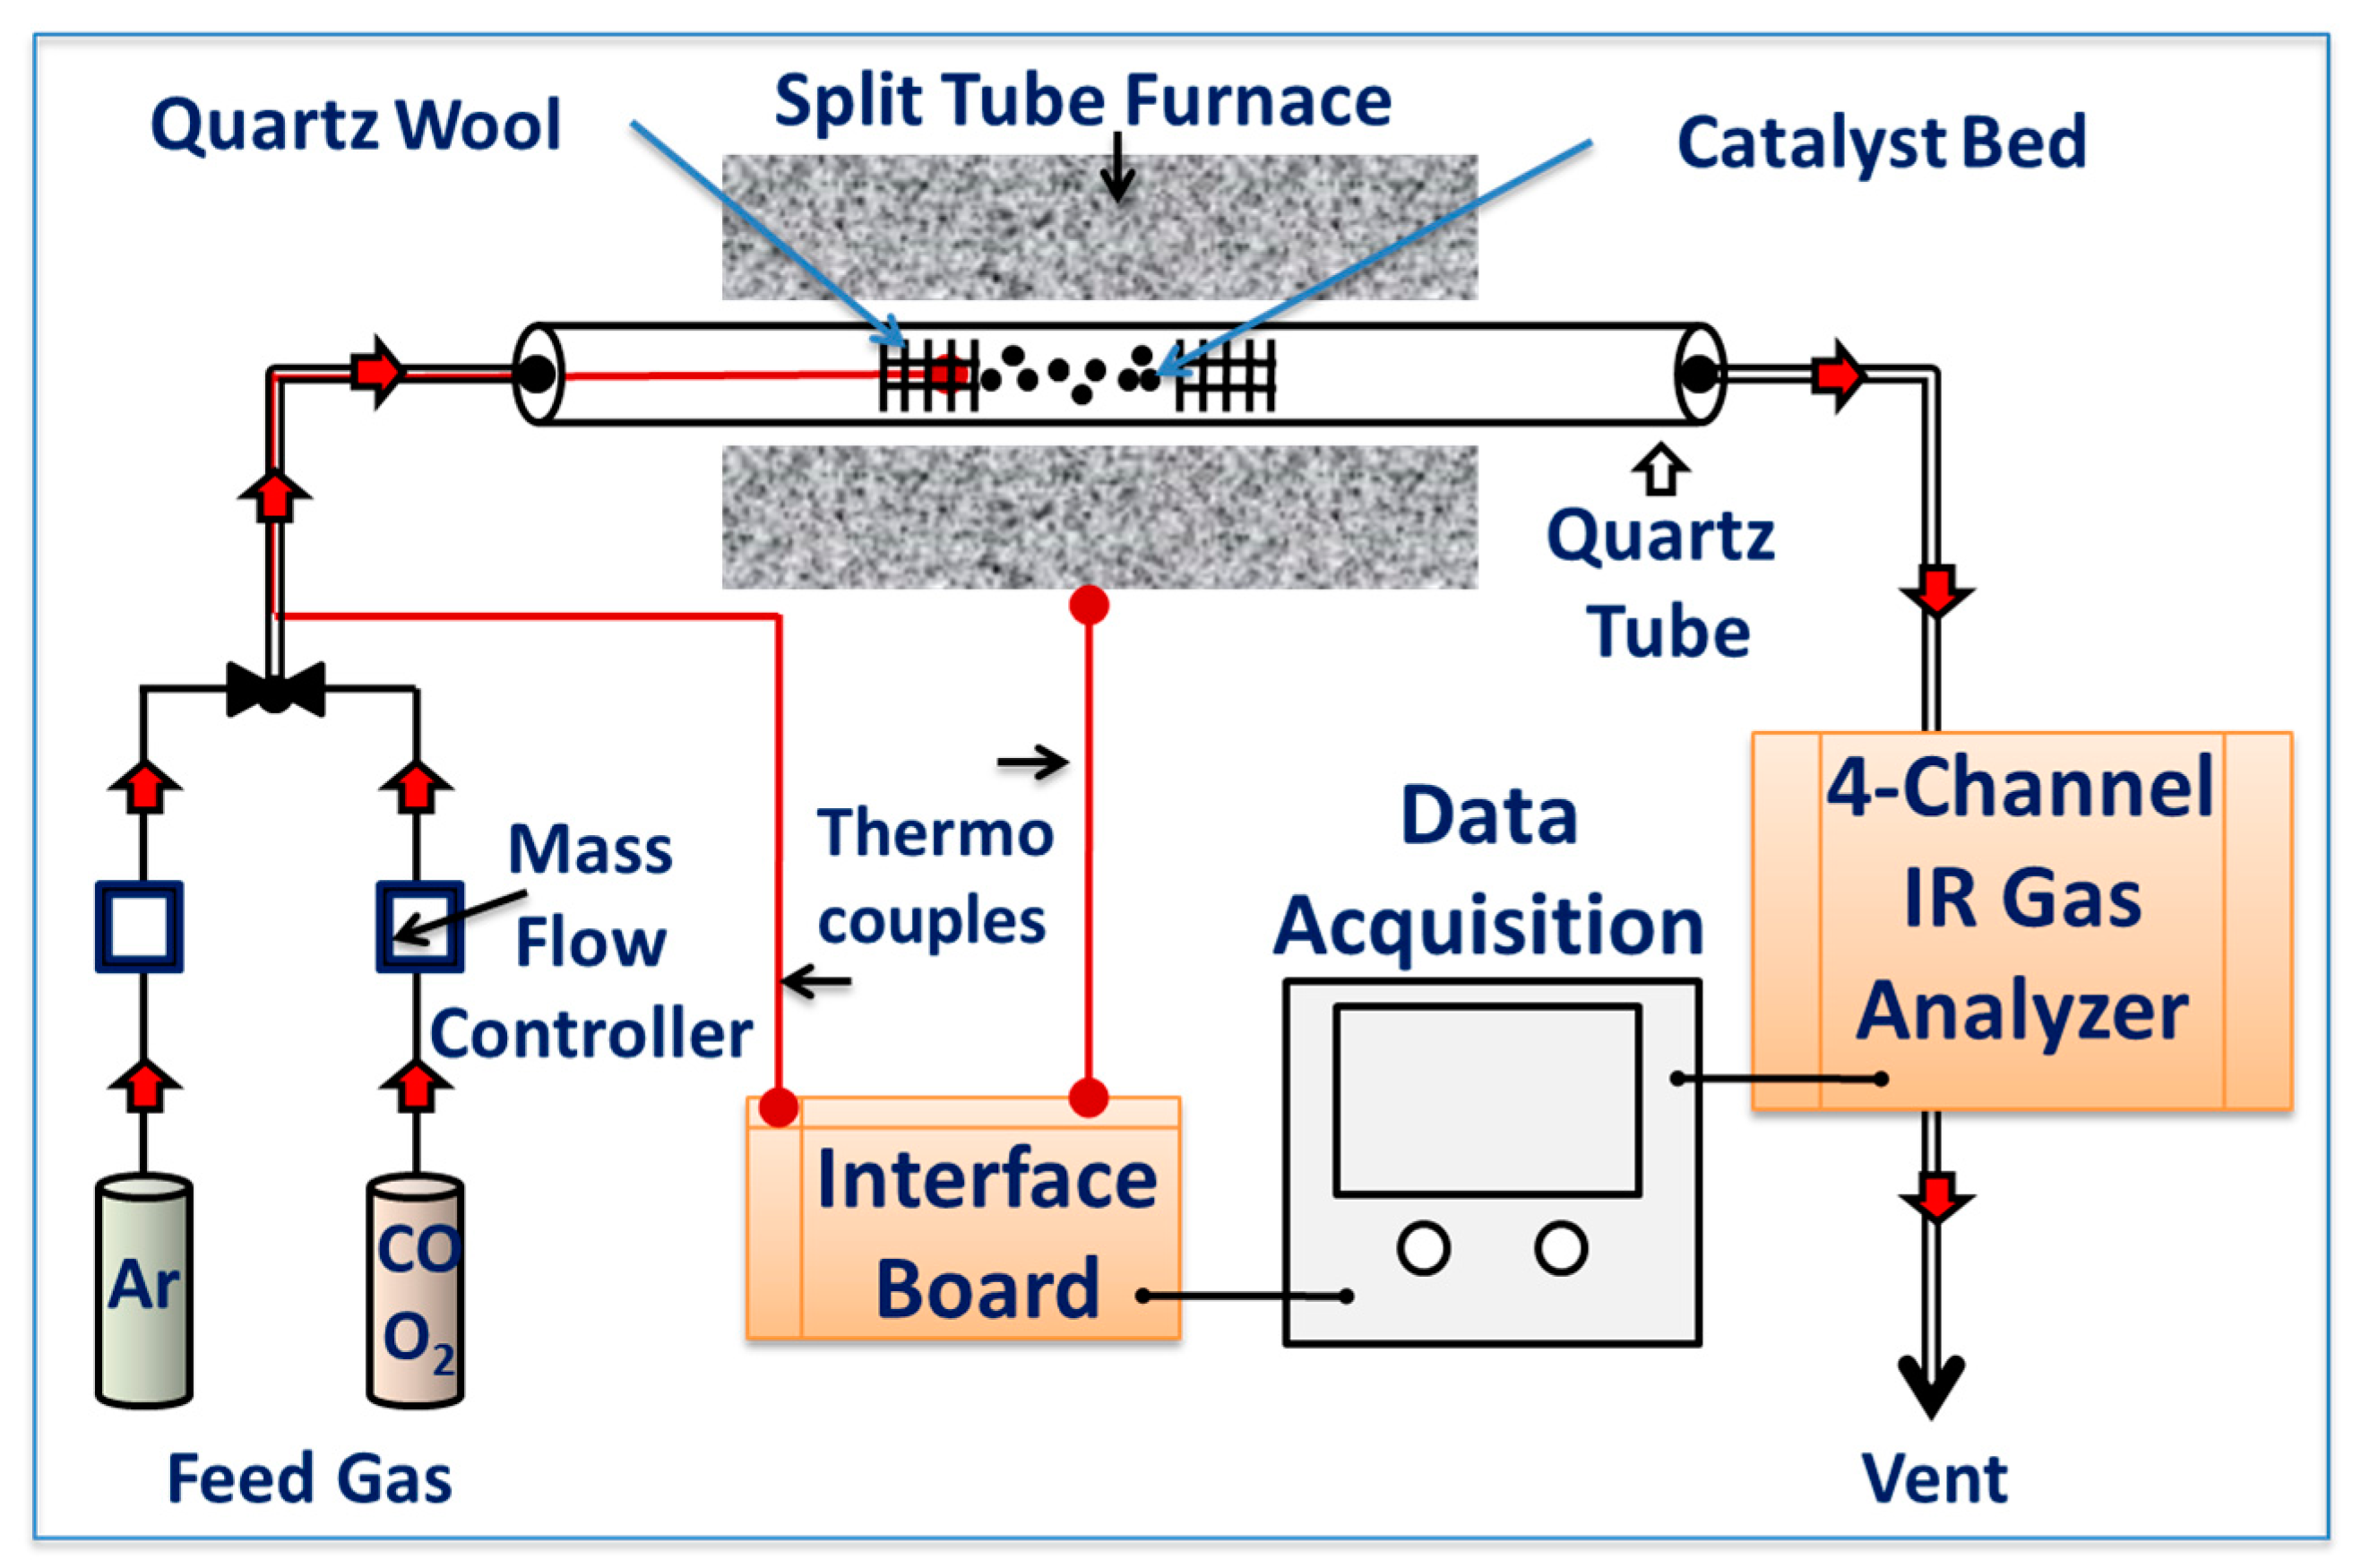
Catalytic CO oxidation experiments were performed to determine the activity of the catalysts. Experiments were performed using a custom-built continuous flow fixed-bed catalytic test reactor, as depicted in Figure 10. The reactor was equipped with a quartz tube with an inner diameter of 10 mm, which was placed in the middle of a programmable split tube furnace (Lindberg/Blue M Mini-Mite Tube Furnace-Thermo). In all experiments, 50 mg of the test catalyst powder was charged into a bed of quartz wool in the middle area of the quartz tube. The catalyst temperature was measured by a k-type thermocouple placed in contact with the catalyst bed. The reaction gas feed mixture consisted of 4% CO and 20% O2 in a balance of He and was passed through the catalyst bed (50 mg) at a flow rate of 60 cm3/min (72,000 cm3 g−1 h−1 WHSV). The flow rate was controlled by a set of digital mass flow controllers (HI-TEC, Model-F-201CV-10K-AGD-22-V, Multi-Bus, DMFC; Bronkhorst). All experiments were carried out at atmospheric pressure (1 atm) in the temperature range of 30 to 400 °C, with a ramp rate of 5 °C min−1. The signal from the thermocouple was acquired using a USB-6008 Multifunction I/O and NI-DAQmx (National Instruments) data acquisition board. The effluent gas was fed into an inline multichannel infrared gas analyzer (IR200, Yokogawa, Japan) to analyze the exit gas and simultaneously monitor the CO conversion. The volume percent of the CO, CO2, and O2 gases was determined simultaneously and logged, along with the catalyst temperature during the course of the experiment using custom-configured LabVIEW data acquisition software (LabVIEW 2014, Version 14.0F1, National Instruments, Austin, TX, USA). The long-term stability of the selected catalyst was studied at a temperature of 160 ± 5 °C for 60 h under a continuous stream of feed gas. The catalytic activity was expressed by the conversion of CO in the effluent gas and indicated as CO fractional conversion.
4. Conclusions
In summary, readily available active oxygen species are of fundamental importance for strong metal-support interactions and high catalytic activity. In this study, a series of efficient and non-precious mesoporous CuO-TiO2 NT catalysts with enhanced defects were developed and tested for CO oxidation at low temperatures. The existence of strong metal-support interactions between the Cu and TiO2 NTs was evidenced by a combination of catalytic activity measurements, including XPS, Raman, and TPR analysis. Raman and XPS studies illustrated the presence of oxygen vacancies in the CuO-TiO2 NT catalysts, as indicated by the up-shift of the E2g mode of TiO2 and the down-shift of the binding energy of Ti 2p3/2 from the Raman and XPS studies, respectively. The CuO-TiO2 NT catalyst demonstrated low-temperature activity and high stability for CO conversion. The CO conversion rate of the CuO-TiO2 NT catalysts is greatly enhanced compared to their individual counterparts and a 100% CO conversion is achieved at a low working temperature of 155 °C, with a reaction rate of 36 µmole s−1 g−1 and an apparent activation energy of 81 ± 0.7 kJ mole−1. Furthermore, the performance of the catalysts was stable for 60 h under a continuous stream, without catalyst deterioration or a decrease in the CO conversion ratio.
Supplementary Materials
The following are available online at www.mdpi.com/2073-4344/7/5/129/s1, Figure S1: XRD patterns of xCuO-TiO2 nanotubes with different Cu contents (x = 5–50 wt %).
Acknowledgments
This work was made possible by the grant number NPRP 6-351-1-072 from the Qatar National Research Fund (a member of Qatar Foundation). The statements made herein are solely the responsibility of the authors.
Author Contributions
Abdallah F. Zedan, Nageh K. Allam, and Siham Y. AlQaradawi conceived the experiments; Abdallah F. Zedan designed and built the experimental catalysis set-up, performed all the experiments and tests, analyzed and interpreted the data, and wrote the manuscript; Nageh K. Allam and Siham Y. AlQaradawi edited the manuscript.
Conflicts of Interest
The authors declare no conflict of interest.
References
- Deng, W.; Flytzani-Stephanopoulos, M. On the issue of the deactivation of Au–Ceria and Pt–Ceria water–Gas shift catalysts in practical fuel-Cell applications. Angew. Chem. Int. Ed. 2006, 45, 2285–2289. [Google Scholar] [CrossRef] [PubMed]
- Shelef, M.; McCabe, R.W. Twenty-Five years after introduction of automotive catalysts: What next? Catal. Today 2000, 62, 35–50. [Google Scholar] [CrossRef]
- Polychronopoulou, K.; Zedan, A.F.; Katsiotis, M.S.; Baker, M.A.; AlKhoori, A.A.; AlQaradawi, S.Y.; Hinder, S.J.; AlHassan, S. Rapid microwave assisted sol-gel synthesis of CeO2 and CexSm1−xO2 nanoparticle catalysts for CO oxidation. Mol. Catal. 2017, 428, 41–55. [Google Scholar] [CrossRef]
- Veith, G.M.; Lupini, A.R.; Rashkeev, S.; Pennycook, S.J.; Mullins, D.R.; Schwartz, V.; Bridges, C.A.; Dudney, N.J. Thermal stability and catalytic activity of gold nanoparticles supported on silica. J. Catal. 2009, 262, 92–101. [Google Scholar] [CrossRef]
- In, S.-I.; Vaughn, D.D.; Schaak, R.E. Hybrid CuO-TiO2−xNx hollow nanocubes for photocatalytic conversion of CO2 into methane under solar irradiation. Angew. Chem. Int. Ed. 2012, 51, 3915–3918. [Google Scholar] [CrossRef] [PubMed]
- Carrettin, S.; Hao, Y.; Aguilar-Guerrero, V.; Gates, B.C.; Trasobares, S.; Calvino, J.J.; Corma, A. Increasing the number of oxygen vacancies on TiO2 by doping with iron increases the activity of supported gold for co oxidation. Chem. Eur. J. 2007, 13, 7771–7779. [Google Scholar] [CrossRef] [PubMed]
- Huang, J.; Wang, S.; Zhao, Y.; Wang, X.; Wang, S.; Wu, S.; Zhang, S.; Huang, W. Synthesis and characterization of CuO/TiO2 catalysts for low-Temperature CO oxidation. Catal. Commun. 2006, 7, 1029–1034. [Google Scholar] [CrossRef]
- Hafez, A.M.; Zedan, A.F.; AlQaradawi, S.Y.; Salem, N.M.; Allam, N.K. Computational study on oxynitride perovskites for CO2 photoreduction. Energy Convers. Manag. 2016, 122, 207–214. [Google Scholar] [CrossRef]
- Anil, C.; Madras, G. Kinetics of CO oxidation over Cu doped Mn3O4. J. Mol. Catal. Chem. 2016, 424, 106–114. [Google Scholar] [CrossRef]
- Hornes, A.; Hungria, A.B.; Bera, P.; Camara, A.L.; Fernandez-Garcia, M.; Martinez-Arias, A.; Barrio, L.; Estrella, M.; Zhou, G.; Fonseca, J.J.; et al. Inverse CeO2/CuO catalyst as an alternative to classical direct configurations for preferential oxidation of CO in hydrogen-Rich stream. J. Am. Chem. Soc. 2009, 132, 34–35. [Google Scholar] [CrossRef] [PubMed]
- Caputo, T.; Lisi, L.; Pirone, R.; Russo, G. Kinetics of the preferential oxidation of CO over CuO/CeO2 catalysts in H2-Rich gases. Ind. Eng. Chem. Res. 2007, 46, 6793–6800. [Google Scholar] [CrossRef]
- Royer, S.; Duprez, D. Catalytic oxidation of carbon monoxide over transition metal oxides. Chem. Cat. Chem. 2011, 3, 24–65. [Google Scholar] [CrossRef]
- Kim, H.Y.; Liu, P. Complex catalytic behaviors of cutiox mixed-Oxide during CO oxidation. J. Phys. Chem. C 2015, 119, 22985–22991. [Google Scholar] [CrossRef]
- Chen, G.; Xu, Q.; Yang, Y.; Li, C.; Huang, T.; Sun, G.; Zhang, S.; Ma, D.; Li, X. Facile and mild strategy to construct mesoporous CeO2–CuO nanorods with enhanced catalytic activity toward CO oxidation. ACS Appl. Mater. Interfaces 2015, 7, 23538–23544. [Google Scholar] [CrossRef] [PubMed]
- Chen, C.S.; Chen, T.C.; Chen, C.C.; Lai, Y.T.; You, J.H.; Chou, T.M.; Chen, C.H.; Lee, J.-F. Effect of Ti3+ on TiO2-Supported Cu catalysts used for CO oxidation. Langmuir 2012, 28, 9996–10006. [Google Scholar] [CrossRef] [PubMed]
- Bonanni, S.; Aït-Mansour, K.; Harbich, W.; Brune, H. Effect of the TiO2 reduction state on the catalytic CO oxidation on deposited size-Selected pt clusters. J. Am. Chem. Soc. 2012, 134, 3445–3450. [Google Scholar] [CrossRef] [PubMed]
- Fahim, N.F.; Sekino, T. A novel method for synthesis of titania nanotube powders using rapid breakdown anodization. Chem. Mater. 2009, 21, 1967–1979. [Google Scholar] [CrossRef]
- Yuan, L.; Meng, S.; Zhou, Y.; Yue, Z. Controlled synthesis of anatase TiO2 nanotube and nanowire arrays via aao template-Based hydrolysis. J. Mater. Chem. A 2013, 1, 2552–2557. [Google Scholar] [CrossRef]
- Kubo, T.; Nakahira, A. Local structure of TiO2-derived nanotubes prepared by the hydrothermal process. J. Phys. Chem. C 2008, 112, 1658–1662. [Google Scholar] [CrossRef]
- Khan, M.A.; Jung, H.-T.; Yang, O.B. Synthesis and characterization of ultrahigh crystalline TiO2 nanotubes. J. Phys. Chem. B 2006, 110, 6626–6630. [Google Scholar] [CrossRef] [PubMed]
- Nakahira, A.; Kubo, T.; Yamasaki, Y. Microstructural control of mesoporous bulk composed of TiO2-derived titanate nanotubes. ACS Appl. Mater. Interfaces 2010, 2, 1136–1140. [Google Scholar] [CrossRef] [PubMed]
- Nakahira, A.; Kubo, T.; Numako, C. TiO2-derived titanate nanotubes by hydrothermal process with acid treatments and their microstructural evaluation. ACS Appl. Mater. Interfaces 2010, 2, 2611–2616. [Google Scholar] [CrossRef] [PubMed]
- Huang, J.; Cao, Y.; Huang, Q.; He, H.; Liu, Y.; Guo, W.; Hong, M. High-Temperature formation of titanate nanotubes and the transformation mechanism of nanotubes into nanowires. Cryst. Growth Des. 2009, 9, 3632–3637. [Google Scholar] [CrossRef]
- Wajid Shah, M.; Zhu, Y.; Fan, X.; Zhao, J.; Li, Y.; Asim, S.; Wang, C. Facile synthesis of defective TiO2−x nanocrystals with high surface area and tailoring bandgap for visible-Light photocatalysis. Sci. Rep. 2015, 5. [Google Scholar] [CrossRef] [PubMed]
- Fang, B.; Xing, Y.; Bonakdarpour, A.; Zhang, S.; Wilkinson, D.P. Hierarchical CuO–TiO2 hollow microspheres for highly efficient photodriven reduction of CO2 to CH4. ACS Sustain. Chem. Eng. 2015, 3, 2381–2388. [Google Scholar] [CrossRef]
- Thi Hiep, N.; Thu Loan, N.; Thi Dieu Thuy, U.; Quang Liem, N. Synthesis and characterization of nano-CuO and CuO/TiO2 photocatalysts. Adv. Nat. Sci. Nanosci. Nanotechnol. 2013, 4. [Google Scholar] [CrossRef]
- Senthilkumar, V.; Kim, Y.S.; Chandrasekaran, S.; Rajagopalan, B.; Kim, E.J.; Chung, J.S. Comparative supercapacitance performance of CuO nanostructures for energy storage device applications. RSC Adv. 2015, 5, 20545–20553. [Google Scholar] [CrossRef]
- Liu, Z.; Zhou, C. Improved photocatalytic activity of nano CuO-Incorporated TiO2 granules prepared by spray drying. Prog. Nat. Sci. Mater. Int. 2015, 25, 334–341. [Google Scholar] [CrossRef]
- Kochkar, H.; Lakhdhar, N.; Berhault, G.; Bausach, M.; Ghorbel, A. Optimization of the alkaline hydrothermal route to titanate nanotubes by a doehlert matrix experience design. J. Phys. Chem. C 2009, 113, 1672–1679. [Google Scholar] [CrossRef]
- Jang, J.S.; Choi, S.H.; Kim, D.H.; Jang, J.W.; Lee, K.S.; Lee, J.S. Enhanced photocatalytic hydrogen production from water−Methanol solution by nickel intercalated into titanate nanotube. J. Phys. Chem. C 2009, 113, 8990–8996. [Google Scholar] [CrossRef]
- Ganesh, I.; Kumar, P.P.; Annapoorna, I.; Sumliner, J.M.; Ramakrishna, M.; Hebalkar, N.Y.; Padmanabham, G.; Sundararajan, G. Preparation and characterization of Cu-Doped TiO2 materials for electrochemical, photoelectrochemical, and photocatalytic applications. Appl. Surf. Sci. 2014, 293, 229–247. [Google Scholar] [CrossRef]
- Ren, R.; Wen, Z.; Cui, S.; Hou, Y.; Guo, X.; Chen, J. Controllable synthesis and tunable photocatalytic properties of Ti3+-Doped TiO2. Sci. Rep. 2015, 5. [Google Scholar] [CrossRef] [PubMed]
- Wang, Y.; Duan, W.; Liu, B.; Chen, X.; Yang, F.; Guo, J. The effects of doping copper and mesoporous structure on photocatalytic properties of TiO2. J. Nanomater. 2014. [Google Scholar] [CrossRef]
- Wu, Q.; Li, J.; Zhang, W.; Qian, H.; She, W.; Pan, H.; Wen, J.; Zhang, X.; Liu, X.; Jiang, X. Antibacterial property, angiogenic and osteogenic activity of Cu-Incorporated TiO2 coating. J. Mater. Chem. B 2014, 2, 6738–6748. [Google Scholar] [CrossRef]
- Deng, C.; Li, B.; Dong, L.; Zhang, F.; Fan, M.; Jin, G.; Gao, J.; Gao, L.; Zhang, F.; Zhou, X. No reduction by co over CuO supported on CeO2-Doped TiO2: The effect of the amount of a few CeO2. Phys. Chem. Chem. Phys. 2015, 17, 16092–16109. [Google Scholar] [CrossRef] [PubMed]
- Ola, O.; Mercedes Maroto-Valer, M. Copper based TiO2 honeycomb monoliths for CO2 photoreduction. Catal. Sci. Technol. 2014, 4, 1631–1637. [Google Scholar] [CrossRef]
- Tsai, C.-Y.; Hsi, H.-C.; Kuo, T.-H.; Chang, Y.-M.; Liou, J.-H. Preparation of cu-Doped TiO2 photocatalyst with thermal plasma torch for low-Concentration mercury removal. Aerosol Air Qual. Res. 2013, 13. [Google Scholar] [CrossRef]
- Li, W.; Liang, R.; Hu, A.; Huang, Z.; Zhou, Y.N. Generation of oxygen vacancies in visible light activated one-Dimensional iodine TiO2 photocatalysts. RSC Adv. 2014, 4, 36959–36966. [Google Scholar] [CrossRef]
- Shan, Z.; Archana, P.S.; Shen, G.; Gupta, A.; Bakker, M.G.; Pan, S. Nanocot: Low-Cost nanostructured electrode containing carbon, oxygen, and titanium for efficient oxygen evolution reaction. J. Am. Chem. Soc. 2015, 137, 11996–12005. [Google Scholar] [CrossRef] [PubMed]
- Zhang, Y.-G.; Ma, L.-L.; Li, J.-L.; Yu, Y. In situ fenton reagent generated from TiO2/Cu2O composite film: A new way to utilize TiO2 under visible light irradiation. Environ. Sci. Technol. 2007, 41, 6264–6269. [Google Scholar] [CrossRef] [PubMed]
- Li, Y.; Xu, B.; Fan, Y.; Feng, N.; Qiu, A.; He, J.M.J.; Yang, H.; Chen, Y. The effect of titania polymorph on the strong metal-Support interaction of Pd/TiO2 catalysts and their application in the liquid phase selective hydrogenation of long chain alkadienes. J. Mol. Catal. A Chem. 2004, 216, 107–114. [Google Scholar] [CrossRef]
- Chen, C.-A.; Chen, Y.-M.; Huang, Y.-S.; Tsai, D.-S.; Tiong, K.-K.; Liao, P.-C. Synthesis and characterization of well-Aligned anatase TiO2 nanocrystals on fused silicavia metal-Organic vapor deposition. CrystEngComm 2009, 11, 2313–2318. [Google Scholar] [CrossRef]
- Tian, F.; Zhang, Y.; Zhang, J.; Pan, C. Raman spectroscopy: A new approach to measure the percentage of anatase TiO2 exposed (001) facets. J. Phys. Chem. C 2012, 116, 7515–7519. [Google Scholar] [CrossRef]
- Sahoo, S.; Arora, A.K.; Sridharan, V. Raman line shapes of optical phonons of different symmetries in anatase TiO2 nanocrystals. J. Phys. Chem. C 2009, 113, 16927–16933. [Google Scholar] [CrossRef]
- Santara, B.; Giri, P.K.; Imakita, K.; Fujii, M. Evidence for ti interstitial induced extended visible absorption and near infrared photoluminescence from undoped TiO2 nanoribbons: An in situ photoluminescence study. J. Phys. Chem. C 2013, 117, 23402–23411. [Google Scholar] [CrossRef]
- Choudhury, B.; Dey, M.; Choudhury, A. Defect generation, d-d transition, and band gap reduction in Cu-Doped TiO2 nanoparticles. Int. Nano Lett. 2013, 3, 1–8. [Google Scholar] [CrossRef]
- Choudhury, B.; Choudhury, A. Dopant induced changes in structural and optical properties of Cr3+ doped TiO2 nanoparticles. Mater. Chem. Phys. 2012, 132, 1112–1118. [Google Scholar] [CrossRef]
- Navas, J.; Sanchez-Coronilla, A.; Aguilar, T.; Hernandez, N.C.; de los Santos, D.M.; Sanchez-Marquez, J.; Zorrilla, D.; Fernandez-Lorenzo, C.; Alcantara, R.; Martin-Calleja, J. Experimental and theoretical study of the electronic properties of Cu-Doped anatase TiO2. Phys. Chem. Chem. Phys. 2014, 16, 3835–3845. [Google Scholar] [CrossRef] [PubMed]
- Vaseem, M.; Hong, A.R.; Kim, R.-T.; Hahn, Y.-B. Copper oxide quantum dot ink for inkjet-Driven digitally controlled high mobility field effect transistors. J. Mater. Chem. C 2013, 1, 2112–2120. [Google Scholar] [CrossRef]
- Kung, M.C.; Davis, R.J.; Kung, H.H. Understanding Au-Catalyzed low-Temperature CO oxidation. J. Phys. Chem. C 2007, 111, 11767–11775. [Google Scholar] [CrossRef]
- Haruta, M. Catalysis of gold nanoparticles deposited on metal oxides. CATTECH 2002, 6, 102–115. [Google Scholar] [CrossRef]
- Zou, X.; Xu, J.; Qi, S.; Suo, Z.; An, L.; Li, F. Effects of preparation conditions of Au/FeOx/Al2O3 catalysts prepared by a modified two-Step method on the stability for CO oxidation. J. Nat. Gas Chem. 2011, 20, 41–47. [Google Scholar] [CrossRef]
- Kang, M.Y.; Yun, H.J.; Yu, S.; Kim, W.; Kim, N.D.; Yi, J. Effect of TiO2 crystalline phase on CO oxidation over CuO catalysts supported on TiO2. J. Mol. Catal. A Chem. 2013, 368–369, 72–77. [Google Scholar] [CrossRef]
- Carabineiro, S.A.C.; Bogdanchikova, N.; Avalos-Borja, M.; Pestryakov, A.; Tavares, P.B.; Figueiredo, J.L. Gold supported on metal oxides for carbon monoxide oxidation. Nano Res. 2011, 4, 180–193. [Google Scholar] [CrossRef]
- Satsuma, A.; Yanagihara, M.; Osaki, K.; Saeki, Y.; Liu, H.; Yamamoto, Y.; Arai, S.; Ohyama, J. Promotion of low-temperature oxidation of co over pd supported on titania-Coated ceria. RSC Adv. 2014, 4, 54187–54193. [Google Scholar] [CrossRef]
- Vedyagin, A.A.; Volodin, A.M.; Kenzhin, R.M.; Chesnokov, V.V.; Mishakov, I.V. CO oxidation over Pd/ZrO2 catalysts: Role of support’s donor sites. Molecules 2016, 21. [Google Scholar] [CrossRef] [PubMed]
- Ayastuy, J.L.; Gurbani, A.; González-Marcos, M.P.; Gutiérrez-Ortiz, M.A. Kinetics of carbon monoxide oxidation over CuO supported on nanosized CeO2. Ind. Eng. Chem. Res. 2009, 48, 5633–5641. [Google Scholar] [CrossRef]
- Duprat, F. Light-Off curve of catalytic reaction and kinetics. Chem. Eng. Sci. 2002, 57, 901–911. [Google Scholar] [CrossRef]
- Lu, J.-Q.; Sun, C.-X.; Li, N.; Jia, A.-P.; Luo, M.-F. Kinetic study of co oxidation over CuO/MO2 (m = si, ti and ce) catalysts. Appl. Surf. Sci. 2013, 287, 124–134. [Google Scholar] [CrossRef]
- Roduner, E. Understanding catalysis. Chem. Soc. Rev. 2014, 43, 8226–8239. [Google Scholar] [CrossRef] [PubMed]
- Jia, A.-P.; Deng, Y.; Hu, G.-S.; Luo, M.-F.; Lu, J.-Q. Kinetic and activity study of CO oxidation over CuO–MnOx–CeO2 catalysts. React. Kinet. Mech. Catal. 2016, 117, 503–520. [Google Scholar] [CrossRef]
- Sun, K.C.; Qadir, M.B.; Jeong, S.H. Hydrothermal synthesis of TiO2 nanotubes and their application as an over-Layer for dye-Sensitized solar cells. RSC Adv. 2014, 4, 23223–23230. [Google Scholar] [CrossRef]
Figure 1.
SEM images of (a) precursor TiO2 particles; (b) pristine TiO2 NTs prepared by hydrothermal treatment and (c,d); CuO-TiO2 NT catalyst.
Figure 1.
SEM images of (a) precursor TiO2 particles; (b) pristine TiO2 NTs prepared by hydrothermal treatment and (c,d); CuO-TiO2 NT catalyst.
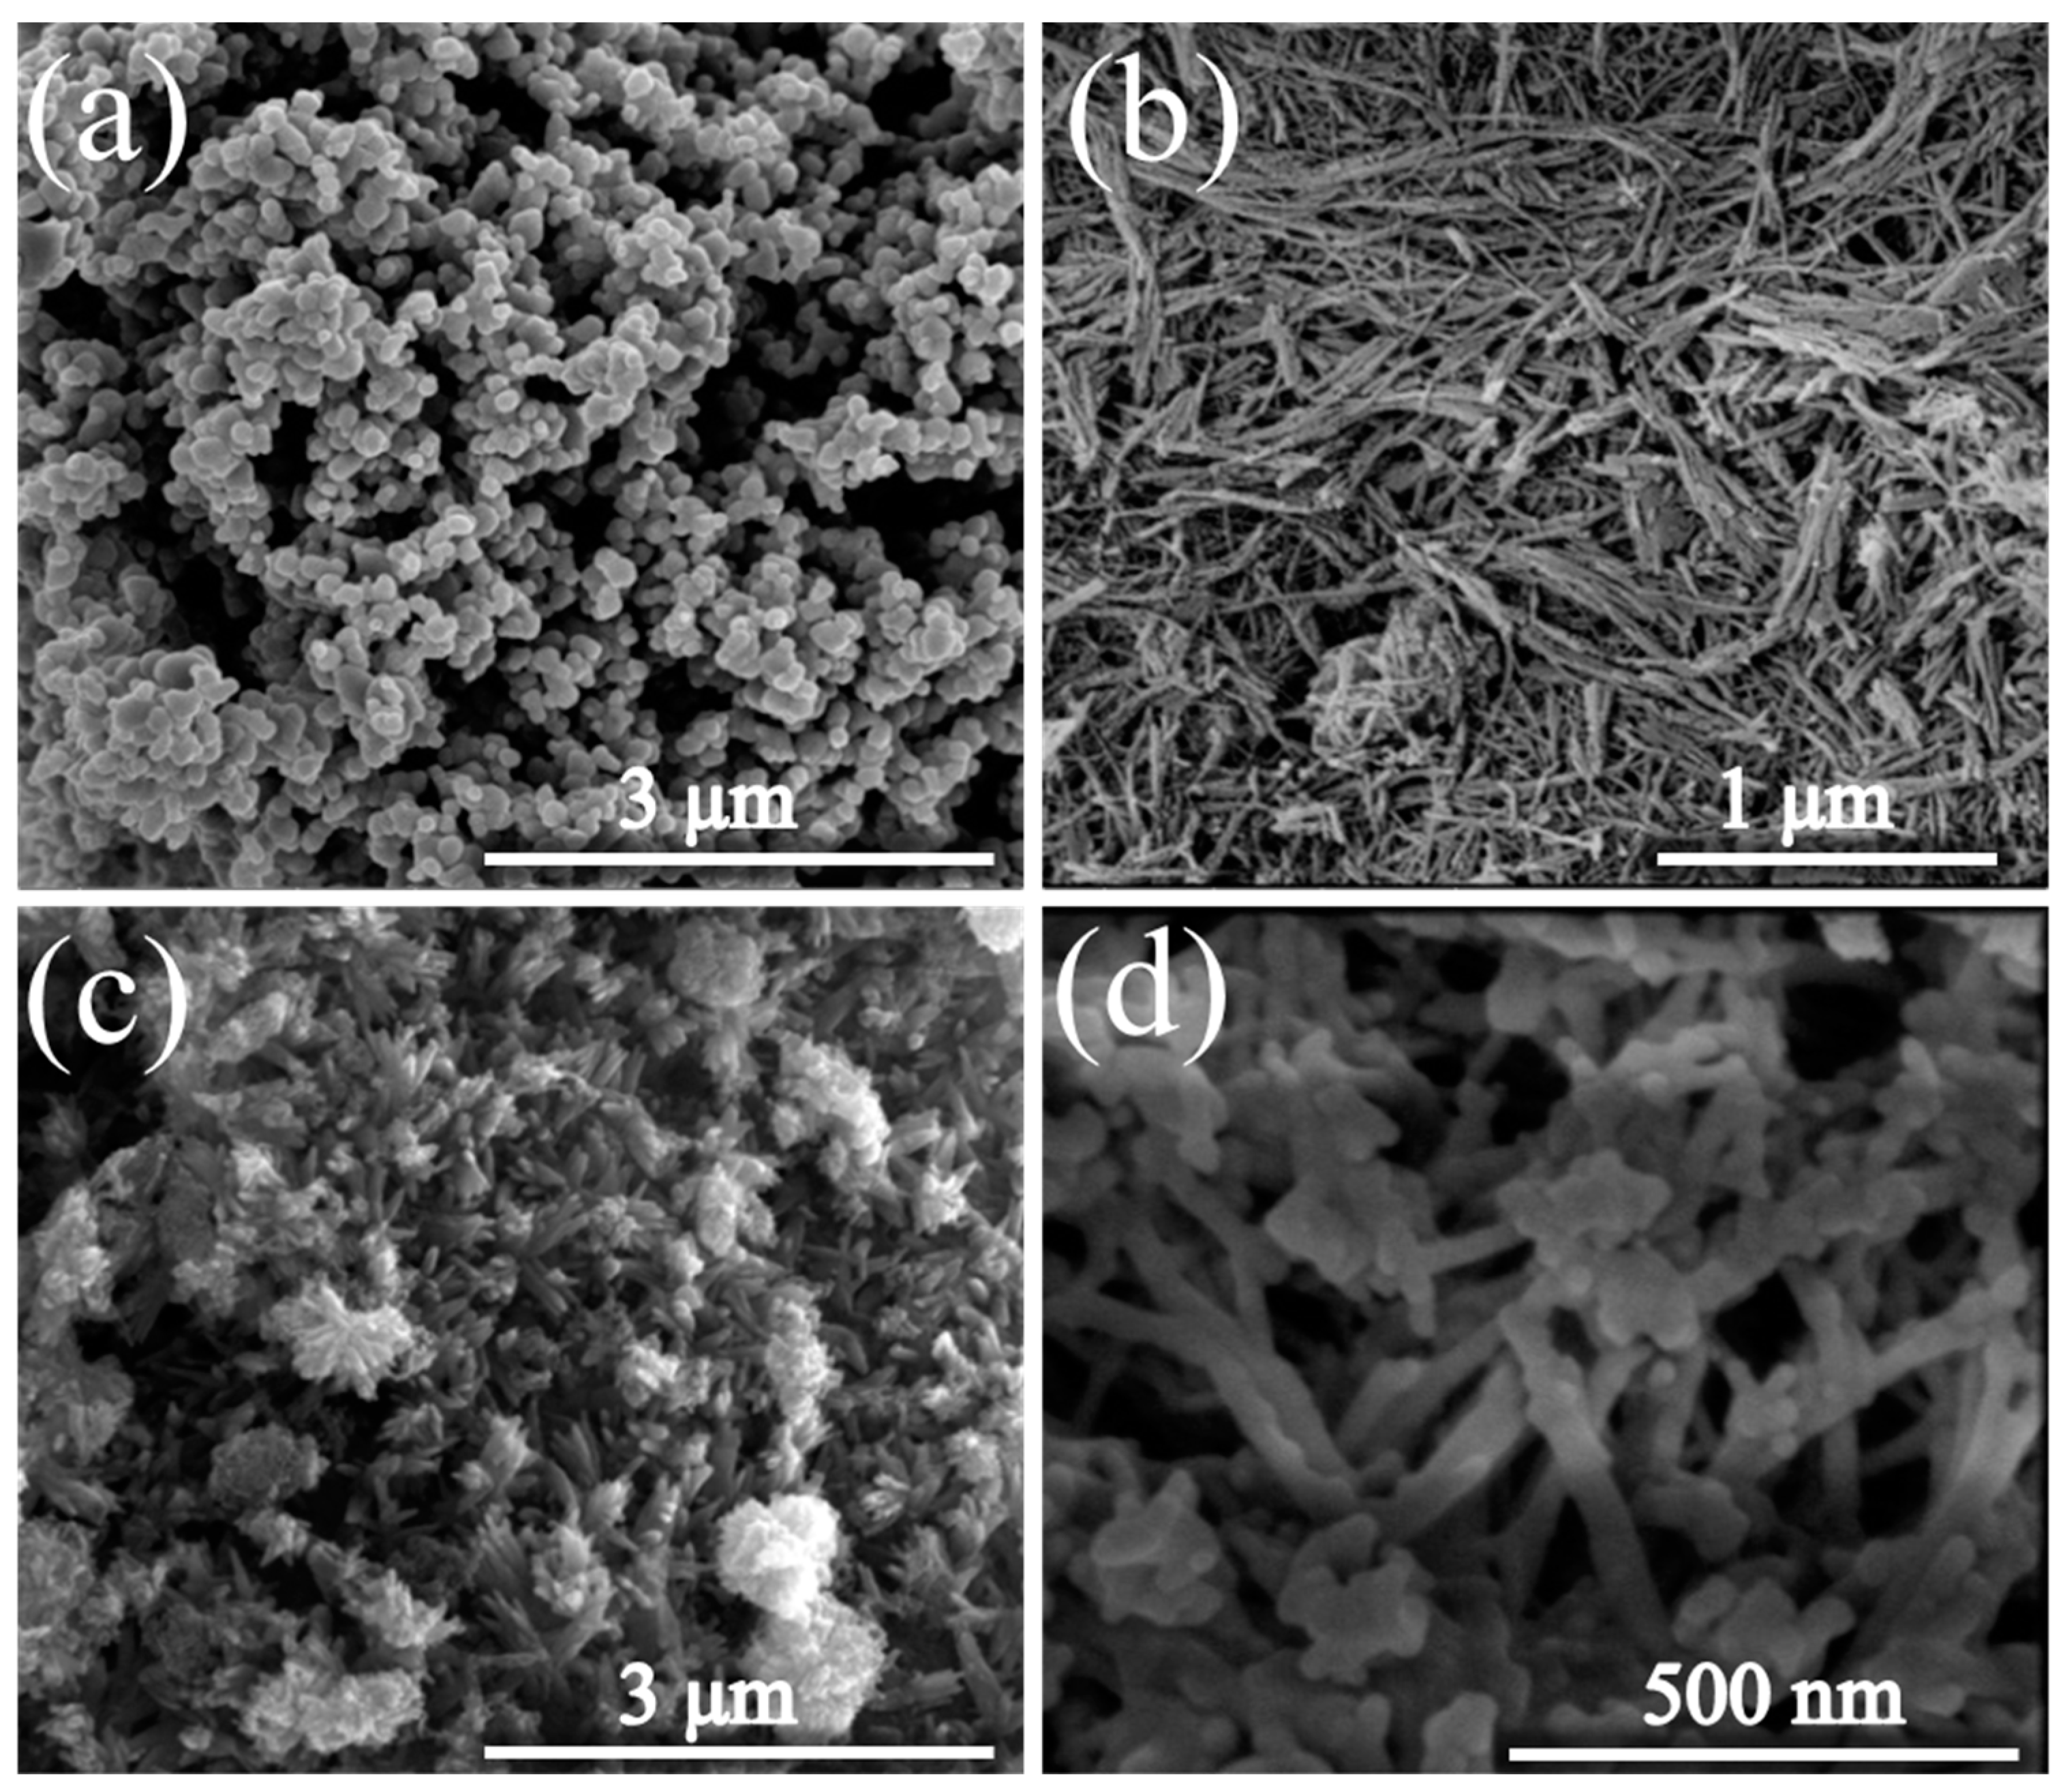
Figure 2.
TEM images of (a) TiO2 NTs prepared by hydrothermal treatment and (b) CuO-TiO2 NT catalyst.
Figure 2.
TEM images of (a) TiO2 NTs prepared by hydrothermal treatment and (b) CuO-TiO2 NT catalyst.
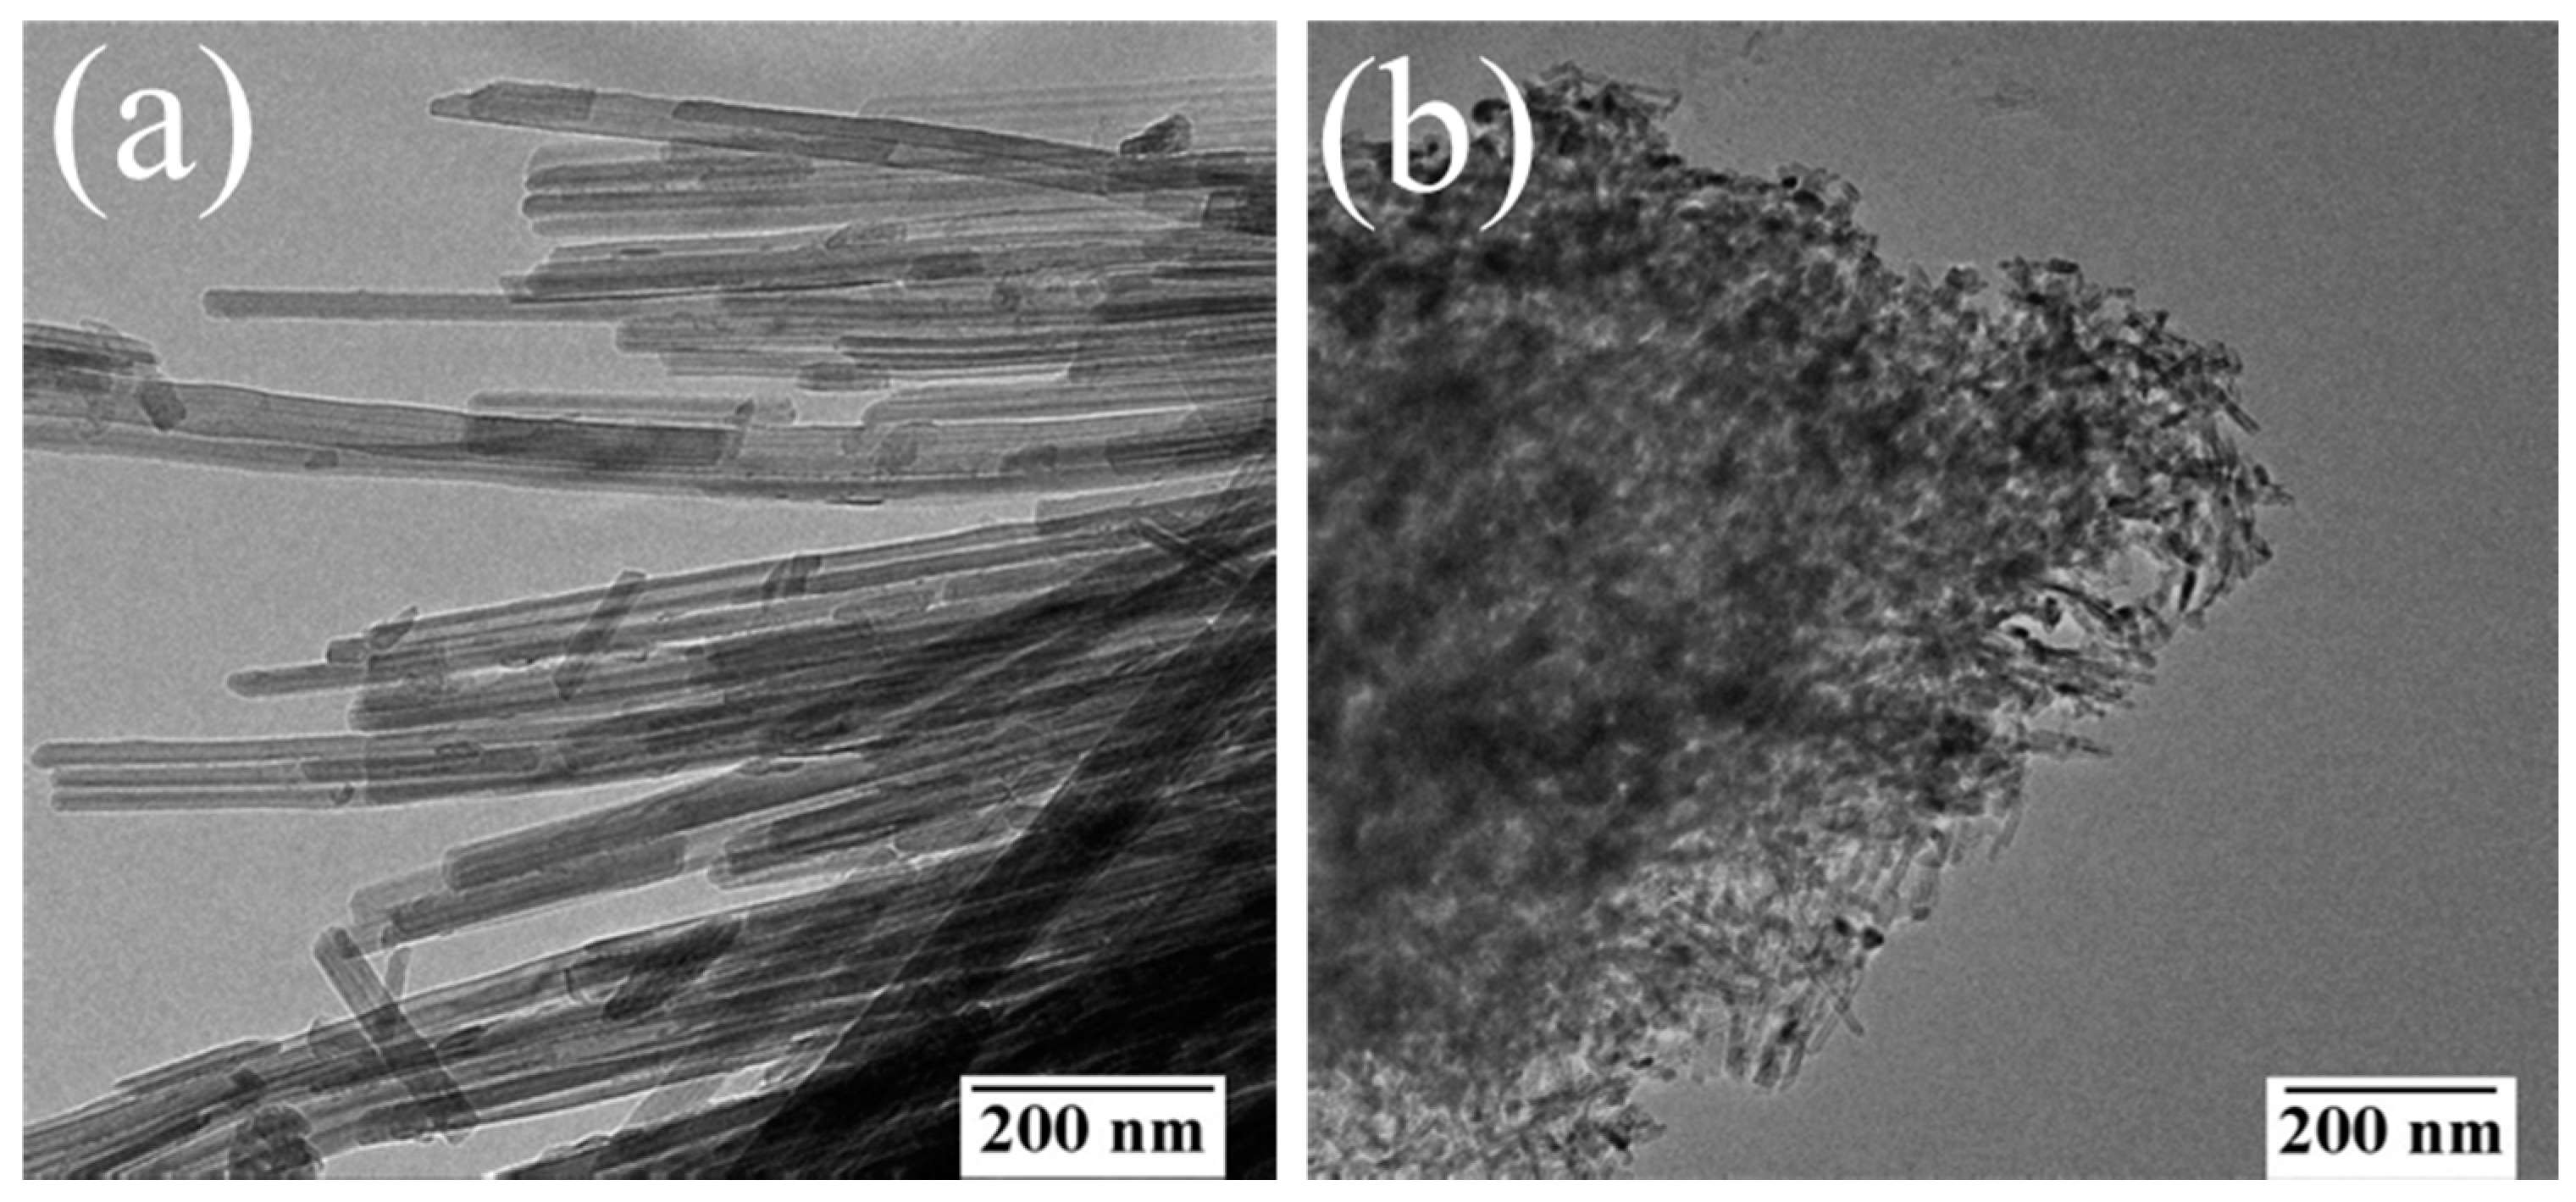
Figure 3.
(a–e) Energy-dispersive X-ray spectroscopy (EDS) elemental mapping and (f) elemental analysis of CuO-TiO2 NT catalyst. Insert in (a) is a low-resolution SEM image of area selected for mapping.
Figure 3.
(a–e) Energy-dispersive X-ray spectroscopy (EDS) elemental mapping and (f) elemental analysis of CuO-TiO2 NT catalyst. Insert in (a) is a low-resolution SEM image of area selected for mapping.
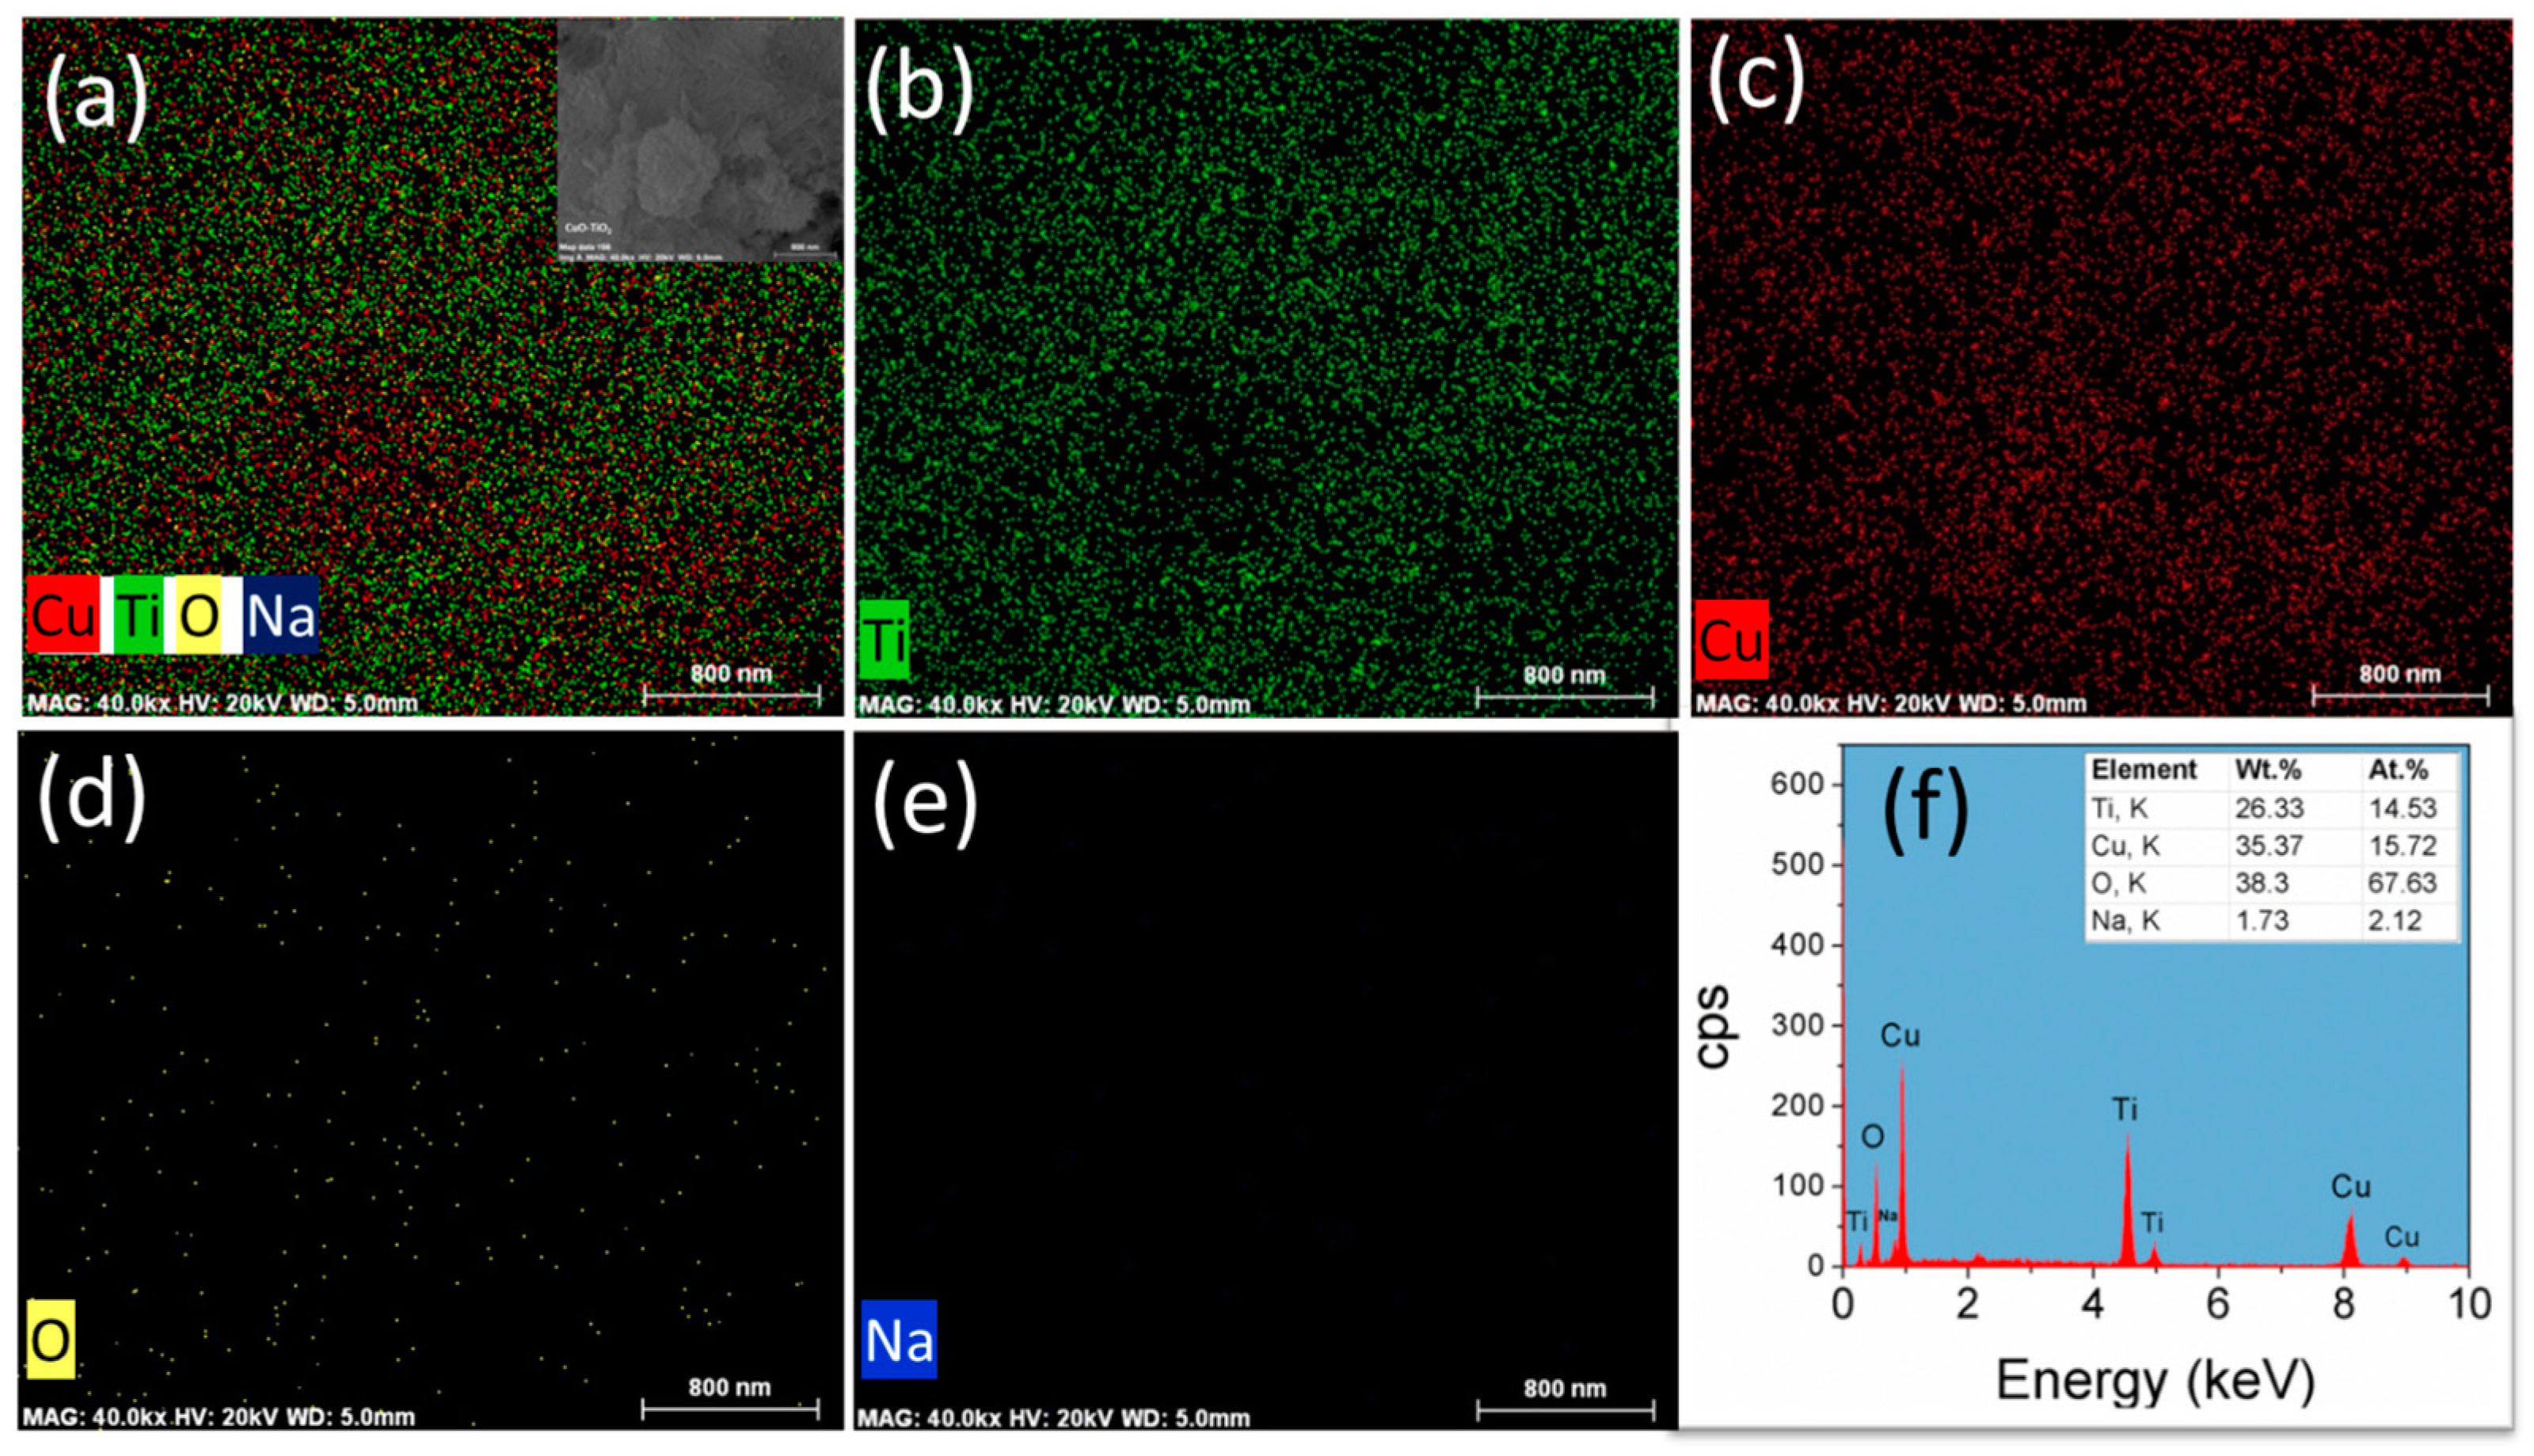
Figure 4.
(a) XRD patterns of precursor anatase TiO2, pristine TiO2 NTs prepared by hydrothermal method, 20CuO-TiO2 NT, and pure CuO nanoparticles; (b) TGA graphs of anatase TiO2, pristine TiO2 NT, 10CuO-TiO2 NT, and 50CuO-TiO2 NT catalysts.
Figure 4.
(a) XRD patterns of precursor anatase TiO2, pristine TiO2 NTs prepared by hydrothermal method, 20CuO-TiO2 NT, and pure CuO nanoparticles; (b) TGA graphs of anatase TiO2, pristine TiO2 NT, 10CuO-TiO2 NT, and 50CuO-TiO2 NT catalysts.

Figure 5.
(a–c) Multipoint BET nitrogen adsorption-desorption isotherms of (a) precursor TiO2 particles; (b) pristine TiO2 NTs; and (c) xCuO-TiO2 NT catalysts with different Cu loading; (d) Plot showing variation of the surface area and total pore volume with changing Cu loading of xCuO-TiO2 NT catalysts.
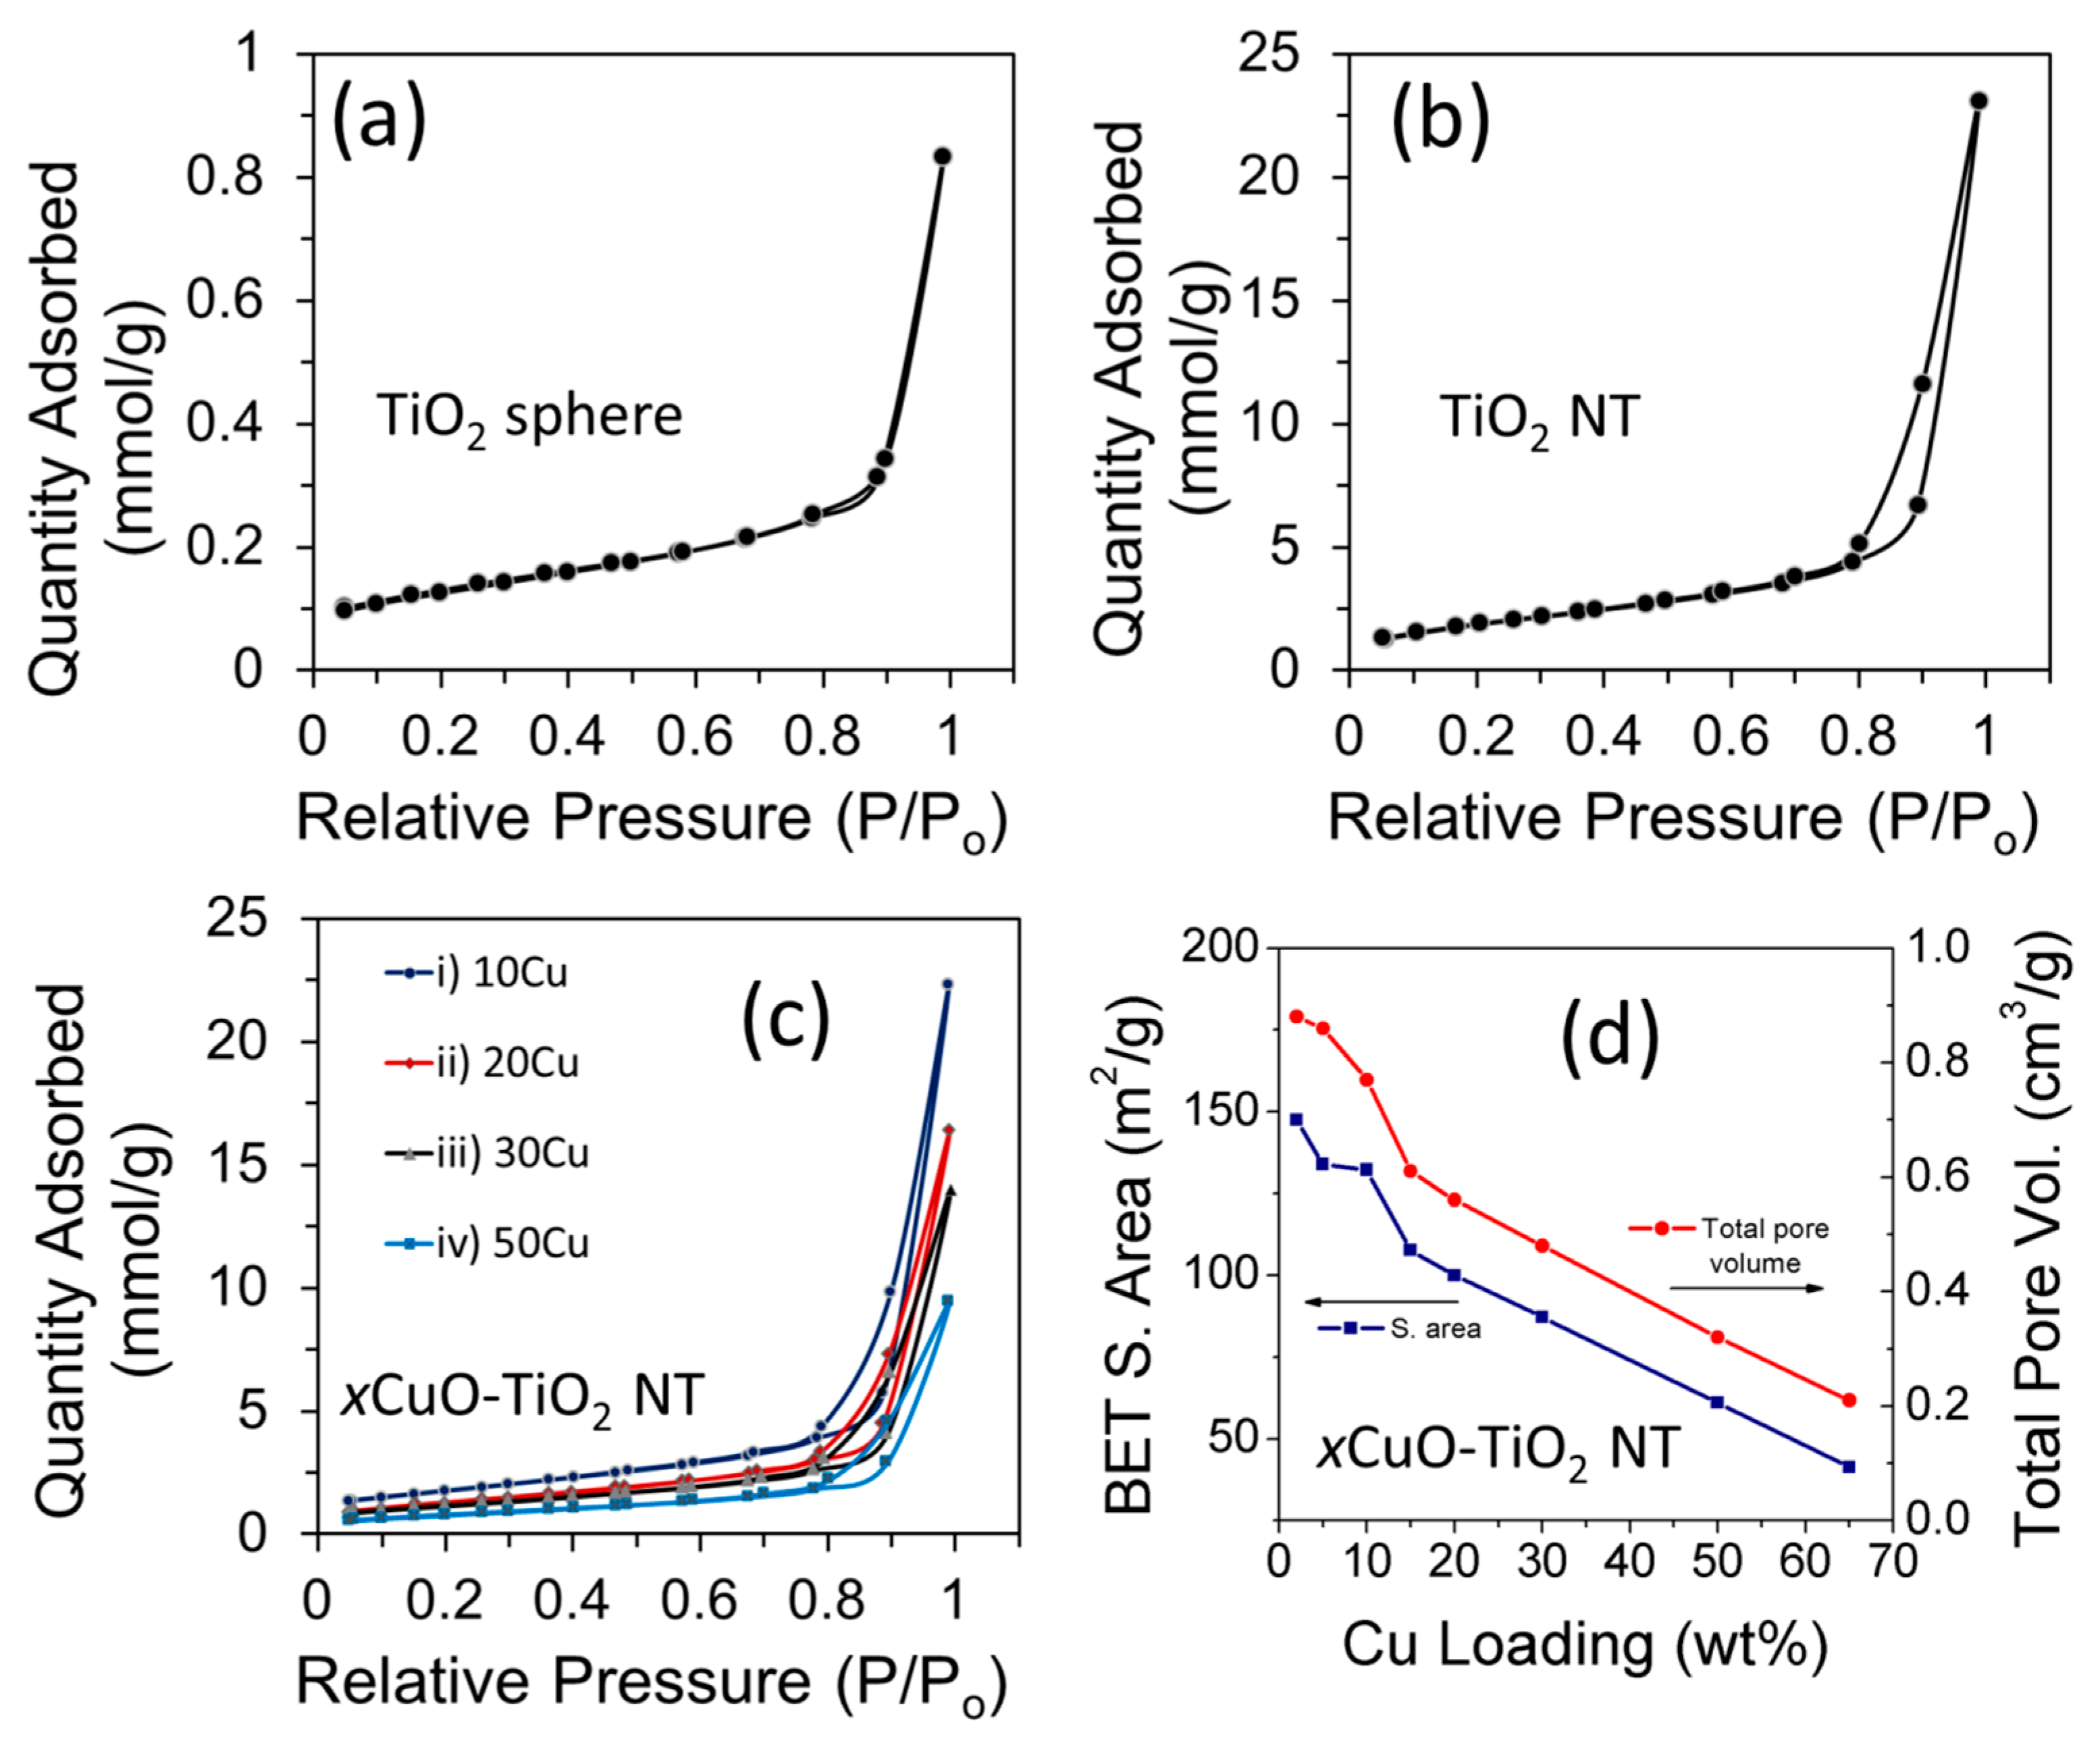
Figure 6.
(a–c) XPS spectra of high-resolution scan of (a) Ti 2p; (b) O 1s of TiO2 NT and CuO-TiO2 NTs; (c) Cu 2p of CuO and CuO-TiO2 NTs; (d) H2-TPR profiles of CuO and CuO-TiO2 NTs catalyst (peaks: α = 136 °C, β = 218 °C, γ = 236 °C, δ = 270 °C).
Figure 6.
(a–c) XPS spectra of high-resolution scan of (a) Ti 2p; (b) O 1s of TiO2 NT and CuO-TiO2 NTs; (c) Cu 2p of CuO and CuO-TiO2 NTs; (d) H2-TPR profiles of CuO and CuO-TiO2 NTs catalyst (peaks: α = 136 °C, β = 218 °C, γ = 236 °C, δ = 270 °C).

Figure 7.
(a–c) Raman spectra of anatase TiO2 particles, TiO2 NTs, and CuO-TiO2 NTs; (b) shows the up-shift of Eg mode of TiO2 from 140 to 145 cm−1; and (c) shows the CuO peak at 274 cm−1.
Figure 7.
(a–c) Raman spectra of anatase TiO2 particles, TiO2 NTs, and CuO-TiO2 NTs; (b) shows the up-shift of Eg mode of TiO2 from 140 to 145 cm−1; and (c) shows the CuO peak at 274 cm−1.

Figure 8.
(a,b) CO oxidation light-off curves of TiO2 NT, CuO, and different xCuO-TiO2 NT catalysts; (c) Curve showing the variation of the temperature for complete CO conversion (T100) versus CuO loading; (d) CO oxidation long-term stability of 50CuO-TiO2 NT catalyst under continuous stream for 60 h at ~160 ± 5 °C.

Figure 9.
(a–c) the variation of the CO fractional conversion ( with ratio; (d–f) Arrhenius plots for the 2CuO-TiO2 NT, 20CuO-TiO2 NT, and 50CuO-TiO2 NT catalysts, respectively.
Figure 9.
(a–c) the variation of the CO fractional conversion ( with ratio; (d–f) Arrhenius plots for the 2CuO-TiO2 NT, 20CuO-TiO2 NT, and 50CuO-TiO2 NT catalysts, respectively.
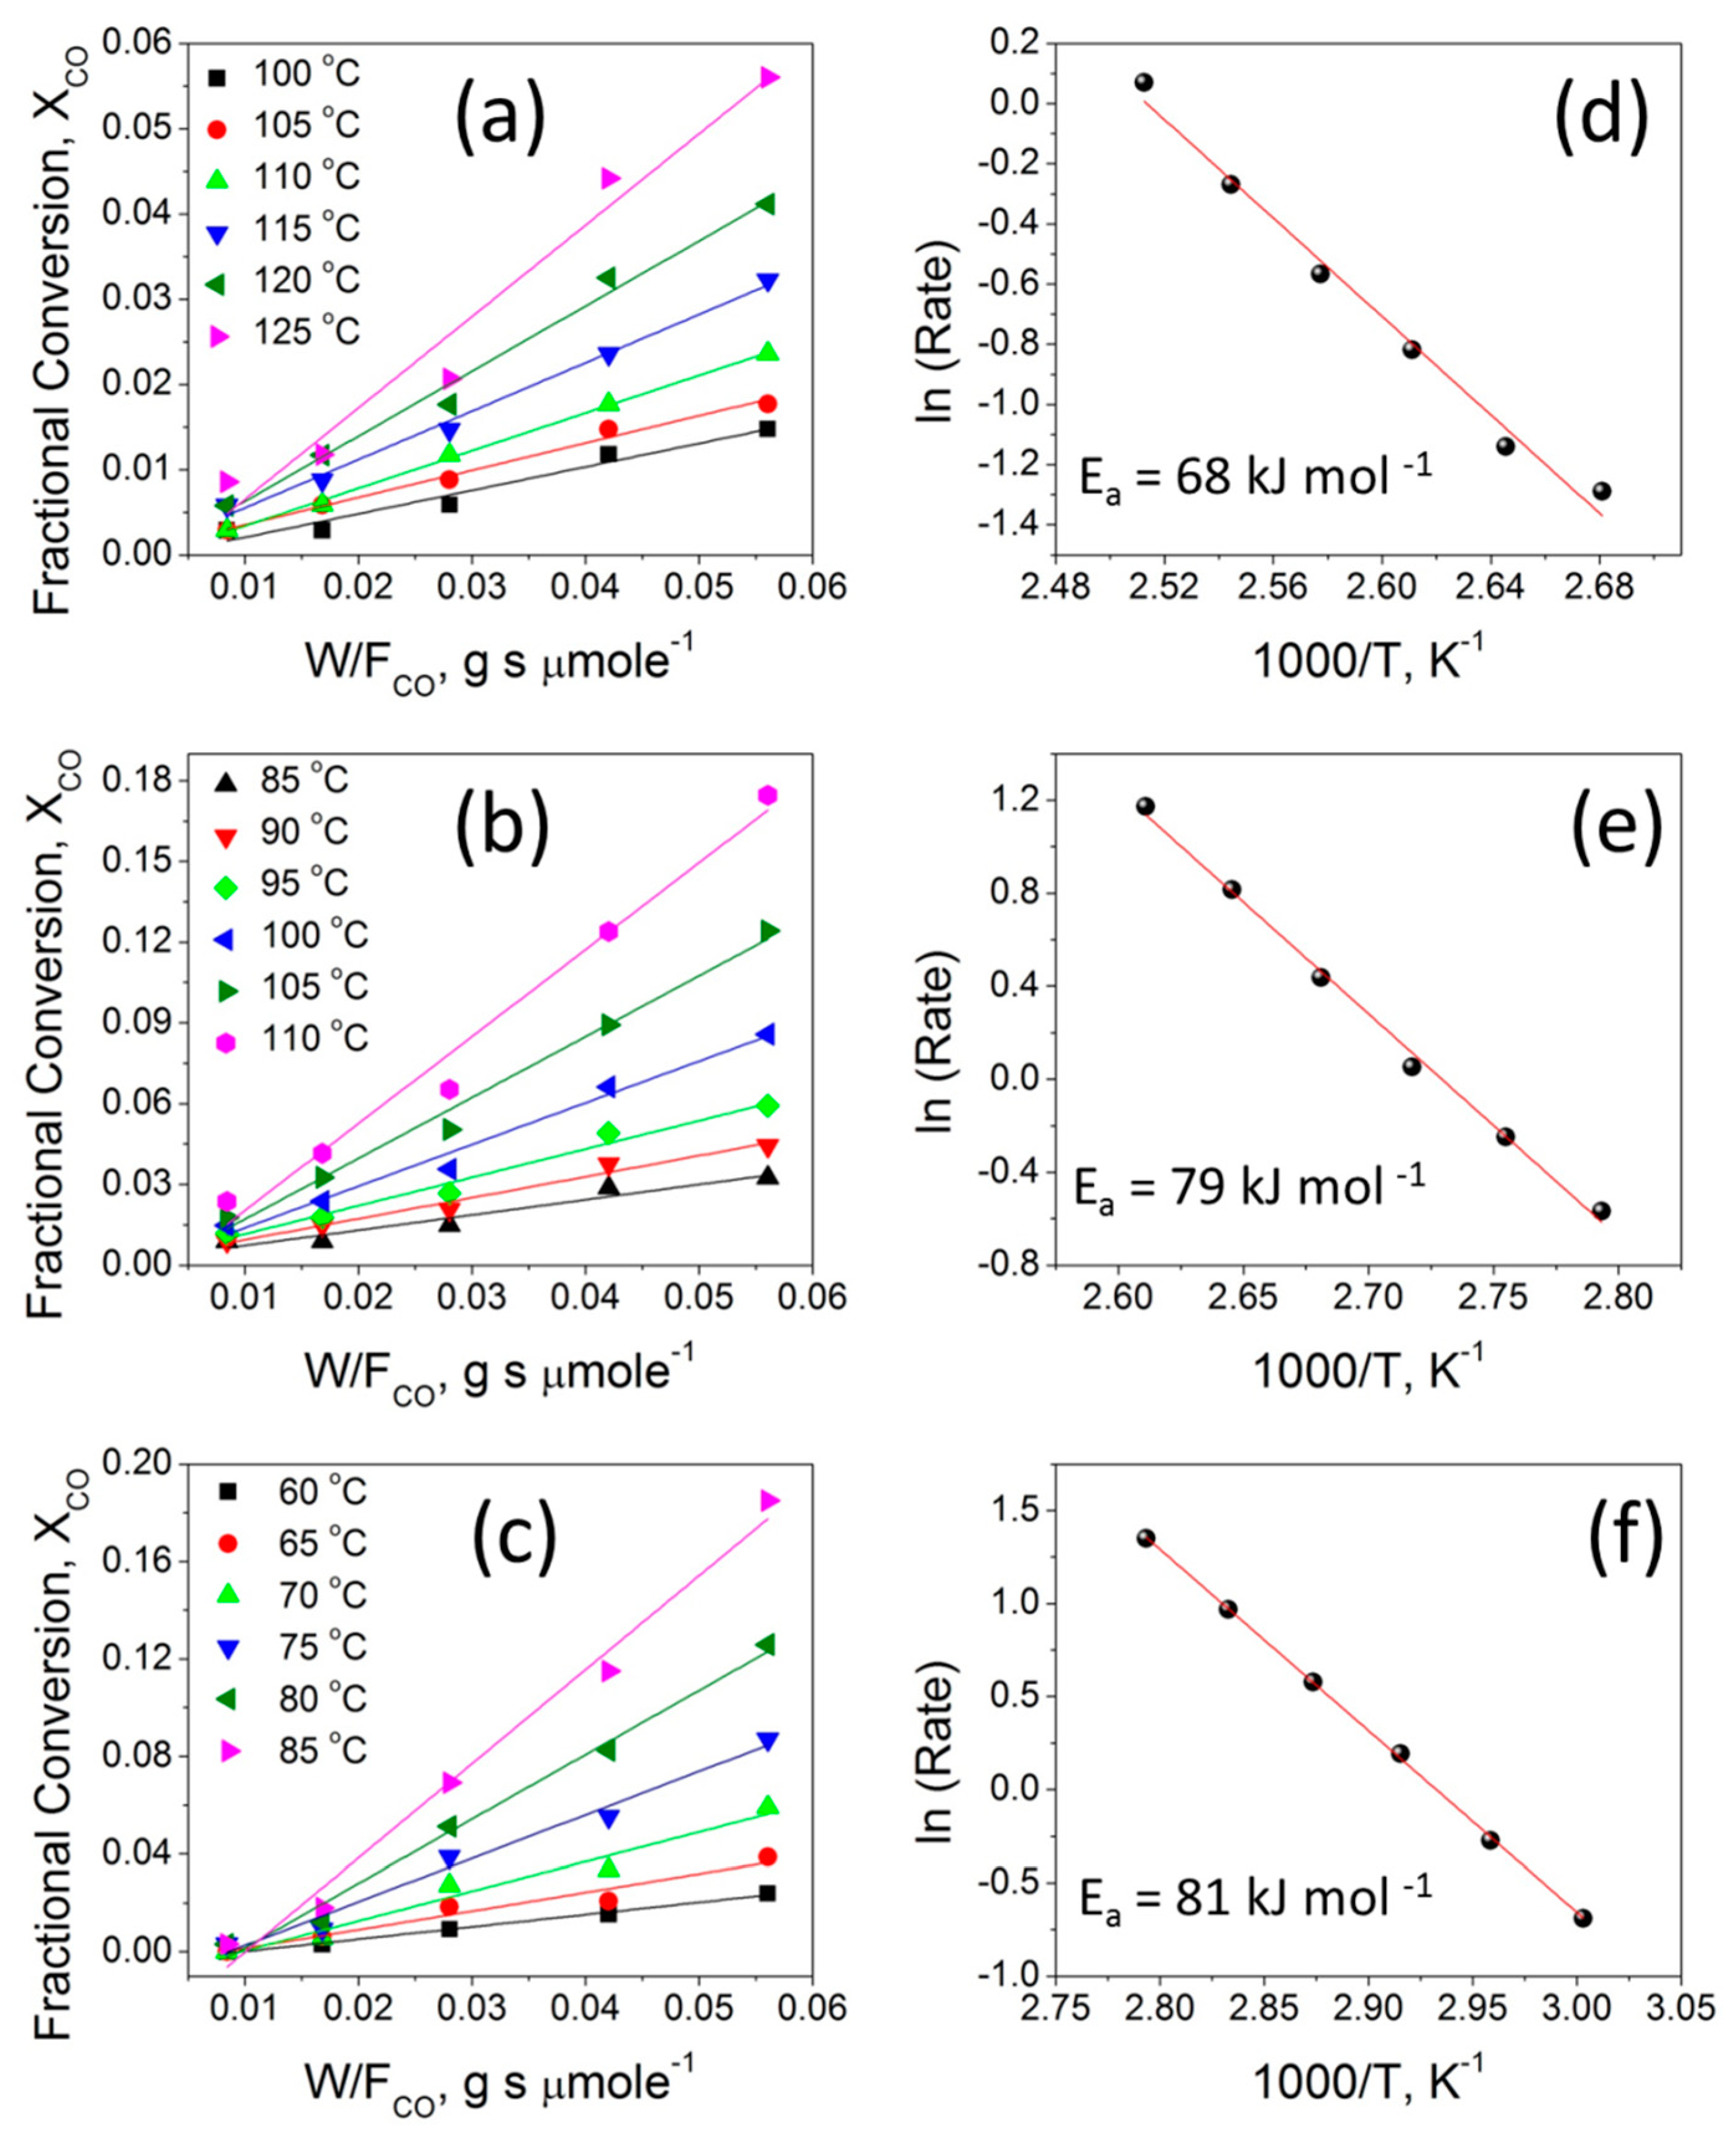
Figure 10.
Schematic representation of the catalytic CO oxidation experimental set-up.

Table 1.
BET surface area, total pore volume, and average pore diameter of different catalysts.
| Catalyst | BET Surface Area (m²/g) | Total Pore Volume (cm³/g) | Average Pore Width (nm) |
|---|---|---|---|
| CuO | 33.5 | 0.30 | 35.8 |
| TiO2 P25 | 44.8 | 0.15 | 12.2 |
| TiO2 (Anatase) | 9.1 | 0.02 | 12.6 |
| TiO2 NT | 183.2 | 0.76 | 16.7 |
| 2CuO-TiO2 NT | 147.5 | 0.88 | 23.9 |
| 5CuO-TiO2 NT | 133.9 | 0.86 | 25.7 |
| 10CuO-TiO2 NT | 132.2 | 0.77 | 23.4 |
| 15CuO-TiO2 NT | 107.6 | 0.61 | 22.7 |
| 20CuO-TiO2 NT | 99.9 | 0.56 | 22.7 |
| 30CuO-TiO2 NT | 87.2 | 0.48 | 22.2 |
| 50CuO-TiO2 NT | 60.95 | 0.32 | 21.4 |
| 65CuO-TiO2 NT | 41.3 | 0.21 | 21.2 |
Table 2.
The calculated reaction rates, CO conversion at selected temperatures, and the apparent activation energy for different CuO-TiO2 catalysts.
Table 2.
The calculated reaction rates, CO conversion at selected temperatures, and the apparent activation energy for different CuO-TiO2 catalysts.
| Catalyst | Reaction Rate (µmole s−1 g−1) 1 | CO Conversion (%) at T = 155 °C | Temperatures | Ea (kJ mol−1) 2 | |
|---|---|---|---|---|---|
| T50 | T70 | ||||
| 2CuO-TiO2 NT | 4.3 | 12 | 193 | 211 | 68.0 ± 3.8 |
| 5CuO-TiO2 NT | 14 | 40 | 161 | 179 | - |
| 10CuO-TiO2 NT | 23 | 66 | 145 | 158 | - |
| 15CuO-TiO2 NT | 28 | 78 | 137 | 148 | - |
| 20CuO-TiO2 NT | 30 | 84 | 139 | 146 | - |
| 20CuO- TiO2 P25 | 17 | 46 | 156 | 166 | 79.8 ± 2.4 |
| 30CuO-TiO2 NT | 32 | 91 | 139 | 144 | - |
| 50CuO-TiO2 NT | 36 | 100 | 108 | 111 | 81.0 ±0.7 |
| 65CuO-TiO2 NT | 33 | 33 | 144 | 147 | - |
1 Determined at T = 155 °C; 2 Determined for selected catalysts as indicated with R2 = 0.99 in each case.
© 2017 by the authors. Licensee MDPI, Basel, Switzerland. This article is an open access article distributed under the terms and conditions of the Creative Commons Attribution (CC BY) license (http://creativecommons.org/licenses/by/4.0/).
Share and Cite
MDPI and ACS Style
Zedan, A.F.; Allam, N.K.; AlQaradawi, S.Y. A Study of Low-Temperature CO Oxidation over Mesoporous CuO-TiO2 Nanotube Catalysts. Catalysts 2017, 7, 129. https://doi.org/10.3390/catal7050129
AMA Style
Zedan AF, Allam NK, AlQaradawi SY. A Study of Low-Temperature CO Oxidation over Mesoporous CuO-TiO2 Nanotube Catalysts. Catalysts. 2017; 7(5):129. https://doi.org/10.3390/catal7050129
Chicago/Turabian StyleZedan, Abdallah F., Nageh K. Allam, and Siham Y. AlQaradawi. 2017. "A Study of Low-Temperature CO Oxidation over Mesoporous CuO-TiO2 Nanotube Catalysts" Catalysts 7, no. 5: 129. https://doi.org/10.3390/catal7050129
Note that from the first issue of 2016, this journal uses article numbers instead of page numbers. See further details here.