S- and N-Doped Graphene Nanomaterials for the Oxygen Reduction Reaction


Departamento de Química, Instituto Universitario de Materiales y Nanotecnología (IMN), Universidad de La Laguna (ULL), Apartado 456, 38200 La Laguna, Tenerife, Spain
*
Author to whom correspondence should be addressed.
Catalysts 2017, 7(9), 278; https://doi.org/10.3390/catal7090278
Submission received: 17 August 2017
/
Revised: 15 September 2017
/
Accepted: 16 September 2017
/
Published: 18 September 2017
(This article belongs to the Special Issue Graphene-Based Materials for Energy Conversion)
Abstract
:In the current work, heteroatom-doped graphene materials containing different atomic ratios of nitrogen and sulphur were employed as electrocatalysts for the oxygen reduction reaction (ORR) in acidic and alkaline media. To this end, the hydrothermal route and different chemical reducing agents were employed to synthesize the catalytic materials. The physicochemical characterization of the catalysts was performed by several techniques, such as X-ray diffraction, Raman spectroscopy and elemental analysis; meanwhile, the electrochemical performance of the materials toward the ORR was analyzed by linear sweep voltammetry (LSV), rotating disk electrode (RDE) and rotating ring-disk electrode (RRDE) techniques. The main results indicate that the ORR using heteroatom-doped graphene is a direct four-electron pathway, for which the catalytic activity is higher in alkaline than in acidic media. Indeed, a change of the reaction mechanism was observed with the insertion of N into the graphenic network, by the rate determining step changes from the first electrochemical step (formation of adsorbed OOH) on glassy carbon to the removal of adsorbed O (Oad) from the N-graphene surface. Moreover, the addition of sulphur atoms into the N-graphene structure increases the catalytic activity toward the ORR, as the desorption of Oad is accelerated.
1. Introduction
Fuel cells (FCs) are promising electrochemical energy converters for a diversity of applications. They have the potential to provide environmentally friendly energy conversion with a high efficiency and power density [1,2]. One of the main research areas for polymer electrolyte membrane (PEM) FCs involves the oxygen reduction reaction (ORR) in acidic and alkaline media at the cathode of these devices. The great importance of this issue is related to the sluggish ORR kinetic that is responsible for more than half of the overall cell voltage loss during the FC’s working operation [1,2]. Therefore, developing low-cost electrocatalysts with a high performance toward the ORR is of paramount importance to support the industrial operation of FCs [3,4]. In this context, graphene-based materials appear as a promising means to fulfil the previously mentioned requirements [1].
Graphene oxide (GO) is commonly used as a cheap precursor to obtain reduced graphene oxide (rGO), which is sometimes called “graphene” because of their common properties, but strictly, it is not. GO has low electric conductivity, because of the formation of oxygen groups during its synthesis from graphite, which restricts its electrocatalysis applications. The stability of these oxygen groups depends on their respective binding energy on the graphenic surface [5,6]. To solve this problem, a great diversity of physical and chemical methods for GO reduction are described in the literature [5]. Thermal treatment is a physical method often used to remove the oxygen groups from the graphene structure, simultaneously exfoliating the GO. On the other hand, chemical reduction is a low-cost and efficient reduction method with a high versatility of reducing agents that can be used [6,7]. The latter can be employed for heteroatom insertion into the graphene network during the formation of rGOs, and consequently, many doped-graphene structures using P, B, S and N have been reported [7,8,9]. The doping process causes an electronic modulation of the carbonaceous grid, improving the electrocatalytic performance toward several reactions of interest [8]. Regarding the ORR, it has been observed that the adsorption and bond cleavage of O2 are promoted by P, B and N dopants as a result of the charge polarization of the heteroatom–C bond; meanwhile, the orbital mismatch between S and C creates a spin density that may modulate the catalytic activity. Furthermore, doping graphene with two different atoms (e.g., N and S) produces a combined effect from different co-dopants on the ORR, and diverse parameters such as the onset potential, current density and electron transfer number were altered [2,10,11,12]. However, S and N doping is conditioned specifically by their anchoring capacity onto the graphene surface, as it is possible that a small excess of dopants may produce an important decrease in the surface area and distortion of the graphene structure [12,13].
In this present work, several heteroatom-doped graphene materials were synthesized using the hydrothermal reduction method and different reducing agents containing S and/or N. Thus, caffeine (N-GO) was used as source of N, and meanwhile, thiourea (SN2-rGO) and ammonium thiocyanate (SN-rGO) were employed as sources of N and S. Subsequently, their catalytic performances towards the ORR in acid and basic media were evaluated and compared to those of commercial graphite and carbon Vulcan XC-72R.
2. Results and Discussion
2.1. Physicochemical Characterization
Figure 1 depicts the X-ray diffractograms for all the materials studied. Graphite develops the typical sharp diffraction peak at 24.6° that corresponds to the (002) plane and a small diffraction peak at ca. 54° related to the (004) facet [14,15]. The successful oxidation of graphite in GO is revealed by the disappearance of the peaks at 24.6° and 54°, also of the appearance of a broader contribution at lower diffraction angles (10.7°), which is associated to the (101) diffraction plane [16]. The latter is caused by the growth of oxygen functional groups (OFGs) between the graphitic layers, which caused an expansion of the C–C interplanar spacing from 0.34 to 0.84 nm, and therefore, a weakening of the respective chemical bonds of graphite [8,13]. On the other hand, the X-ray patterns and interplanar spacing of doped-rGO materials (N-rGO, SN-rGO and SN2-rGO) and carbon Vulcan are quite similar (Table 1), which suggests two important issues derived from the effective reduction step: (i) OFGs in the interstitial graphitic spaces were successfully removed, and (ii) the C–C lattice of graphite was effectively restored [1,8,9,14]. Noticeably, N-rGO develops a small but visible diffraction peak close to 12° that is characteristic of GO, which suggests a partial reduction of GO when caffeine is used as a reducing agent. Additionally, doped-rGO and carbon Vulcan reveal a small but visible signal close to 45° that is associated to the (100) facet [17].
The Scherrer equation was used to determine the crystallite size for all the employed catalysts, and Table 1 summarizes the most representative crystallographic parameters attained [14,16]. Doped-rGO materials revealed a crystallite size lower than for graphite and GO, which was in agreement with the number of graphene layers (nl). In this sense, nl was estimated from the ratio of the crystallite size and the interplanar spacing, and as expected, graphite showed the highest nl and particle size [16]. As was described above, the oxidation process (i.e., GO formation) creates OFGs that increase the separation of graphene layers (d001 = 0.84 nm) and reduce the crystallite size and the nl; meanwhile, the reduction procedure produces a further diminution of both parameters. Thus, SN-rGO, SN2-rGO and carbon Vulcan materials revealed the smallest particle size and nl values, while N-rGO developed intermediate values between these and GO and graphite. In this context, the close correlation of the crystallographic parameters achieved for N-rGO with those attained from the X-ray patterns in which a second phase associated to GO was elucidated is remarkable (Figure 1).
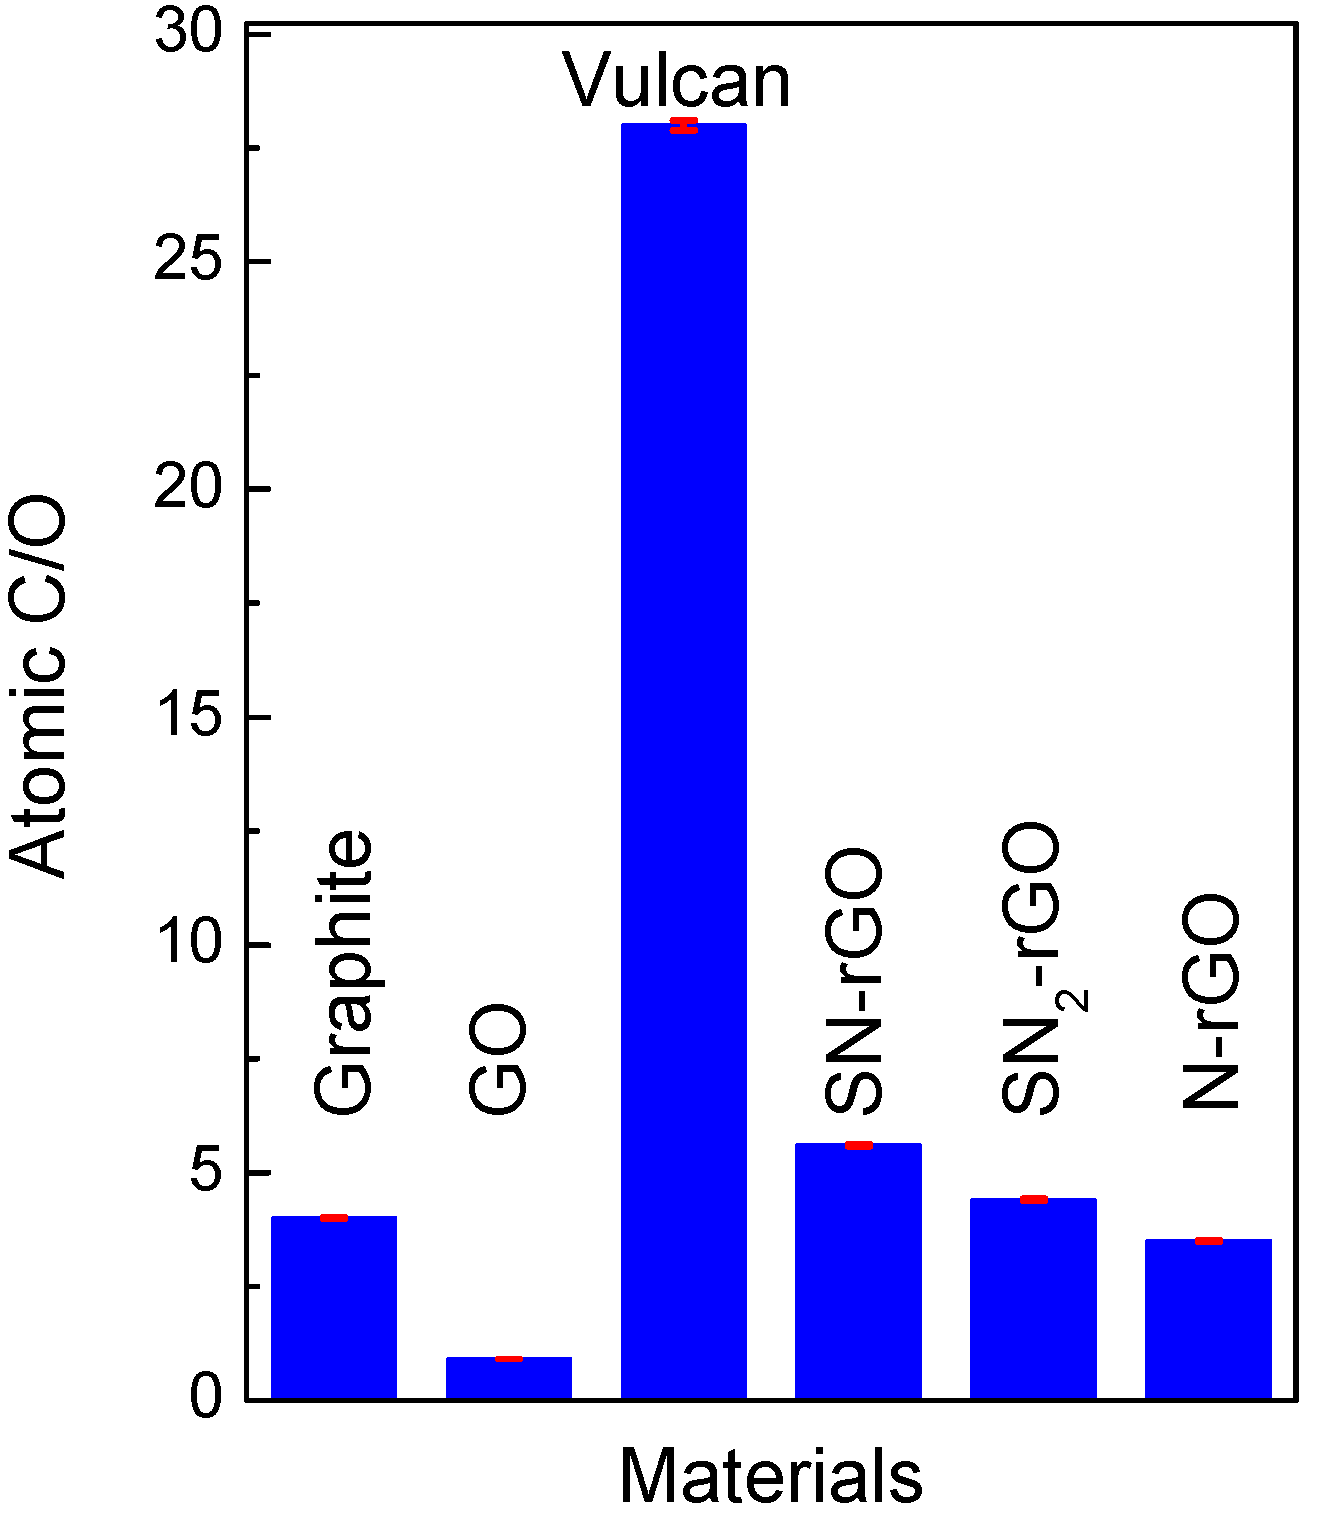
All features observed by X-ray diffraction (XRD) were in agreement with those results achieved by elemental analysis (Table 2). Indeed, an increment of oxygen loading (from 20% to 52%) was observed after the chemical oxidation process of graphite to produce GO. As expected, the amount of OFGs decreased in the following order: SN-rGO < SN2-rGO < N-rGO. This was in concordance with the strength of the reduction step. Moreover, the amount of OFGs in SN-rGO and SN2-rGO was lower than in graphite, indicating the high effectivity of reduction with both thiourea and ammonium thiocyanate. The latter was confirmed by the high insertion of S and N elements into rGO, which was especially elevated when ammonium thiocyanate was used. Additionally, the C/O composition ratio may be used as an estimation of the effectiveness of the methodology to reduce the amount of OFGs in graphene-based materials. Figure 2 shows the C/O composition ratio for all of the employed materials, which was completely in agreement with the results depicted in the Table 2.
Raman spectroscopy is a powerful tool for measuring the disorder degree and crystallinity of carbon-based materials. In this sense, it can be used as an indirect method to determine the defect density and the disorder degree produced by the doping process into the graphene network [16]. Figure 3 depicts the Raman spectra for all of the employed materials, in which four contributions are clearly discerned. The peaks at ca. 1360 cm−1 (D) and 1580 cm−1 (G) are correlated to sp3 carbon domains and to sp2 bonds into the graphitic grid, respectively [16]. Both signals have their corresponding overtones between 2500 and 3000 cm−1, respectively [16]. The intensity ratio of D and G peaks (Table 1) are often used as a measurement of the disorder degree, graphitization and crystallinity of the synthesized materials [13,14]. For instance, GO reveals broader D and G peaks as well as a more intense D peak (ID/IG = 0.87) than graphite (ID/IG = 0.15), which shows a prominent G peak in agreement with the high size of the in-plane sp2 domains [15]. On the other hand, all the other carbon-based materials develop the typical Raman spectra for heteroatom-doped rGO as a result of carbon hybridization by heteroatom–C bond formation and/or for some structural disorder (impurities, edges, finite size effects, etc.) that breaks the translational symmetry [18,19]. In agreement with the literature, Figure 3 indicates an increment of the disorder degree when N and S elements were used as doping agents [2,10,11,12]. The ID/IG values in Table 1 show an increment with the insertion of the heteroatoms, particularly when S was introduced into the material. The last was likely caused by the orbital mismatch between S and C atoms that produced higher numbers of sp3 carbon domains.
Graphitic materials can also be characterized through their structural parameters that depend on the crystallographic size in both directions of their planes, that is, basal (La) and edge planes (Lc) [20]. The Lc value is obtained by the Scherrer equation, while La is estimated from the ID/IG ratio through the empirical equation developed by Knight and White [21,22]. Figure 4 displays a straight correlation between ID/IG and the inverse of La for all the employed materials. A close inspection of this plot suggests that La not only decreases with oxidation (GO formation) but also with the strength and nature of the doping agent. For instance, caffeine was the weakest reducing agent, which introduced only 6 wt % N into the graphene network maintaining 21 wt % O, and produced doped-rGO with the largest basal-plane domains (La). On the other hand, the insertion of a high loading of S and N into the graphene structure with only 13.6 wt % O (SN-rGO) yielded doped-graphene material with the smallest La and the highest ID/IG.
All the described morphological and chemical changes induced by heteroatoms in the graphenic structure modify relevant physicochemical properties with profound impacts on the ORR, such as by affecting the electrical conductivity (higher in basal planes than in edge planes), electron transfer (higher in edge planes than in basal planes), different adsorption and bond cleavage of O2 (tuned by N insertion into the graphene network), diverse electronic density of states near the Fermi level (tuned by S insertion into the graphene network) and the overall catalytic performance (activity and stability) of graphene-based materials during the ORR [2,5,8,10,11,12,19,20,23].
2.2. Electrochemical Characterization
It is well-known that the ORR depends on several parameters, such as the catalyst composition (geometric and electronic factors), the applied potential, the nature of the ions dissolved in the electrolyte and the pH of the media [1,2]. In this regard, the slow kinetics of the ORR on carbon-based catalysts in acidic media, which strongly increases at higher pH values, is remarkable [8,19,24,25]. Figure 5 and the top panel of Figure 6 demonstrate that the catalytic activity of graphitic-based catalysts toward the ORR rises in alkaline media (curves for graphite (GC) are included for comparison). Nonetheless, some information on the ORR in acid media can be acquired. GC developed the worst catalytic activity toward the ORR, which may have been ascribed to the low density of edge planes (GC is the material with the longest La) and to the absence of doping and impurities. Remarkably, the ORR strongly increased for materials with short La (and high density of edge planes, Lc) and, to a minor extent, with the nature and loading of the heteroatom. Thus, N-rGO revealed the lowest onset potential at ca. 0.8 V for the ORR, but the developed kinetic current at small overpotentials was rather low. The latter was promoted by N-doping, which creates a charge polarization of the N–C bond, and therefore the adsorption (O2(ads)) and dissociation (O–O bond cleavage) of O2 were facilitated (see the reaction mechanism for the ORR later). Then, the insertion of S into the graphenic structure strongly increased the catalytic activity (kinetic and diffusion currents), which could be caused by the orbital mismatch between S and C that creates a local spin density. Therefore, it becomes clear that the catalytic performance of the ORR in acid media can be tuned by the properties of the catalytic material. However, much greater effort is required to achieve competitive graphitic-supported noble metal-free catalysts for the ORR in acidic media [26,27,28,29].
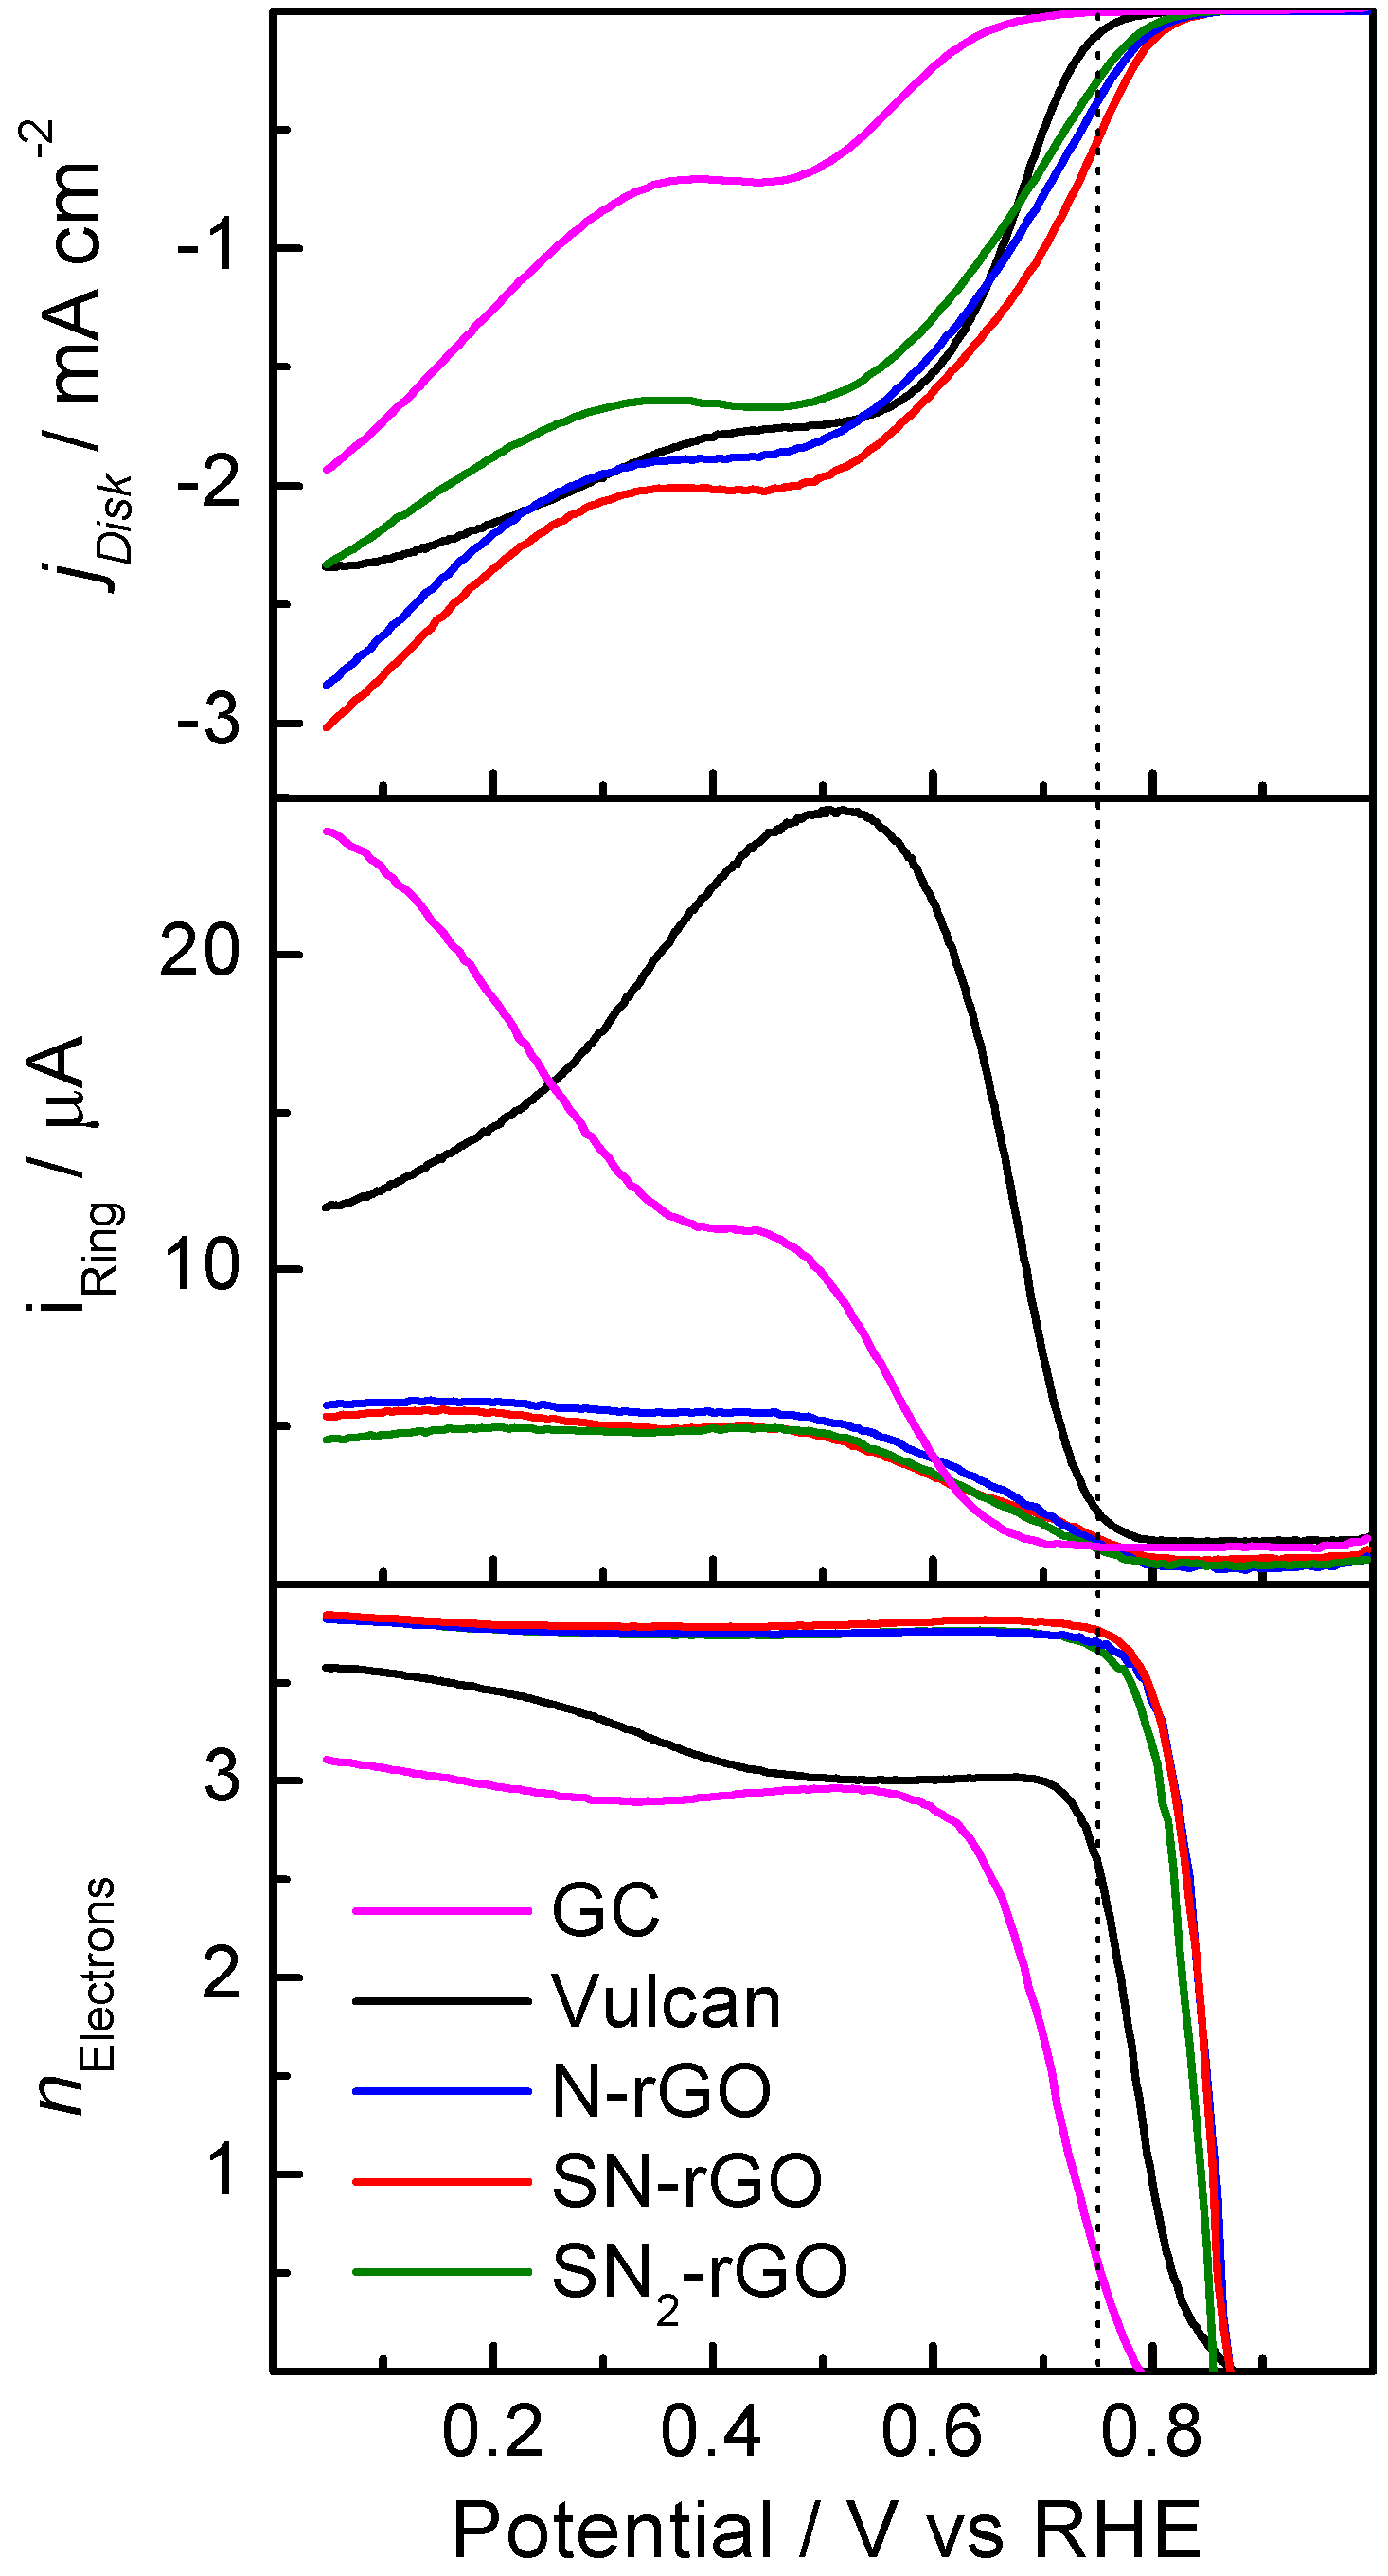
In order to study the catalytic performance and discern the ORR pathways for the different catalysts, the rotating ring-disk electrode (RRDE) technique was applied (Figure 6). The top panel shows the ORR polarization curves recorded at 0.002 V/s in 0.1 M NaOH. The great enhancement of this reaction in comparison with the current developed at lower pH values is shown (Figure 5).
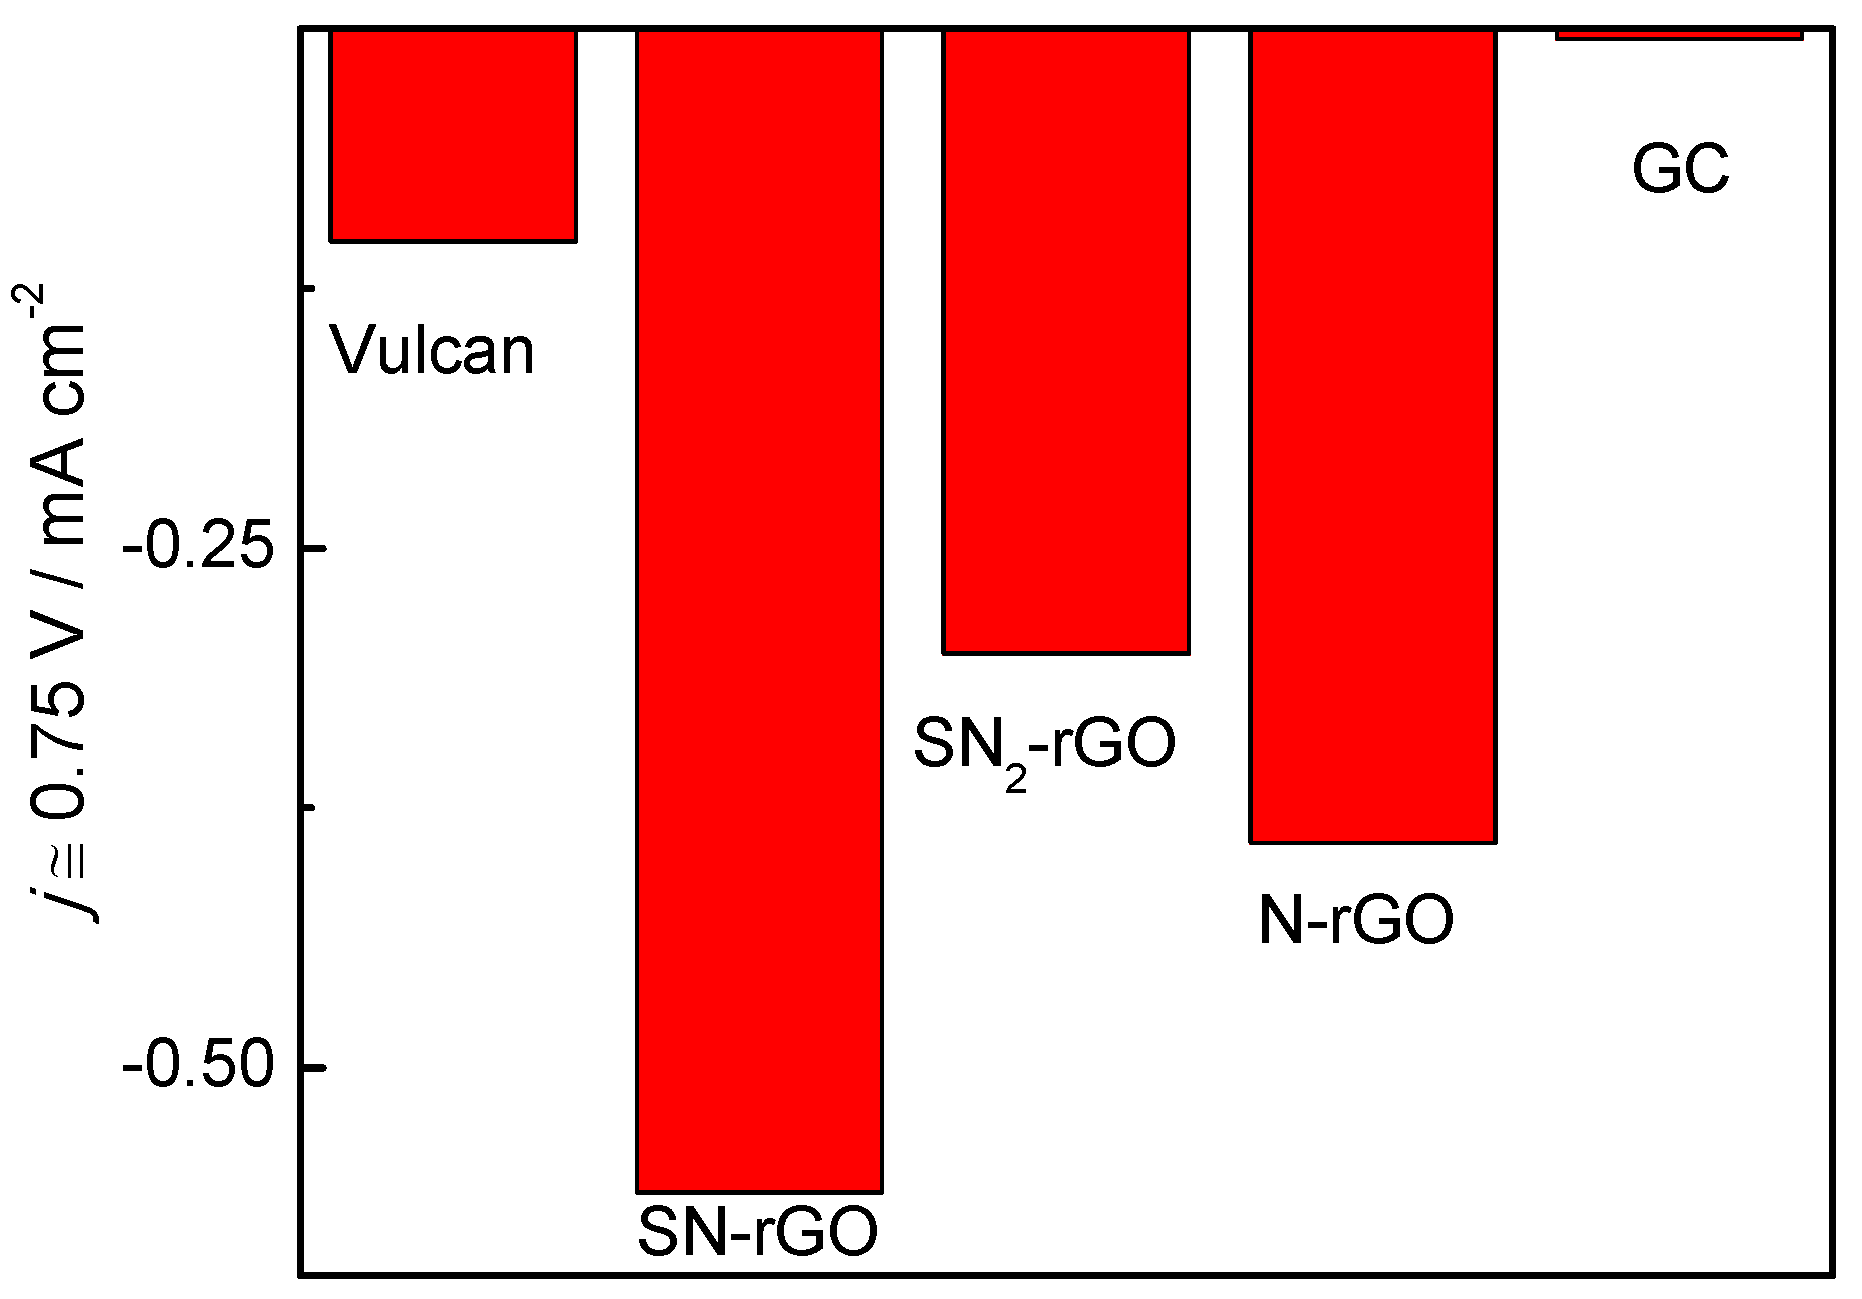
However, the same trend holds for the studied materials; that is, materials with a small La and high density of Lc developed a higher catalytic activity toward the ORR than GC. Interestingly, the insertion of N into the graphenic network decreased the onset potential toward the ORR, while S-doping increased the electron transfer. Thus, it can be established that the catalytic activity toward the ORR at a high pH increases for doped-graphene materials in the following order: SN2-rGO < N-rGO < SN-rGO. This is visible in Figure 7, in which the faradaic currents acquired at 0.75 V for all the catalysts are depicted. The lowest value obtained for SN2-rGO suggests that a compromise of the catalytic activity with the amount of S insertion into the graphenic structure should be achieved. It should be noted that the electroactive surface area (ESA), which was calculated through the ferrocyanide/ferricyanide redox couple, did not follow the same trend as the electrochemical performance toward the ORR. Indeed, the following ESA values were achieved for all the doped-graphene nanomaterials: SN-rGO = 0.39 cm2 < SN2-rGO = 0.40 cm2 < N-rGO = 0.88 cm2.
In order to evaluate the final product of the ORR and consequently, the mechanism of the reaction, the peroxide formation was followed by the ring electrode (middle panel of Figure 6), and the number of electrons transferred (n) was calculated (bottom panel of Figure 6) by the equation [30]:
where N is the current collection efficiency of the ring (0.22), and iD and iR are the ring and disk currents, respectively. A close inspection of the bottom panel of the figure indicates a full molecular oxygen (O2) conversion to water (four-electron pathway) on doped-graphene materials at lower potentials than 0.75 V. Indeed, GC and carbon Vulcan not only revealed a higher overpotential for the ORR, but also a minor energy conversion efficiency; that is, half of the reactant produced water (four electrons) and the other half generated peroxide (two-electron pathway). Remarkably, Sourav Bag et al. used urea, sodium sulfide and thiourea as reducing agents to produce doped-graphene with N and S elements [30]. However, they reported a higher peroxide yield in comparison to our results, which could be explained by a different route employed for GO production.
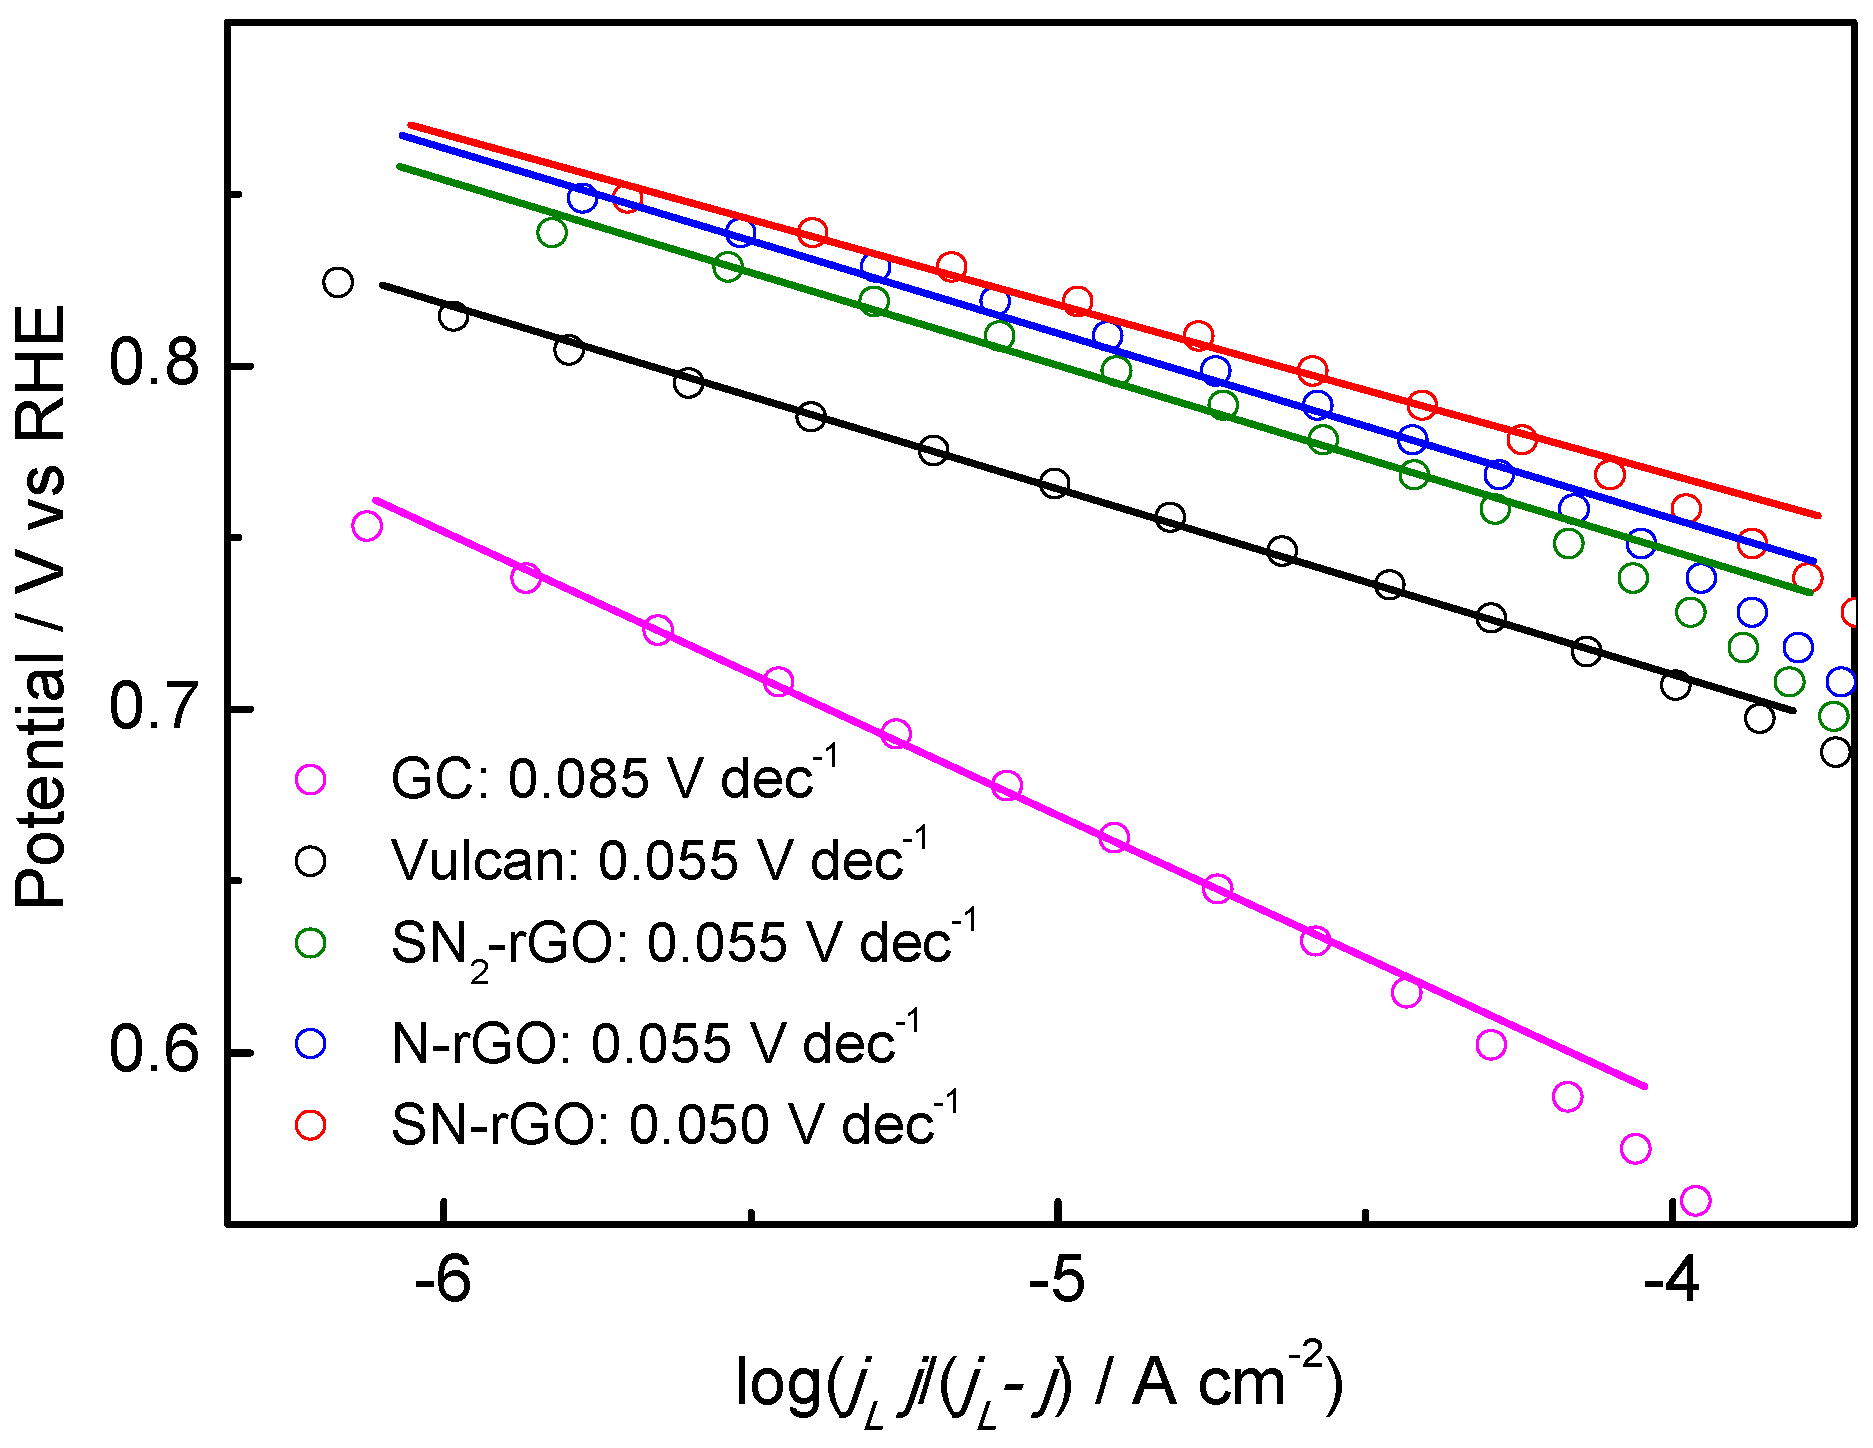
Further characterization of the catalytic activity of the electrocatalysts was made using mass-transport corrected Tafel plots at low overpotentials (Figure 8). The slope of a Tafel plot is commonly used to determine the rate determining step (RDS), and therefore, the reaction mechanism may be inferred from these values. In this regard, two different reaction mechanisms are commonly accepted for the ORR in alkaline media, as follows:
- (A)
- Associative mechanism:O2 → O2(ads)O2 + H2O + e− → OOH(ads) + OH−OOH(ads) + e− → O(ads) + OH−OOH(ads) + e− → OOH−O(ads) + H2O + e− → OH(ads) + OH−OH(ads) + e− → OH−
- (B)
- Dissociative mechanism:½O2 → O(ads)O(ads) + H2O + e− → OH(ads) + OH−OH(ads) + e− → OH−
Accordingly, a change of the Tafel slope is related exclusively to the change in the mechanism/kinetics of the ORR on the catalyst surface. Thus, it can be established that shortening the length of the basal planes (La) and increasing the density of edge planes (Lc) induces a change in the mechanism of the ORR, as the Tafel slopes change from 0.085 V dec−1 for GC to ca. 0.055 V dec−1 for doped-rGO and carbon Vulcan catalysts. In agreement with previous theoretical investigations on N-doped graphene, in which the associative mechanism (A) for the ORR was considered as the operative mechanism, the RDS changed from the first electrochemical step (Reaction (2)) on GC to the removal of adsorbed O (Reaction (6)) from the surface of doped-rGO and carbon Vulcan nanomaterials [31]. In this context, it is important to be reminded that carbon Vulcan produces a higher peroxide yield (Reaction (5)) in comparison to doped-graphene catalysts, in which a full molecular oxygen conversion to water was detected (Figure 6). On the other hand, as was explained above, N insertion into the graphene network facilitates the adsorption and bond cleavage of O2 (Reaction (4)) as a result of the charge polarization of the N–C bond minimizing the peroxide yield (Reaction (5)). Finally, a precise loading of S into the N-graphene catalyst seemed to facilitate the desorption of Oad, and consequently, the Tafel slope remained similar, but the kinetic of the ORR increased.
3. Materials and Methods
3.1. Materials
Sulphuric acid (H2SO4; Merck p.a, Madrid, Spain), sodium hydroxide (99.99%; Sigma-Aldrich, Madrid, Spain), potassium permanganate (>99.8%; Sigma-Aldrich, Madrid, Spain), ammonium thiocyanate (99.99%; Fluka, Madrid, Spain), thiourea (>99%; Fluka, Madrid, Spain), caffeine (>99%; Sigma-Aldrich, Madrid, Spain), Vulcan XC-72R (Cabot, Boston, MA, USA), graphite (>99.8%; Sigma-Aldrich, Madrid, Spain), hydrogen peroxide (30% v/v; Foret, Barcelona, Spain) and water (18.2 M Ω·cm−1; Milli-Q, Millipore, Madrid, Spain) were purchased and then used for the synthesis of the graphene materials and the preparation of the electrolyte solutions.
3.2. Synthesis of Graphene Oxide
GO was prepared by following a modified Hummers method [32]; 1 g of the graphite powder was added to 30 mL of concentrated H2SO4 cooled in an ice bath. Then, 3.5 g of KMnO4 was slowly introduced while being stirred and cooled continuously. After removal from the ice bath, the mixture was diluted with Milli-Q water and agitated for 1 h at 35 °C. Then, the solution was heated up to 95–98 °C over 30 min. Next, 200 mL of ultrapure water was gradually introduced, followed by 1.25 mL of 30% v/v H2O2, and the stirring was maintained for 30 min. Finally, the dispersion was centrifuged with Milli-Q water until a pH of 7 was achieved in the supernatant liquid. The material was dried using an oven at 60 °C.
3.3. Synthesis of Reduced Graphene Oxide Materials
An adequate amount (4 mmol) of reducing agent (thiourea, ammonium thiocyanate or caffeine) was ultrasonically dispersed in Milli-Q water and mixed with a GO aqueous dispersion (0.015 g mL−1) in each case. The final dispersion was placed into a Teflon-lined autoclave and heated at 160 °C for 10 h. Afterwards, the SN-rGO (from thiourea), SN2-rGO (from ammonium thiocyanate) and N-rGO (from caffeine) were washed by centrifugation using Milli-Q water and then transferred to an oven at 60 °C for 24 h to obtain a reduced/doped GO powder.
3.4. Physicochemical Characterization
Powder XRD spectra were acquired from a X’Pert PRO X-ray diffractometer (PANalytical, Madrid, Spain) to determine the crystal structure. Measurements were obtained using the CuKα radiation (λ = 1.5405 Å) and the X’pert high score plus diffraction software, and 2θ data were collected from 20° to 100° with a scanning rate of 0.04 s−1. Crystalline phases were identified by comparing the experimental diffraction patterns with the Joint Committee on Powder Diffraction Standards (JCPDS). An elemental analysis with an experimental error close to 0.04% was performed using an Elemental Analyzer CNHS FLASH EA 1112 (Thermo Scientific, Madrid, Spain). Raman spectra were collected using a RENISHAW confocal Raman microscope, model inVia (RENISHAW, Gloucestershire, UK), with a green laser (λ = 532 nm) in the 100 to 3200 cm−1 range. Both the XRD and elemental analysis were performed using the Research Support General Service (SEGAI) at the University of La Laguna (ULL); meanwhile, Raman spectroscopy measurements were made at the Laser Spectroscopy and High Pressure Group from the IMN-ULL.
3.5. Electrochemical Characterization
All of the electrochemical experiments were carried out at room temperature using a three-electrode glass cell, a carbon cylinder as a counter electrode and a hydrogen reference electrode in the electrolyte solution (reversible hydrogen electrode, RHE) as a reference. All the potentials in this work were given against the RHE. The working electrode consisted of a certain amount of the catalyst deposited as a thin layer over a glassy carbon disc (0.196 cm2). The ink was prepared by mixing 2 mg of the catalyst powder, 15 μL of Nafion solution (5 wt %; Aldrich, Madrid, Spain) and 500 µL of Milli-Q water. Electrochemical measurements were performed with a PC-controlled Autolab PGSTAT30 potentiostat-galvanostat (Metrohm Autolab, Madrid, Spain) in 0.5 M H2SO4 and 0.1 M NaOH electrolyte solutions. The ORR studies in acid media were performed in the 1 to −0.3 V range at 5 mV s−1. The studies in the basic medium were performed using a rotating ring-disk electrode (RRDE, PINE, Madrid, Spain) in the potential range from 1 to 0.05 V at 2 mV s−1. The ring (Pt) potential was kept at 1.2 V. For the ORR, the electrolyte was saturated with O2 (Air Liquide, 99.995%, Tenerife, Spain) over 20 min at a controlled disk potential of 1 V.
Before each measurement, Argon (N50) was bubbled through the solution to avoid dissolved oxygen, and several voltammetric cycles were performed in the potential range from 0.05 to 1.0 V at a scan rate of 10 mV s−1 for the catalytic activation.
4. Conclusions
Several S and N doped-graphene materials were successfully synthesized by the hydrothermal method using different reducing agents. The physicochemical characterization indicated the production of a high density of edge planes (given by a high Lc parameter) from graphite after GO synthesis, as well as heteroatom insertion into the graphene network and restoration of sp2 carbon domains after the chemical reduction step. Short basal-plane domains (given by a low La parameter) and a high density of edge planes strongly enhanced the ORR by changing the rate determining step from the first electrochemical step on glassy carbon to the removal of adsorbed O from the surface of graphenic nanomaterials (which displayed a low La and high Lc). Additionally, the caffeine (used as a source of N) reduction route was observed to be the softest, providing key catalytic information from the obtained N-doped material. Indeed, electrochemical experiments had a higher catalytic performance toward the ORR in alkaline than in acidic media, and N-incorporation into the graphenic network improved the reaction by enhancing the adsorption and bond cleavage of O2, favoring the direct four-electron pathway. Finally, it was perceived that the addition of S atoms into the N-doped graphene structure also increased the catalytic activity toward the ORR, as the desorption of Oads was facilitated.
Acknowledgments
This work has been supported by the Spanish Ministry of Economy and Competitiveness (MINECO) under project ENE2014-52158-C2-2R (co-funded by FEDER). G.G. acknowledges the Viera y Clavijo program (ACIISI & ULL) for financial support and L.M.R. thanks the ACIISI for the pre-doctoral grant. Authors would like to acknowledge the use of SEGAI—ULL facilities and Victor Lavin and Miguel Hernández for the Raman experiments.
Author Contributions
Elena Pastor and María del Carmen Arévalo conceived and designed the experiments; Luis Miguel Rivera and Sergio Fajardo performed the experiments; Elena Pastor, Luis Miguel Rivera and Gonzalo García analyzed the data; Elena Pastor contributed reagent, material and analysis tools; Gonzalo García, Luis Miguel Rivera and Elena Pastor wrote the paper.
Conflicts of Interest
The authors declare no conflict of interest.
References
- Gottesfeld, S. Electrocatalysis of Oxygen Reduction in Polymer Electrolyte Fuel Cells: A Brief History and a Critical Examination of Present Theory and Diagnostics. In Book Fuel Cell Catalysis a Surface Science Approach; Marc, T., Koper, M., Eds.; John Wiley & Sons, Inc.: Hoboken, NJ, USA, 2009; pp. 1–30. [Google Scholar]
- Wang, X.; Sun, G.; Routh, P.; Kim, D.-H.; Huang, W.; Chen, P. Heteroatom-doped graphene materials: Syntheses, properties and applications. Chem. Soc. Rev. 2014, 43, 7067–7098. [Google Scholar] [CrossRef] [PubMed]
- Le, T.X.H.; Esmilaire, R.; Drobek, M.; Bechelany, M.; Vallicari, C.; Nguyen, D.-L.; Julbe, A.; Tingrya, S.; Cretin, M. Design of a novel fuel cell-Fenton system: A smart approach to zero energy depollution. J. Mater. Chem. A 2016, 4, 17686–17693. [Google Scholar] [CrossRef]
- Le, T.X.H.; Esmilaire, R.; Drobek, M.; Bechelany, M.; Vallicari, C.; Cerneaux, S.; Julbe, A.; Cretin, M. Nitrogen-Doped Graphitized Carbon Electrodes for Biorefractory Pollutants Removal. J. Phys. Chem. C 2017, 121, 15188–15197. [Google Scholar] [CrossRef]
- Pei, S.-F.; Cheng, H.-M. The reduction of graphene oxide. Carbon 2012, 50, 3210–3228. [Google Scholar] [CrossRef]
- Dreyer, D.R.; Park, S.; Bielawski, C.W.; Ruoff, R.S. The chemistry of graphene oxide. Chem. Soc. Rev. 2010, 39, 228–240. [Google Scholar] [CrossRef] [PubMed]
- Wang, D.-W.; Su, D. Heterogeneous nanocarbon materials for oxygen reduction reaction. Energy Environ. Sci. 2014, 7, 576–591. [Google Scholar] [CrossRef]
- Park, M.; Lee, T.; Kim, B.S. Covalent functionalization based heteroatom doped graphene nanosheet as a metal-free electrocatalyst for oxygen reduction reaction. Nanoscale 2013, 5, 12255–12260. [Google Scholar] [CrossRef] [PubMed] [Green Version]
- Sheng, Z.H.; Gao, H.L.; Bao, W.J.; Wang, F.B.; Xia, X.H. Synthesis of boron doped graphene for oxygen reduction reaction in fuel cells. J. Mater. Chem. 2012, 22, 390–395. [Google Scholar] [CrossRef]
- Zhu, C.; Dong, S. Recent progress in graphene-based nanomaterials as advanced electrocatalysts towards oxygen reduction reaction. Nanoscale 2013, 5, 1753–1767. [Google Scholar] [CrossRef] [PubMed]
- Yang, Z.; Nie, H.; Chen, X.; Chen, X.; Huang, S. Recent progress in doped carbon nanomaterials as effective cathode catalysts for fuel cell oxygen reduction reaction. J. Power Sources 2013, 236, 238–249. [Google Scholar] [CrossRef]
- Su, Y.; Zhang, Y.; Zhuang, X.; Li, S.; Zhang, F.; Feng, X. Low-temperature synthesis of nitrogen/sulfur CO-doped three-dimensional graphene frameworks as efficient metal-free electrocatalyst for oxygen reduction reaction. Carbon 2013, 62, 296–301. [Google Scholar] [CrossRef]
- Kicinski, W.; Szala, M.; Bystrzejewski, M. Sulfur-doped porous carbons: Synthesis and applications. Sulfur-doped porous carbons: Synthesis and applications. Carbon 2014, 68, 1–32. [Google Scholar] [CrossRef]
- Saner, B.; Dinç, F.; Yürüm, Y. Utilization of multiple graphene nanosheets in fuel cells: 2. The effect of oxidation process on the characteristics of graphene nanosheets. Fuel 2011, 90, 2609–2616. [Google Scholar] [CrossRef]
- Chen, C.-H.; Chung, T.-Y.; Shen, C.-C.; Yu, M.-S.; Tsao, C.-S.; Shi, G.-N.; Huang, C.-C.; Ger, M.-D.; Lee, W.-L. Hydrogen storage performance in palladium-doped graphene/carbon composites. Int. J. Hydrogen Energy 2013, 38, 3681–3688. [Google Scholar] [CrossRef]
- Botas, C.; Álvarez, P.; Blanco, C.; Santamaría, R.; Granda, M.; Gutiérrez, M.D.; Rodríguez-Reinoso, F.; Menéndez, R. Critical temperatures in the synthesis of graphene-like materials by thermal exfoliation—Reduction of graphite oxide. Carbon 2013, 52, 476–485. [Google Scholar] [CrossRef] [Green Version]
- Jin, H.; Huang, H.; He, Y.; Feng, Y.-X.; Wang, S.; Dai, L.; Wang, J. Graphene Quantum Dots Supported by Graphene Nanoribbons with Ultrahigh Electrocatalytic Performance for Oxygen Reduction. J. Am. Chem. Soc. 2015, 137, 7588–7591. [Google Scholar] [CrossRef] [PubMed]
- Chen, W.; Yan, L.; Bangal, P.R. Chemical Reduction of Graphene Oxide to Graphene by Sulfur-Containing Compounds. J. Phys. Chem. C 2010, 114, 19885–19890. [Google Scholar] [CrossRef]
- Poh, H.-L.; Simek, P.; Sofer, Z.; Pumera, M. Sulfur-Doped Graphene via Thermal Exfoliation of Graphite Oxide in H2S, SO2, or CS2 Gas. ACS Nano 2013, 7, 5262–5272. [Google Scholar] [CrossRef] [PubMed]
- Brownson, D.A.C.; Kampouris, D.K.; Banks, C.E. Graphene electrochemistry: Fundamental concepts through to prominent applications. Chem. Soc. Rev. 2012, 41, 6944–6976. [Google Scholar] [CrossRef] [PubMed]
- Cançado, L.G.; Takai, K.; Enoki, T.; Endo, M.; Kim, Y.A.; Mizusaki, H.; Coelho, L.N.; Magalhães-Paniago, R.; Pimenta, M.A. General equation for the determination of the crystallite size La of nanographite by Raman spectroscopy. Appl. Phys. Lett. 2006, 88, 163106. [Google Scholar] [CrossRef]
- Zickler, G.A.; Smarsly, B.; Gierlinger, N.; Peterlik, H.; Paris, O. A reconsideration of the relationship between the crystallite size La of carbons determined by X-ray diffraction and Raman spectroscopy. Carbon 2006, 44, 3239–3246. [Google Scholar] [CrossRef]
- Koskinen, P.; Malola, S.; Häkkinen, H. Evidence for graphene edges beyond zigzag and armchair. Phys. Rev. B 2009, 80, 073401. [Google Scholar] [CrossRef]
- Shin, D.; Jeong, B.; Choun, M.; Ocon, J.D.; Lee, J. Diagnosis of the measurement inconsistencies of carbon-based electrocatalysts for the oxygen reduction reaction in alkaline media. RSC Adv. 2015, 5, 1571–1580. [Google Scholar] [CrossRef]
- Ambrosi, A.; Chua, C.K.C.; Latiff, N.M.; Loo, A.; Wong, C.H.; Eng, A.Y.S.; Bonanni, A.; Pumera, M. Graphene and its electrochemistry—An update. Chem. Soc. Rev. 2016, 45, 2458–2493. [Google Scholar] [CrossRef] [PubMed]
- Park, J.; Nabae, Y.; Hayakawa, T.; Kakimoto, M.-A. Highly Selective Two-Electron Oxygen Reduction Catalyzed by Mesoporous Nitrogen-Doped Carbon. ACS Catal. 2014, 4, 3749–3754. [Google Scholar] [CrossRef]
- Ikeda, T.; Hou, Z.; Chai, G.-L.; Terakura, K. Possible Oxygen Reduction Reactions for Graphene Edges from First Principles. J. Phys. Chem. C 2014, 118, 17616–17625. [Google Scholar] [CrossRef]
- Fellinger, T.-P.; Hasché, F.; Strasser, P.; Antonietti, M. Mesoporous Nitrogen-Doped Carbon for the Electrocatalytic Synthesis of Hydrogen Peroxide. J. Am. Chem. Soc. 2012, 134, 4072–4075. [Google Scholar] [CrossRef] [PubMed]
- Chai, G.; Hou, Z.; Ikeda, T.; Terakura, K. Two-Electron Oxygen Reduction on Carbon Materials Catalysts: Mechanisms and Active Sites. J. Phys. Chem. C 2017, 121, 14524–14533. [Google Scholar] [CrossRef]
- Bag, S.; Mondal, B.; Das, A.K.; Raj, C.R. Nitrogen and Sulfur Dual-Doped Reduced Graphene Oxide: Synergistic Effect of Dopants towards Oxygen Reduction Reaction. Electrochim. Acta 2015, 163, 16–23. [Google Scholar] [CrossRef]
- Yu, L.; Pan, X.; Cao, X.; Hu, P.; Bao, X. Oxygen reduction reaction mechanism on nitrogen-doped graphene: A density functional theory study. J. Catal. 2011, 282, 183–190. [Google Scholar] [CrossRef]
- Florez-Montano, J.; Calderon-Cardenas, A.; Lizcano-Valbuena, W.; Rodríguez, J.L.; Pastor, E. Ni@Pt nanodisks with low Pt content supported on reduced graphene oxide for methanol electrooxidation in alkaline media. Int. J. Hydrogen Energy 2016, 41, 19799–19809. [Google Scholar] [CrossRef]
Figure 1.
X-ray diffraction (XRD) patterns for all studied materials.
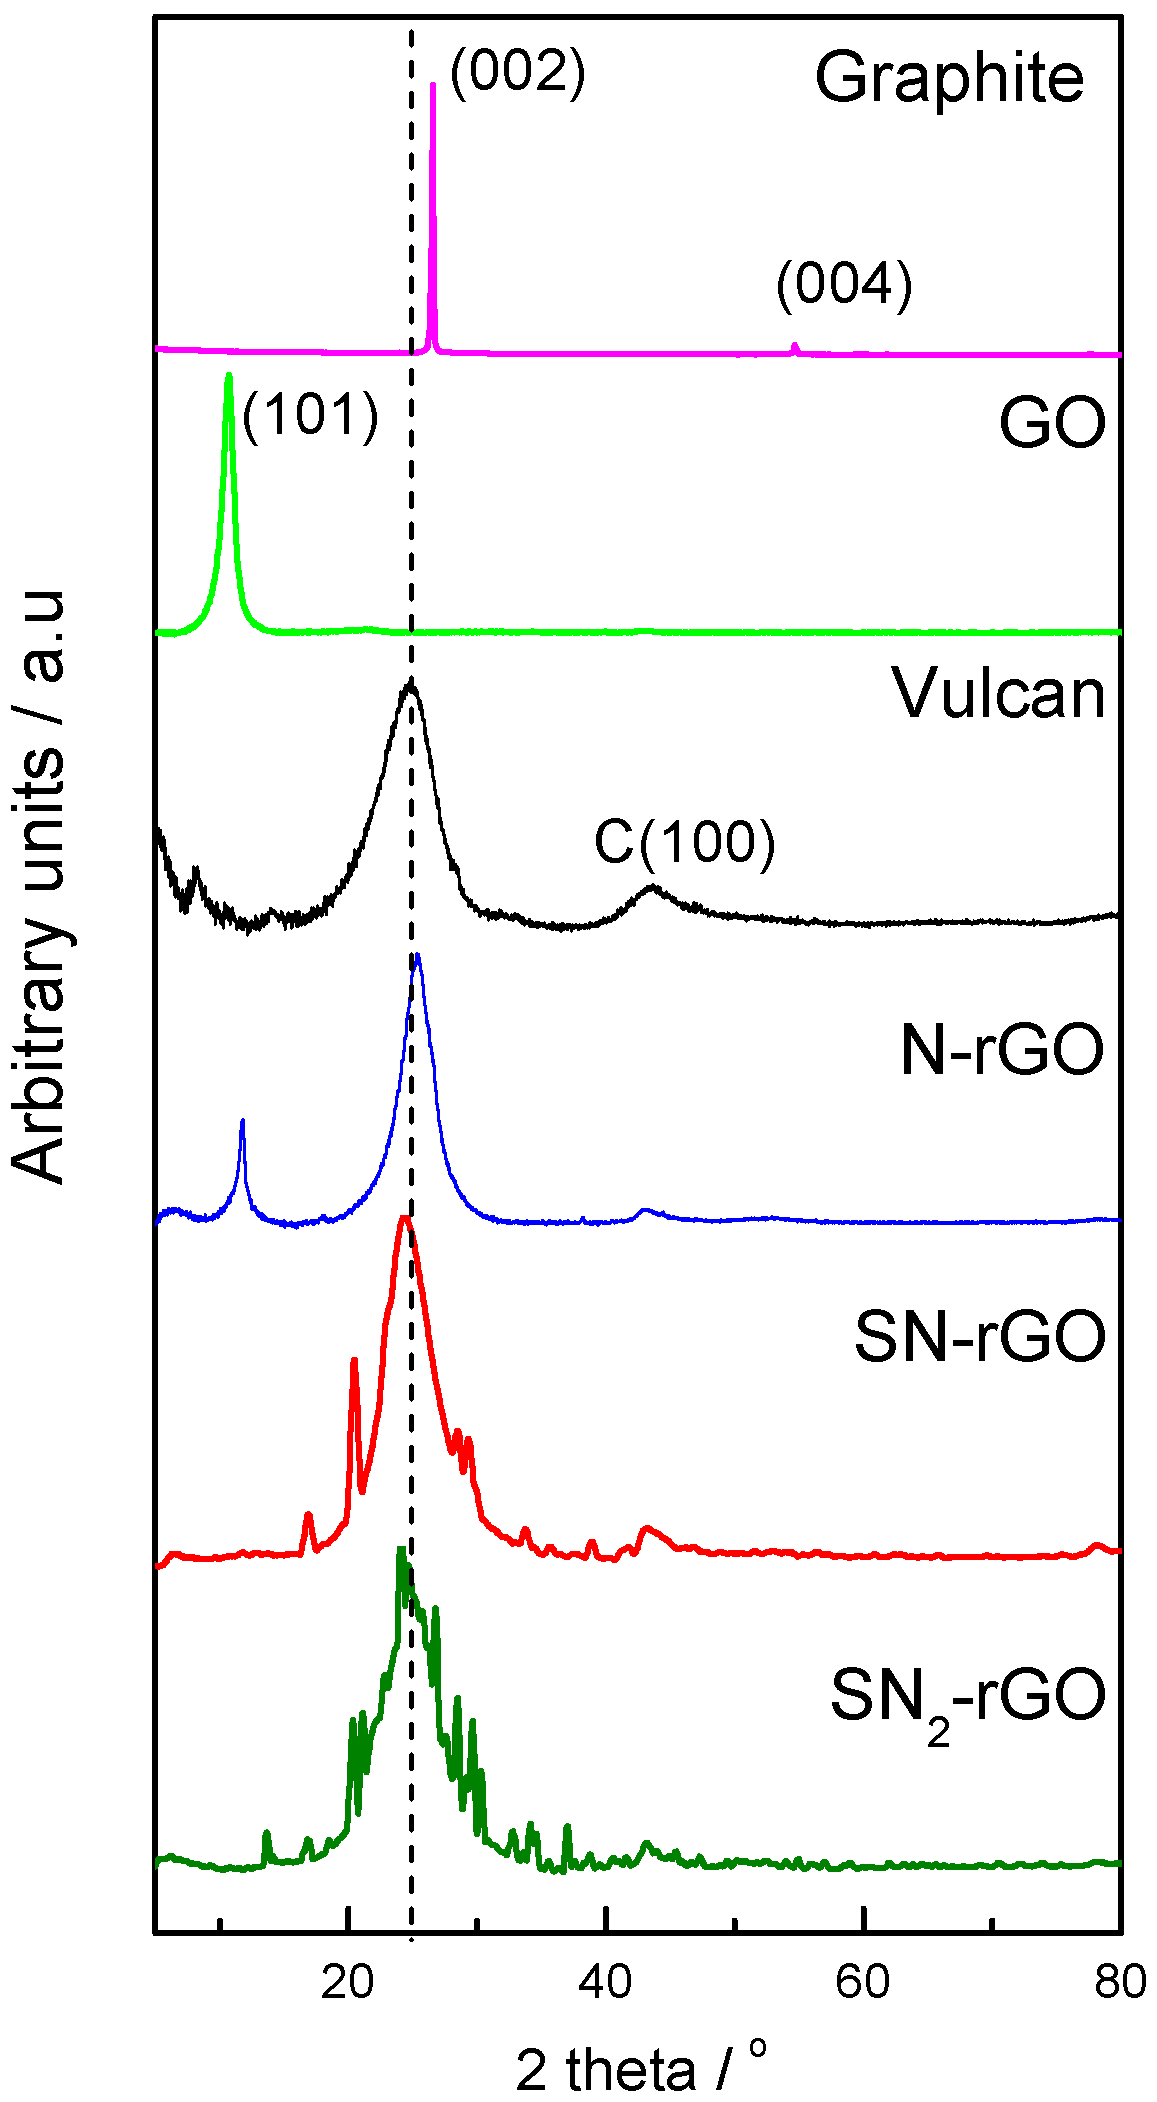
Figure 2.
C/O ratio for all studied materials (blue) and their respective error bar (red).

Figure 3.
Raman spectra for all studied materials.
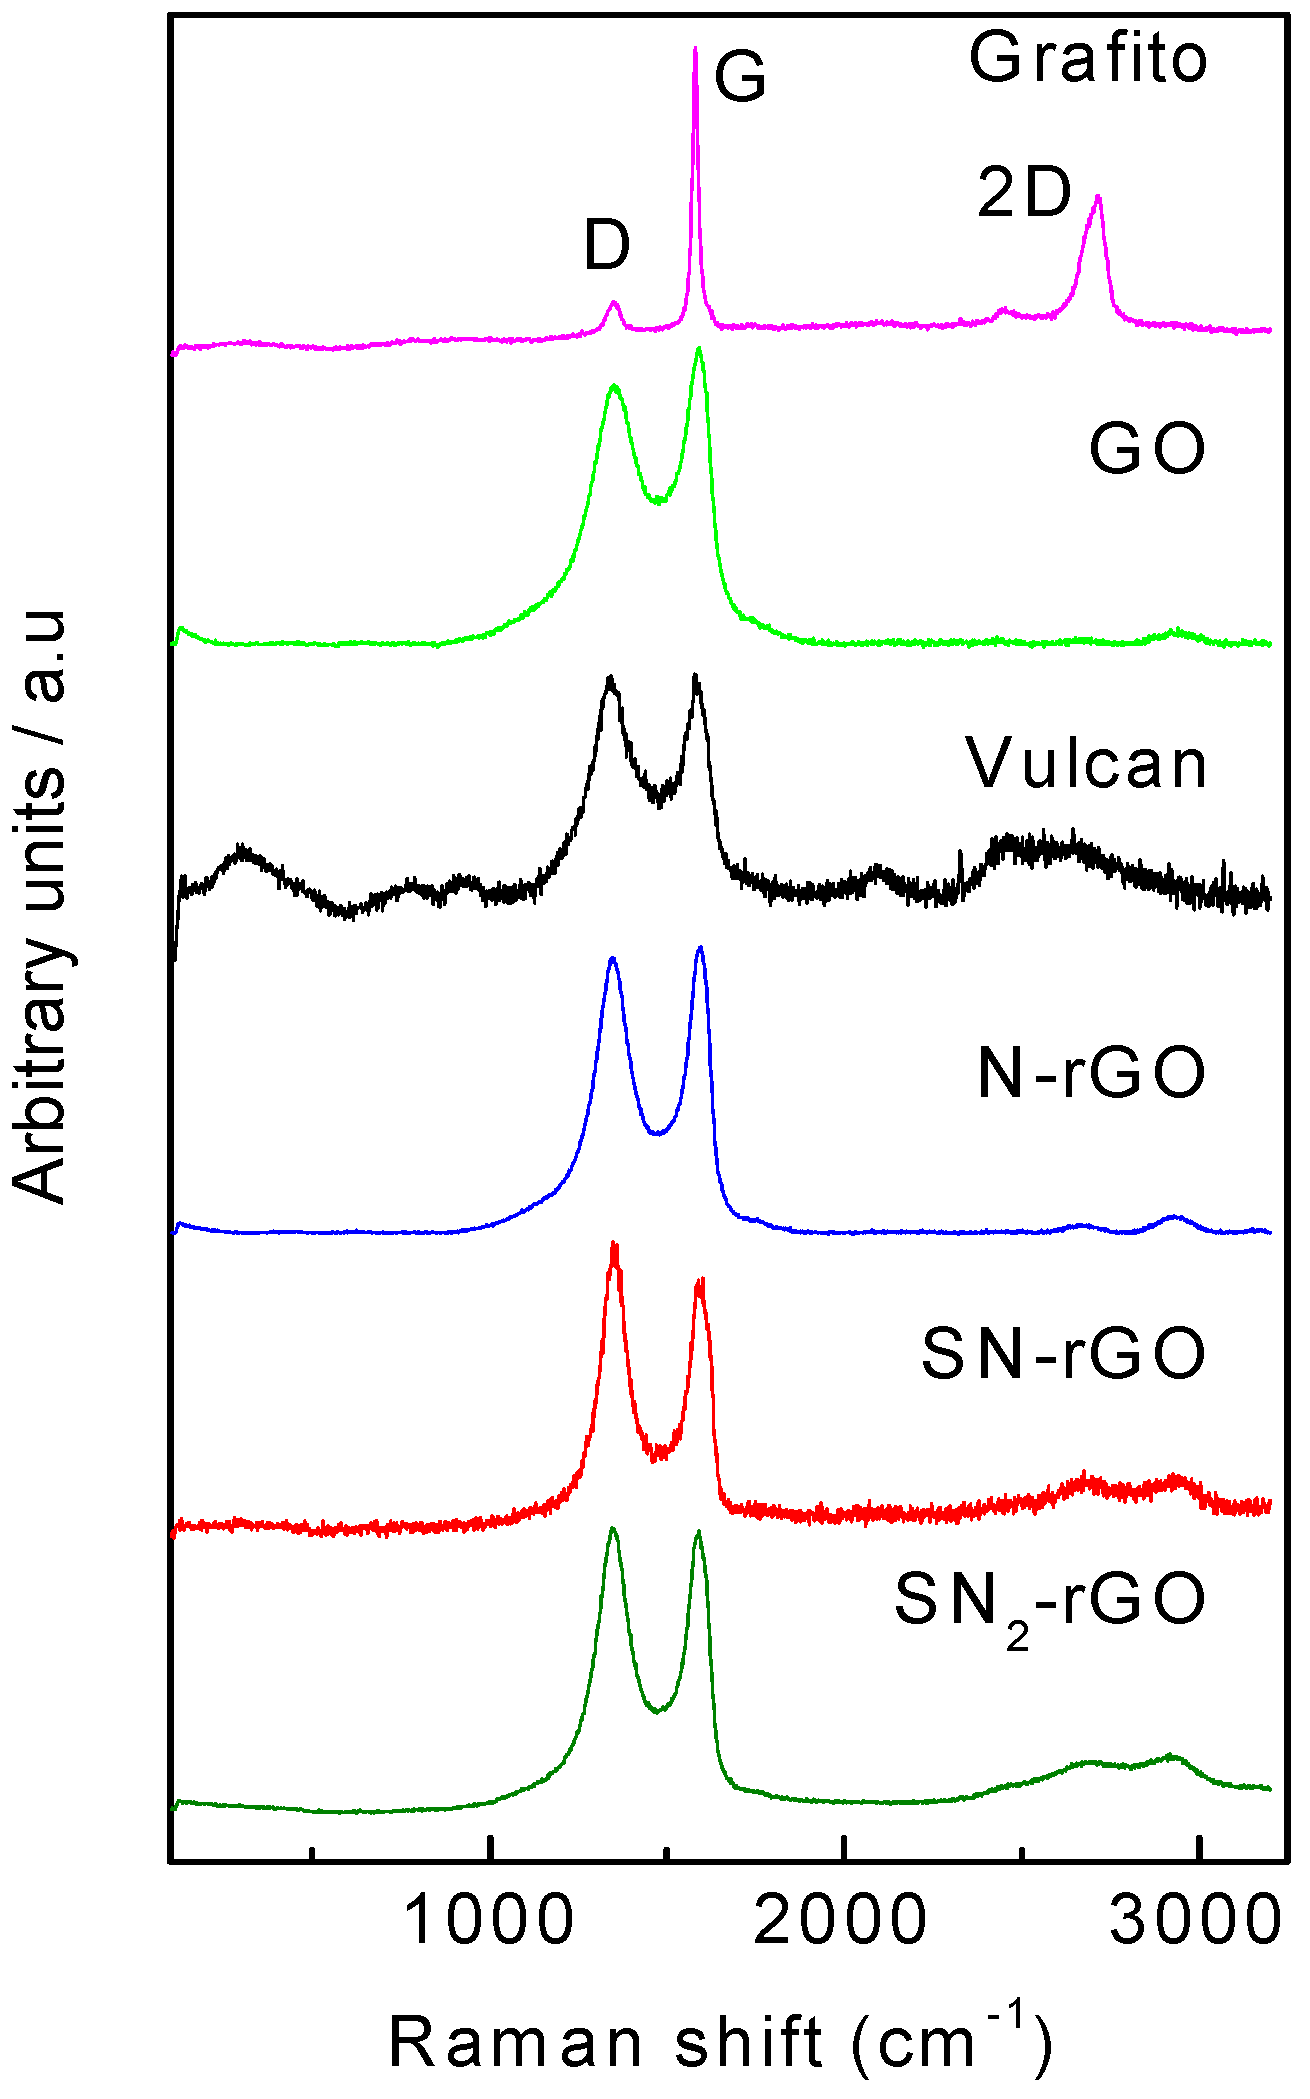
Figure 4.
Plot of ID/IG ratio vs. 1/La for all studied materials.
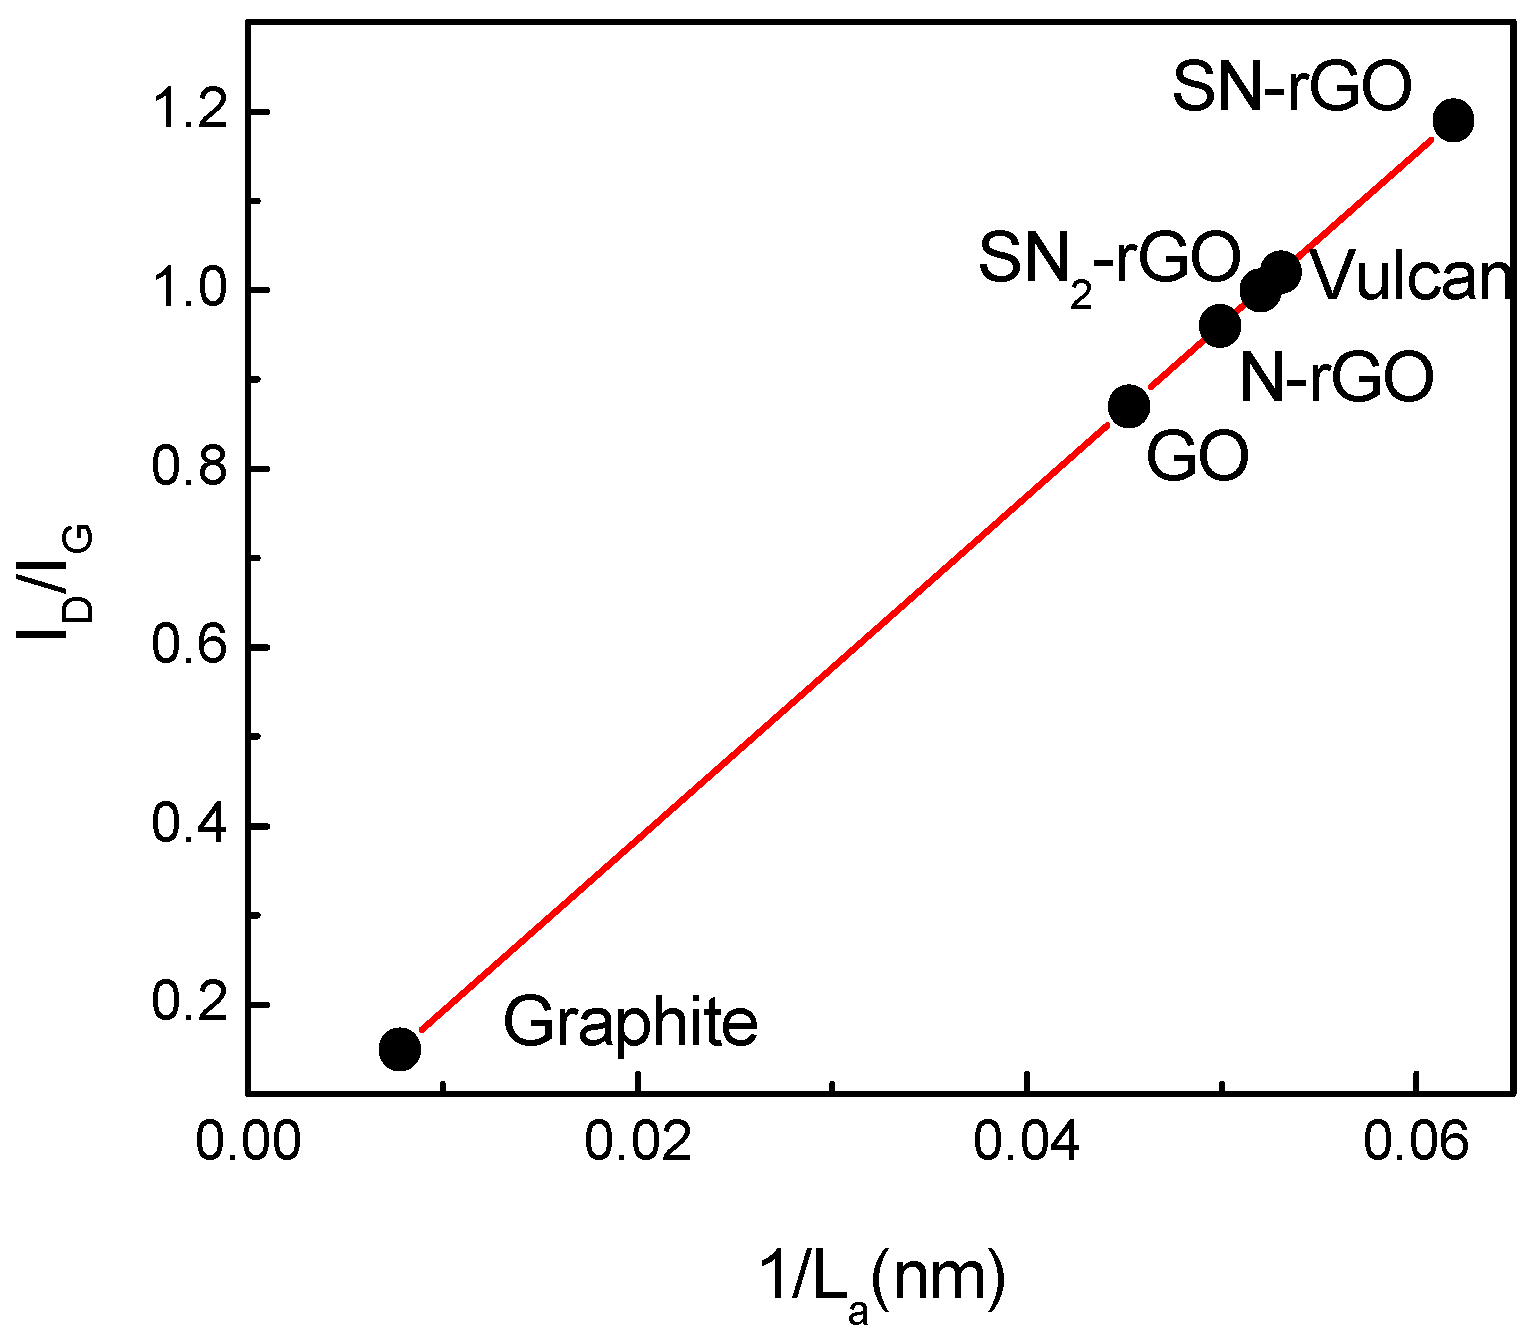
Figure 5.
Steady-state polarization curves for O2 reduction at 1600 rpm in 0.5 M H2SO4 at 25 °C for all studied electrocatalysts, with sweep rate of 0.002 V s−1.
Figure 5.
Steady-state polarization curves for O2 reduction at 1600 rpm in 0.5 M H2SO4 at 25 °C for all studied electrocatalysts, with sweep rate of 0.002 V s−1.
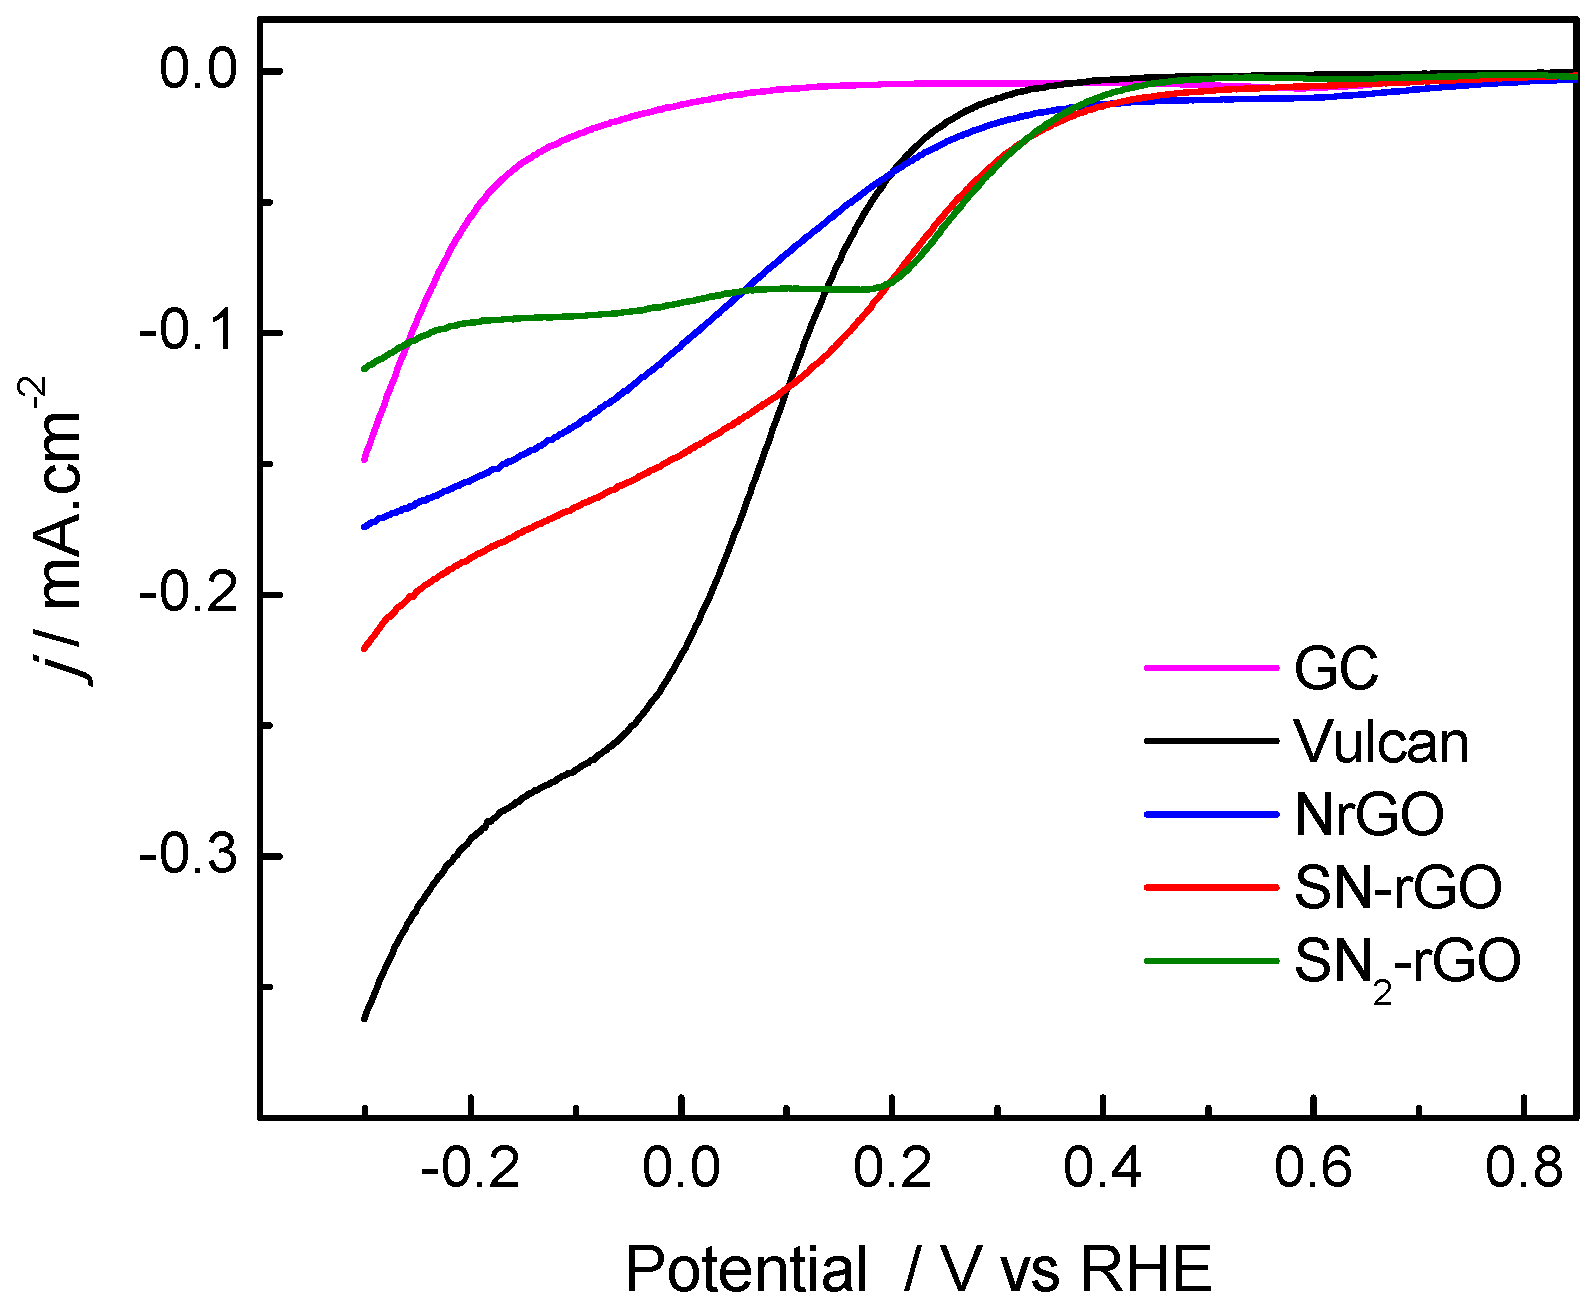
Figure 6.
Steady-state polarization curves for O2 reduction at 1600 rpm in 0.1 M NaOH at 25 °C for all employed electrocatalysts (top panel); faradaic currents developed at 1.2 V at the Pt ring electrode (middle panel); number of electrons transferred (n) during the oxygen reduction reaction (ORR; bottom panel). Sweep rate of 0.002 V s−1.

Figure 7.
Faradaic current acquired at 0.75 V during the oxygen reduction reaction (ORR) in 0.1 M NaOH solution for all studied materials.
Figure 7.
Faradaic current acquired at 0.75 V during the oxygen reduction reaction (ORR) in 0.1 M NaOH solution for all studied materials.

Figure 8.
Tafel plots for the oxygen reduction reaction (ORR) for all employed catalysts in 0.1 M NaOH.
Figure 8.
Tafel plots for the oxygen reduction reaction (ORR) for all employed catalysts in 0.1 M NaOH.

Table 1.
X-ray diffraction (XRD) and Raman parameters for all studied materials.
| Graphene Materials | Interplanar Spacing (d)/nm | ID/IG | Crystallite Size (nm) | Number of Layer (nl) |
|---|---|---|---|---|
| Graphite | 0.34 | 0.15 | 47.18 | 140 |
| Graphene oxide | 0.84 | 0.87 | 8.24 | 11 |
| Vulcan | 0.37 | 1.02 | 1.65 | 4, 5 |
| SN-rGO | 0.36 | 1.19 | 1.88 | 5, 6 |
| SN2-rGO | 0.36 | 1 | 1.76 | 5, 6 |
| N-rGO | 0.35 | 0.96 | 2.9 | 9 |
Table 2.
Elemental analysis for all studied materials.
| Material | Elemental Composition (wt %); Experimental Error ~0.04% | |||
|---|---|---|---|---|
| C | O | S | N | |
| Graphite | 80.0 | 20.0 | - | - |
| Graphene oxide | 48.0 | 52.0 | - | - |
| Vulcan | 96.5 | 3.5 | ~1 | ~1 |
| SN-rGO | 76.4 | 13.6 | 7.3 | 2.7 |
| SN2-rGO | 62.8 | 14.4 | 13.6 | 9.2 |
| N-rGO | 73.0 | 21.0 | - | 6 |
© 2017 by the authors. Licensee MDPI, Basel, Switzerland. This article is an open access article distributed under the terms and conditions of the Creative Commons Attribution (CC BY) license (http://creativecommons.org/licenses/by/4.0/).
Share and Cite
MDPI and ACS Style
Rivera, L.M.; Fajardo, S.; Arévalo, M.D.C.; García, G.; Pastor, E. S- and N-Doped Graphene Nanomaterials for the Oxygen Reduction Reaction. Catalysts 2017, 7, 278. https://doi.org/10.3390/catal7090278
AMA Style
Rivera LM, Fajardo S, Arévalo MDC, García G, Pastor E. S- and N-Doped Graphene Nanomaterials for the Oxygen Reduction Reaction. Catalysts. 2017; 7(9):278. https://doi.org/10.3390/catal7090278
Chicago/Turabian StyleRivera, Luis Miguel, Sergio Fajardo, María Del Carmen Arévalo, Gonzalo García, and Elena Pastor. 2017. "S- and N-Doped Graphene Nanomaterials for the Oxygen Reduction Reaction" Catalysts 7, no. 9: 278. https://doi.org/10.3390/catal7090278
Note that from the first issue of 2016, this journal uses article numbers instead of page numbers. See further details here.