
Human Eye Contrast Sensitivity to Vehicle Displays under Strong Ambient Light
by
 , ,
, ,
Yizhou Qian
1,
Zhiyong Yang
1,
En-Lin Hsiang
1,
Qian Yang
1,
Kevin Nilsen
1,
Yu-Hsin Huang
2,
Kuan-Heng Lin
2 and
Shin-Tson Wu
1,* 1
College of Optics and Photonics, University of Central Florida, Orlando, FL 32816, USA
2
AUO Corp. Hsinchu Science Park, Hsinchu 300, Taiwan
*
Author to whom correspondence should be addressed.
Crystals 2023, 13(9), 1384; https://doi.org/10.3390/cryst13091384
Submission received: 5 September 2023
/
Revised: 14 September 2023
/
Accepted: 16 September 2023
/
Published: 18 September 2023
(This article belongs to the Section Liquid Crystals)
Abstract
:Vehicle displays are becoming more integrated into our daily lives. Achieving a premium driving experience demands the display panel to have high-resolution density and sufficient brightness, particularly when exposed to intense ambient light, as direct sunlight can obscure the displayed images. Combining Barten’s model and diffraction theory, the performance of both infotainment displays and head-up displays (HUDs) is evaluated. For infotainment displays, over 800 nit brightness is essential for the driver to discern 55 pixel-per-degree (PPD) patterns under direct sunlight. For HUDs, a delicate balance between resolution density, brightness, transparency, and image quality must be exercised. By slightly reducing the resolution density to 50 PPD, the transparent micro-LED panel can concurrently achieve a reduced background image blur, low required display brightness (~4000 nits), and high background transmittance (~90%).
1. Introduction
Different from indoor displays, vehicle displays often encounter strong ambient light in the daytime [1]. Two types of displays are commonly integrated into a vehicle: infotainment displays and transparent head-up displays (HUDs). An infotainment display combines both information and entertainment features in a single screen [2]. It is commonly integrated with a dashboard to function as a digital instrument cluster, such as a speedometer, and to display global positioning system (GPS) images. Among different vehicle displays, liquid crystal displays (LCDs) and organic light-emitting diode (OLED) displays are two currently dominating technologies. LCD has merits in high-temperature tolerance, long lifetime, and low-cost [3], while tandem OLED [4,5] is a strong contender due to its wide color gamut, good flexibility, and high contrast ratio to avoid the postcard effect at night [6]. At Display Week 2023, leading vehicle display companies such as BOE demonstrated a 21.6” curved mini-LED (mLED) backlit LCD prototype with 786 dimming zones and Tianma showcased a 9.94” OLED trifold screen. However, for traditional LCDs, the image content may be washed out by strong ambient light due to the relatively low CR (<5000:1) and limited peak brightness, while OLED materials are still facing thermal instability [7]. An mLED backlit LCD can achieve a comparable CR to OLED [8], while further reducing the halo effect [2,9,10] and increasing the optical efficiency from LCD is still challenging.
Micro-LED (μLED) and mLED (without LCD) are emerging as next-generation infotainment displays due to their ultra-high peak brightness, excellent dark state, long lifetime, good flexibility, wide color gamut, and ultrafast response time [11,12,13,14]. Especially for μLEDs, the small aperture ratio (usually ~1%; the remaining 99% of the area is filled with black matrices) can further reduce the ambient light reflectance from the bottom metal electrode. As a result, μLED will be a strong contender for automotive displays once its manufacturing processes become more mature.
On the other hand, a HUD allows users to view digital information without changing their natural line of sight [15]. It is playing an increasingly important role in automotive displays because the drivers can receive information directly from the windshield. To deliver a clear display image with plain environmental conditions, HUD should exhibit high transparency (>70%), ultra-high brightness, high-resolution density (~60 pixels per degree (PPD)), and low diffraction [16]. There are two main types of HUDs: projection [17] and flat panel [18]. The former has several demerits in terms of high optical loss, small eyebox, and strong color dispersion. For the flat-panel type, the light sources are directly embedded under the windshield. Recently, the direct view µLED has been gaining momentum owing to its high brightness, small mesa size, very wide temperature range, and exceedingly long lifetime [19,20]. At Display Week 2023, PlayNitride demonstrated a 9.38” 114 PPI μLED panel with 65% transparency. AUO also introduced a 5000 nit 13.5” μLED prototype with 163 PPI and 55% transparency.
However, very few studies investigate the human recognizability of vehicle display panels under strong ambient light. In this paper, we systematically analyze LCD and μLED under strong ambient light. Firstly, we analyze the performance of different infotainment displays under different ambient lighting conditions based on Barten’s model. Then, we validate the calculated data with visual tests. Afterward, a transparent display model is built based on diffraction theory and photopic function to balance the transmittance of environmental light and required display brightness. Finally, multi-scale structure similarity is analyzed by considering high-order diffraction to determine the image quality and optimize the aperture ratio.
2. Infotainment Display under Different Ambient Light
2.1. Contrast Sensitivity and Barten’s Model
Contrast sensitivity (CS) is a measure of the human eye’s ability to distinguish sinusoidal patterns at each spatial frequency, and the contrast sensitivity function (CSF) is defined as the reciprocal of the minimum contrast of a sinusoidal grating that can be detected by the human eye at a specific spatial frequency [21,22], as illustrated in Figure 1.
The CSF is correlated with several factors, such as field of view (FoV), resolution density of the display panel, spatial frequency, brightness, and ambient light intensity [23,24,25]. In 1999, Barten developed a simplified physical model for the CSF of the human eye using massive visual tests [26]. Based on empirically fitting the psychophysical data, Barten’s model has the following form:
where
In Equation (1), f is the spatial frequency of the stimulus, w is the FoV of the stimulus in degrees, and L is the average luminance of the stimulus in cd/m2. The reciprocal of the contrast (RoC) under a specific ambient light can be expressed as:
where Ia (unit: lux) is the ambient light illuminance and R is the surface reflectance. The human eye recognition threshold can be calculated using the intersection of Equations (1) and (2).
2.2. LCD and μLED Infotainment Displays under Different Ambient Conditions
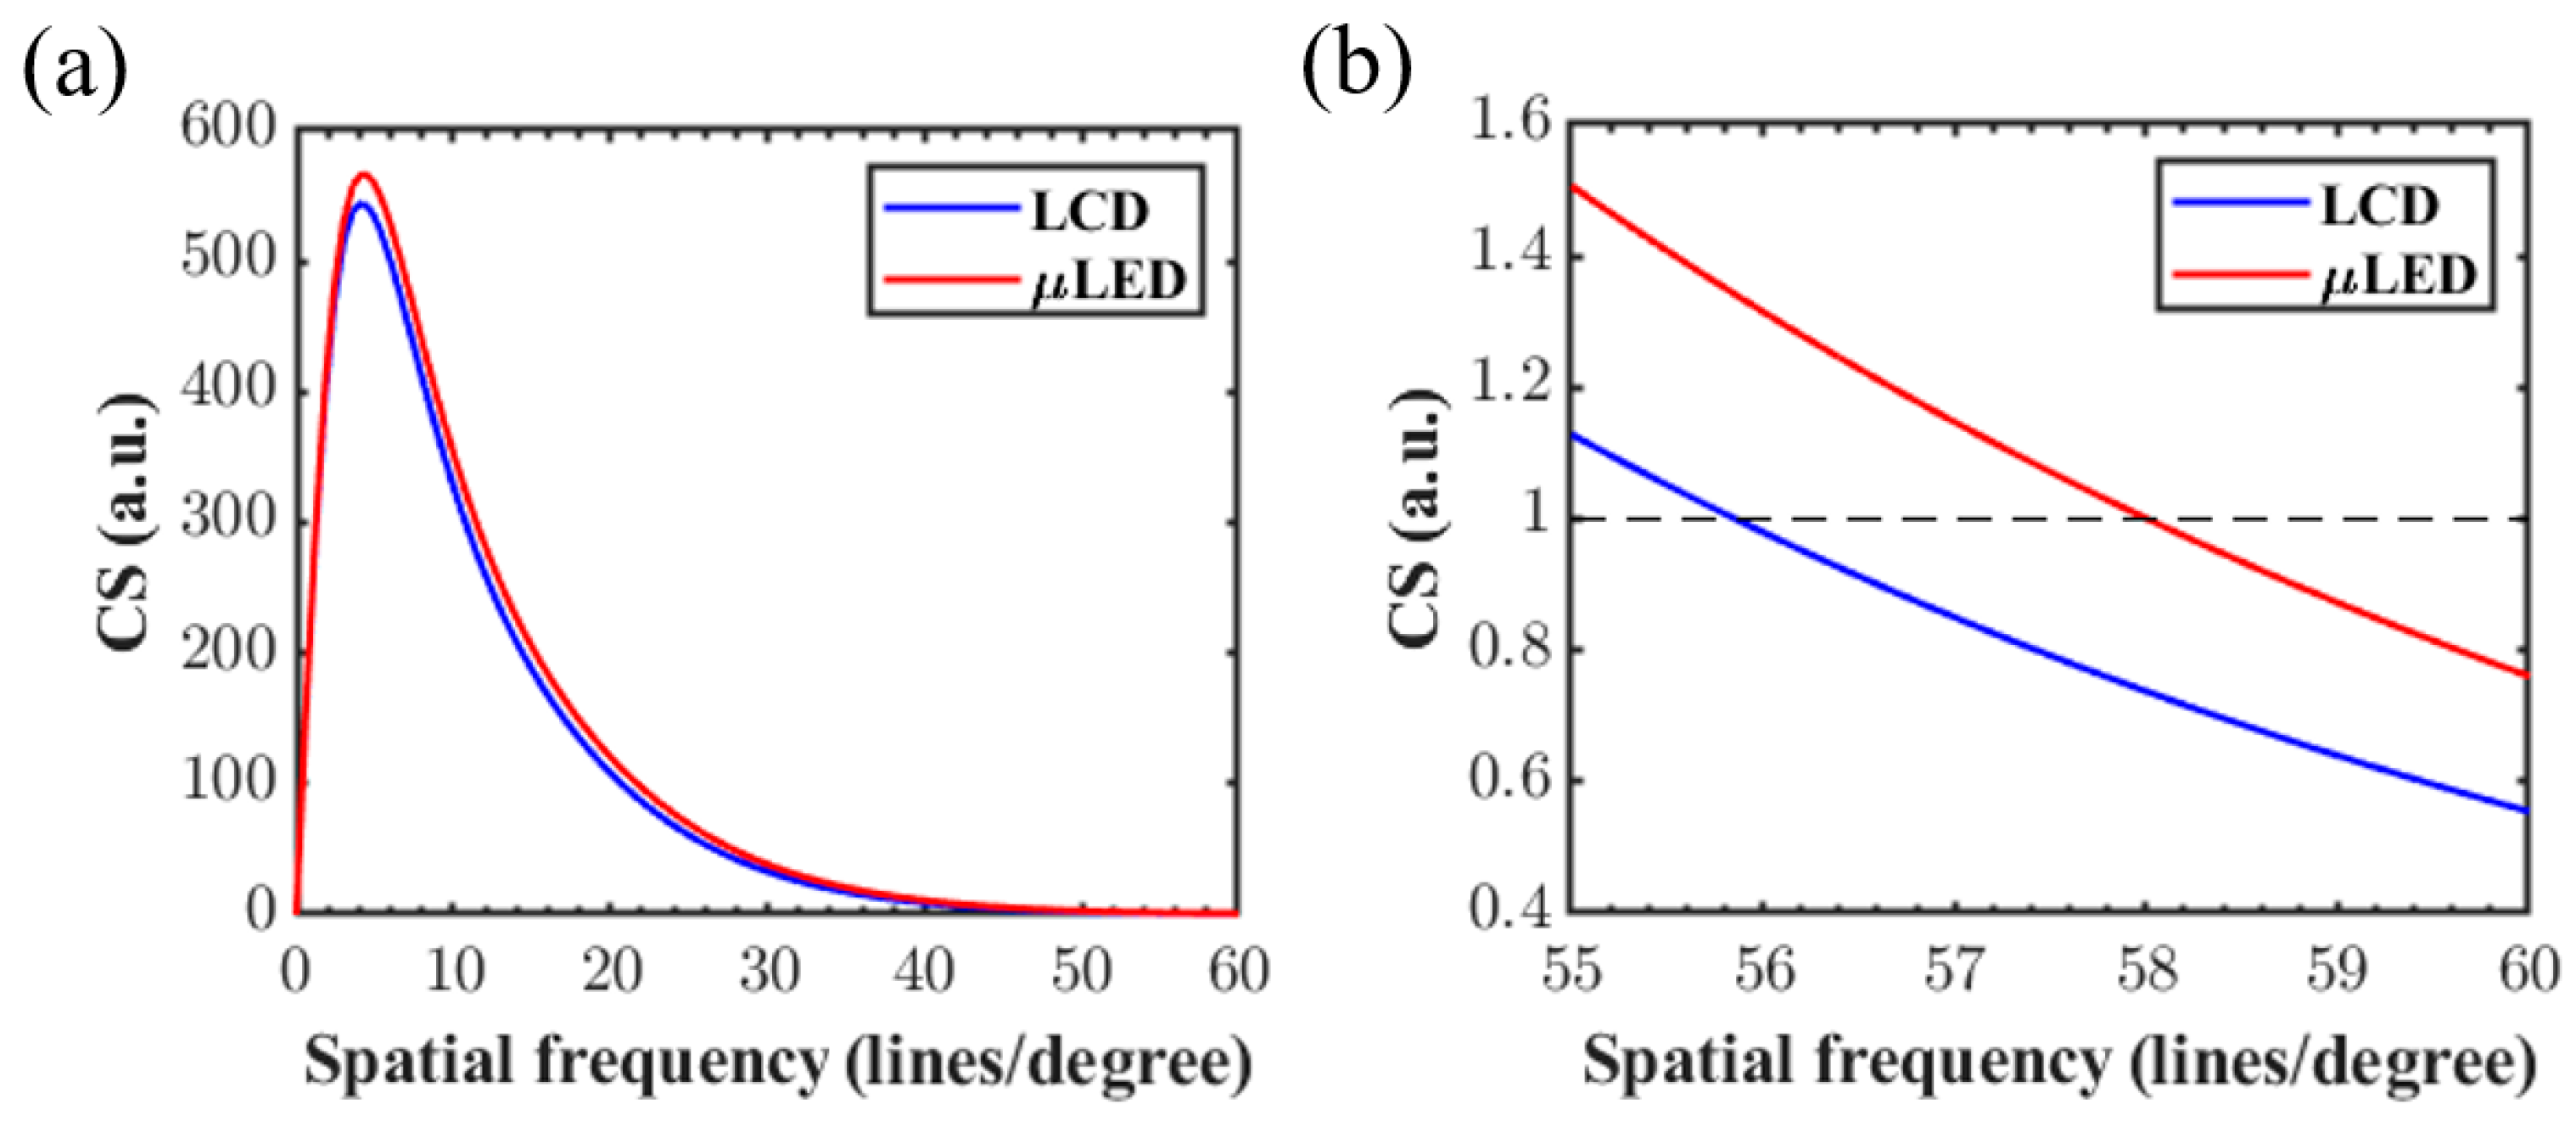
For simplicity, we consider two display panels with the same resolution density: (1) a 400 nit LCD panel with a 0.5 nit light leakage at a dark state and (2) a 1000 nit μLED with a perfect dark state. In a perfect dark room, the calculated RoC is 1.002 for the LCD panel and 1 for the μLED; these two values are very close to each other. The calculated CSF results are plotted in Figure 2a. The small contrast sensitivity difference between LCD and μLED is due to their average luminance difference. To visualize the difference in and readability of the patterns on these two screens, we focus on the spatial frequency ranging from 55 to 60 lines/deg. The dashed line in Figure 2b indicates the contrast sensitivity threshold of the human eye, and the patterns will not be readable if the curve is below this line. In this case, LCD and μLED share the same threshold since the contrast sensitivity threshold difference is very small. From Figure 2b, the pattern readability threshold is 56 lines/deg for LCD and 58 lines/deg for μLED. Both threshold values are close to human visual acuity (60 PPD).
The ambient light in a vehicle could vary from starlight to sunlight. The SAE 1757 standard [27] gives a good representative illumination and measurement during daytime in two typical cases: (1) Diffuse daylight with an illuminance of 5 k lux and (2) direct sunlight with 45 k lux. If we assume the surface reflectivity of the anti-reflection (AR) coating is 1.5% for both LCD and μLED panels, then the ambient light luminance will be 23.87 nits for diffuse daylight and 214.86 nits for direct sunlight. The ambient contrast ratio (ACR) of LCD and μLED will be 17.39:1 and 42.89:1 under diffuse daylight, respectively. On the other hand, the ACR of LCD and μLED will be reduced to 2.86:1 and 5.65:1 under direct sunlight. According to the ISO15008 criteria that ACR should be ≥2:1 under direct sunlight, both displays can fulfill this requirement.
Based on Equation (2), the calculated RoC results are: RoCdiffuse-LCD = 1.12, RoCdiffuse-μLED = 1.05, RoCdirect-LCD = 2.08, and RoCdirect-μLED = 1.43. Under the diffuse sunlight shown in Figure 3a, the recognition threshold is 55.4 and 57.8 lines/deg for LCD and μLED, respectively. Figure 3b indicates that the threshold is reduced to 52.1 lines/deg for LCD and 56.0 lines/deg for μLED. Several conclusions can be drawn, as illustrated in Figure 2 and Figure 3 and Equation (2): (1) Increasing the ambient light brightness continuously reduces the CS recognition threshold, especially for LCD due to its lower peak brightness, making the patterns more difficult to recognize. (2) Both CSFs slightly shift with increasing panel luminance. (3) The difference in the CS recognition threshold is mainly dominated by the high peak brightness of μLED instead of the light leakage of the LCD. Therefore, based on the above conclusions, we calculated the PPD as a function of display brightness under different ambient lighting conditions, as shown in Figure 3c. As the ambient light brightness increases, the patterns are more difficult to distinguish. As the reflected ambient light increases to 250 nits, the display panel with over 800 nits is required for the driver to distinguish the 55 PPD patterns.
2.3. Contrast Sensitivity Visual Test
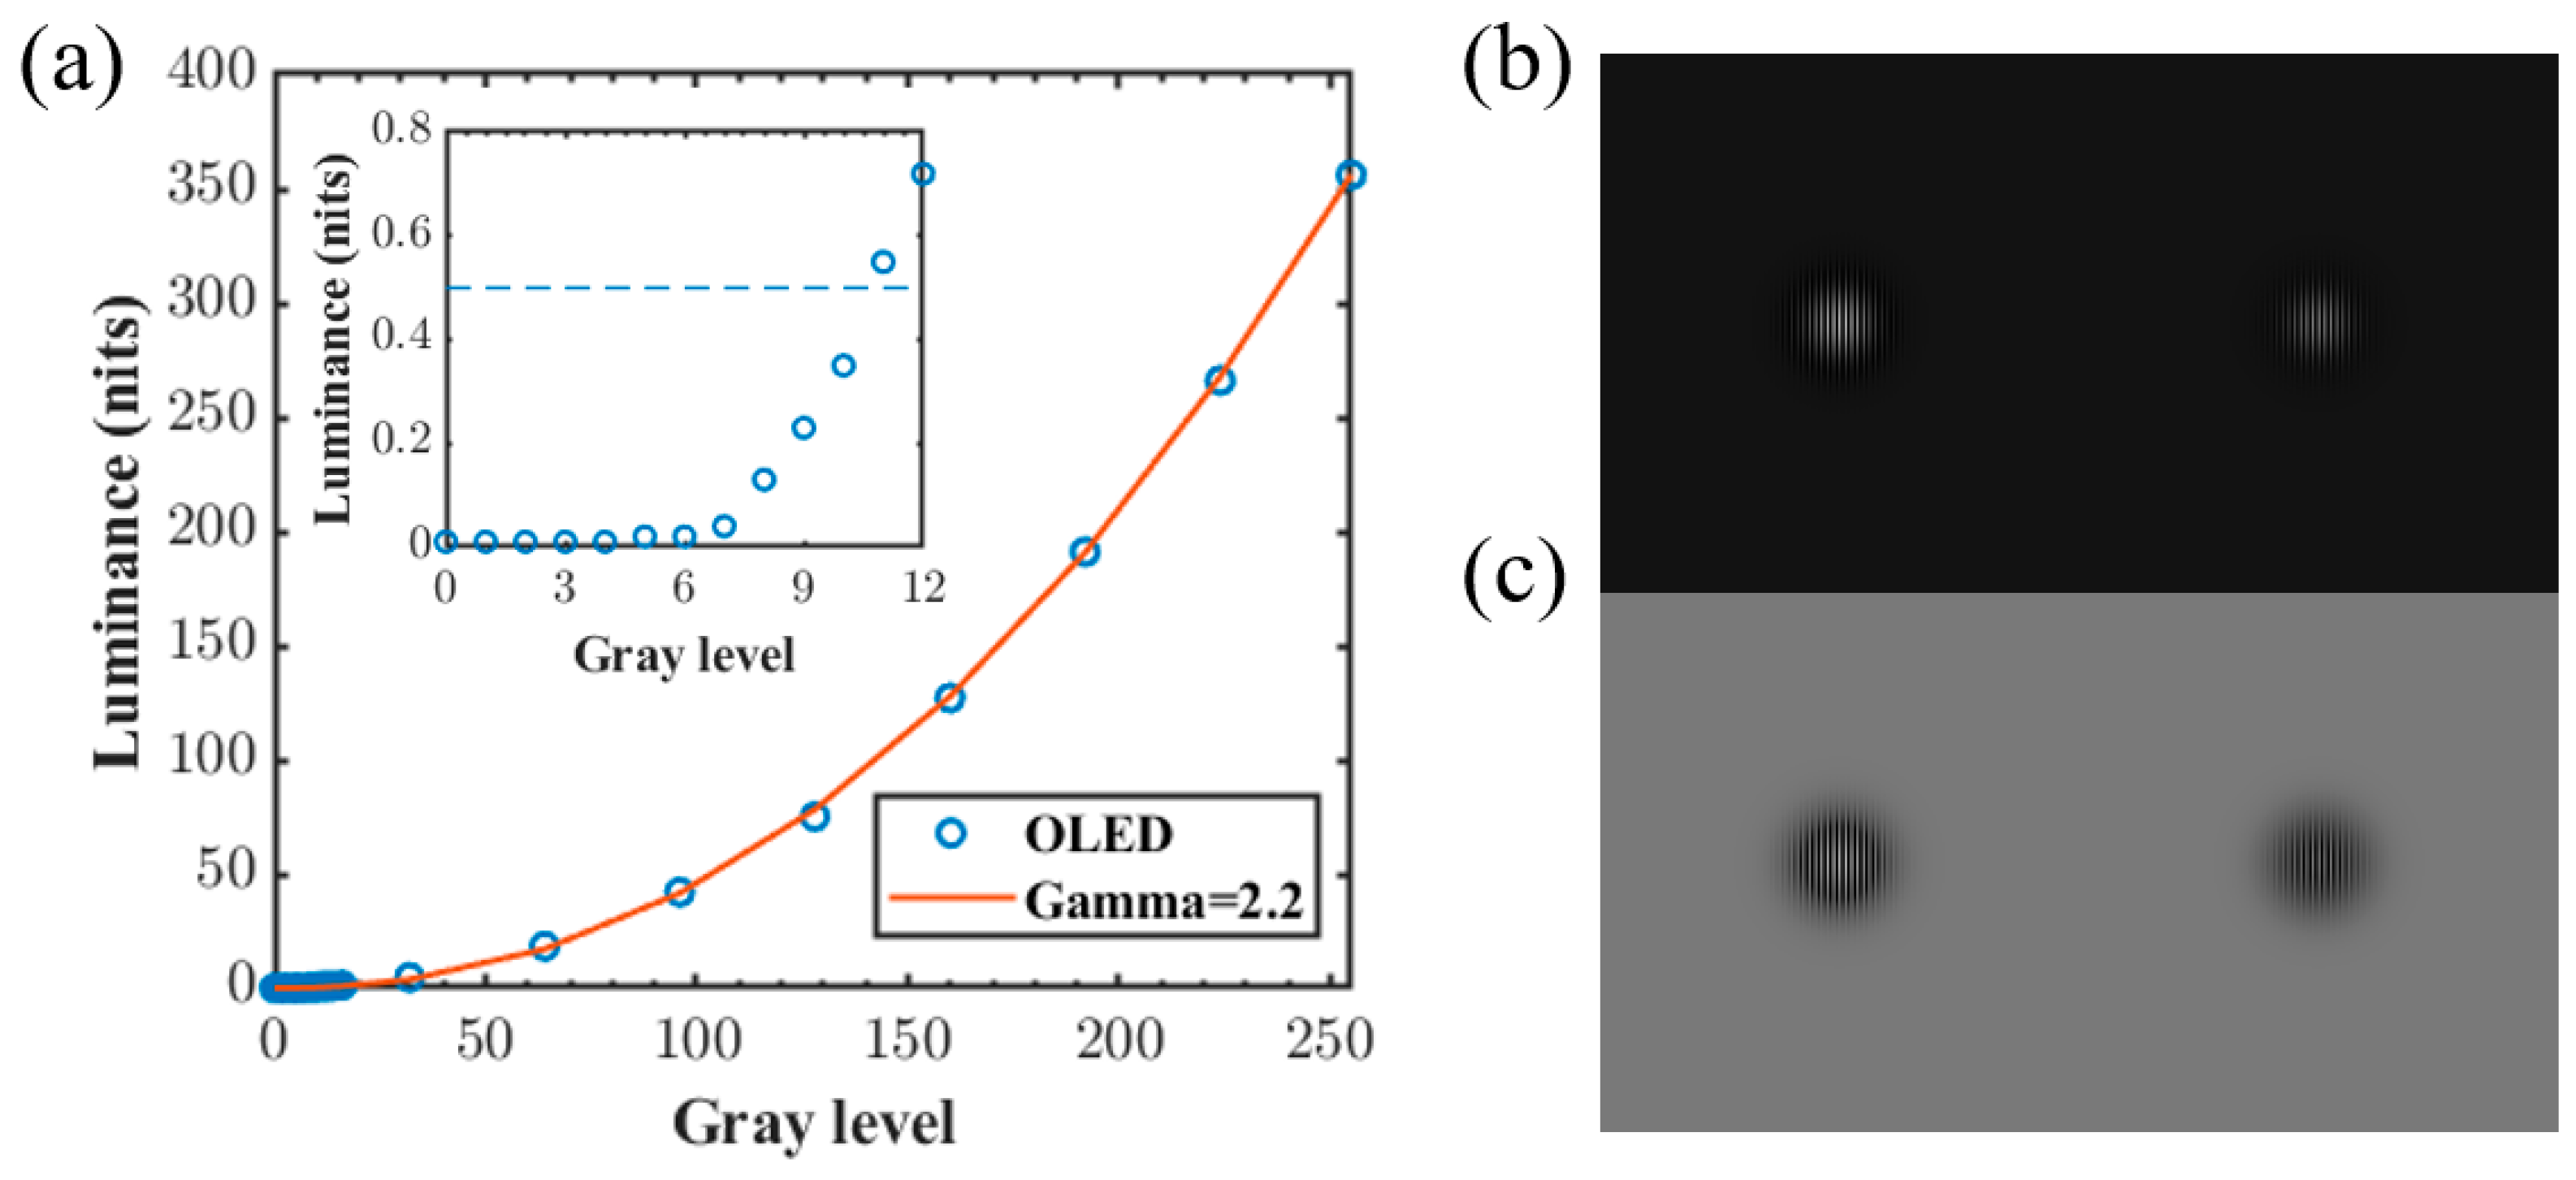
Barton’s function was derived based on massive eye exam data obtained in lab conditions. In that case, observers had sufficient time to recognize the patterns. In realistic cases, the driving condition is more complicated than lab testing. For example, the pattern on the screen should be recognized by the driver in a very short period (~1 s) for driving safety, especially when eyesight saccades from bright surroundings to the screen. Therefore, we designed a subjective experimental comparison between two same patterns with different brightness on a single commercial 4 k 15.6” OLED laptop panel with gamma = 2.2 curves (Figure 4a). As shown in Figure 4b,c, on the left screen (representing μLED), the dark state and bright state luminance were set at 0 (gray level = 0) and 356 nits (gray level = 255), respectively. On the right screen (representing LCD), the dark state and bright state luminance were set at 0.55 nits (gray level = 11) and 142 nits (gray level = 168), respectively. The background gray level in the dark room and the bright room was fixed at 25 (1.97 nits) and 120 (67.8 nits), respectively, for the eye’s preference. The bright room test took place in an environment of ~320 lux ambient light. An additional white lamp was applied to provide ~49 nit reflectance from the screen, and its spot size exactly overlapped with the testing pattern. A total of five testers at ages ranging from 23 to 31 with normal or corrected vision were included. As indicated in Table 1, the resolution density was controlled by adjusting the tester’s distance to the screen. The pattern size was also changed with distance to keep the FoV at 10°.
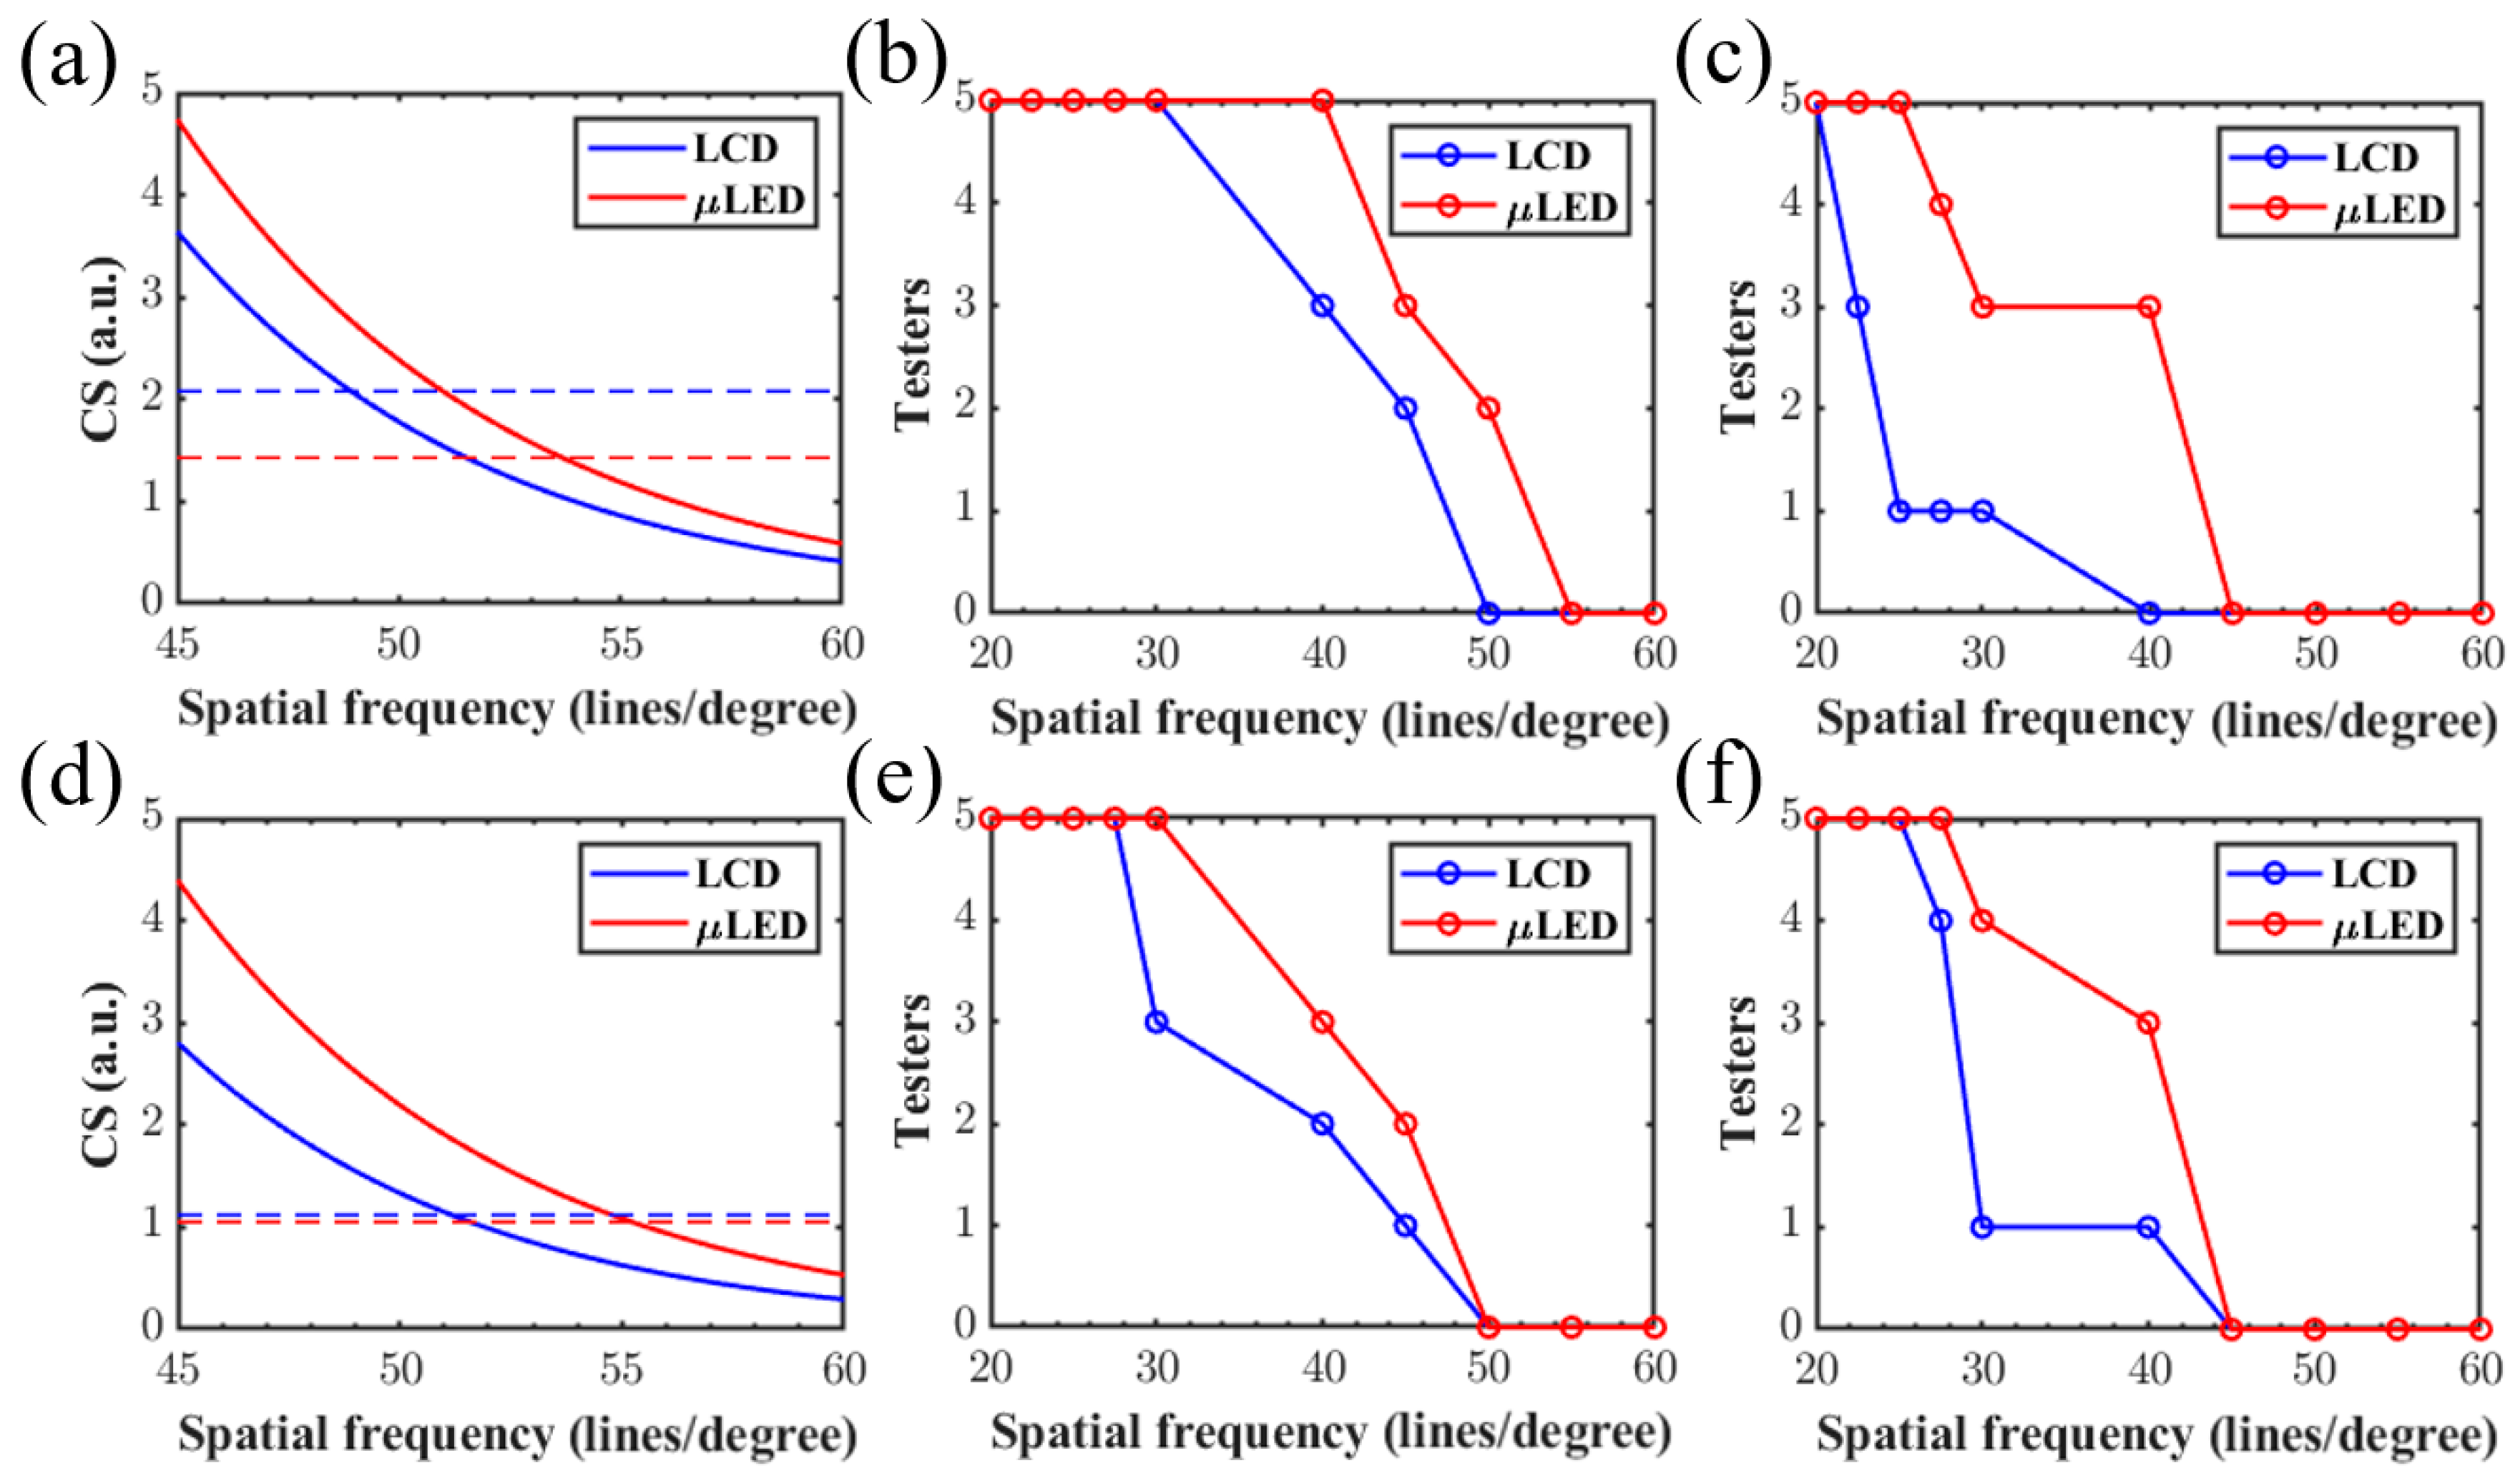
According to our simulation results shown in Figure 5a, the recognition threshold is 51.5 and 56 for LCD and μLED in the dark room, respectively. The experimental results in Figure 5b show that the patterns start to be unreadable at 45 and 40 lines/deg for the left (μLED) and right (LCD) screens, respectively. At 55 lines/deg for μLED and 50 lines/deg for LCD, the patterns are completely indistinguishable, which is very close to our simulation results.
On the other hand, the visual tests performed, as shown in Figure 5b, cannot represent realistic driving conditions because testers have sufficient time to recognize the patterns on the screen. As previously mentioned, drivers cannot stare at the screen for more than 1 s to ensure driving safety. Therefore, in quick response tests, testers are required to watch the night driving video provided by another panel, then rapidly move their sight to test patterns and recognize it within 1 s. The test results are plotted in Figure 5c. The patterns start to be unrecognizable at 27.5 and 22.5 lines/deg for μLED and LCD, respectively. At 45 lines/deg for μLED and 40 lines/deg for LCD, the patterns are completely indistinguishable. A significant degradation in performance is found for all the testers.
The bright room tests also exhibit similar results. As shown in Figure 5d, the recognition threshold is 49 and 54 lines/deg for LCD and μLED, respectively. On the other hand, according to Figure 5e,f, the recognition threshold is reduced from 50 lines/deg to 45 lines/deg for both patterns. Compared to the dark room tests, the difference is relatively small, which could be attributed to a small change in the pupil.
3. Transparent μLED for Head-Up Displays
3.1. Transmittance of a Transparent μLED
As Figure 6a indicates, the transmittance of a transparent μLED can be calculated by considering several components: (1) environmental light, which can be simplified to a D65 source, (2) surface reflectance from the μLED panel, (3) diffraction due to periodic μLED structure, and (4) the image in the human eye after considering the photopic and scotopic functions. The wavelength independent average transmittance for daylight (TDay) and night (TNight) can be calculated from Equations (3) and (4):
where D(λ), P(λ), and S(λ) represent the normalized D65, photopic, and scotopic spectrum, respectively. TSurf = 0.5 × TTE + 0.5 × TTM is the surface reflectance from the AR coating and TLED is the effective transmittance from the periodic μLED panel.
Figure 6b shows an MgF2 AR coating (refractive index 1.377) of a 30°-tilted windshield with a sealing polymer, which has a refractive index of 1.5. The calculated reflectance is consistently lower than 2.5% from 380 nm to 780 nm (Figure 6c). For a typical vehicle, the distance from the driver to the windshield is approximately 19 inches (~48 cm). To achieve 60 PPD, the full-color pixel size is approximately 143 μm. Figure 6d shows the RGB square opaque µLEDs with a pitch size of a2 in a 143 µm full-color µLED pixel, and the aperture ratio is defined as the transparent area divided by the total area. Considering a panel with 3840 × 2160 pixels, the total size is Lx = 55-cm × Ly = 31-cm.
Using the Fourier optics model for a transparent μLED from previous studies [28,29], the 2D point spread function (PSF) of the panel for an object at infinite distance can be calculated as:
where fx and fy are the spatial frequency in the x and y direction, respectively, and Lx0 and Ly0 are the size of a subpixel. For a 60 PPD full-color display panel, Lx0 = 47 μm and Ly0 = 143 μm.
If we consider the angular resolution of human normal vision acuity 20/20 to be 1 arcmin, then its corresponding length on the retina is 5 μm [28]. Therefore, on the imaging plane (retina), the effective light transmittance is the light received within 5 μm at the imaging plane; otherwise, these rays are formed into stray light, which, in turn, degrades the image quality. The effective transmittance of the panel TLED can be calculated as:
where h and h0 represent the 2D PSF for a specific aperture ratio and for the unity aperture ratio, respectively.
Figure 7a indicates that TLED remains constant for a 20 μm × 20 μm LED mesa because the diffraction order spacing is much larger than the human eye’s angular resolution, which is consistent with previous studies [28,29]. For a 143 μm pixel size, the spacing is ~65 μm for green light (λ = 550 nm), which is much larger than the distinguishable threshold (5 μm); therefore, only the wavelength-independent zeroth-order diffraction can be considered as the effective transmittance after diffraction in our case. On the other hand, transmittance increases continuously with the aperture ratio, as depicted in Figure 7b. From the simulation, we can notice that the transmittance is almost proportional to the square of the aperture ratio. This can be validated by calculating the zeroth-order diffraction intensity. For each subpixel with a mesa size of a2, the aperture function can be expressed as:
The corresponding PSF is:
Since only the zeroth-order diffraction is considered, fx and fy both approach zero, so that the transmitted power is proportional to , which is the square of the aperture ratio. As a result, to achieve 70% transmittance, the corresponding aperture ratio should be ~84.5% for the 143 μm pixel size, indicating that the mesa size should be <32.5 μm.
3.2. Brightness Requirement for a Transparent μLED
For μLED based HUDs, the most challenging part is to balance the trade-off between transparency, resolution density, and brightness. Reducing μLED mesa size helps improve transparency, but the brightness is reduced due to a lower external quantum efficiency [30,31,32]. On the other hand, for a constant μLED mesa size, increasing μLED pixel size will increase the transparency of the panel due to the increased aperture ratio. In this case, the screen resolution density, and the eye recognition threshold decrease, resulting in a decreased required panel brightness. Similar to Equation (2), the ambient RoC of a transparent display can be calculated as:
where La is the ambient light luminance. Under full daylight, the environment brightness is approximately La = 6000 nits (or ~20,000 lux) [11].
Like Figure 3d, the human eye’s recognition threshold can be calculated as a function of mesa size and display brightness by combining Equation (9) with Barten’s model. Figure 8a indicates that it is difficult to achieve 60 PPD under such strong ambient conditions. In addition, a smaller mesa size results in a higher transparency, which increases the eye recognition threshold. For example, a ~4500 nit display is required to achieve 50 PPD for a 10 μm mesa LED, while only ~2300 nits is required for LEDs with a 45 μm mesa. Since it is difficult to perfectly match the human visual acuity of 60 PPD, we slightly reduce the resolution requirement to 55 PPD and 50 PPD, corresponding to a pixel size of 157 μm and 173 μm, respectively. The required brightness and transmittance as a function of mesa size are recalculated and shown in Figure 8b. By decreasing the human recognition threshold from 55 PPD to 50 PPD, the required brightness decreases significantly from the range of ~10,000 nits to ~4000 nits. Simultaneously, transmittance increases due to a higher aperture ratio. To keep a 70% transmittance, the maximum mesa size of the μLED increases from ~35 μm to ~40 μm. Therefore, slightly reducing the display resolution can significantly reduce the demand for the display and increase the design freedom. Overall, 50 PPD μLEDs with a 20 μm mesa size can achieve both high background transmittance (~90%) and low required display brightness (~4000 nits).
3.3. Image Quality on Emissive Transparent Displays
In the above analysis, we only focus on zeroth-order diffraction and effective transmittance within 1 arcmin on the human eye pupil. On the other hand, any higher-order diffraction introduces imaging blurs, and the wavelength-dependent diffraction order spacing causes dispersion. Figure 9 describes the simulated background image blur of the object, which is placed 100 cm away from the windshield. As shown in Figure 9b,c, a large μLED mesa (e.g., 70% aperture ratio or 45 μm mesa) can cause a stronger imaging blur (horizontal stripes on the window) and the existence of rainbow stripes, which can be suppressed as the aperture ratio increases to 90%. Figure 9d shows that the calculated multi-scale structure similarity [33] agrees with the previous analysis. It cannot perfectly achieve unity because the image content is still slightly modified during image transformation even when the aperture ratio is 100%.
4. Conclusions
In conclusion, we calculated and analyzed the performance of both infotainment displays and HUDs under different ambient lighting conditions for vehicle applications. For infotainment displays, high brightness plays a much more significant role than dark-state light leakage in determining the human recognition threshold under sunlight. In other words, if mini-LED backlit LCD can provide a comparable brightness to μLED, the eye recognition performance should be close to each other. The visual test agrees with the simulation result. In addition, due to complicated driving conditions, fast recognition of the pattern will be more difficult, especially during night driving. For HUDs at the current stage, a 50 PPD (pixel size 173 μm) μLED panel with a 20 μm mesa size can achieve reduced background image blur, lower required display brightness (~4000 nits), and higher background transmittance (~90%) simultaneously.
Author Contributions
Methodology, Y.Q., Y.-H.H. and K.-H.L.; visual tests, Y.Q., E.-L.H. and Z.Y.; simulations, Y.Q., Q.Y. and K.N.; writing—original draft preparation, Y.Q.; writing—review and editing, S.-T.W.; supervision, S.-T.W. All authors have read and agreed to the published version of the manuscript.
Funding
This research is supported by the a.u.Vista Inc.
Institutional Review Board Statement
Not applicable.
Informed Consent Statement
Not applicable.
Data Availability Statement
The data presented in this study are available from the authors upon reasonable request.
Acknowledgments
The UCF group is grateful for the financial support of a.u.Vista Inc.
Conflicts of Interest
The authors declare no conflict of interest.
References
- Bauer, J.; Kreuzer, M. Understanding the requirements for automotive displays in ambient light conditions. Inf. Disp. 2016, 32, 14–22. [Google Scholar] [CrossRef]
- O’Brien, B. Highlights from the Detroit SID Vehicle Display Symposium and Exposition. Inf. Disp. 2023, 39, 37–41. [Google Scholar] [CrossRef]
- Chen, H.-W.; Lee, J.-H.; Lin, B.-Y.; Chen, S.; Wu, S.-T. Liquid crystal display and organic light-emitting diode display: Present status and future perspectives. Light Sci. Appl. 2018, 7, 17168. [Google Scholar] [CrossRef]
- Fung, M.-K.; Li, Y.-Q.; Liao, L.-S. Tandem organic light-emitting diodes. Adv. Mater. 2016, 28, 10381–10408. [Google Scholar] [CrossRef] [PubMed]
- Cho, H.; Byun, C.-W.; Kang, C.-M.; Shin, J.-W.; Kwon, B.-H.; Choi, S.; Cho, N.S.; Lee, J.-I.; Kim, H.; Lee, J.H. White organic light-emitting diode (OLED) microdisplay with a tandem structure. J. Inf. Disp. 2019, 20, 249–255. [Google Scholar] [CrossRef]
- Baethis, J.; Hohmann, K. 61-2: Invited Paper: ShyTech Displays High Resolution Displays Hidden Behind Decorative Surfaces. In SID Symposium Digest of Technical Papers; John Wiley & Sons, Inc.: Hoboken, NJ, USA, 2022; pp. 798–801. [Google Scholar]
- Fan, R.; Zhang, X.; Tu, Z. Influence of ambient temperature on OLED lifetime and uniformity based on modified equivalent lifetime detection. J. Soc. Inf. Disp. 2019, 27, 597–607. [Google Scholar] [CrossRef]
- Yang, Z.; Hsiang, E.-L.; Qian, Y.; Wu, S.-T. Performance comparison between mini-LED backlit LCD and OLED display for 15.6-inch notebook computers. Appl. Sci. 2022, 12, 1239. [Google Scholar] [CrossRef]
- Schmidt, M.; Grüning, M.; Ritter, J.; Hudak, A.; Xu, C. Impact of high-resolution matrix backlight on local-dimming performance and its characterization. J. Inf. Disp. 2019, 20, 95–104. [Google Scholar] [CrossRef]
- Gao, Z.; Ning, H.; Yao, R.; Xu, W.; Zou, W.; Guo, C.; Luo, D.; Xu, H.; Xiao, J. Mini-LED backlight technology progress for liquid crystal display. Crystals 2022, 12, 313. [Google Scholar] [CrossRef]
- Huang, Y.; Hsiang, E.-L.; Deng, M.-Y.; Wu, S.-T. Mini-LED, Micro-LED and OLED displays: Present status and future perspectives. Light Sci. Appl. 2020, 9, 105. [Google Scholar] [CrossRef] [PubMed]
- Liu, Z.; Lin, C.-H.; Hyun, B.-R.; Sher, C.-W.; Lv, Z.; Luo, B.; Jiang, F.; Wu, T.; Ho, C.-H.; Kuo, H.-C. Micro-light-emitting diodes with quantum dots in display technology. Light Sci. Appl. 2020, 9, 83. [Google Scholar] [CrossRef] [PubMed]
- Liu, Y.; Zhang, K.; Hyun, B.-R.; Kwok, H.S.; Liu, Z. High-brightness InGaN/GaN micro-LEDs with secondary peak effect for displays. IEEE Electron Device Lett. 2020, 41, 1380–1383. [Google Scholar] [CrossRef]
- Lin, J.-Y.; Jiang, H.-X. Development of microLED. Appl. Phys. Lett. 2020, 116, 100502. [Google Scholar] [CrossRef]
- Gabbard, J.L.; Fitch, G.M.; Kim, H. Behind the glass: Driver challenges and opportunities for AR automotive applications. Proc. IEEE 2014, 102, 124–136. [Google Scholar] [CrossRef]
- Blankenbach, K.; Buckley, E. Perceptual effects of laser-based HUDs. J. Disp. Technol. 2012, 8, 194–197. [Google Scholar] [CrossRef]
- Hedili, M.K.; Freeman, M.O.; Urey, H. Microlens array-based high-gain screen design for direct projection head-up displays. Appl. Opt. 2013, 52, 1351–1357. [Google Scholar] [CrossRef]
- Tsai, Y.-H.; Wu, Y.-L.; Liou, W.-T.; Kung, Y.-R.; Huang, Y.-H.; Lee, K.-C. P-202: A Flexible Transparent OLED Display with FlexUPTM Technology. In SID Symposium Digest of Technical Papers; John Wiley & Sons, Inc.: Hoboken, NJ, USA, 2017; pp. 2021–2024. [Google Scholar]
- Feng, Z.; Wu, Y.; Shi, Z.; Surigalatu; Mei, Z.; Chen, S.-J.; Lee, C.-Y.; Zhang, X. 28-3: Pixel Design for Transparent MicroLED Display with Low Blurring. In SID Symposium Digest of Technical Papers; John Wiley & Sons, Inc.: Hoboken, NJ, USA, 2020; pp. 410–412. [Google Scholar]
- Liu, Y.-T.; Liao, K.-Y.; Lin, C.-L.; Li, Y.-L. 66-2: Invited Paper: PixeLED display for transparent applications. In SID Symposium Digest of Technical Papers; John Wiley & Sons, Inc.: Hoboken, NJ, USA, 2018; pp. 874–875. [Google Scholar]
- Roka, A.; Galambos, P.; Baranyi, P. Contrast sensitivity model of the human eye. In Proceedings of the 2009 4th International Symposium on Computational Intelligence and Intelligent Informatics, Huangshi, China, 23–25 October 2009; pp. 93–99. [Google Scholar]
- Westland, S.; Owens, H.; Cheung, V.; Paterson-Stephens, I. Model of luminance contrast-sensitivity function for application to image assessment. Color Res. Appl. 2006, 31, 315–319. [Google Scholar] [CrossRef]
- Watson, A.B. The field of view, the field of resolution, and the field of contrast sensitivity. Electron. Imaging 2018, 1, 10505. [Google Scholar] [CrossRef]
- Sund, P.; Båth, M.; Månsson, L.G. Investigation of the effect of ambient lighting on contrast sensitivity using a novel method for conducting visual research on LCDs. Radiat. Prot. Dosim. 2010, 139, 62–70. [Google Scholar] [CrossRef]
- Rovamo, J.; Franssila, R.; Näsänen, R. Contrast sensitivity as a function of spatial frequency, viewing distance and eccentricity with and without spatial noise. Vis. Res. 1992, 32, 631–637. [Google Scholar] [CrossRef]
- Barten, P.G. Contrast Sensitivity of the Human Eye and its Effects on Image Quality; SPIE Press: Bellingham, WA, USA, 1999. [Google Scholar]
- SAE J1757/1_201505; Standard Metrology for Vehicular Displays. SAE International: Warrendale, PA, USA, 2015.
- Yang, Q.; Yang, Z.; Lan, Y.-F.; Wu, S.-T. Low-diffraction transparent micro light-emitting diode displays with optimized pixel structure. J. Soc. Inf. Disp. 2022, 30, 395–403. [Google Scholar] [CrossRef]
- Qin, Z.; Xie, J.; Lin, F.-C.; Huang, Y.-P.; Shieh, H.-P.D. Evaluation of a transparent display’s pixel structure regarding subjective quality of diffracted see-through images. IEEE Photonics J. 2017, 9, 1–14. [Google Scholar] [CrossRef]
- Qian, Y.; Yang, Z.; Huang, Y.-H.; Lin, K.-H.; Wu, S.-T. Directional high-efficiency nanowire LEDs with reduced angular color shift for AR and VR displays. Opto-Electron. Sci. 2022, 1, 220021. [Google Scholar] [CrossRef]
- Fan, K.; Tao, J.; Zhao, Y.; Li, P.; Sun, W.; Zhu, L.; Lv, J.; Qin, Y.; Wang, Q.; Liang, J. Size effects of AlGaInP red vertical micro-LEDs on silicon substrate. Results Phys. 2022, 36, 105449. [Google Scholar] [CrossRef]
- Olivier, F.; Tirano, S.; Dupré, L.; Aventurier, B.; Largeron, C.; Templier, F. Influence of size-reduction on the performances of GaN-based micro-LEDs for display application. J. Lumin. 2017, 191, 112–116. [Google Scholar] [CrossRef]
- Wang, Z.; Simoncelli, E.P.; Bovik, A.C. Multiscale structural similarity for image quality assessment. In Proceedings of the Thirty-Seventh Asilomar Conference on Signals, Systems & Computers, Pacific Grove, CA, USA, 9–12 November 2003; pp. 1398–1402. [Google Scholar]
Figure 1.
Spatial frequency-dependent contrast sensitivity function.

Figure 2.
(a) Calculated CSF of LCD and μLED in a dark room. The dashed lines in (b) stand for the recognizing threshold of both displays.
Figure 2.
(a) Calculated CSF of LCD and μLED in a dark room. The dashed lines in (b) stand for the recognizing threshold of both displays.

Figure 3.
Simulated CSF of LCD and μLED under (a) diffuse sunlight and (b) direct sunlight. (c) Preferred PPD of the panel as a function of display peak brightness under different ambient light. Dashed lines indicate the PPD = 55 lines/degree.
Figure 3.
Simulated CSF of LCD and μLED under (a) diffuse sunlight and (b) direct sunlight. (c) Preferred PPD of the panel as a function of display peak brightness under different ambient light. Dashed lines indicate the PPD = 55 lines/degree.

Figure 4.
(a) OLED screen gamma curve and testing patterns in a (b) dark room and (c) bright room.

Figure 5.
CS simulation, visual test, and fast response test for the (a–c) dark room and (d–f) bright room.
Figure 5.
CS simulation, visual test, and fast response test for the (a–c) dark room and (d–f) bright room.

Figure 6.
(a) Transparent μLED model, (b) AR coating on the μLED panel, (c) surface reflectance from AR coating, and (d) RGB μLED pixel structures.
Figure 6.
(a) Transparent μLED model, (b) AR coating on the μLED panel, (c) surface reflectance from AR coating, and (d) RGB μLED pixel structures.

Figure 7.
(a) Transmittance of the μLED panel as a function of wavelength when the aperture ratio is ~0.94. (b) Transmittance as a function of aperture ratio when the incident light wavelength is 550 nm.
Figure 7.
(a) Transmittance of the μLED panel as a function of wavelength when the aperture ratio is ~0.94. (b) Transmittance as a function of aperture ratio when the incident light wavelength is 550 nm.

Figure 8.
(a) Human recognition threshold of a transparent display as a function of LED brightness and mesa size under full daylight (~6000 nits) when pixel size = 143 μm. The horizontal dashed line indicates the recognition threshold of 50 PPD. The grey arrow indicates the mesa size increment. (b) Required display brightness (blue) and transmittance (orange) as a function of mesa size under full daylight. Solid lines: PPD = 50, pixel size = 157 μm; dashed lines: PPD = 55, pixel size = 173 μm.

Figure 9.
(a) Original background image used in the simulation. (b,c) Simulated image blur of transparent μLEDs with an aperture ratio of (b) 70% and (c) 90%. (d) Simulated multi-scale structure similarity (ms-ssim) as a function of the aperture ratio.
Figure 9.
(a) Original background image used in the simulation. (b,c) Simulated image blur of transparent μLEDs with an aperture ratio of (b) 70% and (c) 90%. (d) Simulated multi-scale structure similarity (ms-ssim) as a function of the aperture ratio.


Table 1.
Varying PPD as a function of distance under a fixed FoV.
| PPD | Distance to Screen (cm) | Pattern Size (cm) |
|---|---|---|
| 60 | 27.5 | 5.0 |
| 55 | 24.7 | 4.3 |
| 50 | 22.0 | 3.8 |
| 45 | 18.7 | 3.3 |
| 40 | 15.5 | 2.7 |
Disclaimer/Publisher’s Note: The statements, opinions and data contained in all publications are solely those of the individual author(s) and contributor(s) and not of MDPI and/or the editor(s). MDPI and/or the editor(s) disclaim responsibility for any injury to people or property resulting from any ideas, methods, instructions or products referred to in the content. |
© 2023 by the authors. Licensee MDPI, Basel, Switzerland. This article is an open access article distributed under the terms and conditions of the Creative Commons Attribution (CC BY) license (https://creativecommons.org/licenses/by/4.0/).
Share and Cite
MDPI and ACS Style
Qian, Y.; Yang, Z.; Hsiang, E.-L.; Yang, Q.; Nilsen, K.; Huang, Y.-H.; Lin, K.-H.; Wu, S.-T. Human Eye Contrast Sensitivity to Vehicle Displays under Strong Ambient Light. Crystals 2023, 13, 1384. https://doi.org/10.3390/cryst13091384
AMA Style
Qian Y, Yang Z, Hsiang E-L, Yang Q, Nilsen K, Huang Y-H, Lin K-H, Wu S-T. Human Eye Contrast Sensitivity to Vehicle Displays under Strong Ambient Light. Crystals. 2023; 13(9):1384. https://doi.org/10.3390/cryst13091384
Chicago/Turabian StyleQian, Yizhou, Zhiyong Yang, En-Lin Hsiang, Qian Yang, Kevin Nilsen, Yu-Hsin Huang, Kuan-Heng Lin, and Shin-Tson Wu. 2023. "Human Eye Contrast Sensitivity to Vehicle Displays under Strong Ambient Light" Crystals 13, no. 9: 1384. https://doi.org/10.3390/cryst13091384
Note that from the first issue of 2016, this journal uses article numbers instead of page numbers. See further details here.