Review

Photoinduced Phase Transition in Strongly Electron-Lattice and Electron–Electron Correlated Molecular Crystals

1
Tokyo Institute of Technology, 2-12-1 Oh-okayama, Meguro, Tokyo 152-8551, Japan
2
Tokyo Institute of Technology, 4259, Nagatsuta, Midori-ku, Yokohama 226-8502, Japan
3
Japan Science and Technology Agency PRESTO, 4-1-8 Honcho Kawaguchi, Saitama 332-0012, Japan
4
Japan Science and Technology Agency, CREST, 2-12-1 Oh-okayama, Meguro, Tokyo 152-8551, Japan
*
Author to whom correspondence should be addressed.
Crystals 2012, 2(3), 1067-1083; https://doi.org/10.3390/cryst2031067
Submission received: 6 May 2012 / Revised: 20 June 2012 / Accepted: 16 July 2012 / Published: 27 July 2012
(This article belongs to the Special Issue Molecular Conductors)

Abstract

:
Strongly electron-lattice- and electron-electron-correlated molecular crystals, such as charge transfer (CT) complexes, are often sensitive to external stimuli, e.g., photoexcitation, due to the cooperative or competitive correlation of various interactions present in the crystals. These crystals are thus productive targets for studying photoinduced phase transitions (PIPTs). Recent advancements in research on the PIPT of CT complexes, especially Et2Me2Sb[Pd(dmit)2]2 and (EDO-TTF)2PF6, are reviewed in this report. The former exhibits a photoinduced insulator-to-insulator phase transition with clearly assigned spectral change. We demonstrate how to find the dynamics of PIPT using this system. The latter exhibits a photoinduced hidden state as an initial PIPT process. Wide energy ranged time-resolved spectroscopy can probe many kinds of photo-absorption processes, i.e., intra-molecular and inter-molecular electron excitations and intramolecular and electron-molecular vibrations. The photoinduced spectral changes in these photo-absorption processes reveal various aspects of the dynamics of PIPT, including electronic structural changes, lattice structural changes, and molecular deformations. The complexities of the dynamics of the latter system were revealed by our measurements.

Graphical Abstract

1. Introduction

Strongly correlated electron systems exhibit a wide variety of phases based on small changes in the environment and their chemical composition [1]. Photoirradiation induces a transition between these phases and this phenomenon is called photoinduced phase transition (PIPT) [2,3]. Many types of interactions exist in the crystal between the constitutive atoms or molecules. Photoexcitation only produces a localized excited state; this excited state is then spread via the interactions in the crystal, resulting in the creation of the macroscopic “phase”. Changes in the macroscopic phase indicate that one photon changes the properties of many atoms or molecules in the crystal. Thus, PIPT phenomena must be the mechanism of a very efficient switching system. Furthermore, PIPT provides access to the hidden quasi-stable phases that are not seen in thermal equilibrium, because the energy scale of the photon (~eV~104 K) is extremely large compared with its thermal energy (~K). The strength of Coulomb interaction is very large and important in the very initial stage of the dynamics of PIPT in these strongly correlated electron systems. Thus, the duration of the photoinduced phase is very short and can be applied to ultrafast switching devices.
Organic charge transfer (CT) complexes that are single crystals consisting of π-electron molecules are an example of strongly correlated electron systems as well as strongly correlated electron-lattice systems. Small planar molecules are stacked face to face and typically construct a low-dimensional structure. Electrons move between the molecules via the relatively small overlap of the π-electron orbital. These features lead to the confinement of electrons in the small volume, relatively small transfer energy between the molecules, and a flexible crystal structure, which results in strong electron-electron and electron-lattice interactions. A subtle balance of the several kinds of interactions creates large instability in the phase transition due to the external stimuli. Thus, PIPT has been intensively investigated in CT complexes because of its scientific complexities and various potential applications. For example, the photoinduced neutral-ionic (N-I) phase transition in tetrathiafulvalene-p-chloranil (TTF-CA), which exhibits the so-called “domino-effect”, is the first example of PIPT [4] and has been extensively studied by numerous researchers [5,6,7,8,9].
At the development of ultrafast spectroscopic techniques has significantly contributed to progress in PIPT research, PIPT researches of CT complexes are briefly overviewed in relation to the development of pulsed laser systems. PIPT in CT complexes was first reported two decades ago. Earlier studies on the dynamics of PIPT were undertaken using a nanosecond (ns, 10−9 s)-pulsed laser (pulse width: Δt~1–10 ns) system. The dynamics discussed in these earlier studies were relatively slow; they were mainly focused on the motion of the domain walls of the photoinduced phase [4,10], because time resolution of the pump-probe measurement was restricted by the pulse width (see section 2). Triggered by the development of commercially available, stable femtosecond (fs, 10−15 s) laser systems (Δt~100 fs), we were able to measure the dynamics on a sub-picosecond (ps, 10−12 s) time scale. The ultrafast dynamics of PIPT in the sub-ps time scale have been reported by several groups to reveal the initial dynamics of PIPT [11,12]. It should be noted that the sub-ps time scale is the order of the frequency of the vibrational phenomena in CT complexes, because the 1-ps time scale corresponds to 1 terahertz (THz, 1012 Hz) on the frequency scale. The time-scale of thermal dynamics is longer than the time scale of vibrational phenomena. Thus, the dynamics of PIPT on the sub-ps time scale should be considered as an electronic origin and should not be discussed as a thermal effect. However, the observation of the creation of the “seed” of the photoinduced phase is still difficult to examine with commercial fs-laser systems. Several groups have recently constructed ultra-short laser pulse systems with a pulse width of 10–30 fs and reported the dynamics of PIPT on a 10-fs time scale [13,14,15]. Not only the electronic structure but also the lattice/molecular structures are critical for studying PIPT phenomena. The dynamics of local structures were reported via time-resolved vibrational spectroscopy (see section 3.2) [8,16].
The research target of PIPT has spread over various strongly correlated electron systems beyond CT complexes, superconductors [17,18], density waves in sulfide [19], manganites [20], and vanadates [21]. Developing various time-resolved techniques beyond all optical techniques as well as increasing the number of target materials is also important. Direct observation of the electronic structures was accomplished by time- and angle-resolved photoemission spectroscopy and has been reported on some metallic compounds [22]. Time-resolved terahertz spectroscopy is a technique of probing electronic structures in a very low energy range [23]. Time-resolved diffraction measurements such as X-ray scattering and electron diffraction are techniques used to directly observe lattice/molecular structural changes and they have been the subject of several recent studies [6,24,25]. These advancements in new techniques reveal new aspects of the dynamics of PIPT and have attracted many researchers to this field.
We review two types of PIPT systems in this paper with charge ordering phases as their low temperature phases: Pd(dmit)2 salt (dmit = 1,3-dithiol-2-thione-4,5-dithiolate) [26] and (EDO-TTF)2PF6 (EDO-TTF = ethylenedioxy-tetrathiafulvalene) [27]. Although the strong coupling between the charge and local structure play an important role in the low temperature phases of both systems, the two systems have different charge ordering mechanisms. The Pd(dmit)2 salt has photoinduced-insulator-to-insulator phase transition due to local excitation in the Pd(dmit)2 dimer [28]. The ordering mechanism of Pd(dmit)2 salt is relatively localized. The dynamics of PIPT in the early stage is simple and can be distinguished by well-assigned optical spectral change; thus, we demonstrate how to discover the dynamics of PIPT using this system. However, (EDO-TTF)2PF6 has a thermally hidden phase as a photoinduced phase due to relatively strong electron-electron Coulombic repulsion [29]. Ultrafast time-resolved spectroscopy using fs-laser pulses succeeded in separating the influences of electron–electron and the electron–lattice interactions in this case and in creating the thermally hidden phase. Wide energy-range time-resolved spectroscopy can probe many kinds of photo-absorption processes and reveal various aspects of the dynamics of PIPT, including electronic structural changes, lattice structural changes, and molecular deformations. We found a rich variety of observed phenomena in the dynamics of PIPT concerning (EDO-TTF)2PF6.

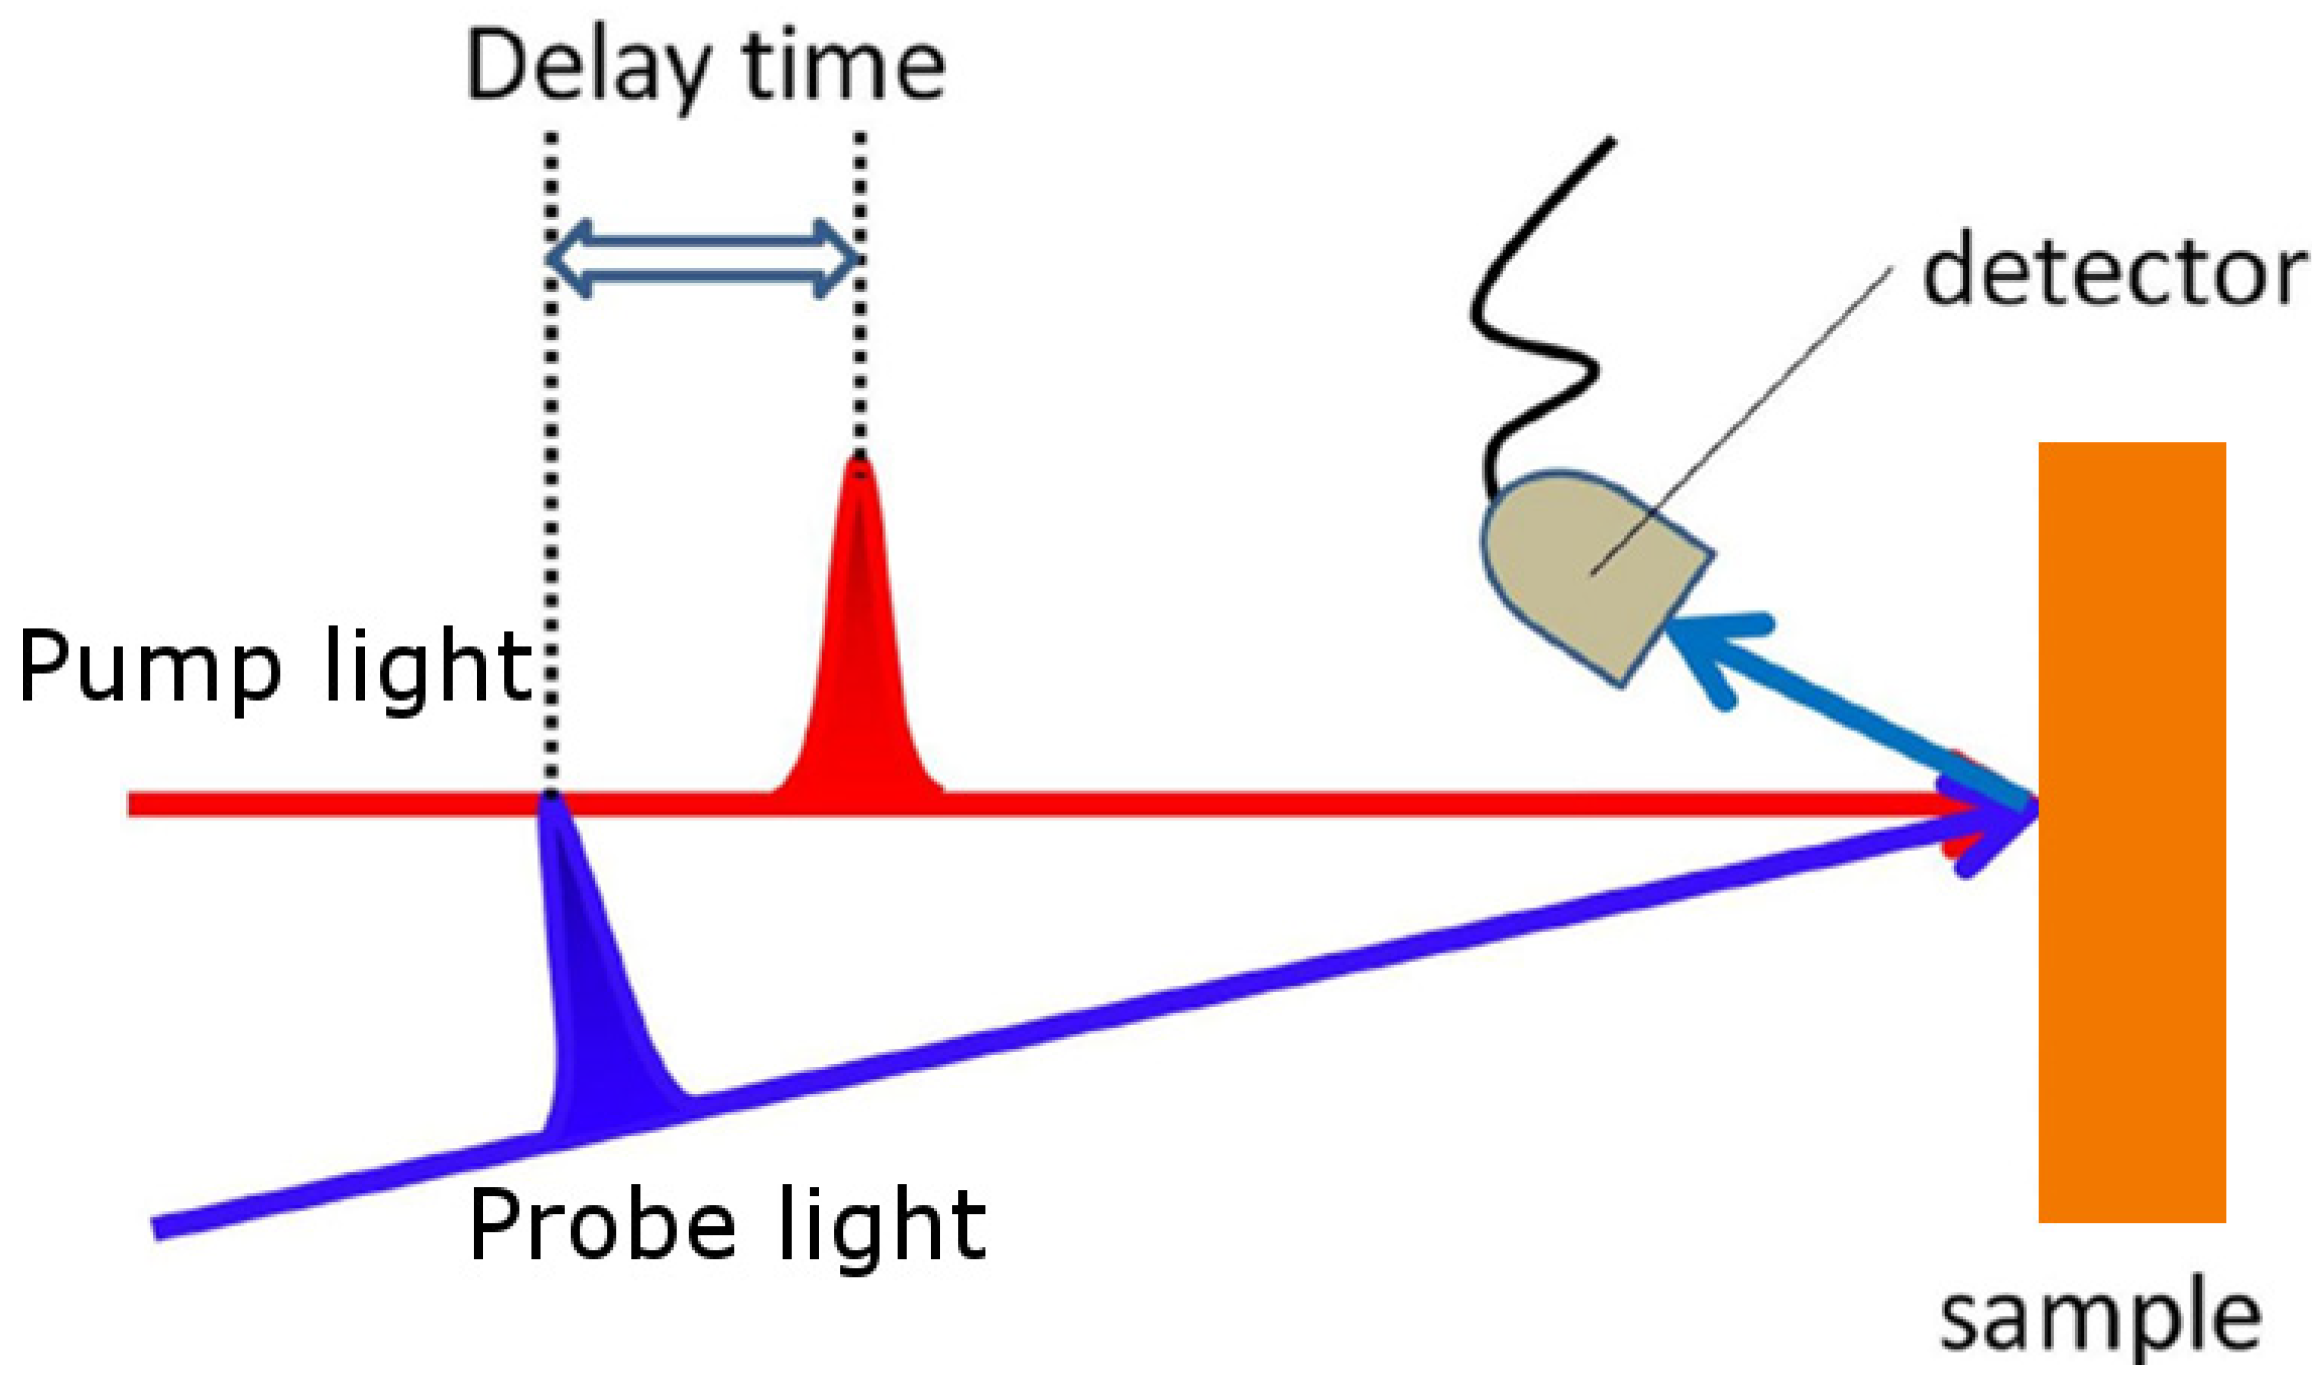
2. Experimental Setup

We built an ultrafast pump-probe system that enabled us to measure the transient reflectivity spectra over a wide photon energy range using the output of a Ti:sapphire chirped pulse amplifier (CPA, pulse width Δt = 120 fs, photon energy ħω = 1.53 eV, and 1-kHz repetition rate) to clarify non-equilibrium photoinduced phases. The concept underlying the time-resolved pump-probe reflectivity measurements is schematically outlined in Figure 1. The pulsed output from the light source was divided into two synchronized pulses: pump and probe pulses. The time delay between the pump and probe pulses was varied using the translational stage to create a difference in the optical path length. We measured the photoinduced changes in the optical reflectivity of the sample using the probe pulse at specific delay times after the photoirradiation of the pump pulse with the time-resolution determined by the convolution of the pulse width of the pump and probe pulses. The signals were synchronously collected with a photodetector and accumulated on a personal computer to improve the signal to noise ratio. The intensities of these two pulses were controlled by variable neutral density optical filters. The intensity of the probe pulse was much weaker than that of the pump pulse to avoid any influence on the sample. The photon energy of the probe pulse was tuned from far infrared to visible using optical parametric amplification (OPA) and difference frequency generation (DFG). The spot sizes of the pump and probe pulses were adjusted to approximately 350 µm in diameter for the former and 50 µm for the latter (full width at half maximum). The difference in the spot sizes of the pump and probe pulses ensured nearly homogeneous excitation in the area of the probe light. We present ΔR/R as experimental data, and ΔR/R is defined as ΔR/R = (R(t) − R0)/R0, where R(t) is the reflectivity at delay time t and R0 is reflectivity without the pump light.
Figure 1. Typical setup for time-resolved reflectivity measurements.
Crystals 02 01067 g001

3. Results and Discussion

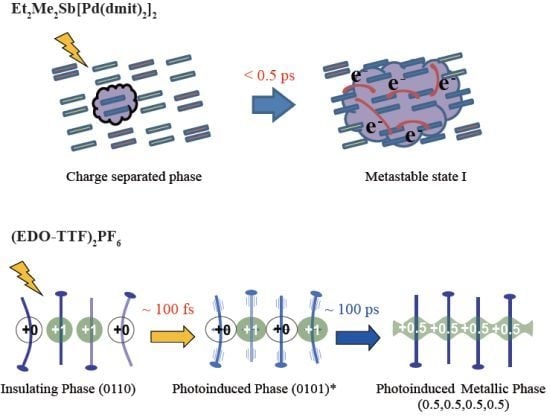
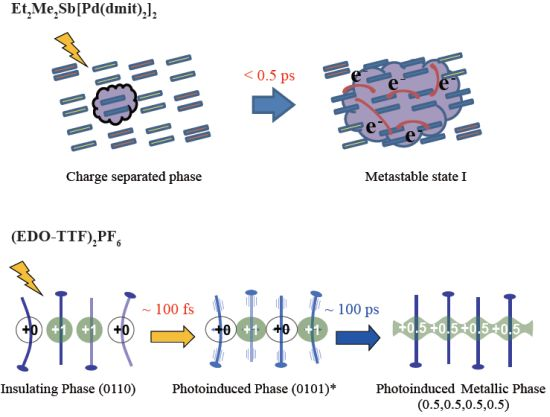
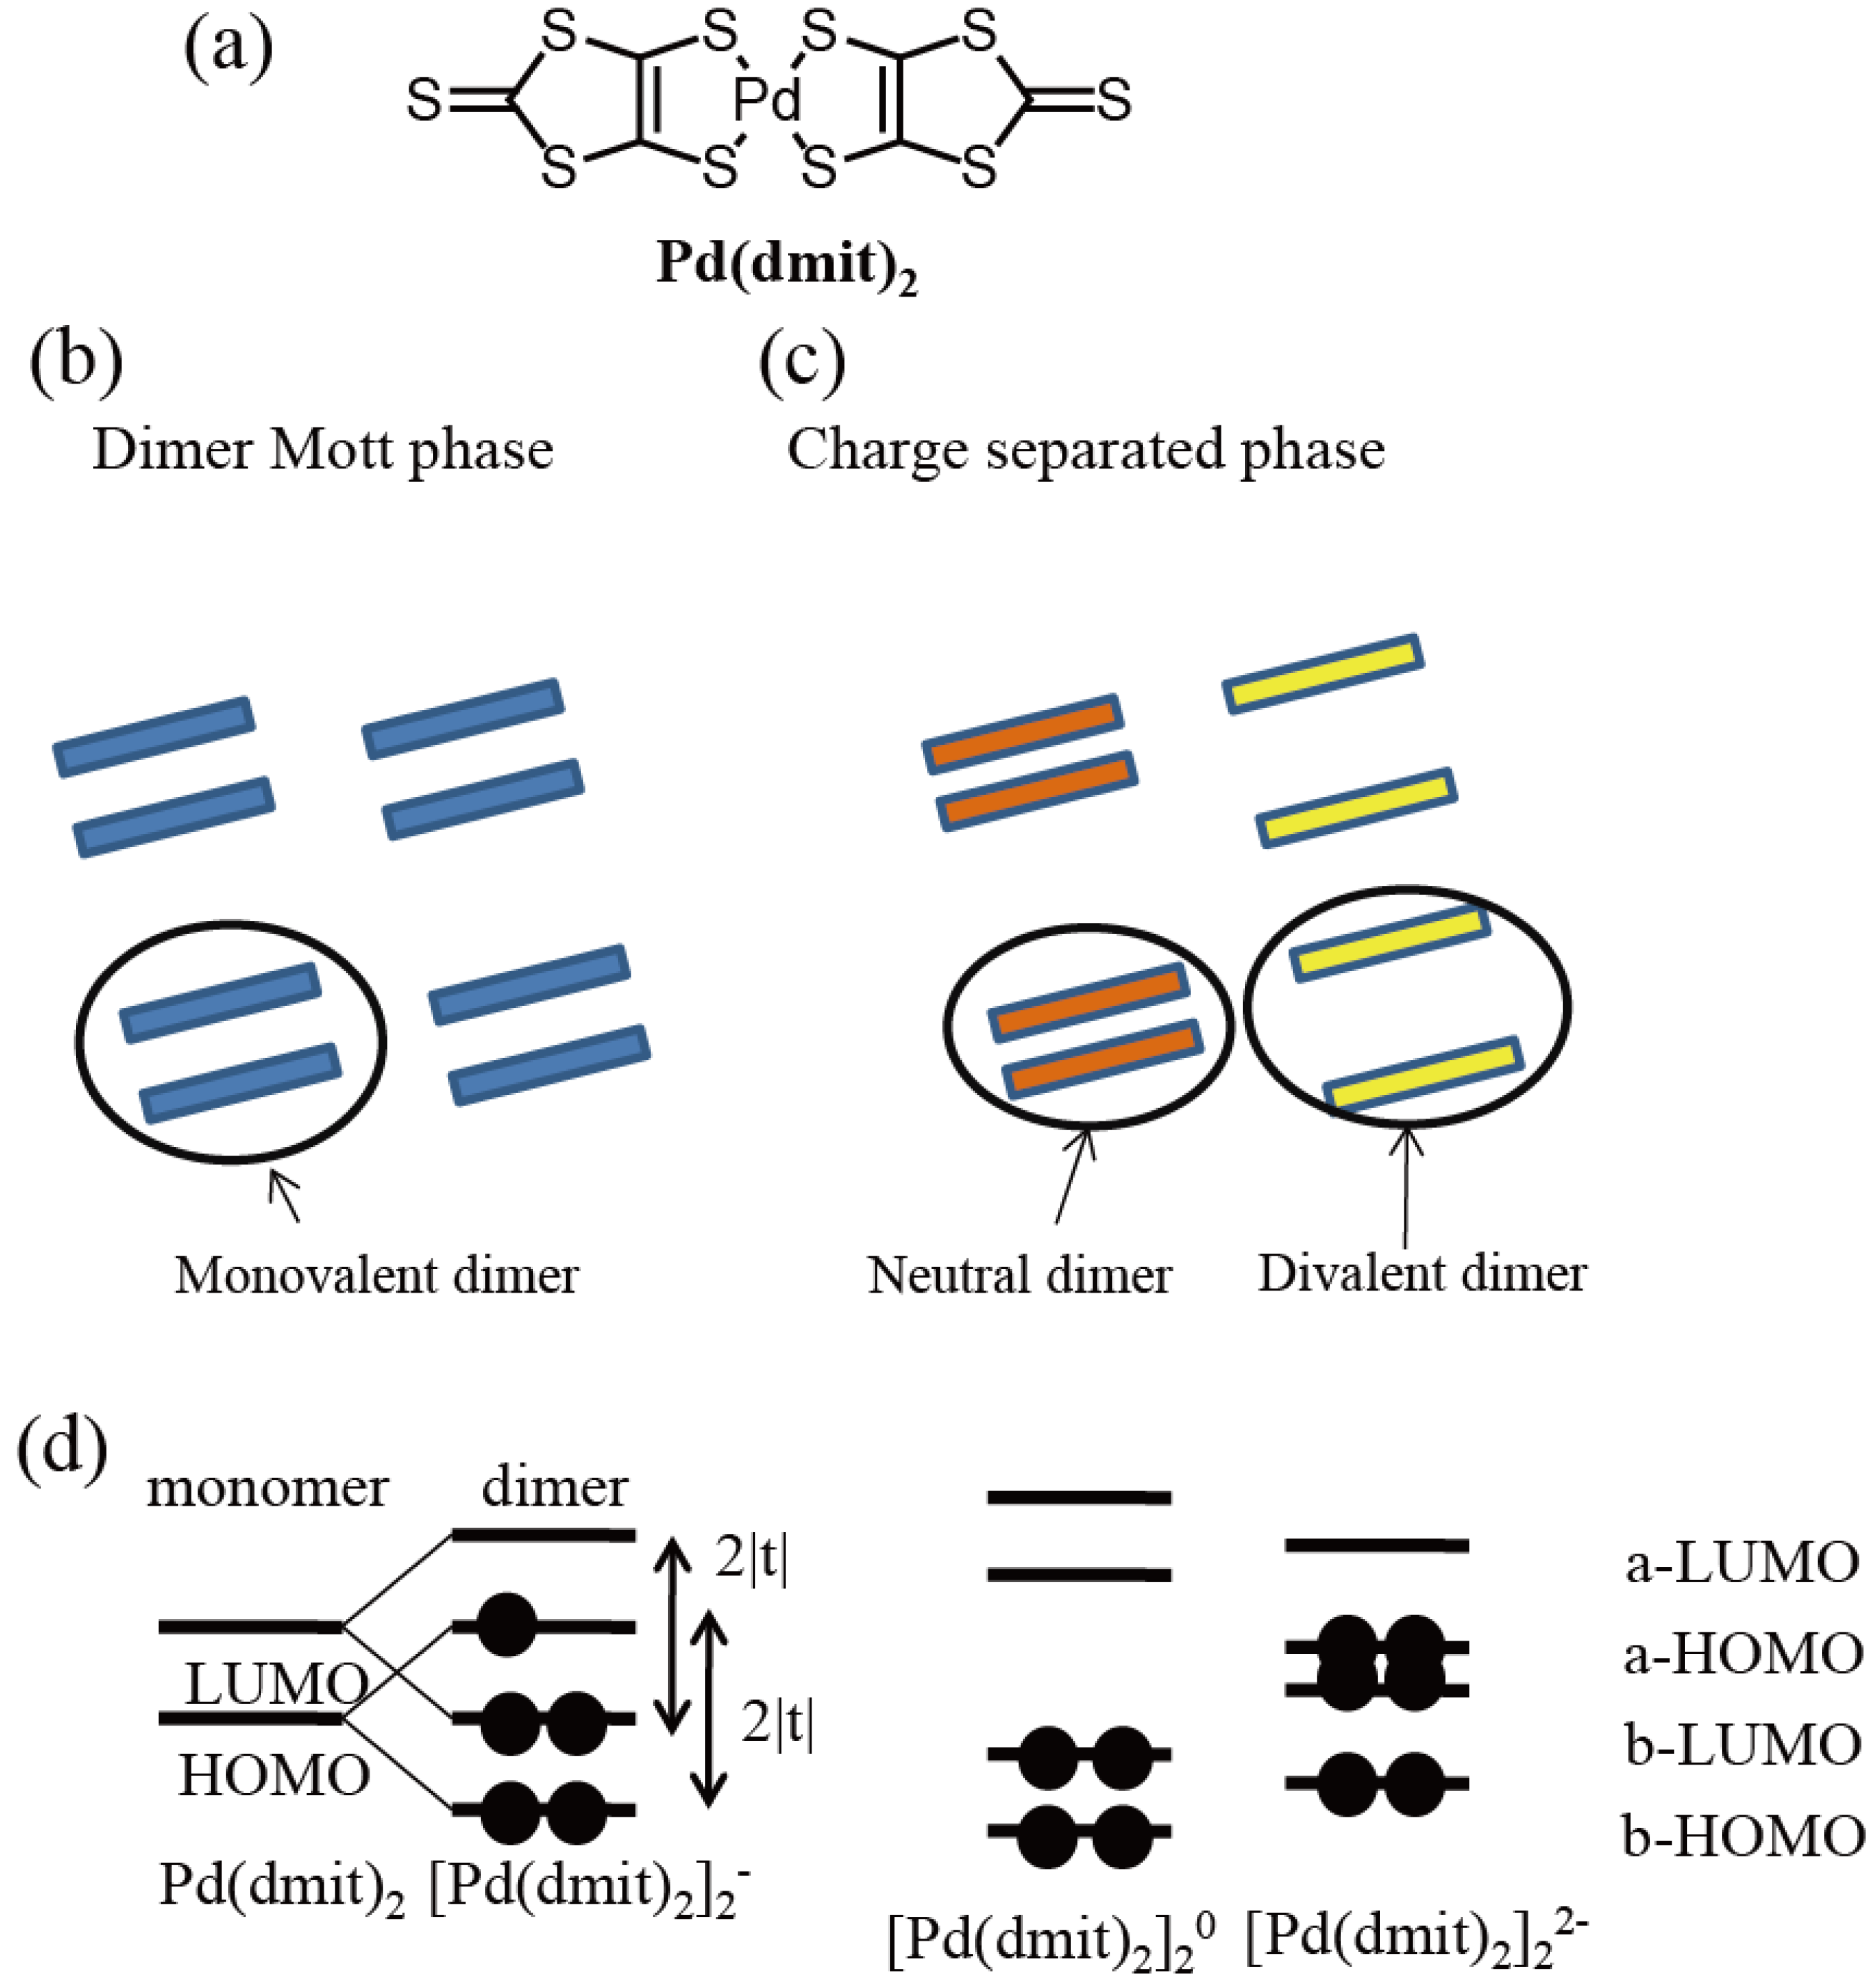
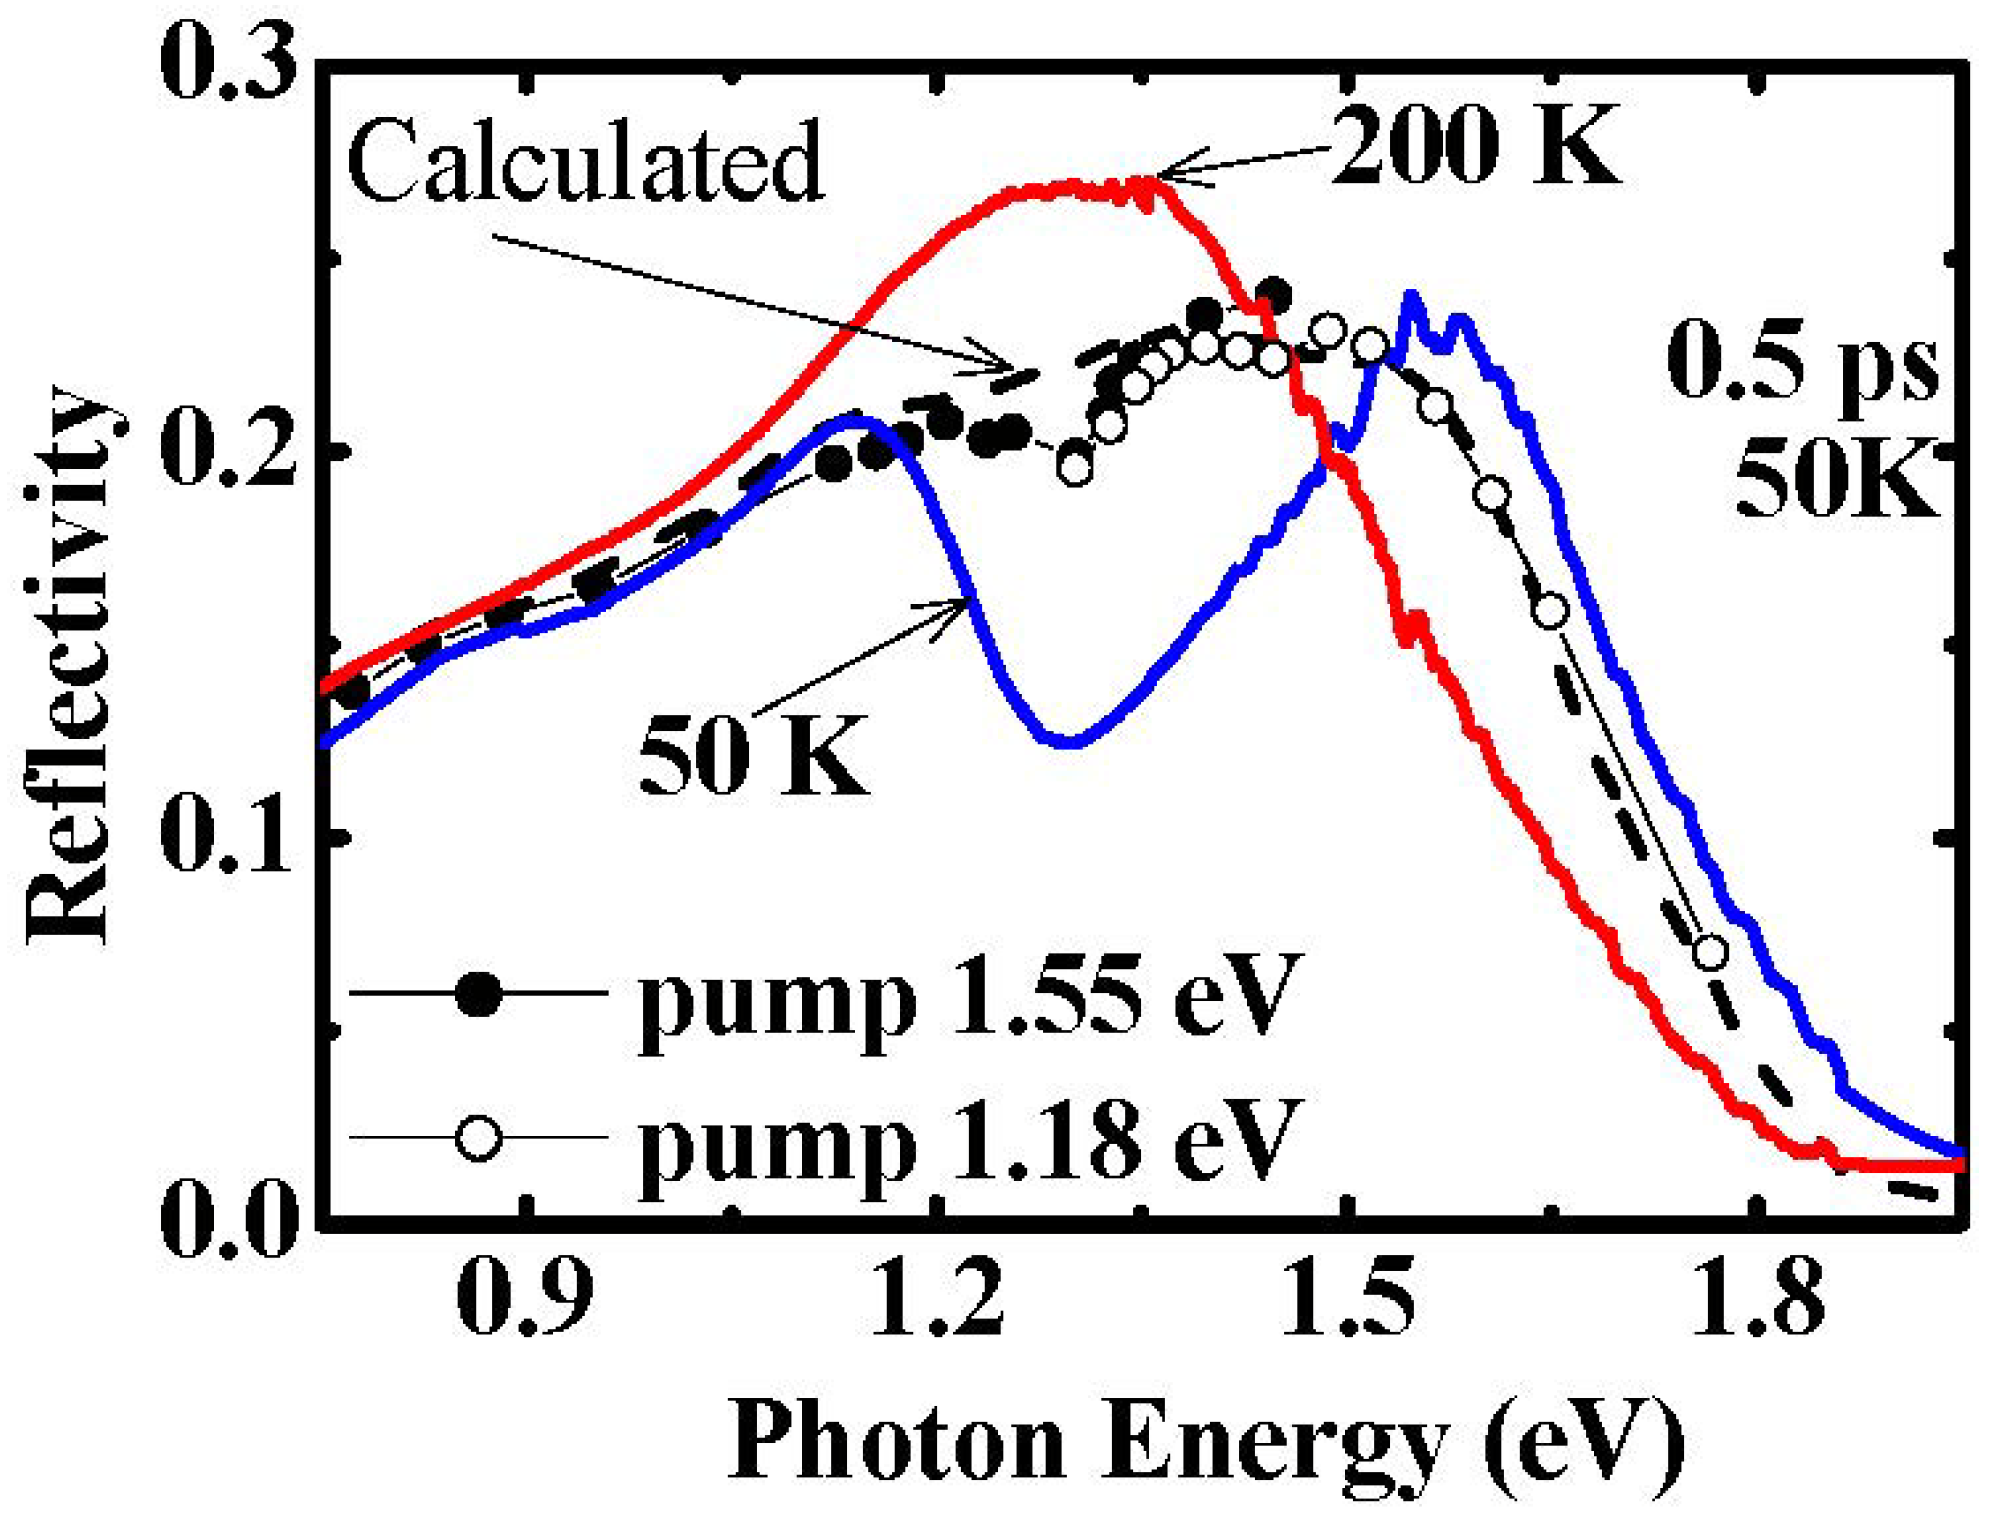
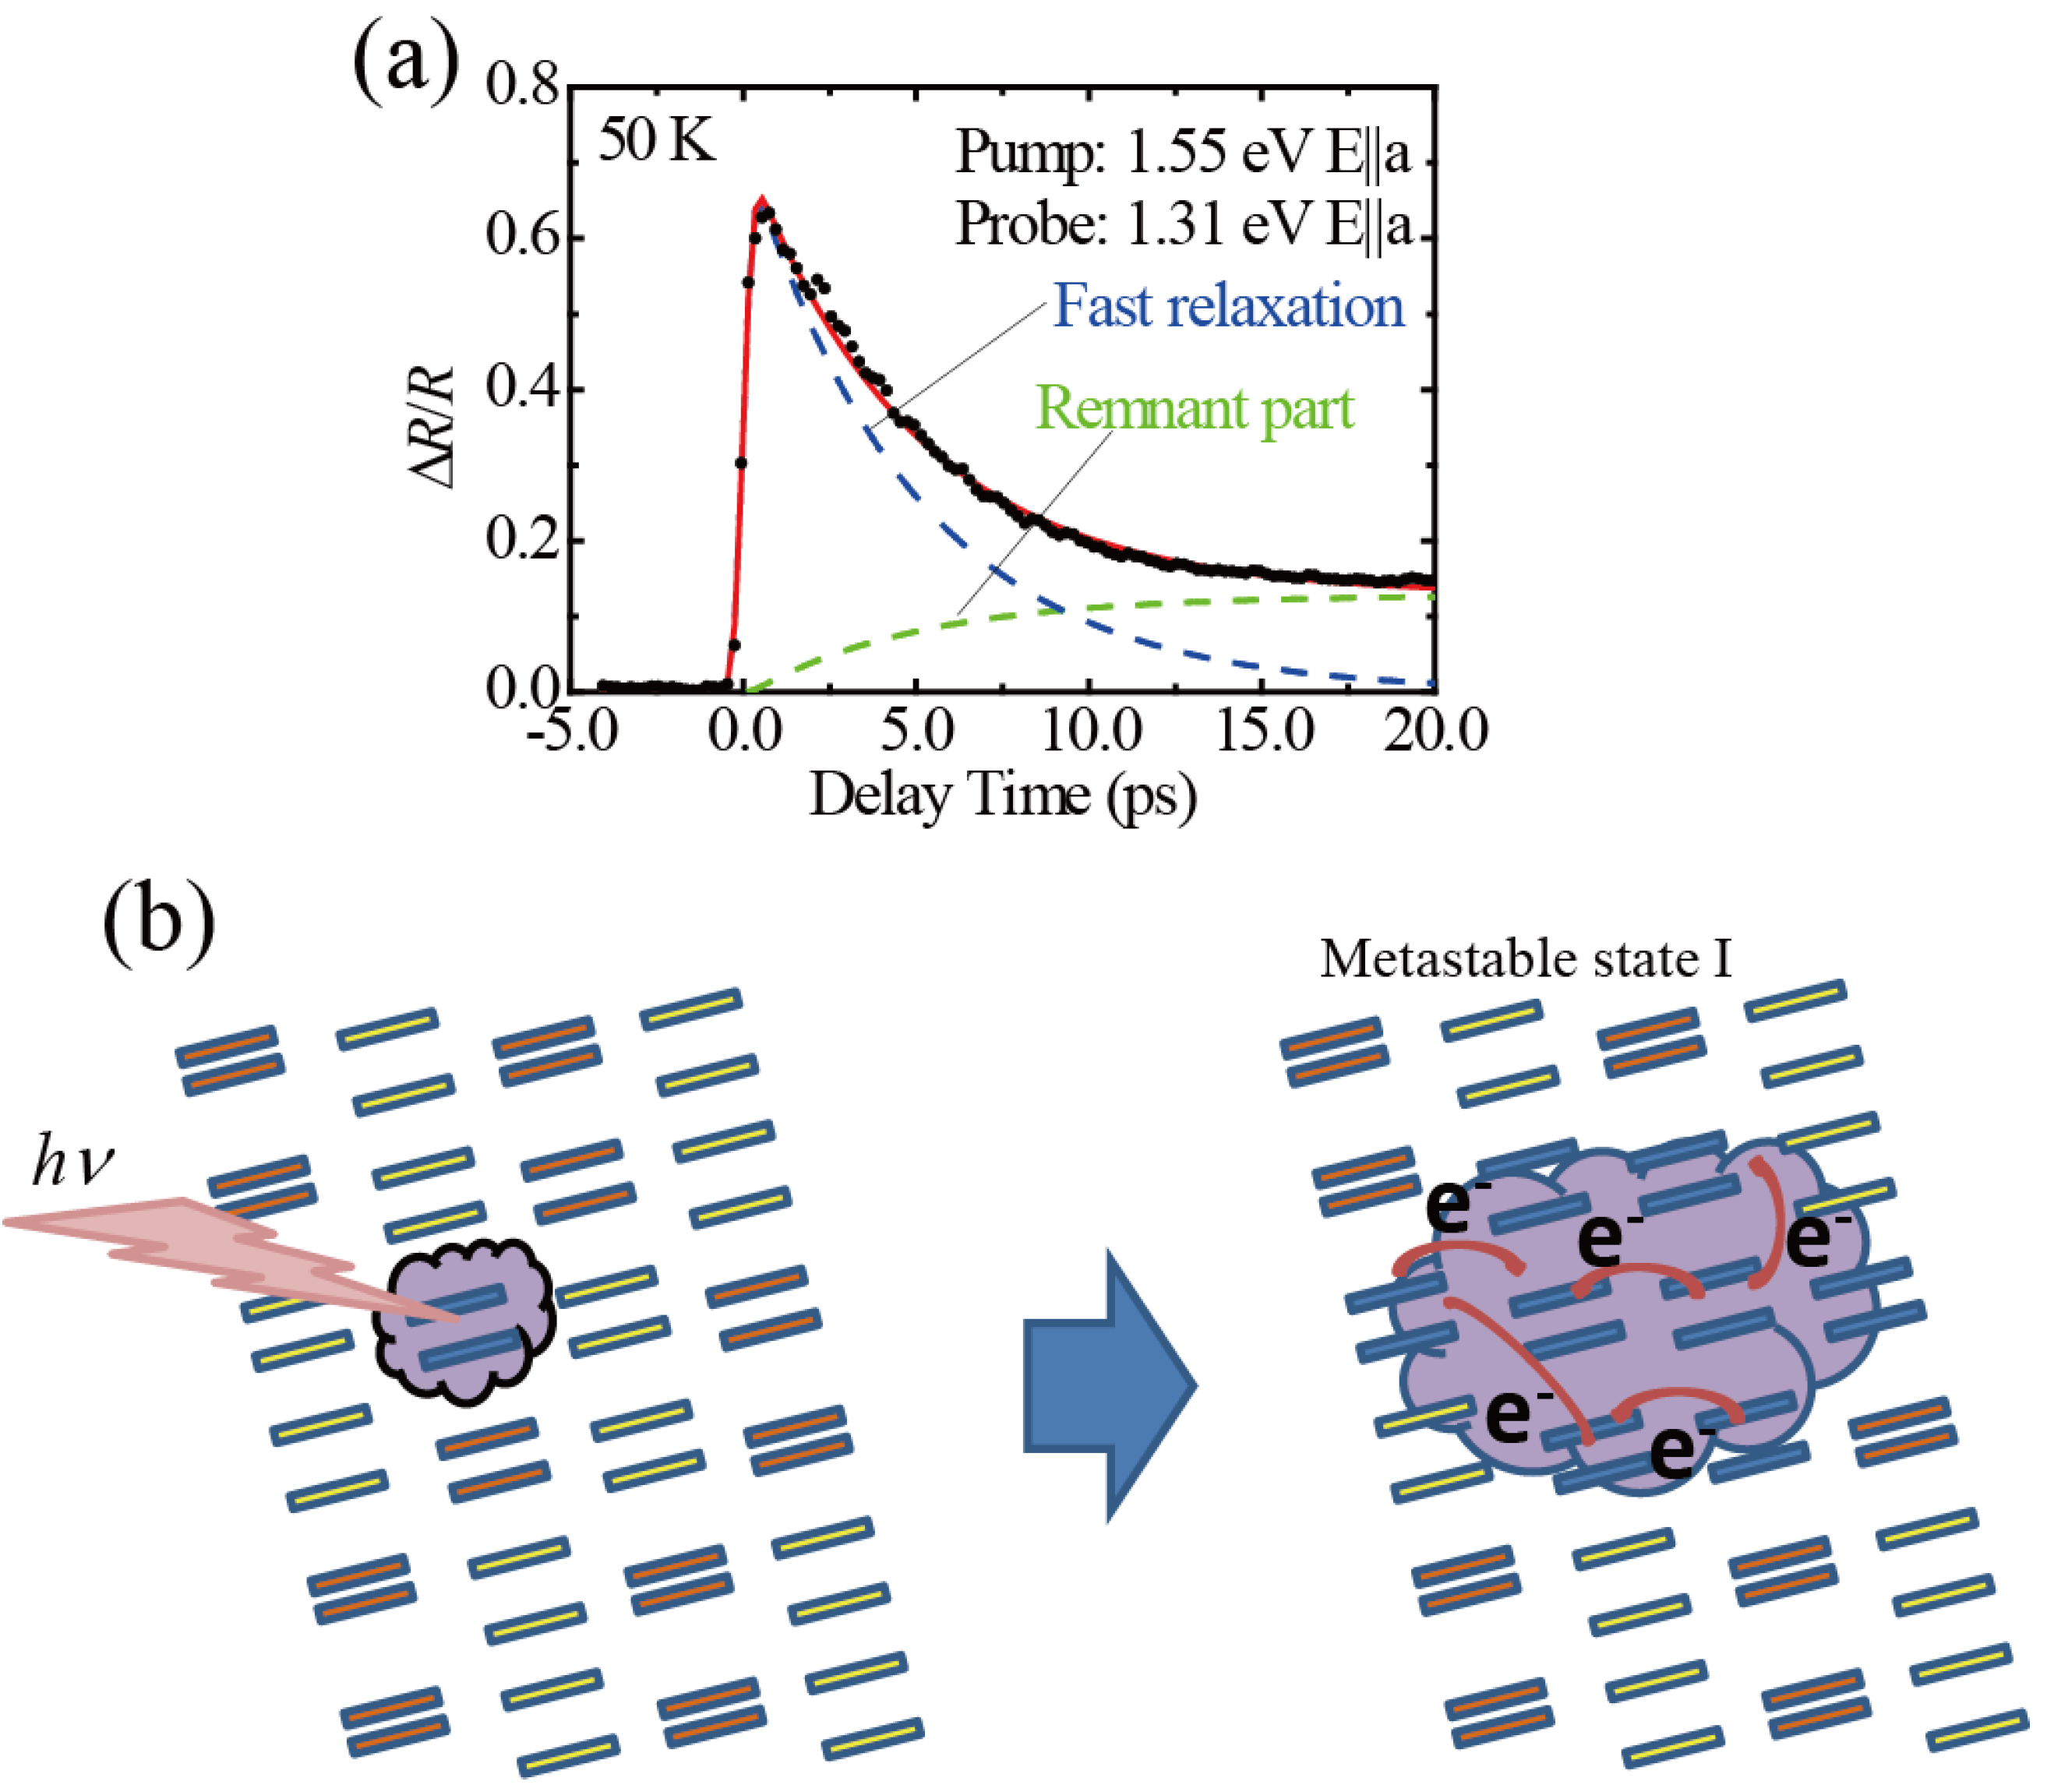
3.1. Photoinduced Phase Transition from Charge Separated Phase to Dimer Mott Insulating Phase in Et2Me2Sb[Pd(dmit)2]2 (dmit = 1,3-Dithiol-2-thione-4,5-dithiolate)

Et2Me2Sb[Pd(dmit)2]2, which exhibits a unique charge-ordered insulating phase due to HOMO-LUMO interplay in the Pd(dmit)2 dimer [30,31,32], crystallizes in a layered structure, in which quasi-two-dimensional conducting anion layers made of Pd(dmit)2(Figure 2a) and insulating cation layers of Et2Me2Sb are alternately stacked. The crystal structures of the conducting anion layers of the high- and low-temperature phases are schematically shown in Figure 2b,c. The Pd(dmit)2 molecules in the conducting anion layer are strongly dimerized. The system has a half-filling character due to very strong dimerization. The strong charge correlation turns the high-temperature phase into a dimer Mott insulating phase (called the DM phase after this), which only has monovalent dimers (Figure 2b). This material exhibits real space ordering of charges in the low-temperature phase, resulting in another type of insulating phase. The valence of the dimers in this low temperature phase is not uniform, and the two types of dimers, which have different intermolecular spacing, are ordered as schematically shown in Figure 2c. The microscopic mechanism involved in this low-temperature phase is based on the unique nature of the multi-level electronic structure of the dimer of Pd(dmit)2, HOMO-LUMO interplay in the dimer and the energetically stable neutral dimer (Figure 2d), instead of inter-site Coulombic repulsion which is the origin of the usual charge-ordering phase [32]. Thus, this low temperature phase is referred to as the “charge-separated” (CS) phase to distinguish it from the conventional charge-ordering phase.
Figure 2. (a) Molecular structure of Pd(dmit)2; (b) Schematic of crystal structure of high-temperature dimer Mott insulating phase of Et2Me2Sb[Pd(dmit)2]2 on Pd(dmit)2 plane; (c) Schematic of crystal structure of low-temperature charge-separated phase on Pd(dmit)2 plane. Rectangles in (b) and (c) represent Pd(dmit)2 molecules viewed along molecular long axis and are colored corresponding to valences of dimers; (d) Schematic energy diagram of Pd(dmit)2 monomer and dimers. Closed circles represent electrons.
Crystals 02 01067 g002
This unique CS phase can clearly be identified by the reflectivity spectrum [30]. Reflectivity indicates characteristic peak structures in the near-IR range (solid lines in Figure 3a) that are due to intra-dimer photoexcitation between the bonding and anti-bonding states of the molecular orbitals (indicated by the arrows in Figure 2d). These peak energies are determined by the overlapping integral (|t|) of the Pd(dmit)2 molecules in a dimer; this integral directly reflects the degree of dimerization. Therefore, the number of peaks in intra-dimer photoexcitation is the number of species of different valenced dimers; one is in the DM phase and two are in the CS phase.
Figure 3. Closed and open circles correspond to photoinduced reflectivity spectra (E||a-axis) with excitation photon energies of 1.55 eV and 1.18 eV, at 0.5 ps after photo-irradiation. Excitation intensity, i.e., number of absorbed photons per unit volume estimated by considering penetration depth of excitation light, was 1.4 × 10²⁰ photons/cm3 at 1.55-eV pump and 7.6 × 10¹⁹ photons/cm3 at 1.18-eV pump. Solid lines plot spectra without photoexcitation at 50 K (blue, CS phase) and 200 K (red, DM phase). Dashed line plots the simulated reflectivity spectrum using multi-layer model [27]. Reproduced with permission from Ishikawa et al. [28].Copyright (2009) by the American Physical Society.
Crystals 02 01067 g003
Photoinduced insulator-to-insulator phase transition has been observed in this anion dimerized system, Et2Me2Sb[Pd(dmit)2]2. The transient reflectivity spectra at 50 K and 0.5 ps after photoexcitation were measured by Pump-Probe time-resolved spectroscopy and have been plotted in Figure 3 as closed and opened circles. We needed to use two different kinds of excitation conditions, i.e., different photon energy and intensity, because of experimental restrictions to create the overall photoinduced spectrum in the energy range of intra-dimer photoexcitation. The time dependencies of photoinduced reflectivity change under the two different excitation conditions at the same probe photon energies are quite similar at least in the delay time range after 0.5 ps (see Ishikawa et al. [28]); thus, we constructed the reflectivity spectrum of a photoinduced state in the energy range of intra-dimer photoexcitation by connecting the two spectra under different excitation conditions.
We quantitatively reproduced the spectra we obtained by assuming a homogeneous state for the surface and an exponential decay distribution for the photoinduced state along the direction of propagation of the pump light taking into consideration a finite penetration depth for the pump light. In addition, we assumed the dielectric function (ε) could be described by a linear combination of ε in the DM (εHT) and initial (εLT) states. The details on the procedure for analysis are described in Ishikawa et al. [28] and references therein. The calculated curve corresponded well with the experimental data, as shown in Figure 3. One excitation photon at 0.5 ps after the photoexcitation converted approximately five dimers to the photoinduced DM state, using the parameters in this calculation; after this, we will refer to this state as “metastable state I”. The conversion rate exceeded one, suggesting the cooperative nature of the photoinduced phenomena. The results we obtained strongly suggest the occurrence of insulator-to-insulator PIPT, which is a new class of PIPT from the CS to DM phase; in other words, PIPT between the crystals of charges with different periods of charge modulation in real space. However, the value of the conversion rate was not particularly large compared to the conventional charge ordering system’s value, which sometimes exceeds 100 [33]. This relatively low conversion rate reflects the rather local nature of the mechanism for CS phase transition.
Figure 4a plots the typical dependence of relative reflectivity change (ΔR/R) on time that was induced by pulsed laser irradiation at 50 K (CS phase). The probe photon energy was set to 1.31 eV (E||a-axis). The dependence of ΔR/R on time on this time scale is a good fit obtained by the summation of one component of exponential decay and a remnant part (see Ishikawa et al. [28] for details), as seen in Figure 4a. The fitting function we used is,
Crystals 02 01067 i001
here, A, B, t0, and τ correspond to the amplitude of the component of exponential decay, the amplitude of the remnant part, the time origin, and the relaxation time of exponential decay.
Figure 4. (a) Typical time profile for results of time-resolved spectroscopy using femtosecond laser pulse; (b) Schematic of photoinduced phase just after photoexcitation (left panel) and 0.5 ps after photoexcitation (right panel) [28]. Reproduced with permission from Ishikawa et al. [28]. Copyright (2009) by the American Physical Society.
Crystals 02 01067 g004
It is important to note that there appear to be three processes in photoinduced dynamics: (1) a rising edge just after excitation; (2) fast relaxation (exponential part indicated by the dashed line); and (3) a remnant part (indicated by the dotted line). For now, we have assigned these processes as follows, Just after photo-excitation, ΔR/R rapidly increased within approximately 0.5 ps to reach the peak values. One Pd(dmit)2 dimer, neutral or divalent, in the very initial stage in this process should be in the photoexcited initial state without changing the distance between the molecules in a dimer, according to Franck-Condon approximation. This photo-excited dimer induces electron transfer between the photo-excited dimer and surrounding dimers. These excited dimers also indicate a change in the inter-molecular distance in dimers, resulting in photoinduced metastable state I within the time scale of the first rising edge, as shown in Figure 4b. This metastable state I has a fast relaxation process as indicated by the dashed line and is transformed into metastable state II, i.e., the remnant part plotted by the dotted line, which has a longer relaxation time than the measured time scale. The relaxation time of metastable state I is closely related to the temperature and excitation intensity, as reported by Ishikawa et al. [28]; thus, the relaxation process of metastable state I in this crystal is governed by the density and coherence length of metastable state I due to certain cooperative effects. As previously discussed, metastable state I is very similar to the high-temperature phase based on the photoinduced near-IR spectra. However, we could not assign metastable state II in the previous report [28].
We recently measured time-resolved vibrational spectra suggesting that metastable state I is not exactly the same as the high-temperature DM phase or the high-temperature DM phase that emerged as slow dynamics over 100 ps [34]. Interestingly, a similar system, Cs[Pd(dmit)2]2, which has a second-order phase transition between the bad-metal and CS phases [31,35,36], revealed a high-temperature bad-metal phase as a photoinduced phase just after photoexcitation without measurable delay. We consider that metastable state I at this stage is similar to the high-temperature DM phase with respect to the electronic or local structures of the Pd(dmit)2 dimer; however, the crystal structure of the entire crystal is not exactly the same as the high-temperature phase corresponding to the nature of the system’s thermal first-order phase transition [34]. After the time scale (~20 ps) in Figure 4, we found additional slow dynamics, which may be attributed to domain motion [37].

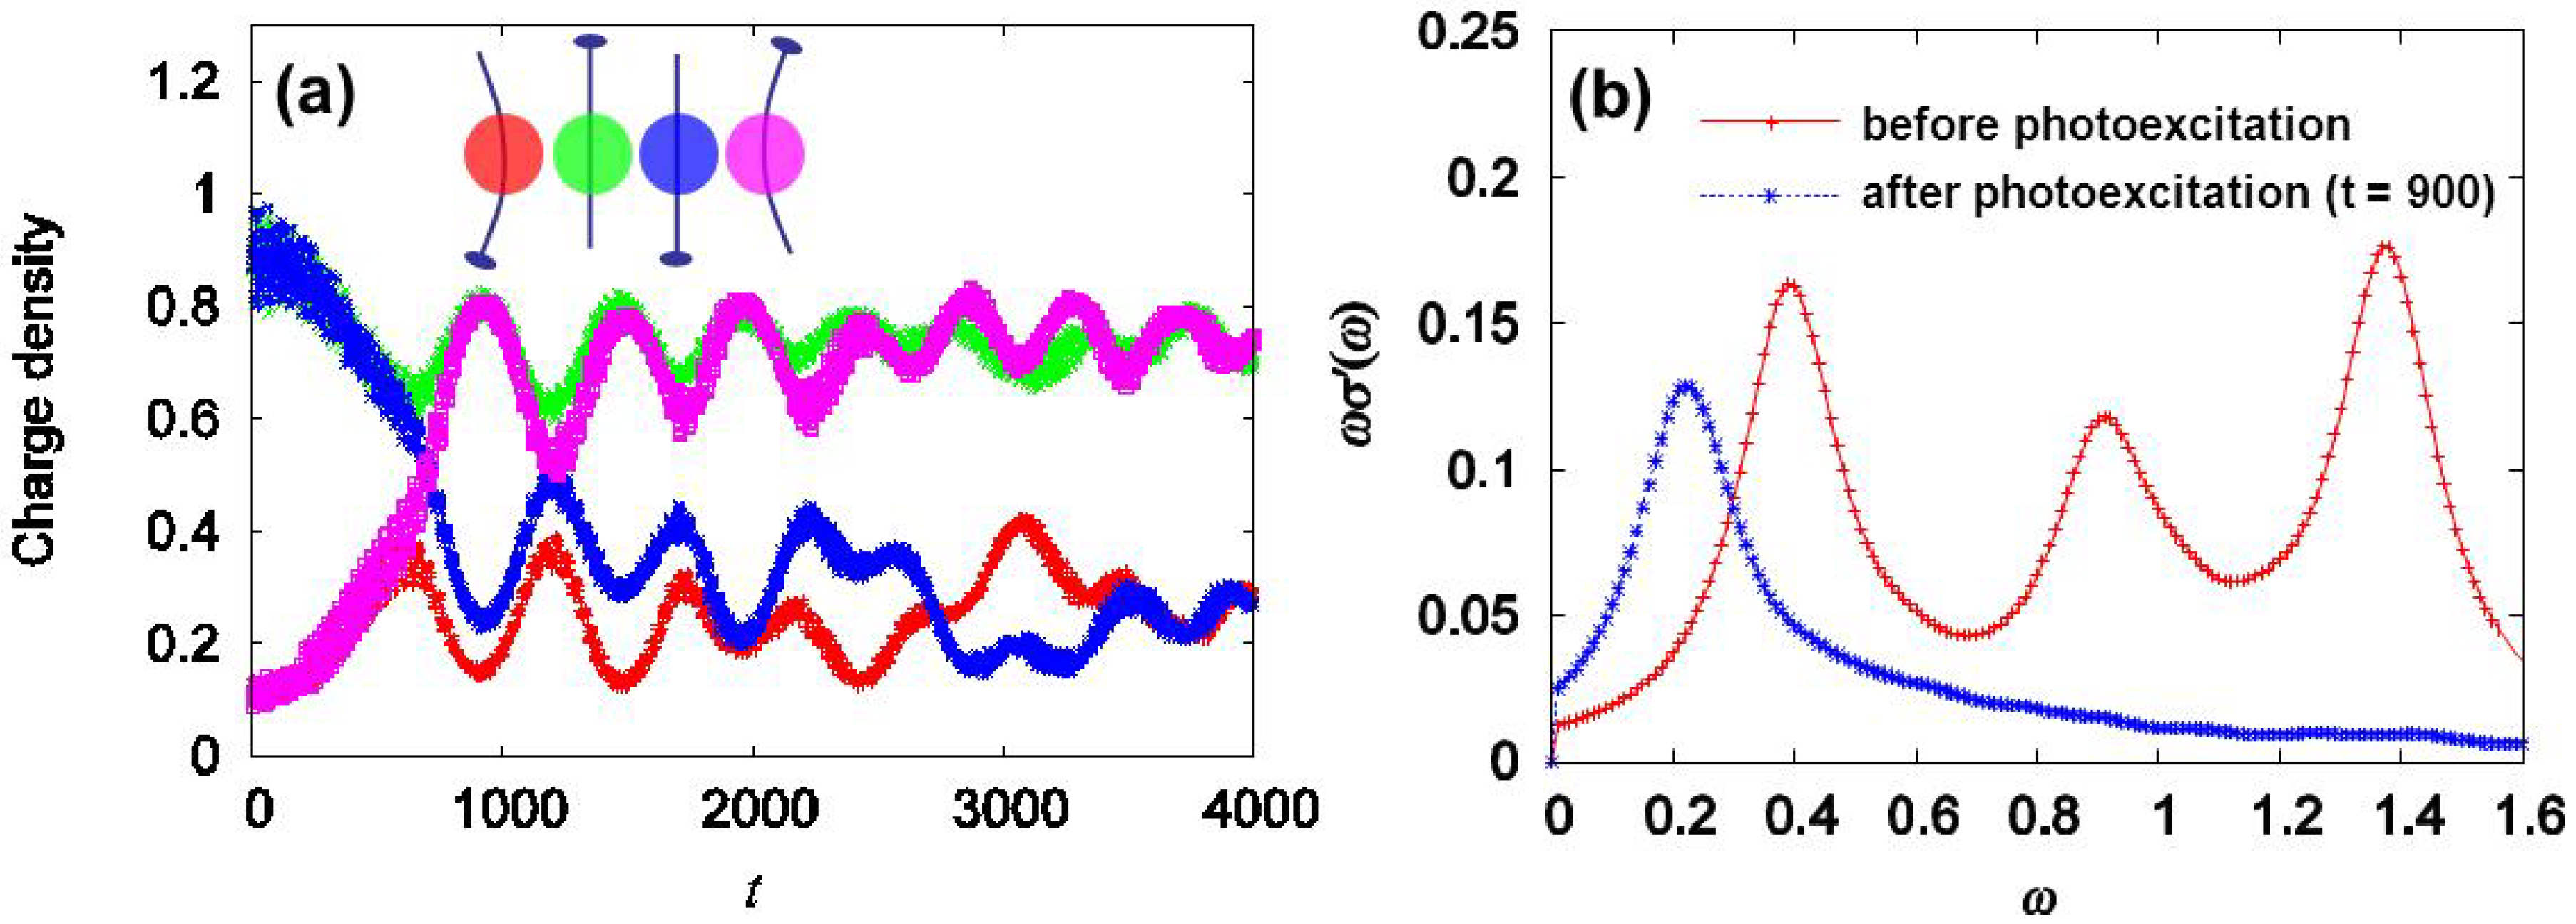
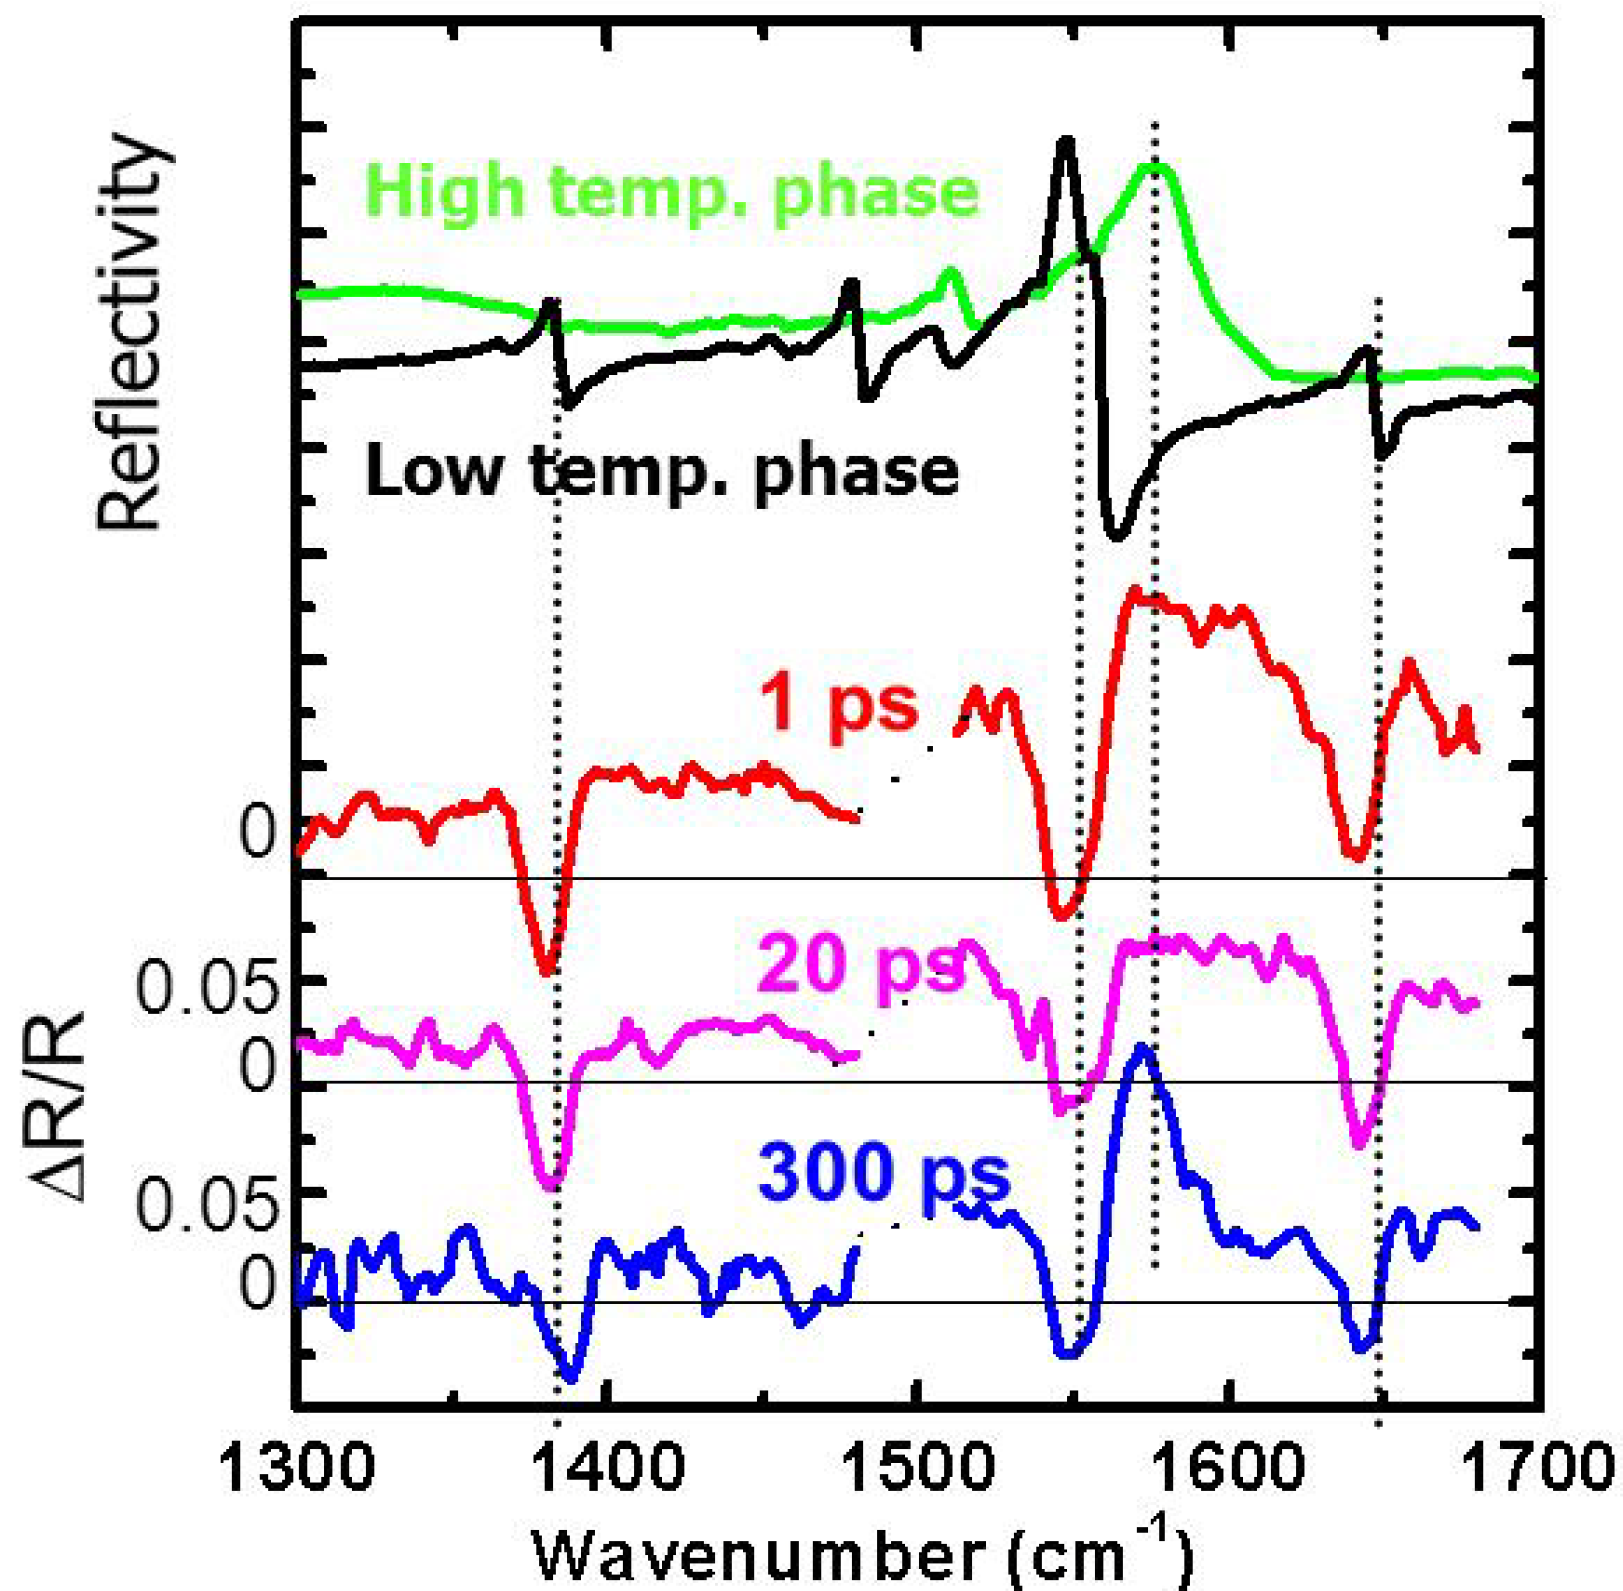
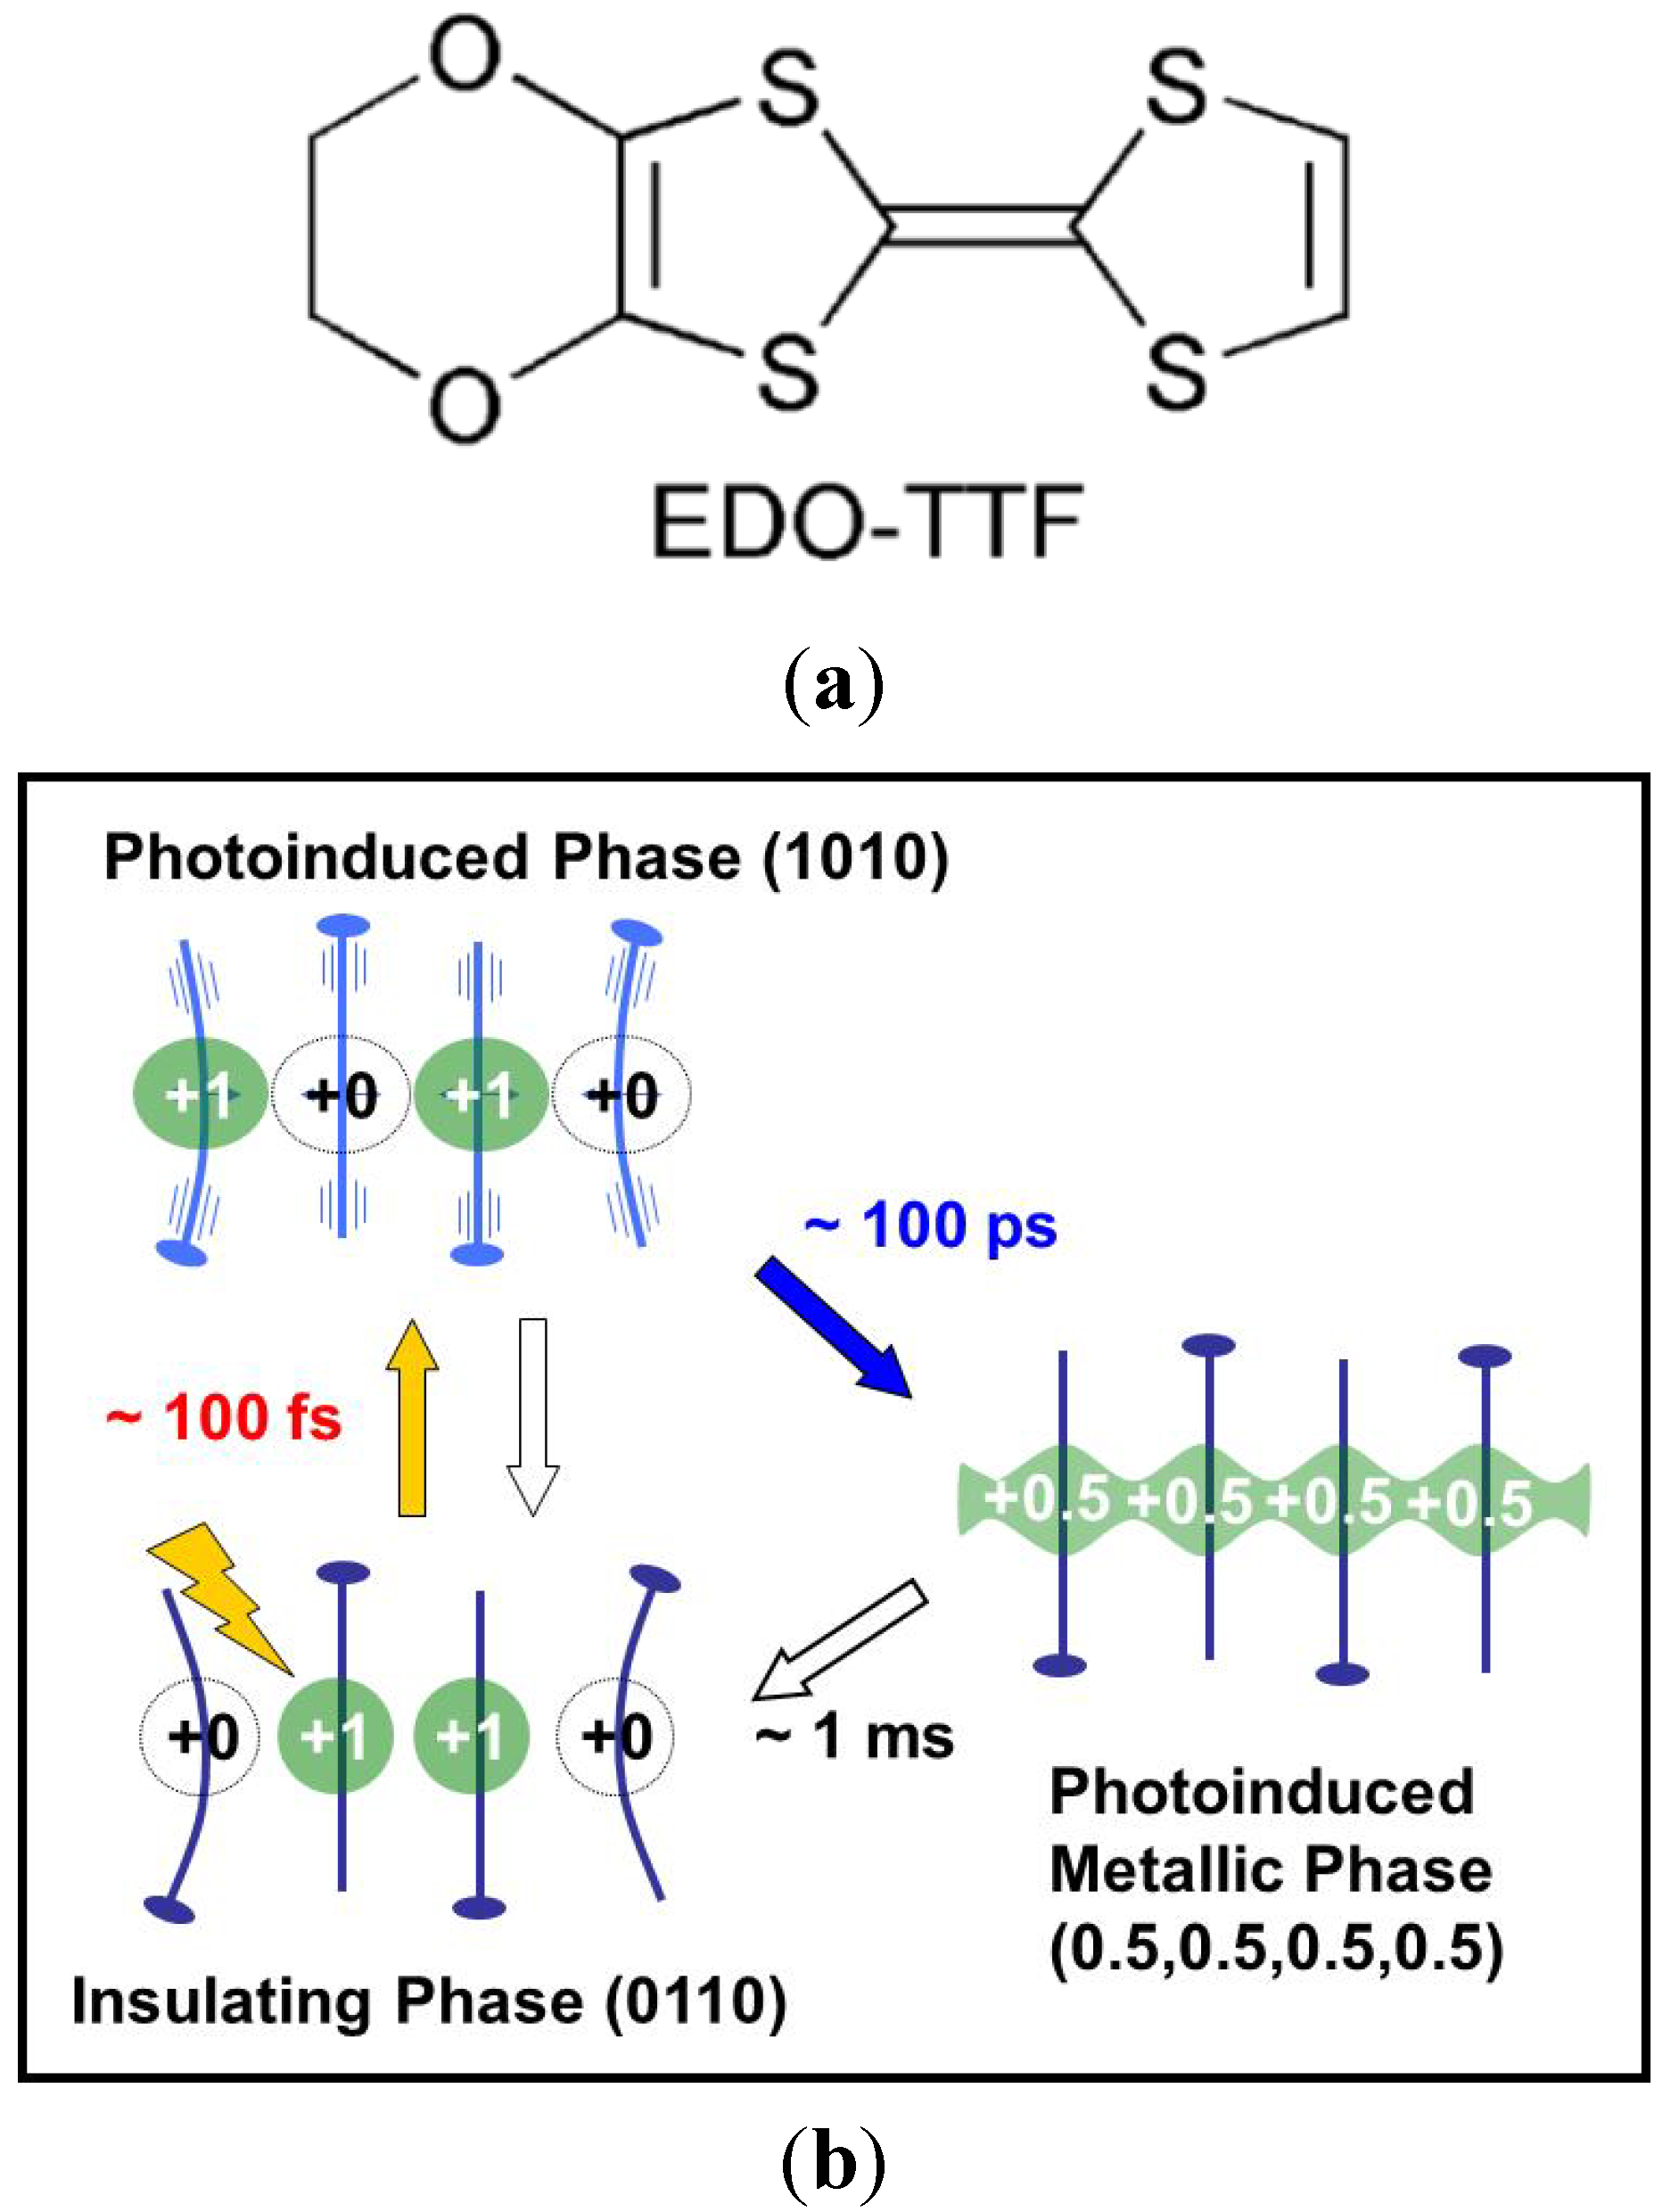
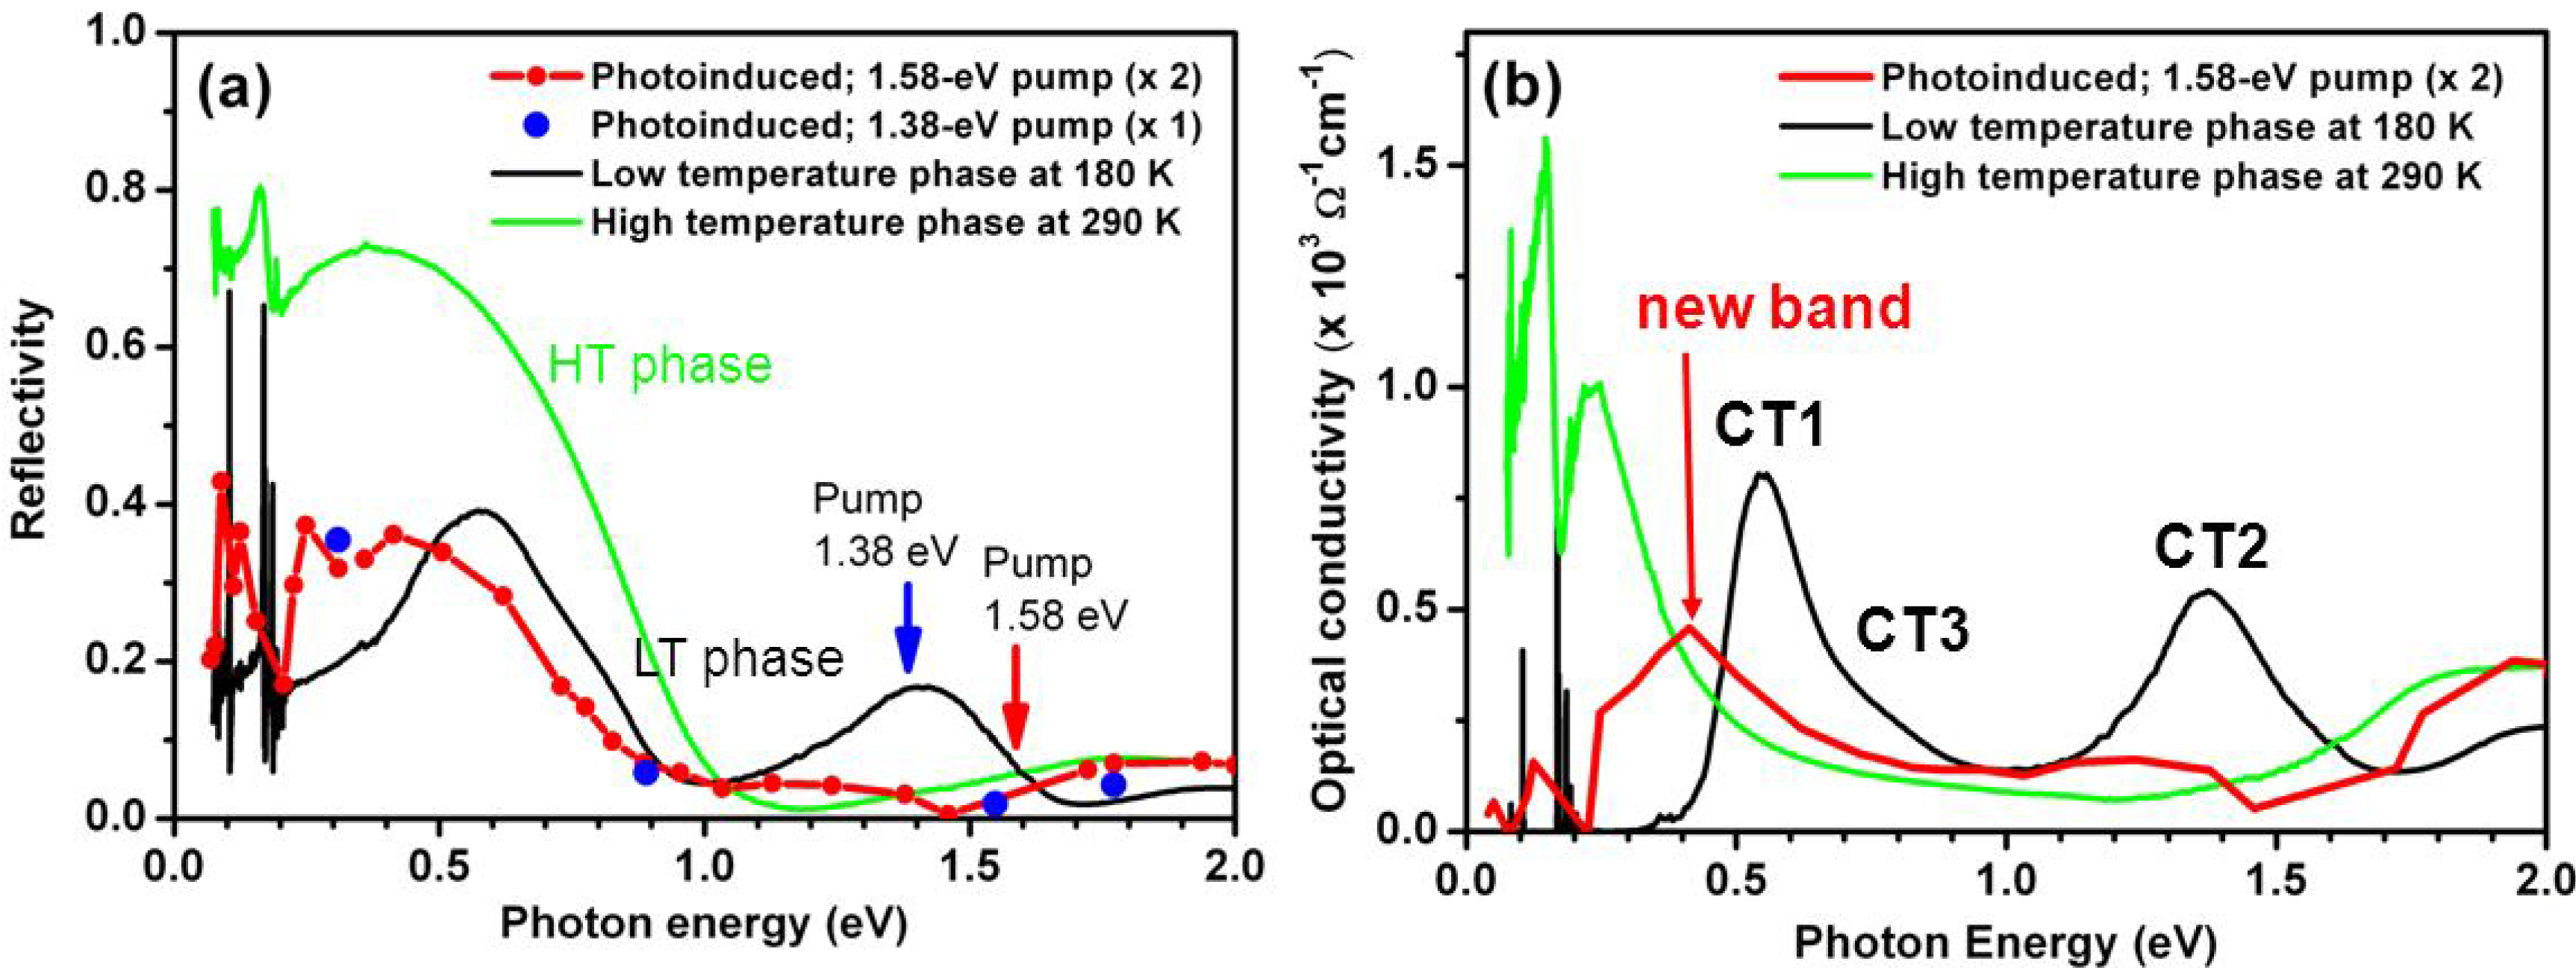
3.2. Photoinduced Phase Transition in Strong Electron-Lattice Interaction System: (EDO-TTF)2PF6

(EDO-TTF)2PF6 is a quasi-one-dimensional (1D) quarter-filled organic conductor at room temperature (RT) and undergoes metal to insulator phase transition at 280 K with decreasing temperature [27,38,39,40,41]. The molecular structure of EDO-TTF is shown in Figure 5a. Charge ordering, Peierls instability, and anion ordering have been proposed as the origin of this phase transition. Accompanied by phase transition, the EDO-TTF molecule’s large deformation was observed by X-ray structure analysis [27,38,41]; thus, this complex is regarded as a strong electron-phonon interaction system. We investigated the PIPT of this complex using various ultrafast spectroscopic techniques to clarify photoinduced dynamics under strong electron-lattice and electron-electron interactions. We found unique two-step PIPT after photoexcitation of the low-temperature (0110) insulating phase [16,29,42,43,44,45]. Note that the numbers in parentheses represent the charge order on an EDO-TTF molecule in a 1D column. First, the photoinduced original (1010) phase emerges at 100 fs after photoexcitation, and then part of the phase is converted into a high-temperature-like metallic phase over 100 ps. The PIPT process we obtained is schematically summarized in Figure 5b, where the sticks and small dots represent a side view of the EDO-TTF molecule and the numbers and large colored circles correspond to the charge and its spread on the EDO-TTF molecule.
Figure 5. (a) Molecular structure of EDO-TTF; (b) Schematic of two-step photoinduced phase transition in (EDO-TTF)2PF6.
Crystals 02 01067 g005
The first photoinduced (1010) phase was clarified by measuring the transient reflectivity spectra over a wide energy range and carrying out theoretical model calculations [29]. Figure 6a shows the transient reflectivity spectrum ranging from 69 meV to 2.1 eV at 100 fs after photoexcitation together with the static spectra in the high- and low-temperature phases. The photon energy of the pump pulse was 1.58 eV, where one of the CT bands was located, and the excitation photon density was 7 × 10²⁰ photons/cm3. The density of the EDO-TTF molecule estimated from the crystal parameters was 3 × 10²¹ molecules/cm3. Thus, these were approximately four EDO-TTF molecules per photon. This photon density heated up by roughly 100 K unless thermal diffusion took place. However, these values are not very reliable because they were calculated on the basis of the penetration depth of ~100 nm estimated by Kramers-Kronig (K-K) transformation of the static reflectivity spectrum.
Figure 6. (a) Static reflectivity spectra of (EDO-TTF)2PF6 in high-(green) and low-(black) temperature phases and transient reflectivity spectrum (red) at 0.1 ps after photoexcitation of CT band in low-temperature phase; (b) Optical conductivity spectra of (EDO-TTF)2PF6derived from reflectivity spectra using the Kramers-Kronig transformation [29]. Reproducedwith permission from Onda et al. [29]. Copyright (2008) by the American Physical Society.
Crystals 02 01067 g006
Figure 6b shows transient optical conductivity spectra derived from reflectivity spectra using K-K transformation. When we carried out K-K transformation we assumed that values less than data at the lowest photon energy would be constant whereas those larger than the data at the highest photon energy would be proportional to ω2, where ω is the angular frequency of photon energy. Thus, the estimated absolute values of optical conductivity are not reliable but the basic spectrum shapes that we discuss here are almost independent of these assumptions. There are three CT bands in the optical conductivity spectrum in the low-temperature phase, whereas there is only one band in the optical conductivity spectrum in the photoinduced phase. Because the three bands are assigned to charge transfers between adjacent EDO-TTF molecules in the (0110) charge order phase [39,40], the single band in the photoinduced phase must indicate the emergence of another type of charge order phase.
We carried out model calculations to assign the new phase. The spectrum in the low-temperature (0110) charge order phase was reproduced using the extended Hubbard model including Peierls- and Holstein-type electron-lattice interactions [29,46]. The time evolution of the charge order pattern shown in Figure 7a was obtained by solving the time-dependent Schrödinger equation by adding a time-dependent electric field as an excitation pulse. Note that “t” is the parameter representing delay time in the calculations. The (0110) charge order in this time evolution is converted to the (1010) charge order at approximately t = 600. The transient spectra were also calculated from the above equation and are presented in Figure 7b; we found that the (0110) and (1010) charge orders produce three CT bands in their spectra for the former and one CT band for the latter. Because this spectral change corresponds well with that induced by photoexcitation, we concluded that the photoinduced phase was the (1010) charge order phase. However, the photoinduced phase was not the same as the (1010) phase appearing in the thermal equilibrium of other materials because the range of the charge order was short, the lattice potential was fluctuating, and photo-carriers were present. The origin of the (1010) phase was strong electron–electron correlation; this idea is supported by our recent finding that the analogous CT complex, (DMEDO-EBDT)2PF6, which has weaker electron-electron correlation, does not exhibit the (1010) phase as a photoinduced phase from the low-temperature insulating phase [47].
Figure 7. (a) Dependencies of charge densities on time in tetramer of EDO-TTF based on model calculations. Each colored line represents change in each EDO-TTF molecule as illustrated in inset; (b) Calculated spectra before and after photoexcitation [29]. Reproduced with permission from Onda et al. [29]. Copyright (2008) by the American Physical Society.
Crystals 02 01067 g007
Because the photoinduced phase is in a quasi-stable state, we investigated the later process using time-resolved infrared vibrational spectroscopy to clarify how the state changed [16]. The transient electronic spectra in the near-infrared region revealed that while photoinduced reflectivity change decayed quickly, there were still some small spectral changes over 500 ps. However, the transient spectra in the later temporal region were so weak that the state could not be assigned from the spectra. Thus, we adopted time-resolved infrared vibrational spectroscopy, because the frequencies of the vibrational modes including the C=C double bond of the π-molecule in a CT complex change being sensitively reflected by the charge and structure of the molecules and also the lattice structure. We generated a narrowband picosecond infrared pulse using OPA and DFG from the output of a picosecond CPA (energy width = 3 cm−1 and pulse duration = 3 ps) to obtain a sufficiently high resolution to resolve the narrow molecular vibrational bands on the picosecond time scale.
Figure 8 shows the static reflectivity spectra in the high- and low-temperature phases, as well as the reflectivity change spectra in the C=C-stretching vibrational region at 1, 20, and 300 ps after photoexcitation of the same CT band as in the 100-fs experiment above. Each band in the static reflectivity spectra is assigned to the vibrational mode of the EDO-TTF molecule with a charge of 0 or +1 in the low-temperature insulating phase and a charge of 0.5 in the high-temperature metallic phase [39,40]. There was a reflectivity increase over the entire spectral region at 1 ps and three sharp bleach bands. Because the wavenumbers of the bleach band correspond to those of the bands in the low-temperature phase, the bleach bands indicate the disappearance of the ground state. In contrast, the broad reflectivity increases were attributed to the photoinduced (1010) phase according to previous results, and the charge fluctuation and/or photo-carriers cause the broad reflectivity to increase. Most of the reflectivity increase at 1 ps decreased at 20 ps, and no bands emerged. However, one narrow band emerged at 1572 cm−1 at 300 ps. Because the wavenumber of this band corresponded to that of the pronounced band in the spectrum in the high-temperature phase, the state at 300 ps must be close to the high-temperature metallic phase. This conclusion was confirmed from simulations by assuming that the mixing state of the high- and low-temperature phases was the photoinduced state at 300 ps and by using Fukazawa et al.’s optical parameters [16]. We determined from the simulation that the ratio of the photoinduced metallic phase to the low-temperature phase at 300 ps after photoexcitation was approximately 20% at the surface of the system.
Figure 8. Static reflectivity spectra of (EDO-TTF)2PF6 in low- and high-temperature phases and high-resolution reflectivity change spectra in C=C-stretching vibrational region [16].
Crystals 02 01067 g008
The reflectivity change at 1572 cm−1 was measured as a function of the delay time plotted in Figure 9 to investigate the temporal behavior of the photoinduced metallic phase. The reflectivity change quickly increases within the pulse duration and then decreases within a few picoseconds. The reflectivity change then begins to increase again over 200 ps. The temporal profile was analyzed using the three-level rate equation assuming a middle level in addition to the high and low levels representing the photoinduced (1010) and photoinduced metallic phases. The total fitting curve corresponds well with the experimental data, and we obtained an emergence time of approximately 94 ps for the photoinduced metallic phase. This slow emergence likely originates from the relaxation time of the lattice and molecular structures.
Figure 9. Temporal profiles of reflectivity change at 1572 cm−1 in (EDO-TTF)2PF6. Colored curves represent fitting curves using three-level model (see Fukazawa et al. [16] for details).
Crystals 02 01067 g009
The last research question regarding PIPT in (EDO-TTF)2PF6 is the manner in which the first photoinduced phase emerges from the photoexcited state. To answer this, we developed a 10-fs pump-probe measurement system [14,48,49] and we have been investigating the conversion process from the first excited state (Franck-Condon state) to the (1010) photoinduced phase.

4. Summary

We have reviewed our recent progress in the study of photoinduced phase transition (PIPT) in strongly electron–lattice- and electron–electron-correlated molecular conductor systems, including Pd(dmit)2 salt, (EDO-TTF)2PF6. These results showed that pump-probe time-resolved spectroscopy using pulsed lasers is a powerful tool for establishing the dynamics of photoinduced phase transition in charge transfer (CT) complexes with respect to the dynamics of electronic structural change. Measuring ultrafast time-dependent optical spectral change and its dependence on probe photon energy is the most important point in this type of study. The thermally hidden phase that was caused by strong electron-electron correlation was observed for the initial stage of PIPT in (EDO-TTF)2PF6. It was important to compare the experimental results with theoretical calculations to assign the thermally hidden phase. However, we learned that observations of electronic transition were not adequate to fully reveal PIPT in a CT complex because it only extracted indirect information regarding the charge and structure of constituent molecules. Here, we demonstrated that time-resolved vibrational spectroscopy can be a powerful tool to study them directly. Searching for PIPT in CT complexes with strong electron-electron and electron–lattice interactions is important to discover unique and useful PIPT phenomena.

Acknowledgments

The authors would like to thank R. Kato (RIKEN, Japan), M. Tamura (Tokyo Science University, Japan), and T. Yamamoto (Osaka University, Japan) for preparing the Et2Me2Sb[Pd(dmit)2]2 samples and for their helpful discussions. The authors also thank H. Yamochi, X.F. Shao, Y. Nakano, T. Hiramatsu (Kyoto University, Japan), and G. Saito (Meijo University, Japan) for preparing the (EDO-TTF)2PF6 samples and for their helpful discussions regarding the experimental results. The authors would also like to thank K. Yonemitsu (Institute of Molecular Science, Japan) and N. Maeshima (Tsukuba University, Japan) for their theoretical calculations for (EDO-TTF)2PF6 and their useful discussions. The authors would also like to thank Y. Okimoto (Tokyo Tech, Japan) for the helpful discussions.

Conflict of Interest

The authors declare no conflict of interest.

References

  1. Dagotto, E. Complexity in strongly correlated electronic systems. Science 2005, 309, 257–262. [Google Scholar] [CrossRef]
  2. Photoinduced Phase Transitions; Nasu, K. (Ed.) World Scientific Pub Co Inc: Singapore, 2004.
  3. Koshihara, S.; Adachi, S. Photo-Induced phase transition in an electron-lattice correlated system—Future role of a time-resolved X-ray measurement for materials science. J. Phys. Soc. Jpn. 2006, 75, 011005:1–011005:10. [Google Scholar]
  4. Koshihara, S.; Tokura, Y.; Mitani, T.; Saito, G.; Koda, T. Photoinduced valence instability in the organic molecular compound tetrathiafulvalene-p-chloranil (TTF-CA). Phys. Rev. 1990, 42, 6853–6856. [Google Scholar] [CrossRef]
  5. Suzuki, T.; Sakamaki, T.; Tanimura, K.; Koshihara, S.; Tokura, Y. Ionic-to-neutral phase transformation induced by photoexcitation of the charge-transfer band in tetrathiafulvalene-p-chloranil crystals. Phys. Rev. 1999, 60, 6191–6193. [Google Scholar] [CrossRef]
  6. Collet, E.; Lemée-Cailleau, M.-H.; Buron-Le Cointe, M.; Cailleau, H.; Wulff, M.; Luty, T.; Koshihara, S.-Y.; Meyer, M.; Toupet, L.; Rabiller, P.; et al. Laser-induced ferroelectric structural order in an organic charge-transfer crystal. Science 2003, 300, 612–615. [Google Scholar]
  7. Okamoto, H.; Ishige, Y.; Tanaka, S.; Kishida, H.; Iwai, S.; Tokura, Y. Photoinduced phase transition in tetrathiafulvalene-p-chloranil observed in femtosecond reflection spectroscopy. Phys. Rev. 2004, 70, 165202:1–165202:18. [Google Scholar]
  8. Matsubara, Y.; Okimoto, Y.; Yoshida, T.; Ishikawa, T.; Koshihara, S.; Onda, K. Photoinduced neutral-to-ionic phase transition in tetrathiafulvalene-p-chloranil studied by time-resolved vibrational spectroscopy. J. Phys. Soc. Jpn. 2011, 80, 124711:1–124711:5. [Google Scholar]
  9. Matsubara, Y.; Yoshida, T.; Ishikawa, T.; Okimoto, Y.; Koshihara, S.; Onda, K. Photoinduced ionic to neutral phase transition in TTF-CA studied by time-resolved infrared vibrational spectroscopy. Acta Phys. Pol. 2012, 121, 340–342. [Google Scholar]
  10. Koshihara, S.; Tokura, Y.; Iwasa, Y.; Koda, T. Inverse Peierls transition induced by photoexcitation in potassium tetracyanoquinodimethane crystals. Phys. Rev. 1991, 44, 431–434. [Google Scholar] [CrossRef]
  11. Tanimura, K.; Akimoto, I. Femtosecond time-resolved spectroscopy of photoinduced ionic-to-neutral phase transition in tetrathiafulvalen-p-chloranil crystals. J. Luminesc. 2001, 94–95, 483–488. [Google Scholar] [CrossRef]
  12. Iwai, S.; Tanaka, S.; Fujinuma, K.; Kishida, H.; Okamoto, H.; Tokura, Y. Ultrafast optical switching from an ionic to a neutral state in tetrathiafulvalene-p-chloranil (TTF-CA) observed in femtosecond reflection spectroscopy. Phys. Rev. Lett. 2002, 88, 057402:1–057402:4. [Google Scholar]
  13. Uemura, H.; Okamoto, H. Direct detection of the ultrafast response of charges and molecules in the photoinduced neutral-to-ionic transition of the organic tetrathiafulvalene-p-chloranil solid. Phys. Rev. Lett. 2010, 105. [Google Scholar]
  14. Itatani, J.; Rini, M.; Cavalleri, A.; Onda, K.; Ishikawa, T.; Koshihara, S.; Shao, X.; Yamochi, H.; Saito, G.; Shoenlein, R.W. Ultrafast Gigantic Photo-Response in (EDO-TTF)2PF6 Initiated by 10-fs Laser Pulses. In Ultrafast Phenomena XV; Corkum, P., Jonas, D.M., Miller, D.R., Weiner, A.M., Eds.; Springer-Verlag: Berlin, Germany, 2007; pp. 621–623. [Google Scholar]
  15. Kawakami, Y.; Iwai, S.; Fukatsu, T.; Miura, M.; Yoneyama, N.; Sasaki, T.; Kobayashi, N. Optical modulation of effective on-site coulomb energy for the mott transition in an organic dimer insulator. Phys. Rev. Lett. 2009, 103, 066403:1–066403:4. [Google Scholar]
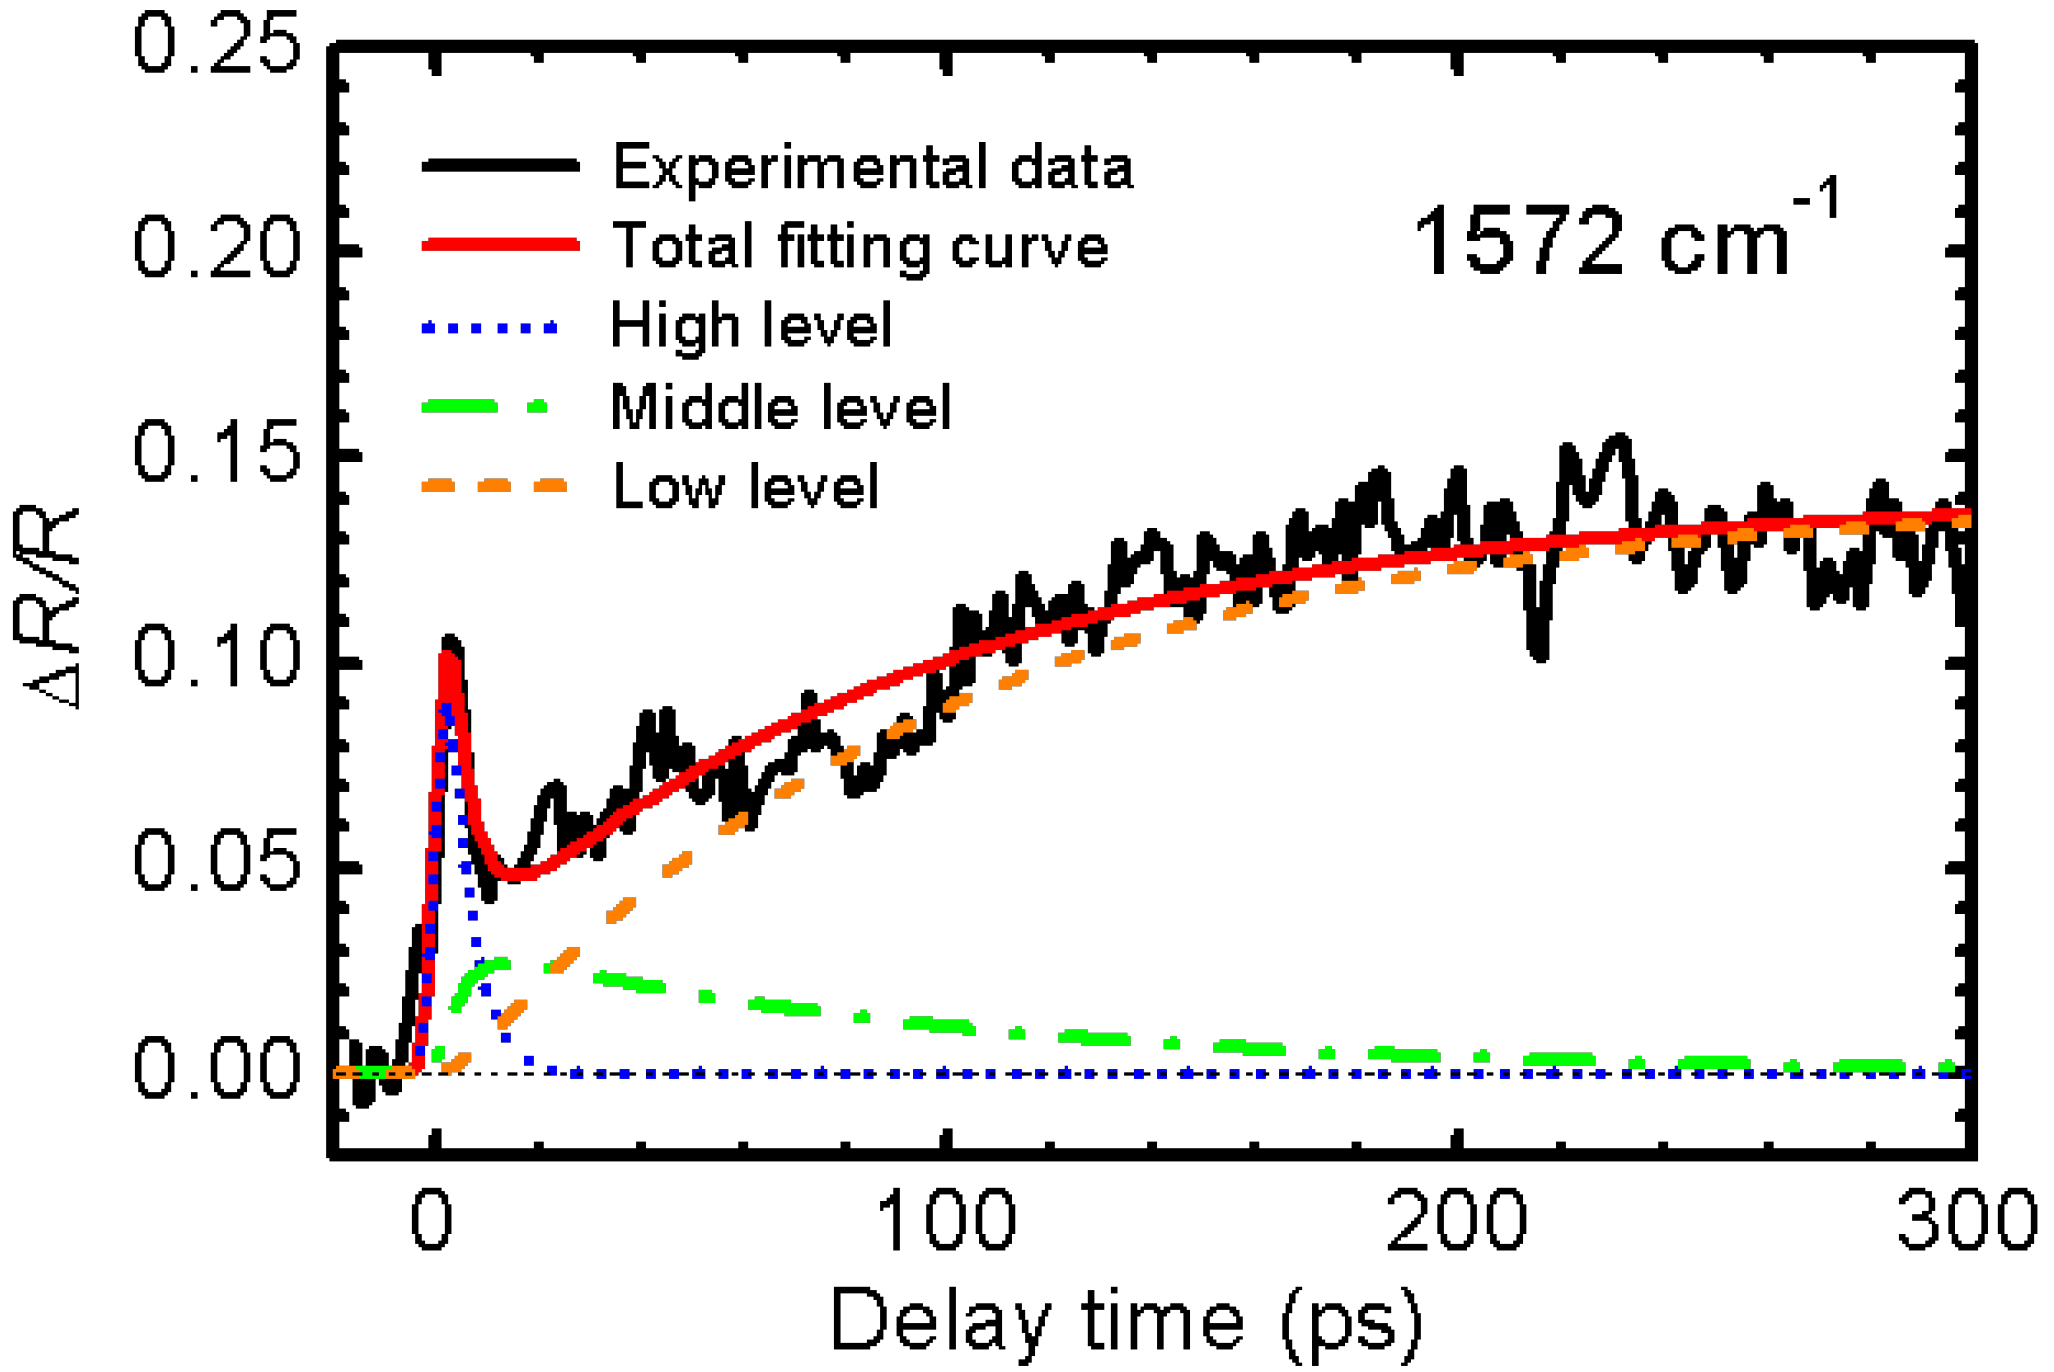
  16. Fukazawa, N.; Shimizu, M.; Ishikawa, T.; Okimoto, Y.; Koshihara, S.; Hiramatsu, T.; Nakano, Y.; Yamochi, H.; Saito, G.; Onda, K. Charge and structural dynamics in photoinduced phase transition of (edo-ttf)2pf6 examined by picosecond time-resolved vibrational spectroscopy. J. Phys. Chem. 2012, 116, 5892–5899. [Google Scholar]
  17. Demsar, J.; Podobnik, B.; Kabanov, V.; Wolf, T.; Mihailovic, D. Superconducting Gap Δc, the Pseudogap Δp, and Pair Fluctuations above Tc in Overdoped Y1-xCaxBa2Cu3O7-δ from Femtosecond Time-Domain Spectroscopy. Phys. Rev. Lett. 1999, 82, 4918–4921. [Google Scholar] [CrossRef]
  18. Gedik, N.; Yang, D.-S.; Logvenov, G.; Bozovic, I.; Zewail, A.H. Nonequilibrium phase transitions in cuprates observed by ultrafast electron crystallography. Science 2007, 316, 425–429. [Google Scholar]
  19. Tomeljak, A.; Schäfer, H.; Städter, D.; Beyer, M.; Biljakovic, K.; Demsar, J. Dynamics of photoinduced charge-density-wave to metal phase transition in K0.3MoO3. Phys. Rev. Lett. 2009, 102. [Google Scholar]
  20. Miyano, K.; Tanaka, T.; Tomioka, Y.; Tokura, Y. Photoinduced insulator-to-metal transition in a perovskite manganite. Phys. Rev. Lett. 1997, 78, 4257–4260. [Google Scholar]
  21. Cavalleri, A.; Tóth, C.; Siders, C.W.; Squier, J.A.; Ráksi, F.; Forget, P.; Kieffer, J.C. Femtosecond structural dynamics in Vo2 during an ultrafast solid-solid phase transition. Phys. Rev. Lett. 2001, 87, 237401:1–237401:4. [Google Scholar]
  22. Perfetti, L.; Loukakos, P.; Lisowski, M.; Bovensiepen, U.; Berger, H.; Biermann, S.; Cornaglia, P.; Georges, A.; Wolf, M. Time evolution of the electronic structure of 1T-TaS2 through the insulator-metal transition. Phys. Rev. Lett. 2006, 97, 067402:1–067402:4. [Google Scholar]
  23. Watanabe, S.; Kondo, R.; Kagoshima, S.; Shimano, R. Observation of ultrafast photoinduced closing and recovery of the spin-density-wave gap in (TMTSF)2PF6. Phys. Rev. 2009, 80, 220408(R):1–220408(R):4. [Google Scholar]
  24. Guérin, L.; Hébert, J.; Buron-Le Cointe, M.; Adachi, S.; Koshihara, S.; Cailleau, H.; Collet, E. Capturing one-dimensional precursors of a photoinduced transformation in a material. Phys. Rev. Lett. 2010, 105, 31–34. [Google Scholar]
  25. Sciaini, G.; Miller, R.J.D. Femtosecond electron diffraction: Heralding the era of atomically resolved dynamics. Rep. Prog. Phys. 2011, 74. [Google Scholar]
  26. Kato, R. Conducting metal dithiolene complexes: Structural and electronic properties. Chem. Rev. 2004, 104, 5319–5346. [Google Scholar] [CrossRef]
  27. Ota, A.; Yamochi, H.; Saito, G. A novel metal-insulator phase transition observed in (EDO-TTF)2PF6. J. Mater. Chem. 2002, 12, 2600–2602. [Google Scholar]
  28. Ishikawa, T.; Fukazawa, N.; Matsubara, Y.; Nakajima, R.; Onda, K.; Okimoto, Y.; Koshihara, S.; Lorenc, M.; Collet, E.; Tamura, M.; et al. Large and ultrafast photoinduced reflectivity change in the charge separated phase of Et2Me2Sb[Pd(1,3-dithiol-2-thione-4,5-dithiolate)2]2. Phys. Rev. 2009, 80, 115108:316–115108:318. [Google Scholar]
  29. Onda, K.; Ogihara, S.; Yonemitsu, K.; Maeshima, N.; Ishikawa, T.; Okimoto, Y.; Shao, X.; Nakano, Y.; Yamochi, H.; Saito, G.; et al. Photoinduced change in the charge order pattern in the quarter-filled organic conductor (EDO-TTF)2PF6 with a strong electron-phonon interaction. Phys. Rev. Lett. 2008, 101, 067403:1–067403:4. [Google Scholar]
  30. Tamura, M.; Takenaka, K.; Takagi, H.; Sugai, S.; Tajima, A.; Kato, R. Spectroscopic evidence for the low-temperature charge-separated state of [Pd(dmit)2] salts. Chem. Phys. Lett. 2005, 411, 133–137. [Google Scholar] [CrossRef]
  31. Nakao, A.; Kato, R. Structural study of low temperature charge-separated phases of Pd(dmit)2-based molecular conductors. J. Phys. Soc. Jpn. 2005, 74, 2754–2763. [Google Scholar] [CrossRef]
  32. Tamura, M.; Kato, R. Variety of valence bond states formed of frustrated spins on triangular lattices based on a two-level system Pd(dmit)2. Sci. Technol. Adv. Mater. 2009, 10. [Google Scholar] [CrossRef]
  33. Iwai, S.; Yamamoto, K.; Kashiwazaki, A.; Hiramatsu, F.; Nakaya, H.; Kawakami, Y.; Yakushi, K.; Okamoto, H.; Mori, H.; Nishio, Y. Photoinduced melting of a stripe-type charge-order and metallic domain formation in a layered BEDT-TTF-Based organic salt. Phys. Rev. Lett. 2007, 98. [Google Scholar] [CrossRef]
  34. Fukazawa, N.; Tanaka, T.; Ishikawa, T.; Okimoto, Y.; Koshihara, S.; Yamamoto, T.; Tamura, M.; Kato, R.; Onda, K. Photoinduced Phase Transition of the Pd(dmit)2 Salts Having Different Order of Phase Transition Examined by Time-Resolved Vibrational Spectroscopy. 2012. in preparation. [Google Scholar]
  35. Underhill, A.E.; Clark, R.A.; Marsden, I.; Allan, M.; Friend, R.H.; Tajima, H.; Naito, T.; Tamura, M.; Kuroda, H.; Kobayashi, A.; Kobayashi, H.; et al. Structural and electronic properties of Cs[Pd(dmit)2]2. J. Phys. Condens. Matter 1991, 3, 933–954. [Google Scholar]
  36. Tajima, H.; Naito, T.; Tamura, M.; Kobayashi, A.; Kuroda, H.; Kato, R.; Kobayashi, H.; Clark, R.A.; Underhill, A.E. Energy level inversion in strongly dimerized [Pd(dmit)2] salts. Solid State Commun. 1991, 79, 337–341. [Google Scholar] [CrossRef]
  37. Ishikawa, T.; Tanaka, T.; Fukazawa, N.; Matsubara, Y.; Okimoto, Y.; Onda, K.; Koshihara, S.; Tamura, M.; Kato, R. Slow dynamics of the photoinduced phase transition in Pd(dmit)2 salts. Acta Phys. Pol. 2012, 121, 316–318. [Google Scholar]
  38. Ota, A.; Yamochi, H.; Saito, G. A novel metal-insulator transition in (EDO-TTF)2X (X = PF6, AsF6). Synth. Met. 2003, 133–134, 463–465. [Google Scholar] [CrossRef]
  39. Drozdova, O.; Yakushi, K.; Ota, A.; Yamochi, H.; Saito, G. Spectroscopic study of the [0110] charge ordering in (EDO-TTF)2PF6. Synth. Met. 2003, 133–134, 277–279. [Google Scholar] [CrossRef]
  40. Drozdova, O.; Yakushi, K.; Yamamoto, K.; Ota, A.; Yamochi, H.; Saito, G.; Tashiro, H.; Tanner, D. Optical characterization of 2kF bond-charge-density wave in quasi-one-dimensional 3/4-filled (EDO-TTF)2X (X = PF6 and AsF6). Phys. Rev. 2004, 70, 075107:1–075107:21. [Google Scholar]
  41. Aoyagi, S.; Kato, K.; Ota, A.; Yamochi, H.; Saito, G.; Suematsu, H.; Sakata, M.; Takata, M. Direct observation of bonding and charge ordering in (EDO-TTF)2PF6. Angew. Chem. Int. Ed. 2004, 43, 3670–3673. [Google Scholar]
  42. Chollet, M.; Guerin, L.; Uchida, N.; Fukaya, S.; Shimoda, H.; Ishikawa, T.; Matsuda, K.; Hasegawa, T.; Ota, A.; Yamochi, H.; et al. Gigantic photoresponse in 1/4-filled-band organic salt (EDO-TTF)2PF6. Science 2005, 307, 86–89. [Google Scholar]
  43. Onda, K.; Ishikawa, T.; Chollet, M.; Shao, X.; Yamochi, H.; Saito, G.; Koshihara, S. Ultrafast infrared spectroscopic study of the photo-induced phase transition in (EDO-TTF)2PF6. J. Phys. Conf. Ser. 2005, 21, 216–220. [Google Scholar] [CrossRef]
  44. Onda, K.; Ogihara, S.; Ishikawa, T.; Okimoto, Y.; Shao, X.; Nakano, Y.; Yamochi, H.; Saito, G.; Koshihara, S. Anomalous photo-induced response by double-pulse excitation in the organic conductor (EDO-TTF)2PF6. J. Phys. Conf. Ser. 2009, 148. [Google Scholar] [CrossRef]
  45. Onda, K.; Shimizu, M.; Sakaguchi, F.; Ogihara, S.; Ishikawa, T.; Okimoto, Y.; Koshihara, S.; Shao, X.F.; Nakano, Y.; Yamochi, H.; et al. Ultrafast and large reflectivity change by ultraviolet excitation of the metallic phase in the organic conductor (EDO-TTF)2PF6. Physica 2010, 405, S350–S352. [Google Scholar] [CrossRef]
  46. Yonemitsu, K.; Maeshima, N. Photoinduced melting of charge order in a quarter-filled electron system coupled with different types of phonons. Phys. Rev. 2007, 76. [Google Scholar] [CrossRef]
  47. Ishikawa, T.; Kitayama, M.; Chono, A.; Onda, K.; Okimoto, Y.; Koshihara, S.; Nakano, Y.; Yamochi, H.; Morikawa, T.; Shirahata, T.; et al. Probing the metal-insulator phase transition in the (DMEDO-EBDT)2PF6 single crystal by optical measurements. J. Phys. Condens. Matter 2012, 24, 195501. [Google Scholar] [CrossRef]
  48. Itatani, J.; Rini, M.; Cavalleri, A.; Onda, K.; Ishikawa, T.; Ogihara, S.; Koshihara, S.; Shao, X.F.; Nakano, Y.; Yamochi, H.; et al. Ultrafast Gigantic Photo-Response in Charge-Ordered Organic Salt (EDO-TTF)2PF6 on 10-fs time scales. In Ultrafast Phenomena XVI; Corkum, P., Silvestri, S.D., Nelson, K.A., Riedle, E., Schoenlein, R.W., Eds.; Springer-Verlag: Berlin, Germany, 2009; Volume 92, pp. 185–187. [Google Scholar]
  49. Onda, K.; Ogihara, S.; Itatani, J.; Ishikawa, T.; Okimoto, Y.; Koshihara, S.; Shao, X.; Nakano, Y.; Hideki, Y.; Saito, G. Photoinduced Dynamics of a Quasi-1-D Organic Conductor over a Range from 10 fs to 100 ps. In Ultrafast Phenomena XVII; Chergu, M., Jonas, D.M., Riedle, E., Schoenlein, R.W., Taylor, A.J., Eds.; Oxford University Press: New York, NY, USA, 2011; pp. 188–190. [Google Scholar]

