1. Introduction
Two-chain quasi-one-dimensional conductors in the series Per
2[M(mnt)
2] (Per = perylene; M = Au, Pt, Pd, Co,
etc.) have long been studied due to the unique nature of their parallel, interacting chain structure [
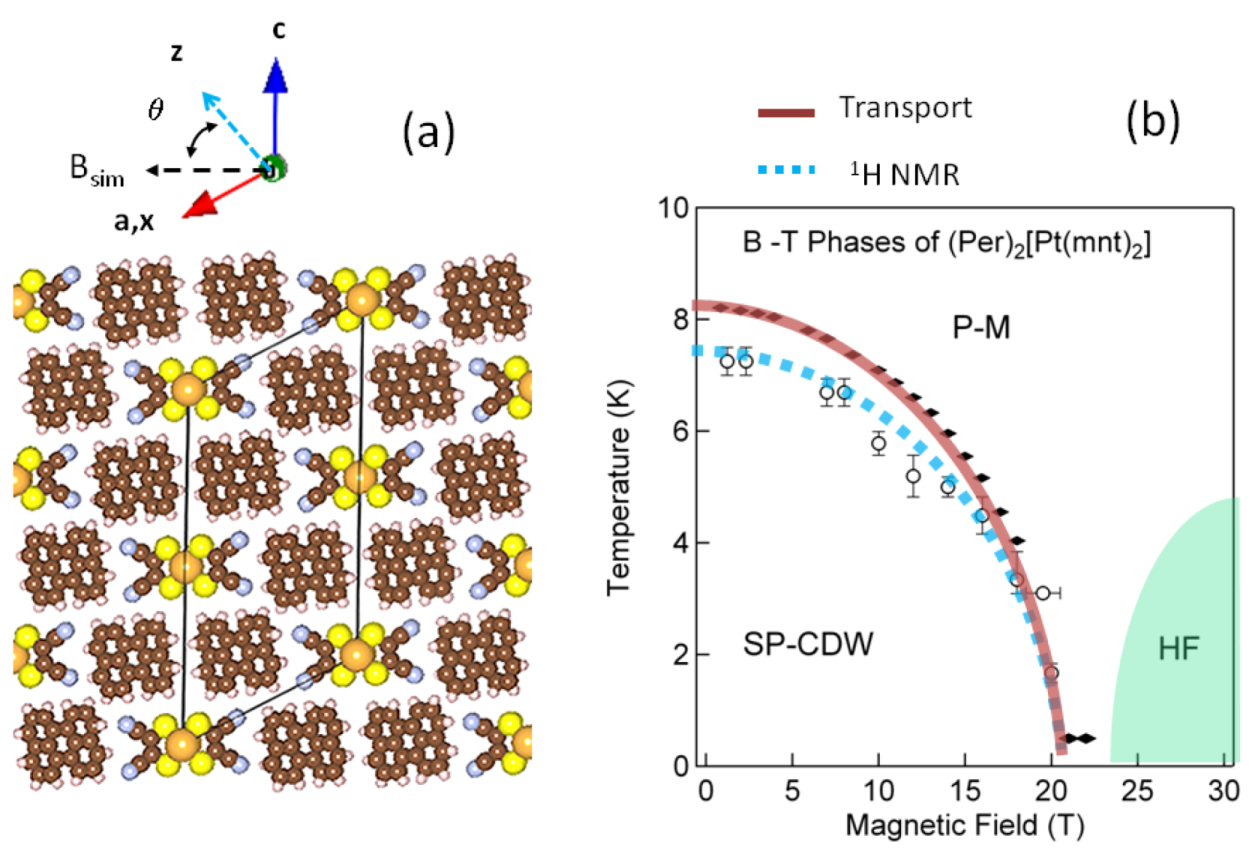
1]. Here stacks of planar perylene donors with pi-overlapped orbitals yield a highly one dimensional, electrically conducting chain in parallel with stacks of [M(mnt)
2] acceptors (
Figure 1a). The former exhibits a Peierls (CDW-charge density wave) transition at low temperatures, and the latter exhibits spin-Peierls (SP) transition in the case where there is a localized d-electron spin on the [M(mnt)
2] site for M = Pt, Pd,
etc. A remarkable feature of the compounds with spin on the [M(mnt)
2] site is that these two transitions appear to be nearly, or even exactly coincident at a temperature T
c, giving rise to the still open question of how the order parameters couple, and which one drives the other [
2,
3].
Figure 1.
(
a) View of Per
2[Pt(mnt)
2] crystal structure along the stacking b-axis. In the
xyz crystallographic coordinate system
x//
a and
y//
b.
Bsim refers to the high-symmetry field direction (θ = 67°) used in the
1H spectra simulations. The unit cell connects the centers of the Pt sites on the [Pt(mnt)
2]
− anion. The closest Pt-proton distance is 4.808 Å and the closest Pt-Pt distance is 4.125 Å (along the b-axis); (
b) Schematic B-T phase diagram of Per
2[Pt(mnt)
2] showing the spin-Peierls (SP), charge density wave (CDW), P-M (paramagnetic-metallic), and HF (high field) phase boundaries derived from the onset of splitting of NMR spectra (open symbols) and metal-insulator transitions from electrical transport measurements (solid symbols) for a field applied along the a-axis direction. (See References [
4,
5] for detailed discussion).
The subject of the present work is the compound Per
2[Pt(mnt)
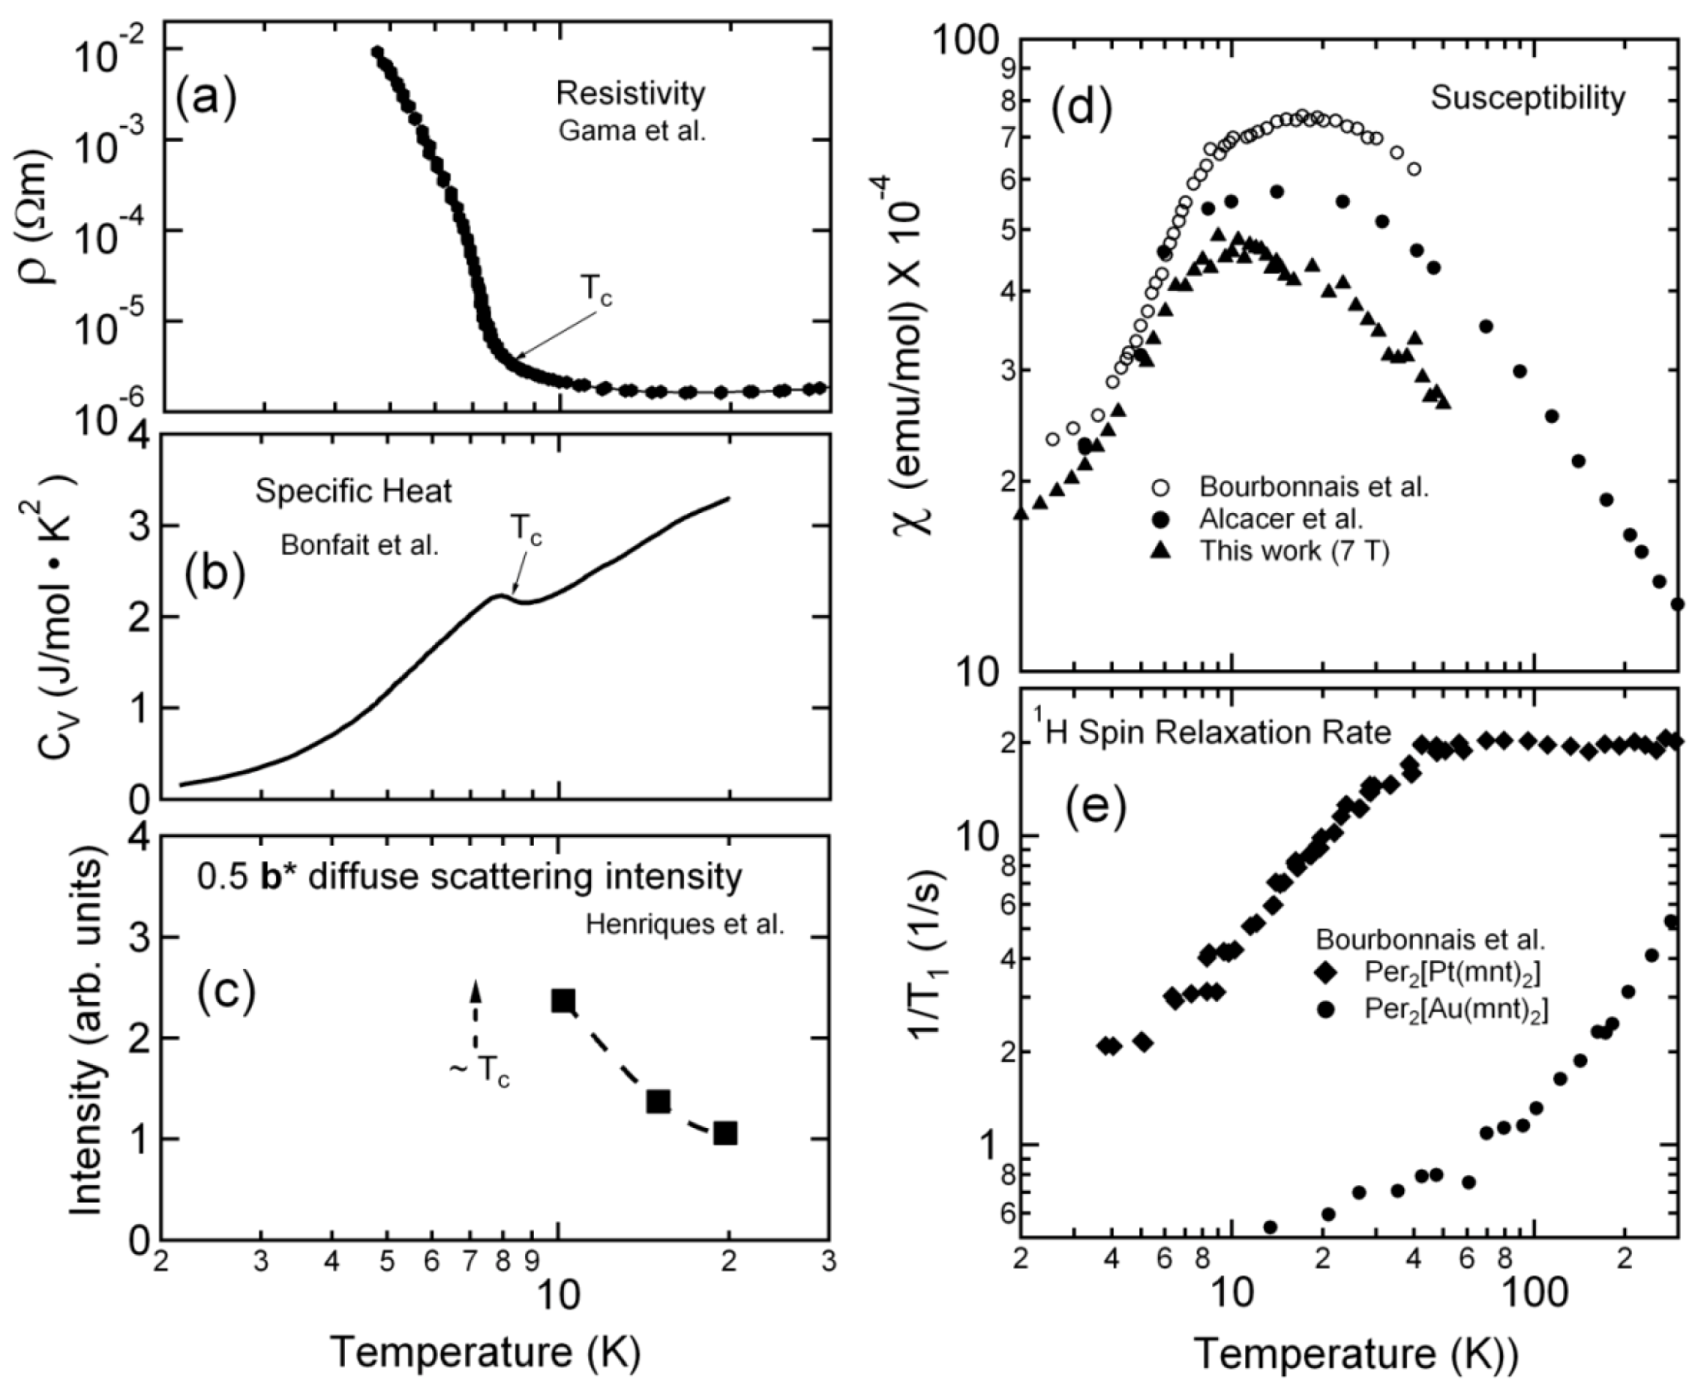
2] with a localized spin ½ on the Pt site, with the emphasis on using NMR to probe the behavior of the spin chain in the paramagnetic and SP phases. An overview select physical properties of Per
2[Pt(mnt)
2] are shown in
Figure 2. Specific heat [
6], electron spin resonance [
2], and electrical transport [
7,
8] indicate a common transition in the range T
c ~ 6 to 8 K, and diffuse X-ray studies [
9], although not below 10 K, indicate the onset of dimerization in the [Pt(mnt)
2] chains. (In compounds such as M = Pd with a higher transition temperature, X-ray measurements clearly show tetramerization in the perylene chains and dimerization in the [Pd(mnt)
2] chains at T
c [
9], and internal consistency among the different measurements and compounds Per
2[M(mnt)
2] indicate this should also be the case for Per
2[Pt(mnt)
2]). The periodicities of the CDW and SP chains, q
Per = π/2b and q
Pt = π/b, are approximately commensurate with b, the lattice constant along the chains.
Figure 2.
Selected temperature dependent physical properties of Per
2[Pt(mnt)
2]. (
a) Resistivity in vicinity of metal-insulator transition T
c (data from Reference [
10]); (
b) Specific heat showing a jump at magnetic transition due to Pt spins (data from Reference [
6]); (
c) X-ray scattering showing onset of the diffuse 0.5 b* peak approaching T
c (data from Reference [
11]); (
d) Magnetic Susceptibility from three different studies (data from Reference [
2,
12] and this work); (
e) Comparison of
1H spin relaxation rates for M = Pt and M = Au materials (data from Reference [
2]).
In recent years there have been extensive studies of electrical transport in Per
2[Pt(mnt)
2] in magnetic fields where the resistance of the sample yields information about how the CDW ground state changes with field and temperature [
7], and B-T phase diagrams have been produced that show the CDW is suppressed at high magnetic fields (~20 T at 1 K), but a new type of insulating state appears at higher fields [
4,
13]. Since similar studies of the spin-zero isostructural compound Per
2[Au(mnt)
2] show that significantly larger fields (~30 T at 1 K) are necessary to suppress the conventional CDW ground state [
14], one can reasonably ask what role the spin −½ chain plays in altering the B-T phase diagram, and if and how the spin and conducting chain order parameters couple. Since electrical transport is not directly sensitive to the magnetic structure in the [Pt(mnt)
2] chains, proton (
1H) and platinum (
195Pt) nuclear magnetic resonance (NMR) over a broad range of temperature and magnetic field has been employed to try to elucidate these questions.
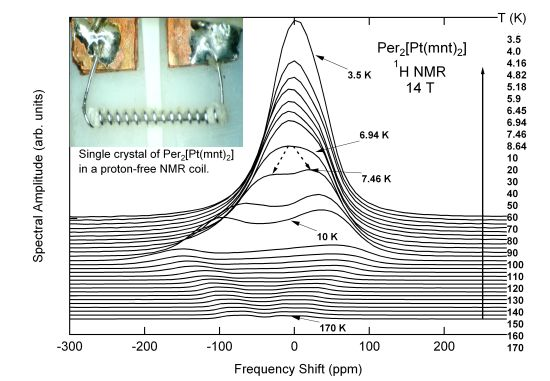
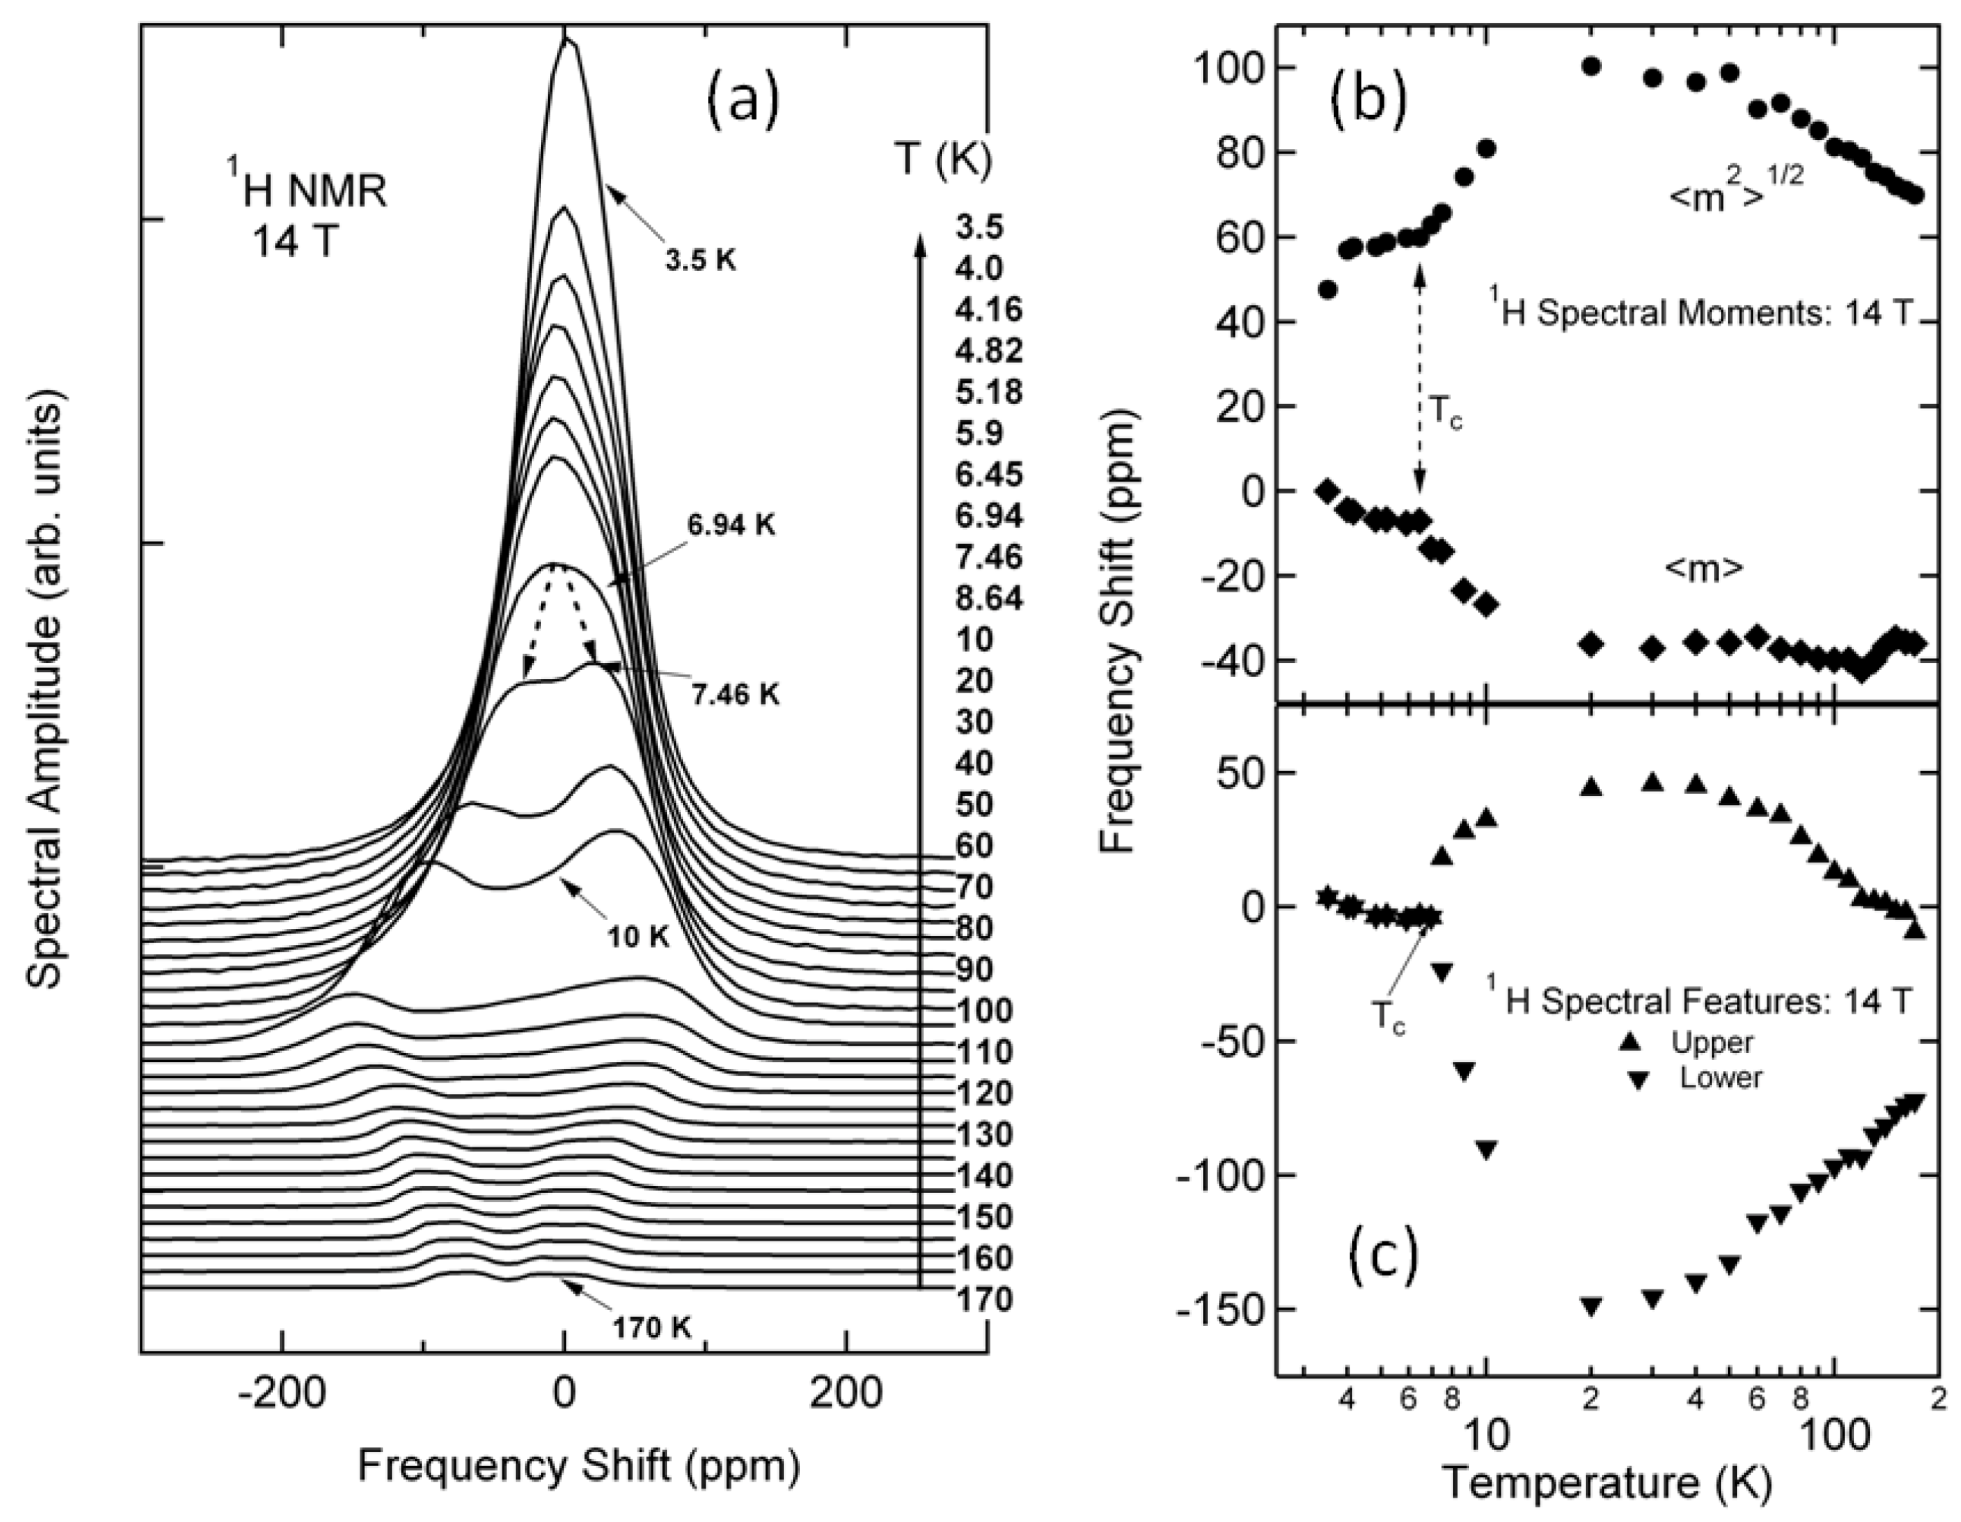
In this Review, we first survey the relevant results of previous NMR studies. We next present results of
1H NMR spectra which provide important information about B-T phase boundaries, and the behavior of the spin chains in the paramagnetic and spin-Peierls states. One important result is the observation that the CDW and SP order parameters remain coupled up to the critical field (~20 T) at low temperatures (see also [
5]). Simulations of the spectra are described that yield a consistent picture of the angular, temperature, and magnetic field-dependent spectral features in terms of an effective dipole moment that is temperature and magnetic field-dependent. The
1H spin-relaxation data are then presented. These results show evidence for a minority concentration of unpaired spins in the spin-Peierls state, the effects of which are suppressed with increasing field. We next present the results of
195Pt NMR which is only measurable within the SP-CDW phase boundary. Unlike the
1H NMR, in this case the
195Pt nuclear spin of interest is on the same site as the d-electron spin, and this has a dramatic effect on the spectra and the relaxation rates. Finally, we put our results in the context of the problems of competing order parameters, and make conclusions and suggestions for future work. Additional details of the
195Pt and
1H studies are given in the Theses of Lumata [
15] and Green [
16] respectively.
2. Background
The primary thrust of the work reported here concerns NMR (both spectra and spin-relaxation) on single crystal Per
2[Pt(mnt)
2] with a focus on the high magnetic field (2 to 33 T) dependence of the SP-CDW phases at low temperatures, and also on the spectra over broad range of temperature above the SP-CDW ground state. Earlier however, a milestone in the understanding of the magnetic properties of the Per
2[Pt(mnt)
2] system in the higher temperature paramagnetic phase is the work of Bourbonnais
et al. [
2] which addressed the temperature dependence of the
1H spin relaxation rate 1/T
1 at 0.855 T from room temperature to ~ 4.2 K in a powdered sample. This group also measured 1/T
1 in the zero-spin anion analogue Per
2[Au(mnt)
2], and combined with results of the magnetic susceptibility (χ) and electron spin resonance (ESR) data, affirmed the following:
(1) The susceptibility is Curie-Weiss like at higher temperatures (T > 20 K) in the paramagnetic state. The parameters are k
BT
SP0 ~ Θ ~ J/k
B ~ Δk
B ~ 20 K. From a Curie-Weiss law fit to χ(T), the effective number of Bohr magnetons
p = g[J(J + 1)]
1/2 is about 1.87 [
17], (close to the value
p = 1.73 for g = 2, and J = ½). Since a dimerization driven solely by a one-chain spin-lattice effect has the criterion k
BT
SP0 << J, the fact that T
c ~ 8 K (
i.e., is so high) is anomalous, and the origin of the SP state is not clear. Hence the proximity of the CDW order parameter may “aid” the formation of the SP state, as discussed below.
(2) In the paramagnetic state, the
1H spin-relaxation rate in Per
2[Pt(mnt)
2] is dominated by the transverse dipolar coupling between the Pt spins and the proton sites, and follows the relationship 1/T
1~Tχ(T) down to about 20 K (see also
Section 4). Therefore at high temperatures in the Curie limit where χ(T) = C/T, 1/T
1 is independent of temperature. The conclusion was that, in comparison with Per
2[Au(mnt)
2], the
1H signal is primarily affected by the Pt spins. This opens the door to using
1H NMR to monitor the spin configuration of the SP state in the [Pt(mnt)
2] chain
vs. field and temperature, even though the protons sit at the periphery of the perylene molecule, at distances of 4.8 Å or more from the Pt sites. As we will see later, the situation for NMR on the
195Pt sites is very different.
Recently, we reported [
5] the correspondence of the
1H NMR spectra and spin-relaxation rates to the B-T phase diagram of Per
2[Pt(mnt)
2] below 10 K in fields up to 26 T. The key results of this study were that the NMR spectral line shapes underwent fundamental changes passing from the low temperature—low magnetic field singlet SP-CDW insulating ground state to the high temperature paramagnetic, metallic phase, and/or into the high magnetic field phase. By monitoring the field and temperature where the characteristic, narrow line seen in the spin singlet state started to evolve into the broader, multiple peaked spectrum characteristic of the paramagnetic state, an estimate of the SP phase boundary could be determined, and compared with previous determinations based on electrical transport. The conclusions of this work were that the formation of the CDW state is necessary to induce the SP transition, which otherwise would not form, and that the two order parameters remain coupled at least until the low temperature critical field of B
c ~ 20 T is reached (
Figure 1b).
4. Magnetic Field and Temperature Dependent 1H Spin-Relaxation Rates 1/T1
The nuclear spin relaxation rate 1/T
1 yields information complementary to the spectra. In
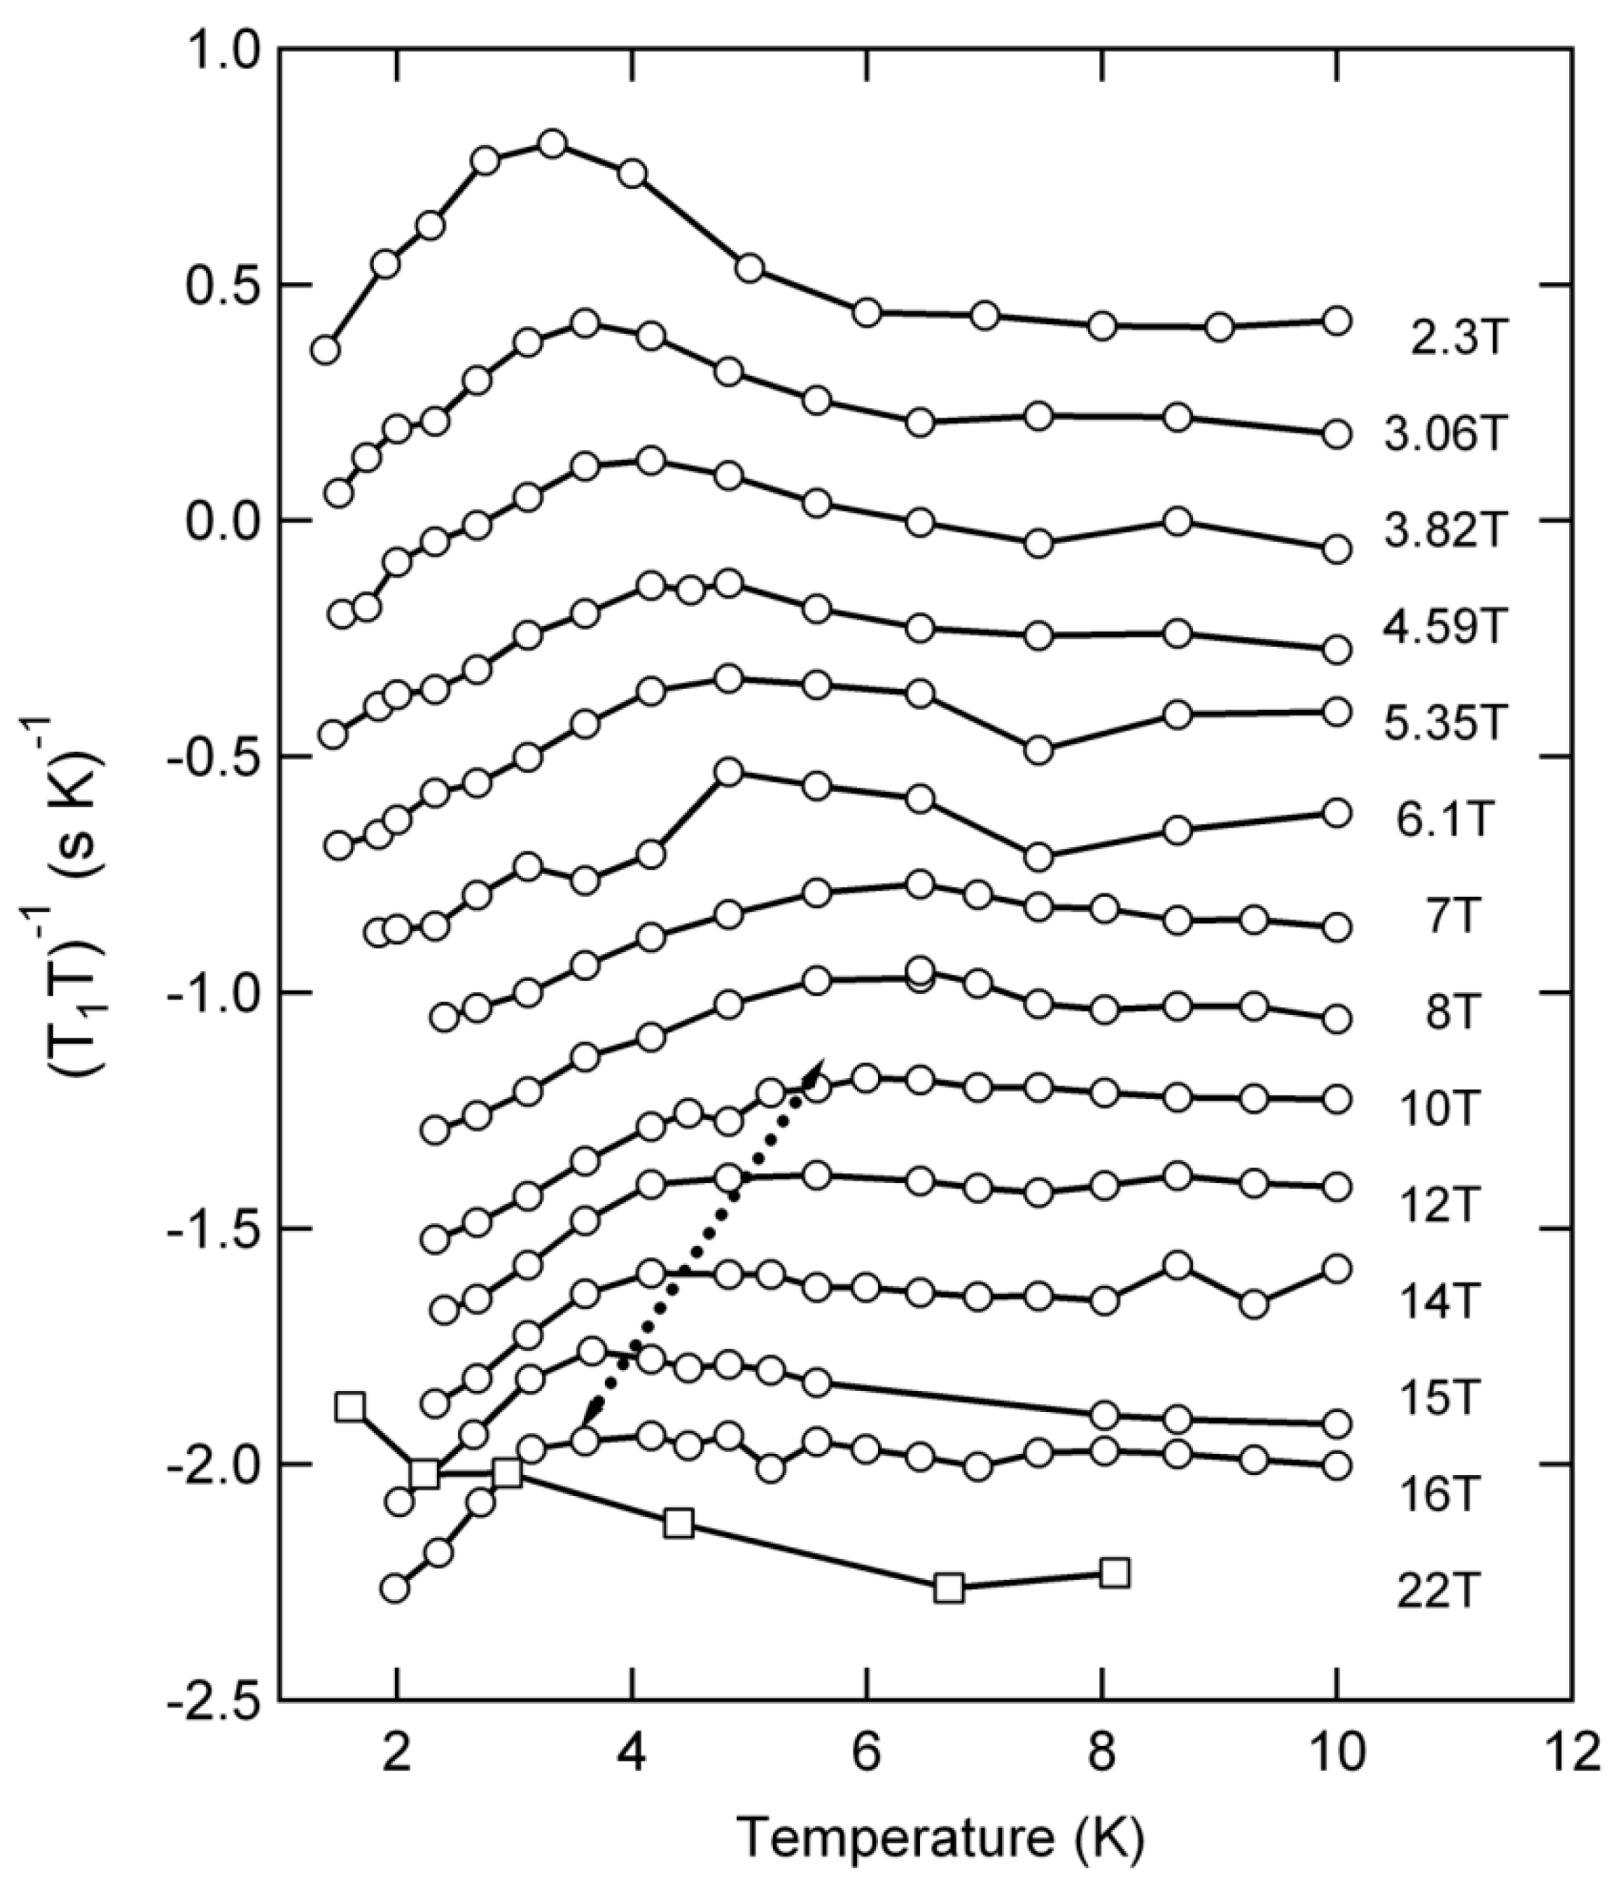
Figure 8 the spin relaxation rate
vs. temperature for increasing magnetic field is shown in terms of the Korringa relationship for a metal 1/T
1T = constant, giving a convenient point of reference for the temperature dependence of the relaxation data.
Figure 8.
Summary of temperature and field dependent spin-relaxation rates of Per2[Pt(mnt)2] in terms of 1/T1T. Data at 2.3 T is not offset, but subsequent curves are incrementally offset by −0.2 (s K)−1 for increasing magnetic field. The dashed line refers to “dog-leg” feature in the relaxation data that appears above 10 T.
We note that over the narrow range of temperature above T
c where the data extend, one cannot discriminate between 1/T
1 ~ Tχ(T), the Korringa relationship, or other possible dependences of 1/T
1 on temperature (see also inset of
Figure 9a and discussion below). The data in
Figure 8 show some unusual features. First is the rise in 1/T
1T at or below the temperature T
c. This rise eventually is suppressed above 10 T. This feature is not apparent in, for instance, the case of CuGeO
4 where for NQR measurements, 1/T
1 drops monotonically with temperature, and shows a “dog-leg” type feature at the undimerized to dimerized (U-D) phase boundary [
18]. (However, in magnetic field, NMR does show some deviation from the NQR data in the CuGeO
4 transition region.) The correspondence between the field dependent data in
Figure 8 and the B-T phase boundary is not as clear as it is for the spectral line shape changes, due in part to the anomalous rise in 1/T
1 at lower fields below T
c. Above 10 T however, the anomalous rise is suppressed, and the SP phase transition is more apparent where a “dog-leg” feature (dashed line) moves to lower temperature with increasing field. Second, at lower temperatures the slope of 1/T
1T drops monotonically in temperature for all fields below the critical field of 20 T. However, the slope in the low temperature limit is not monotonic in field, and reaches a minimum in the range 7 to 10 T. Above the critical field, in the high field phase region, the behavior of 1/T
1T shown for 22 T is clearly very different.
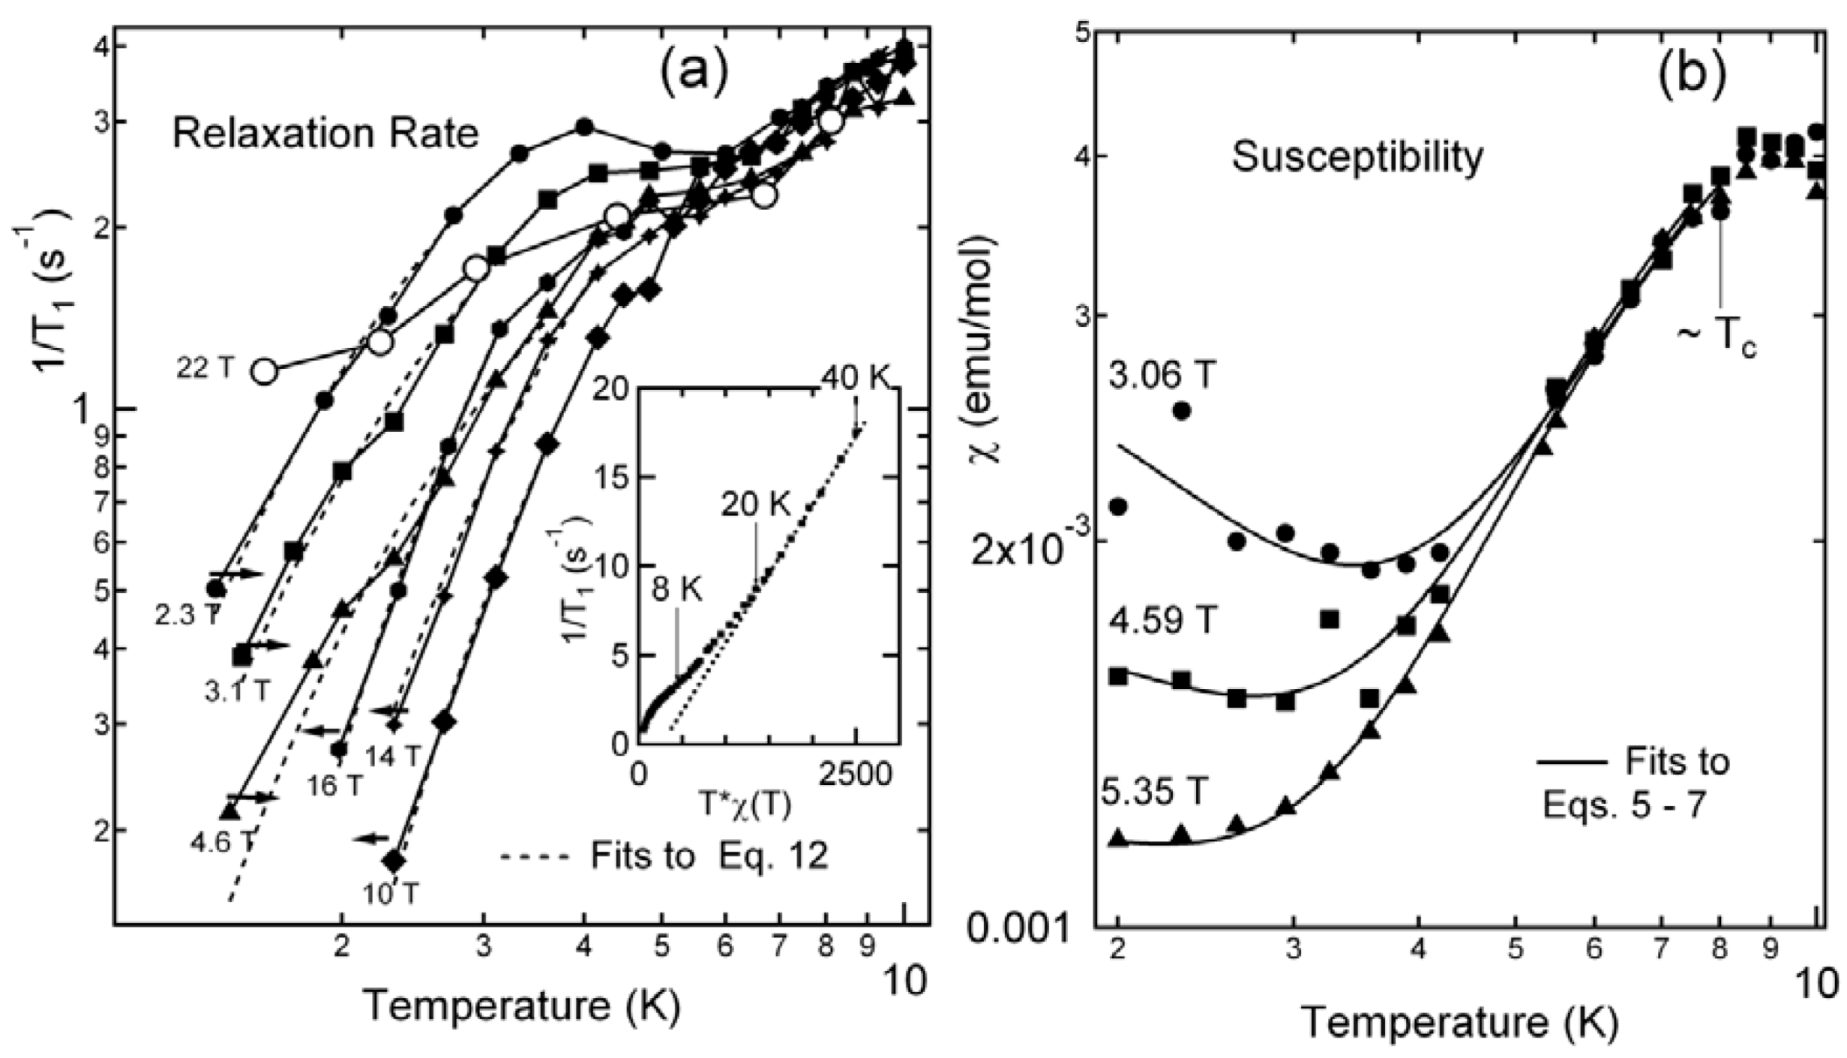
Figure 9.
(
a) Temperature dependence of 1/T
1 for Per
2[Pt(mnt)
2] at different magnetic fields. Arrows refer to direction of curves for increasing magnetic field. Inset: test of relationship 1/T
1 ~ T*χ(T) showing deviation below 20 K (dashed line). Inset data is from Reference [
2]; (
b) Susceptibility
vs. temperature for selected magnetic fields.
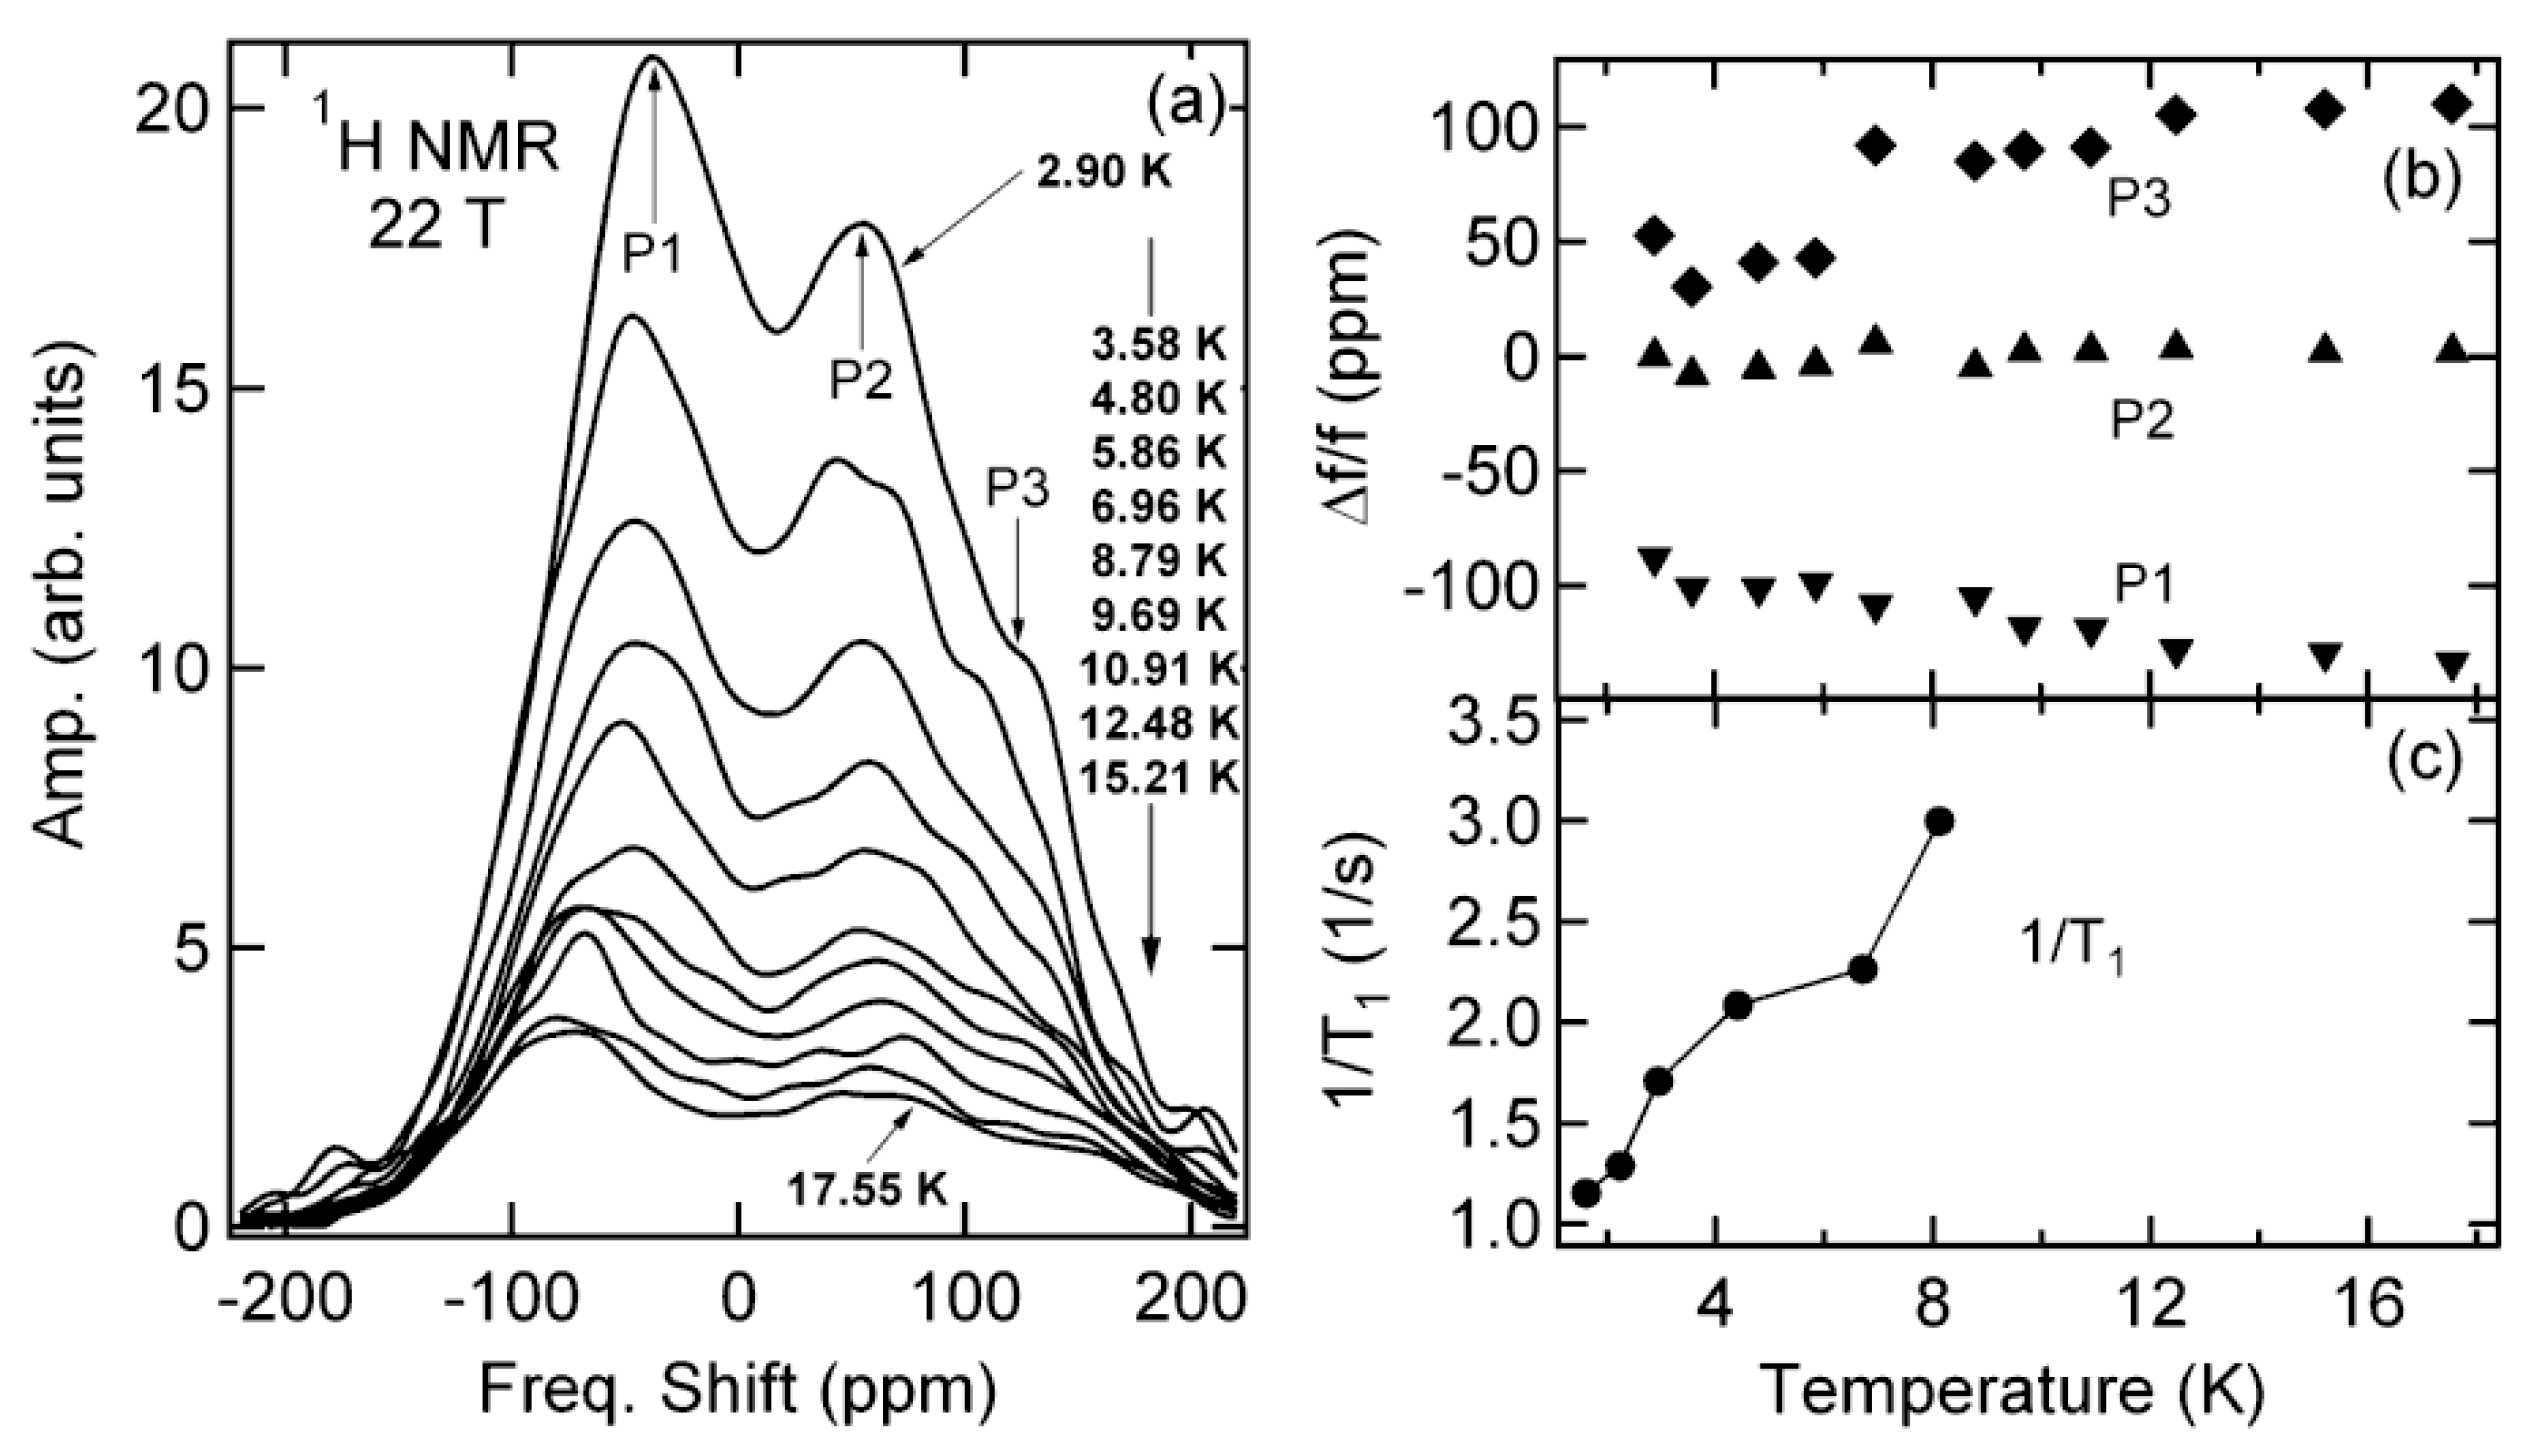
The non-monotonic field dependence of the low temperature 1/T
1 data is best examined by plotting 1/T
1 directly against T (
Figure 9a), where, for comparison, we also juxtapose susceptibility data at available corresponding magnetic fields (
Figure 9b).
For a given temperature below 3 K, 1/T1 decreases with increasing field up to 10 T, but above 10 T it begins to increase. Correspondingly, in the susceptibility data we note that in addition to the drop in χ(T) due to the onset of the SP gap, there is a “Curie tail” at low temperatures which diminishes with increasing field. These results indicate the presence of two opposite, field-dependent mechanisms that manifest themselves in χ and 1/T1. The field dependent paramagnetic susceptibility for a spin −½ system is described by the Brillouin function, where for J = ½ simplifies to
χp(T) = (NpµB/B) tanh(x) (5)
(See Kittel [
20]: here N
p is the number of paramagnetic spins and x = µ
BB/k
BT and
p = g(J(J + 1) is implicit). The Curie tail may be ascribed to a population (N
p) of unpaired spins. The so called “impurities” Curie tail corresponding up to about 3% of the total spin population has been always found in different Per
2[Pt(mnt)
2] samples to a larger or smaller extent. This tail is common in 1D spin chain systems (e.g., [
21,
22]) and it believed to correspond to defects (missing molecules) or staking defaults of any kind, rather than impurities. In the present case it is the anions [Pt(mnt)
2] which remain unpaired. This has been confirmed by EPR [
23] which shows in single crystals that this tail corresponds to a signal with g-values typical of [Pt(mnt)
2]
−. Following Bourbonnais
et al. [
2] the contribution to the susceptibility from the Pt spins (N
SP) involved in the dimerization will be only from those spins excited across the effective spin-Peierls gap Δ. Treating these spins also as a paramagnetic contribution as in Equation (5) leads to the following expression for χ
sp(T) below T
SP-CDW:
χsp(T) = (NSPµB/B) tanh(x)exp(− Δ/kBT) (6)
Therefore, the total susceptibility below TSP-CDW may be written as:
χ(T) = χsp(T) + χp(T) (7)
The data in
Figure 9b below T
c ~ 7 K were fitted accordingly to Equations (5–7) and yielded the following fitting parameters, namely N
sp/N ~ 97.5% and N
p/N ~ 2.5% (where N = N
sp + N
p), and Δ/k
B = 18.3 ± 1.1, 17.2 ± 0.71, and 15.9 ± 0.34 K for magnetic fields 3.06, 4.59, and 5.35 T respectively.
We next turn attention to the temperature and field-dependent spin relaxation data in
Figure 9a, where below 3 K 1/T
1 is thermally activated. We note that the relationship 1/T
1 ~ Tχ(T) is not valid below about 20 K as shown in the
Figure 9a inset. In the mean field description, and supported by previous transport studies [
7], the effective spin Peierls gap follows the general relationship:
Δ(B) = Δ(0)*(1 − (B/Bc)2) (8)
where Bc is the upper critical field; and Δ(0) is the gap for B = 0. (Δ(B) is also temperature dependent near the phase boundary, but we have neglected this in the present analysis which focuses on the data in the low temperature limit) Following a simple model for the relaxation rate of the spin-Peierls system 1/T1SP in terms of an activated behavior with energy Δ(B) we would expect the relationship:
1/T1SP = Г exp(−Δ(B)/kBT) (9)
where Г is an intrinsic inverse lifetime [
18]. Since the slopes of 1/T
1 vs. T below 3 K are activated, and proportional to an effective energy gap, the fact that they are not monotonic in field implies the interplay of two, field dependent energy gaps that influence 1/T
1. Indeed, only above 10 T does Equation (9) appear to be operative. Recalling the implied presence of unpaired spins from the low temperature, field dependent Curie tail, we may further add to the total relaxation rate a paramagnetic term:
1/T1P = П exp(−pµBB/kBT) (10)
Here П represents the inverse lifetime of the paramagnetic background, and in this case the Zeeman energy pµBB, where p is an effective Bohr magneton number, plays the role of the energy gap. Hence the total relaxation rate is:
1/T1 = 1/T1P + 1/T1SP (11)
By inspection, it is evident that Equation (10) will dominate the behavior of 1/T1 when the Zeeman energy (i.e., field) is low, and that as the Zeeman energy increases with field, eventually the mean field SP gap which decreases with field will determine 1/T1 (Equation (9)). We found that a fit of Equation (11) to the data is difficult, since the parameters Г and П have, in addition to the Zeeman and SP gap, some field and temperature dependence. To obtain a general description of 1/T1, we have used the effective expression:
1/T1 = W exp(−Δeff/kBT) (12)
where W is an effective inverse lifetime to derive an effective activation energy Δeff over the entire field range below Bc by fitting the 1/T1 data. We note that Δeff ~ pµBB/kB in the low field limit, and Δeff ~ Δ(B) in the high field limit.
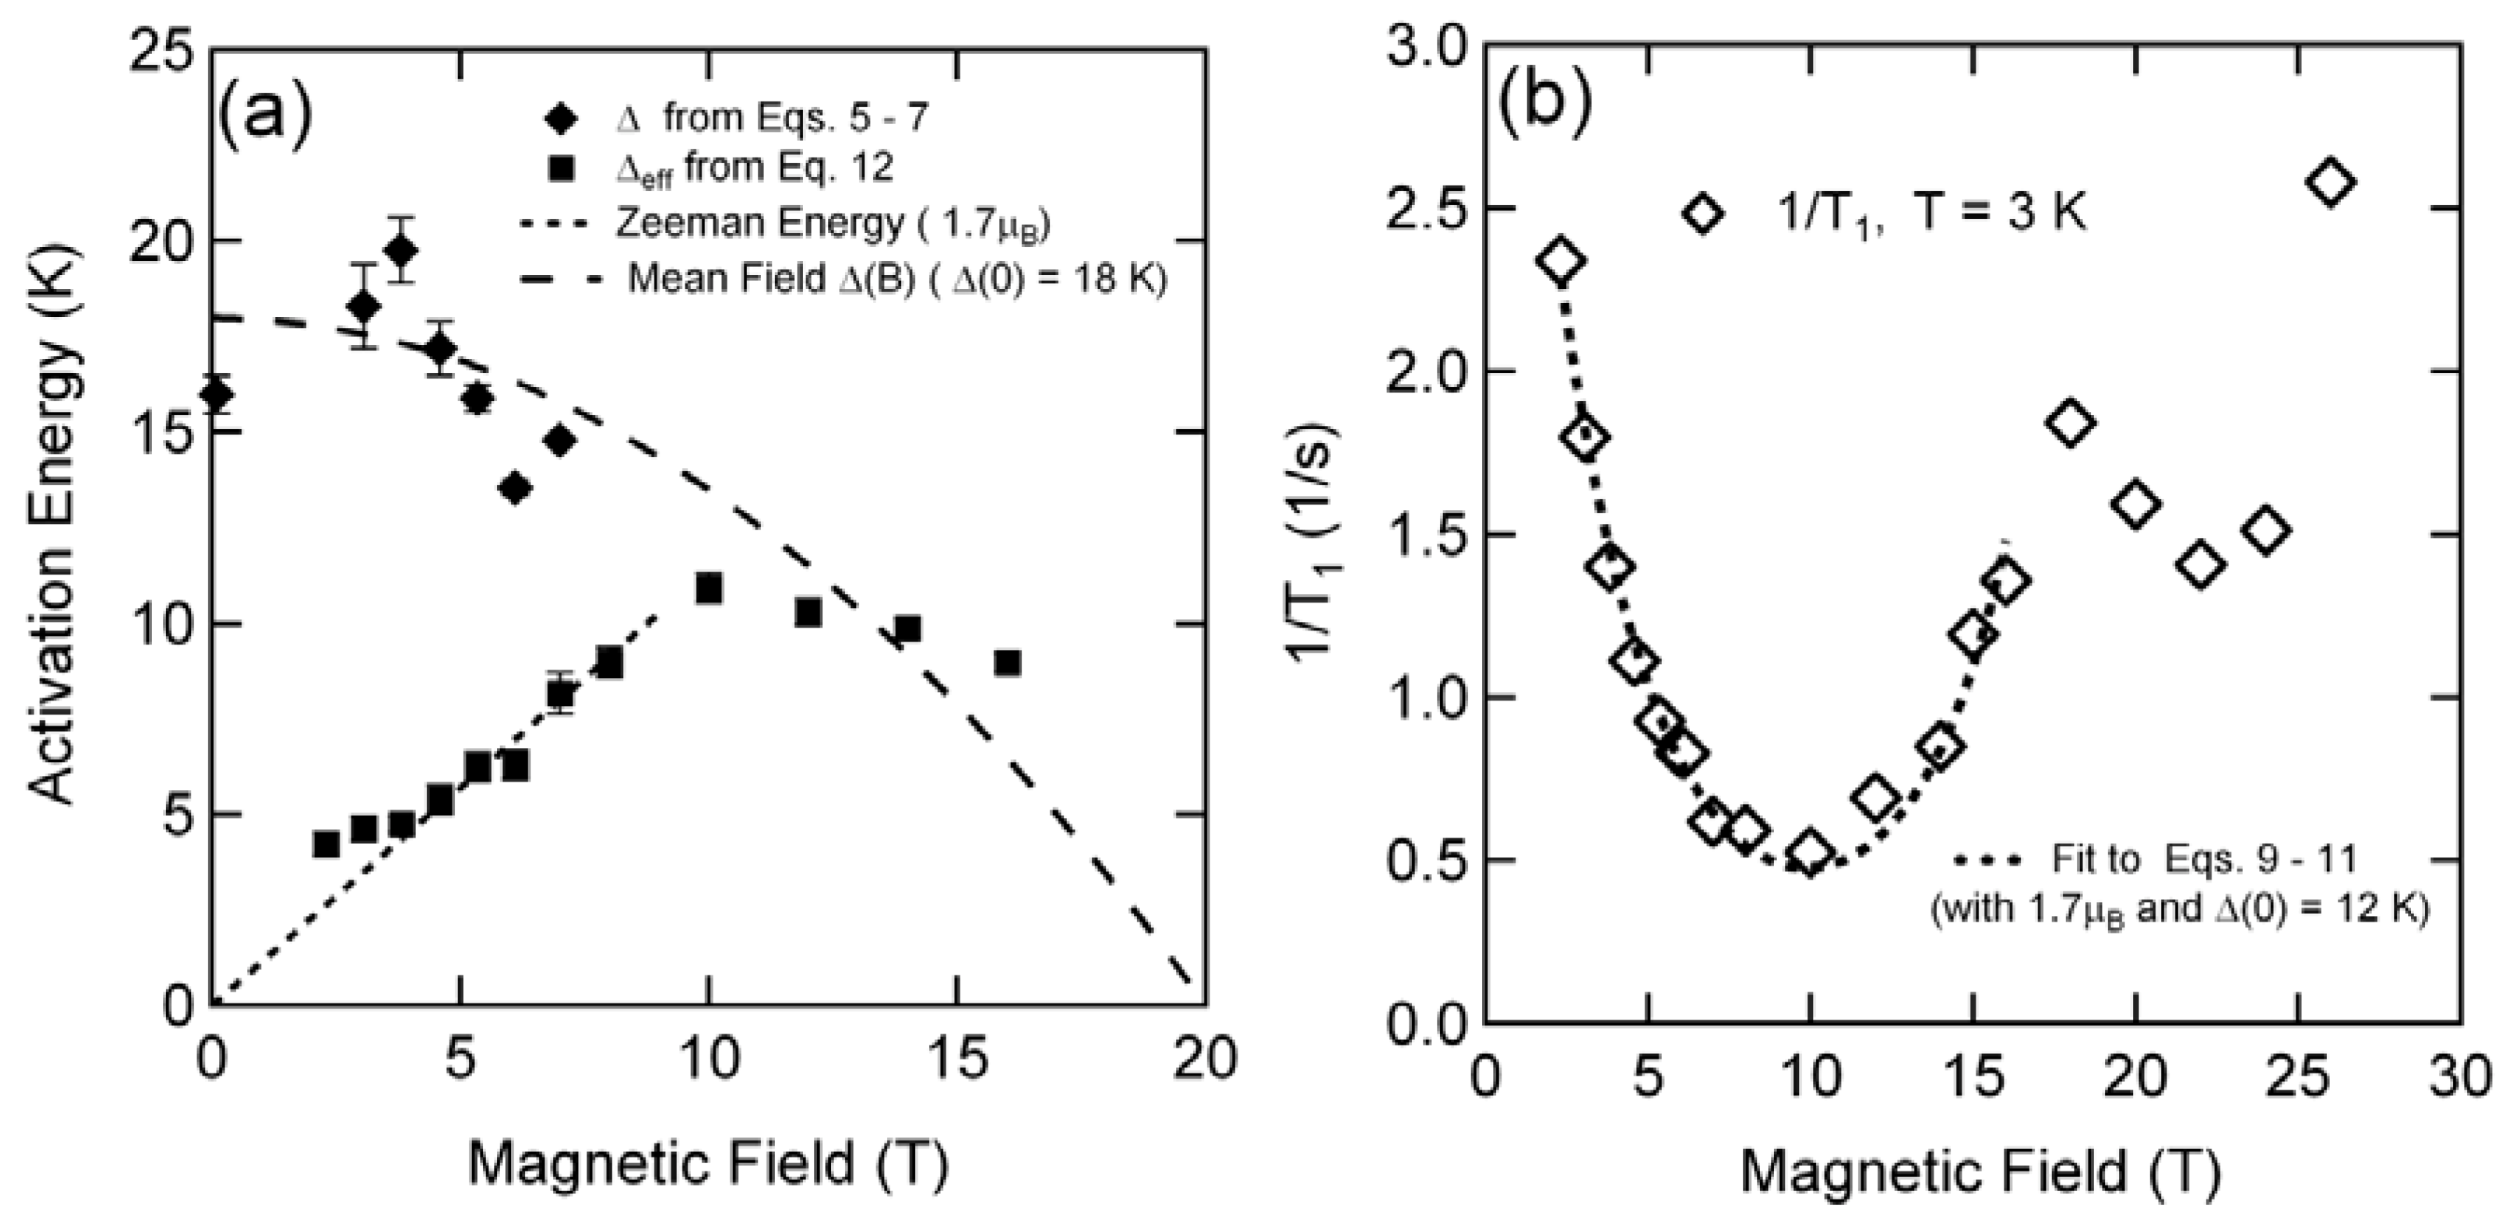
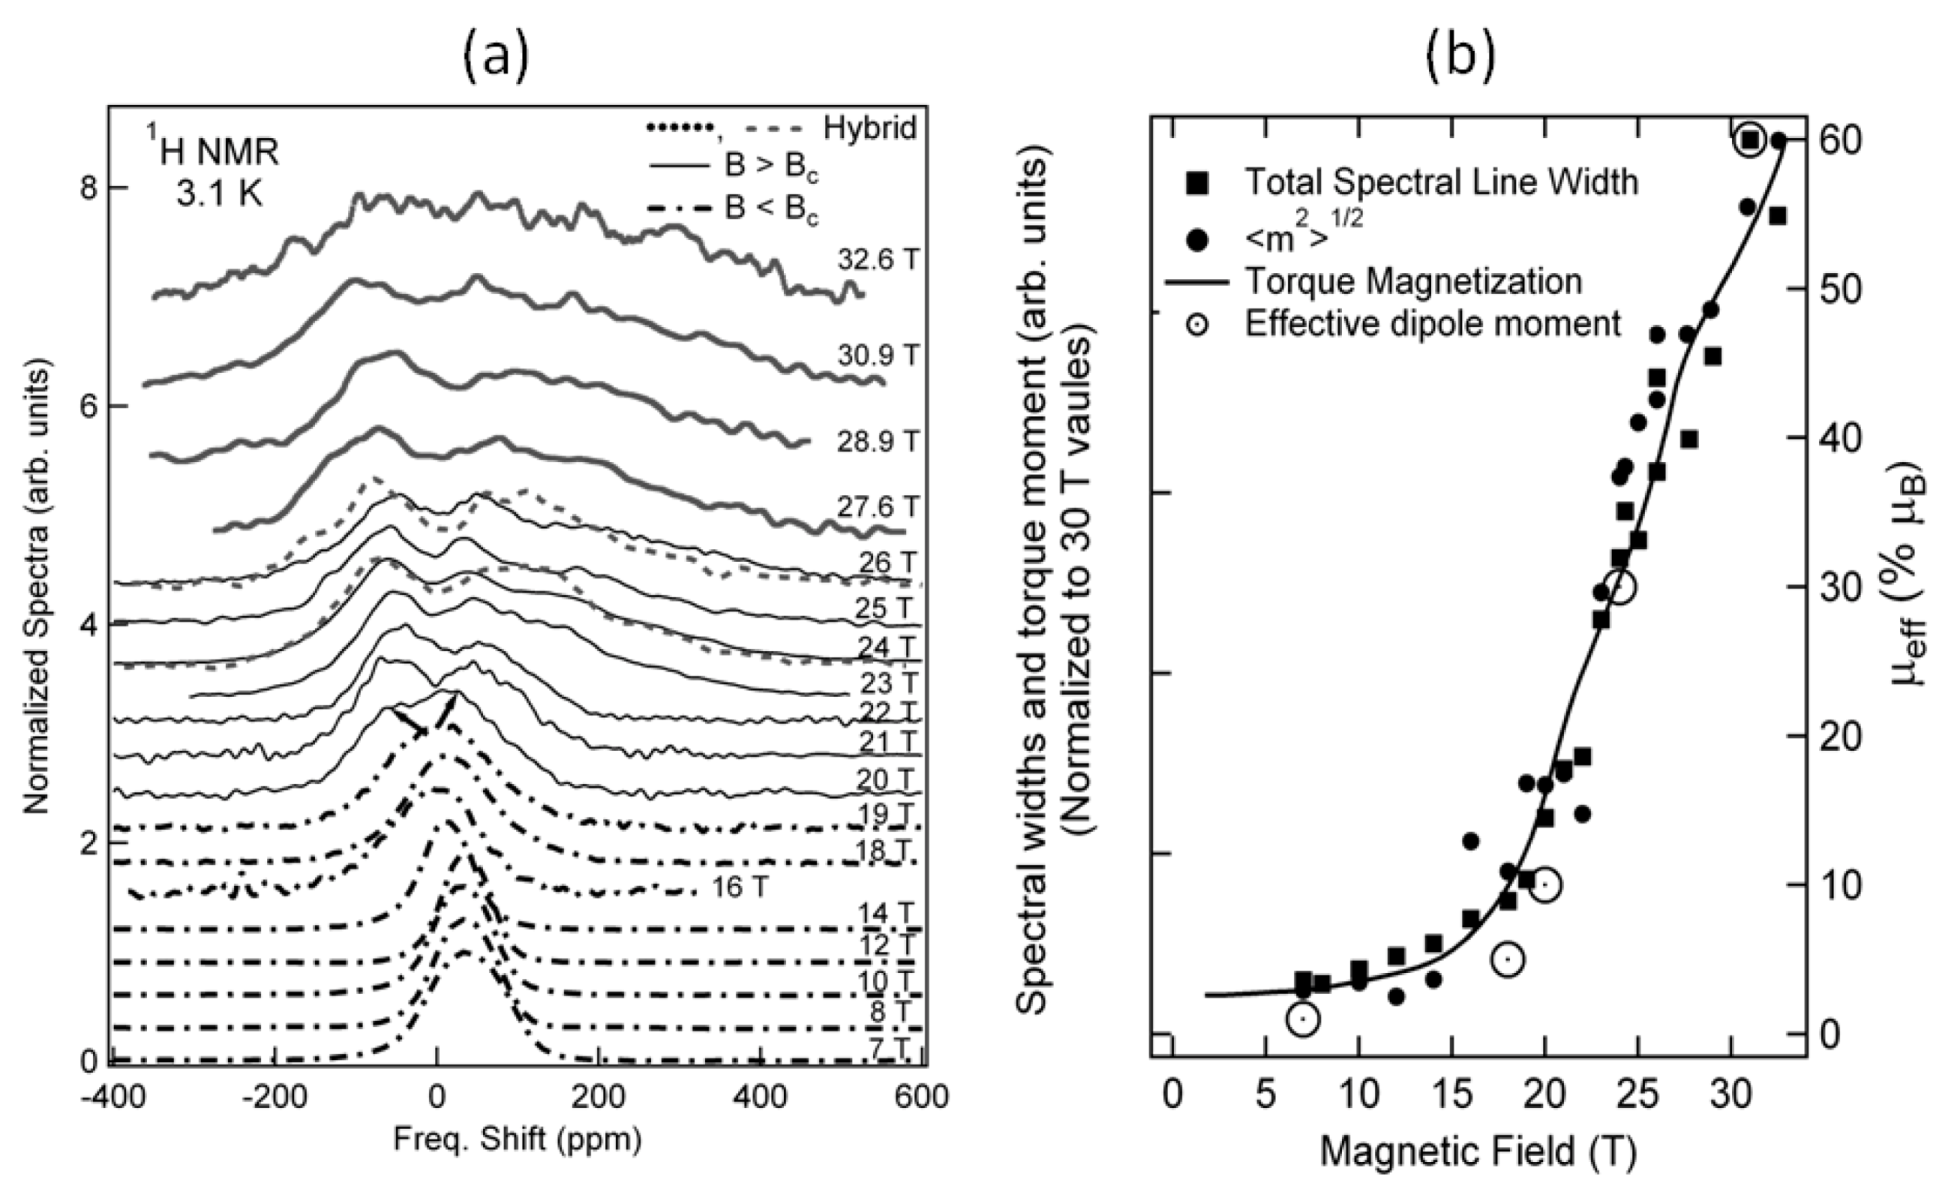
This is evident in
Figure 10a where there is a crossover from Zeeman to mean-field gap behavior at around 10 T. Returning now to Equations (8–11), we may fit the field dependence of 1/T
1 at a constant temperature of 3 K with the parameters
pµ
Beff = 1.4 µ
B (dashed line in
Figure 10a) and a field dependent mean field gap with Δ(0)/k = 12 K (solid line in
Figure 10a), as shown in
Figure 10b. Due to the many parameters and experimental uncertainties, this “two-spin” model analysis is only semi-quantitative, but captures the main features of the spin relaxation behavior at constant temperature below B
c. We close this section by noting that near 20 T, 1/T
1 shows evidence for a phase transition (
Figure 10b). It is possible that features associated with sub-phases in the high field state seen in transport and magnetization [
4] may appear in 1/T
1 (such as the dip between 20 T and 25 T, but more detailed work will be needed to resolve this. The increase at higher fields above 25 T may be the result of an increase in paramagnetic spins due to the further destruction of the spin-singlet chains, which may still be breaking down above the critical mean field B
c.
Figure 10.
(a) Effective gap parameters for Per2[Pt(mnt)2] derived from spin-relaxation and susceptibility analysis. Error bars represent uncertainties in fitting parameters for specific data sets. Overall uncertainties between fits to all data sets, which are significantly larger, are manifested by the scatter in the fit parameters; (b) Spin-relaxation rates from 1H NMR vs. field at 3.1 K, fit to Equation (11) below Bc.
5. 195Pt NMR below the SP-CDW Phase Boundary: Relaxation and Spectral Features
We initiated our study of the SP chain behavior in Per2[Pt(mnt)2] with 195Pt NMR (γ = 9.14894 MHz/T). A fundamental difference between 1H NMR described above and 195Pt NMR is that in the latter case, the NMR nucleus is at the center of the electronic orbital that gives rise to the dipolar field. In the former case, the NMR nuclei (protons) are separated on average by about 10 Å from the d-electron spins.
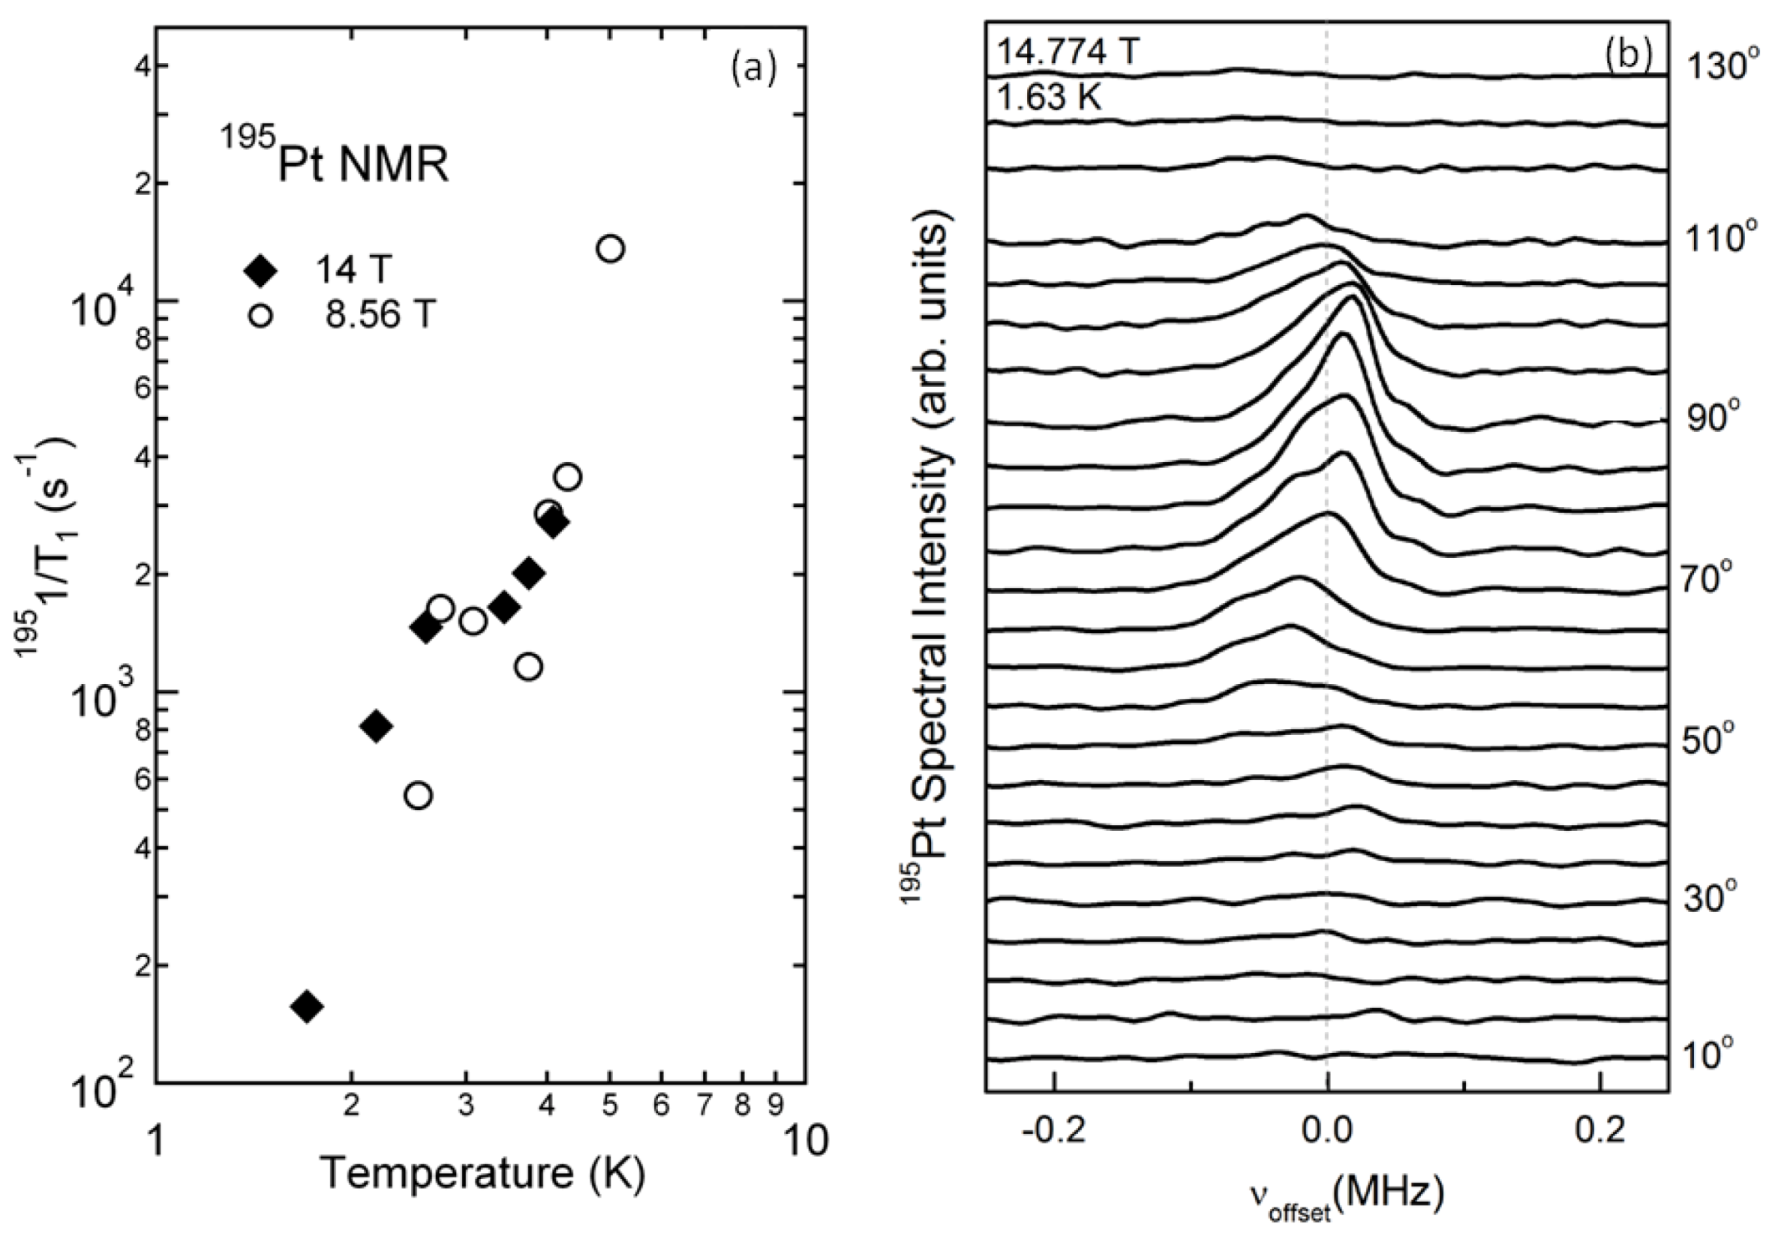
This became evident in a preliminary study of the spin-relaxation time, shown in
Figure 11a. Here, we note that in the SP phase 1/T
1 is on average 1000 times faster on the Pt nuclear site than on the proton site; and in this study 1/T
1 was too fast to measure in the paramagnetic state at higher temperatures. Our results on
195Pt NMR were therefore restricted to low temperatures, and as shown below, also to fields below 20 T. The angular dependence on a single crystal (
Figure 11b—rotation in the a-c plane) for 14.774 T at 1.63 K indicated a hyperfine field anisotropy of about 740 ppm, substantially larger than that for
1H NMR shown in
Figure 3a, which is only about 8.5 ppm. The attenuation of the spectral amplitude for certain directions may arise from the anisotropy in B
c [
4], coupled with the severe attenuation of the
195Pt NMR signal near B
c as discussed below. To obtain better signal-to-noise in the high field studies (the relative NMR sensitivity of
195Pt to
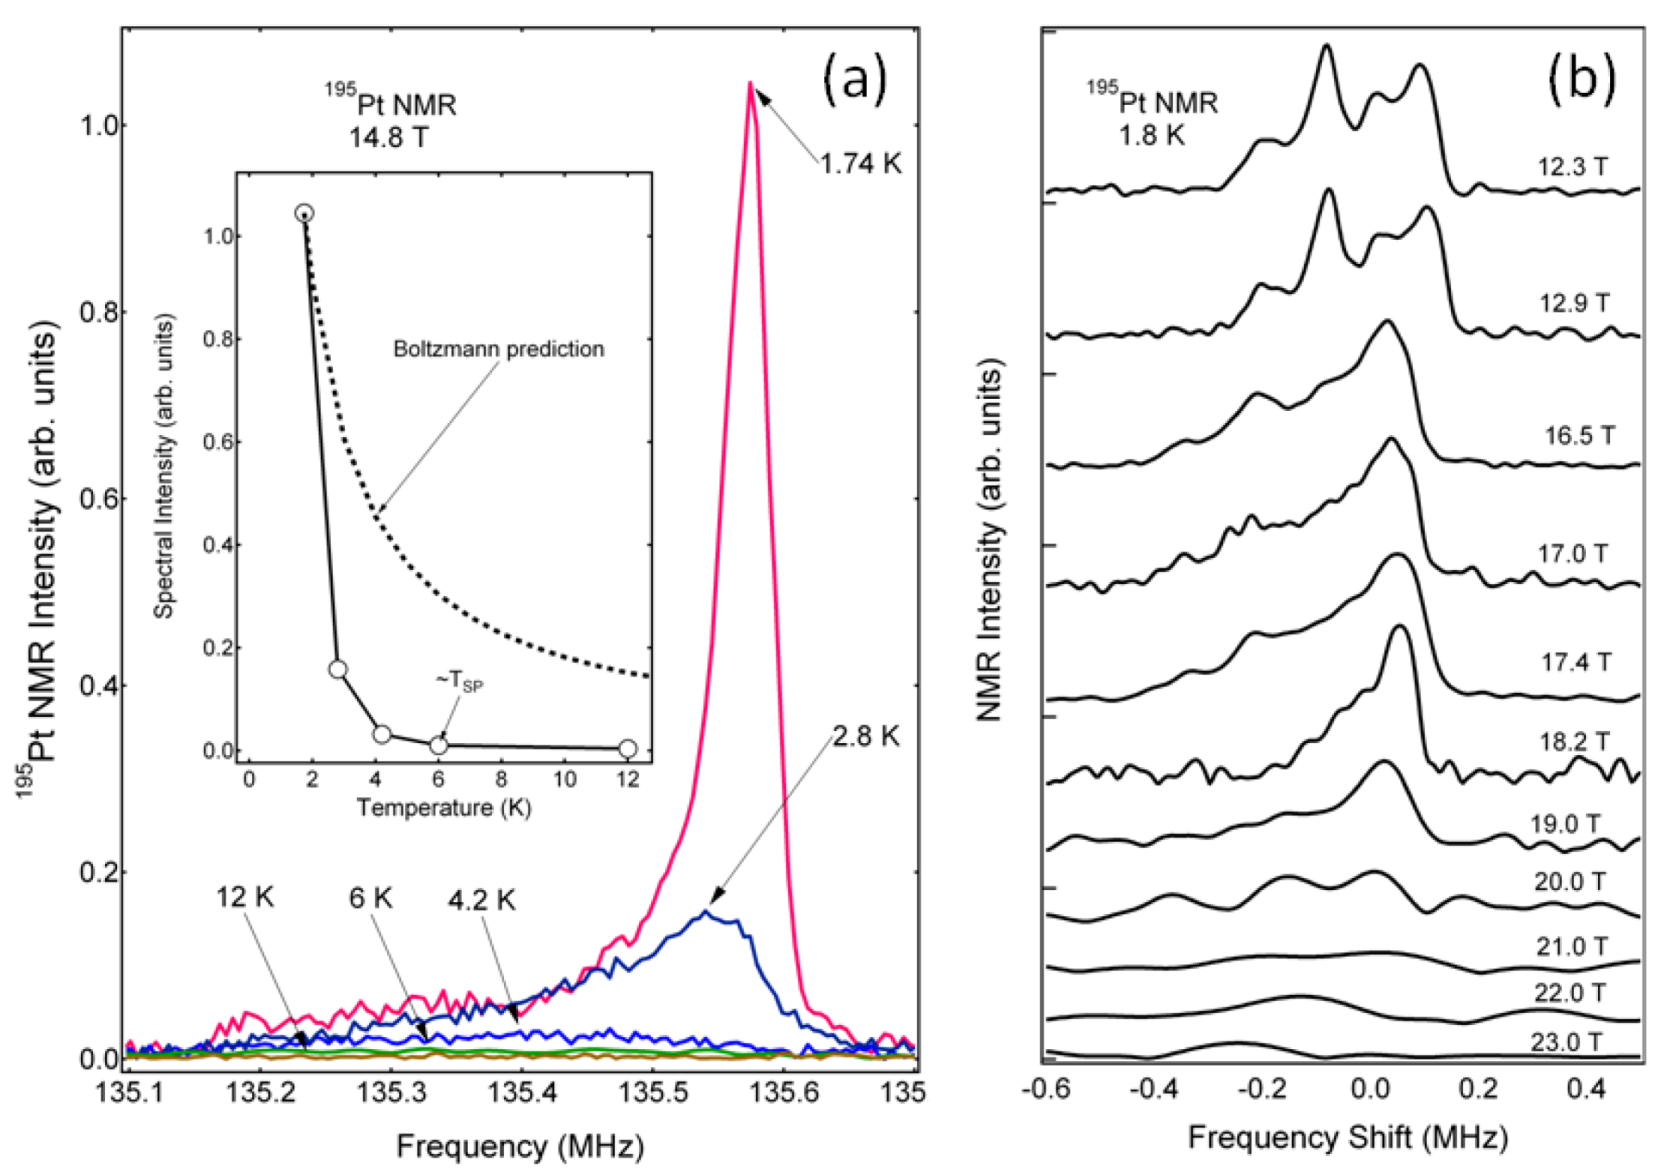
1H is down by 0.00335), we used assemblies of small single crystals with approximate alignment of the b-axis perpendicular to the magnetic field and arbitrary a- and c-axis orientation. This is shown by the highly asymmetric spectral line shape in
Figure 12a that is expected to be the combined result of the anisotropic critical field B
c, and hyperfine fields for a randomly-aligned multi-crystalline sample. Most importantly, the spectral amplitude vanishes with increasing temperature in a manner much faster than the conventional Boltzmann 1/T behavior. A similar feature is seen in the magnetic field dependence in
Figure 12b, where again the signal vanishes quickly as the upper critical field B
c is reached. We note that attempts to find again a
195Pt line at low temperatures well above 20 T (
i.e., 30 T) were unsuccessful. It is possible that until the d-electron spins are fully polarized at much higher fields, the distribution in hyperfine fields at the Pt nuclear site will remain too large to observe an NMR signal.
Figure 11.
195Pt NMR measurements of Per2[Pt(mnt)2]. (a) Temperature dependence of 1/T1 for 8.56 T and 14 T (polycrystalline sample); (b) Angular dependence of 195Pt NMR on a single crystal at 14.774 T and 1.63 K (rotation in a-c plane). The center frequency is 135.16 MHz.
Figure 11.
195Pt NMR measurements of Per2[Pt(mnt)2]. (a) Temperature dependence of 1/T1 for 8.56 T and 14 T (polycrystalline sample); (b) Angular dependence of 195Pt NMR on a single crystal at 14.774 T and 1.63 K (rotation in a-c plane). The center frequency is 135.16 MHz.
Figure 12.
195Pt spectra of a Per2[Pt(mnt)2] polycrystalline sample. (a) Temperature dependence at 14.8 T. Inset: temperature dependence of peak height compared with the 1/T Boltzmann factor; (b) Magnetic field dependence at 1.8 K. Traces are offset for clarity; center frequency = 195γB.
Figure 12.
195Pt spectra of a Per2[Pt(mnt)2] polycrystalline sample. (a) Temperature dependence at 14.8 T. Inset: temperature dependence of peak height compared with the 1/T Boltzmann factor; (b) Magnetic field dependence at 1.8 K. Traces are offset for clarity; center frequency = 195γB.
The rapid attenuation of the
195Pt spectral intensity near the SP-CDW phase boundary was the main reason for switching to
1H NMR; this was the only way to probe the SP behavior through the phase transitions. The origin of the
195Pt NMR attenuation may arise from several factors, either in the switching of the hyperfine field to another value far away from the measuring frequency, or by an increasing spatial or temporal fluctuation in the hyperfine field. By inspection
Figure 12a,b, it appears that the first moment shifts to lower frequencies as the phase boundary is approached (in T or B), which is consistent with what is seen for
1H NMR. However, since the signal attenuates so quickly, it is difficult to say anything about the line shape and/or the second moment, and spin-relaxation rates become highly uncertain near the phase boundary. If it is assumed that the spectrum of d-electron spin fluctuations is the same for both H and Pt, then the easiest estimate of the ratio of the relaxation rates (at the same temperature and field) at the two sites is their nuclear proximity R to the nearest Pt d-electron spin,
i.e.,
T1 (1H)/T1(195Pt) ~ R6(H-Pt)/R6(Pt-Pt) (13)
Assuming a nearest neighbor [1/R
3]
2 dipolar interaction term between an NMR nucleus and the Pt electronic spin. Comparing a proton at a distance of 10 Å from a Pt electronic spin to a Pt nucleus at a distance of 4 Å from a neighboring Pt electronic spin, the ratio of relaxation rates is only a factor of 240. To get a ratio of order 1000, the effective Pt-Pt distance R (Pt-Pt) would need to be about 3 Å, less than the nearest neighbor Pt-Pt distance of 4.125 Å. This implies that the Pt relaxation and spectra are probably strongly influenced by the hyperfine interactions between each Pt nucleus and its own on-site [Pt(mnt)
2]
− spin. Even though the Pt orbital is d-like in symmetry, more than half of its spin density is distributed over the [Pt(mnt)
2]
− anion [
24]. We may roughly estimate a lower bound on the hyperfine coupling by considering the shift in the spectral position from 1.74 K to 4.2 K in
Figure 12a, using the value for χ at 4.2 K. Here we find A
hf ~ 3700 Oe/µ
B, again a value significantly higher than that for the proton sites.
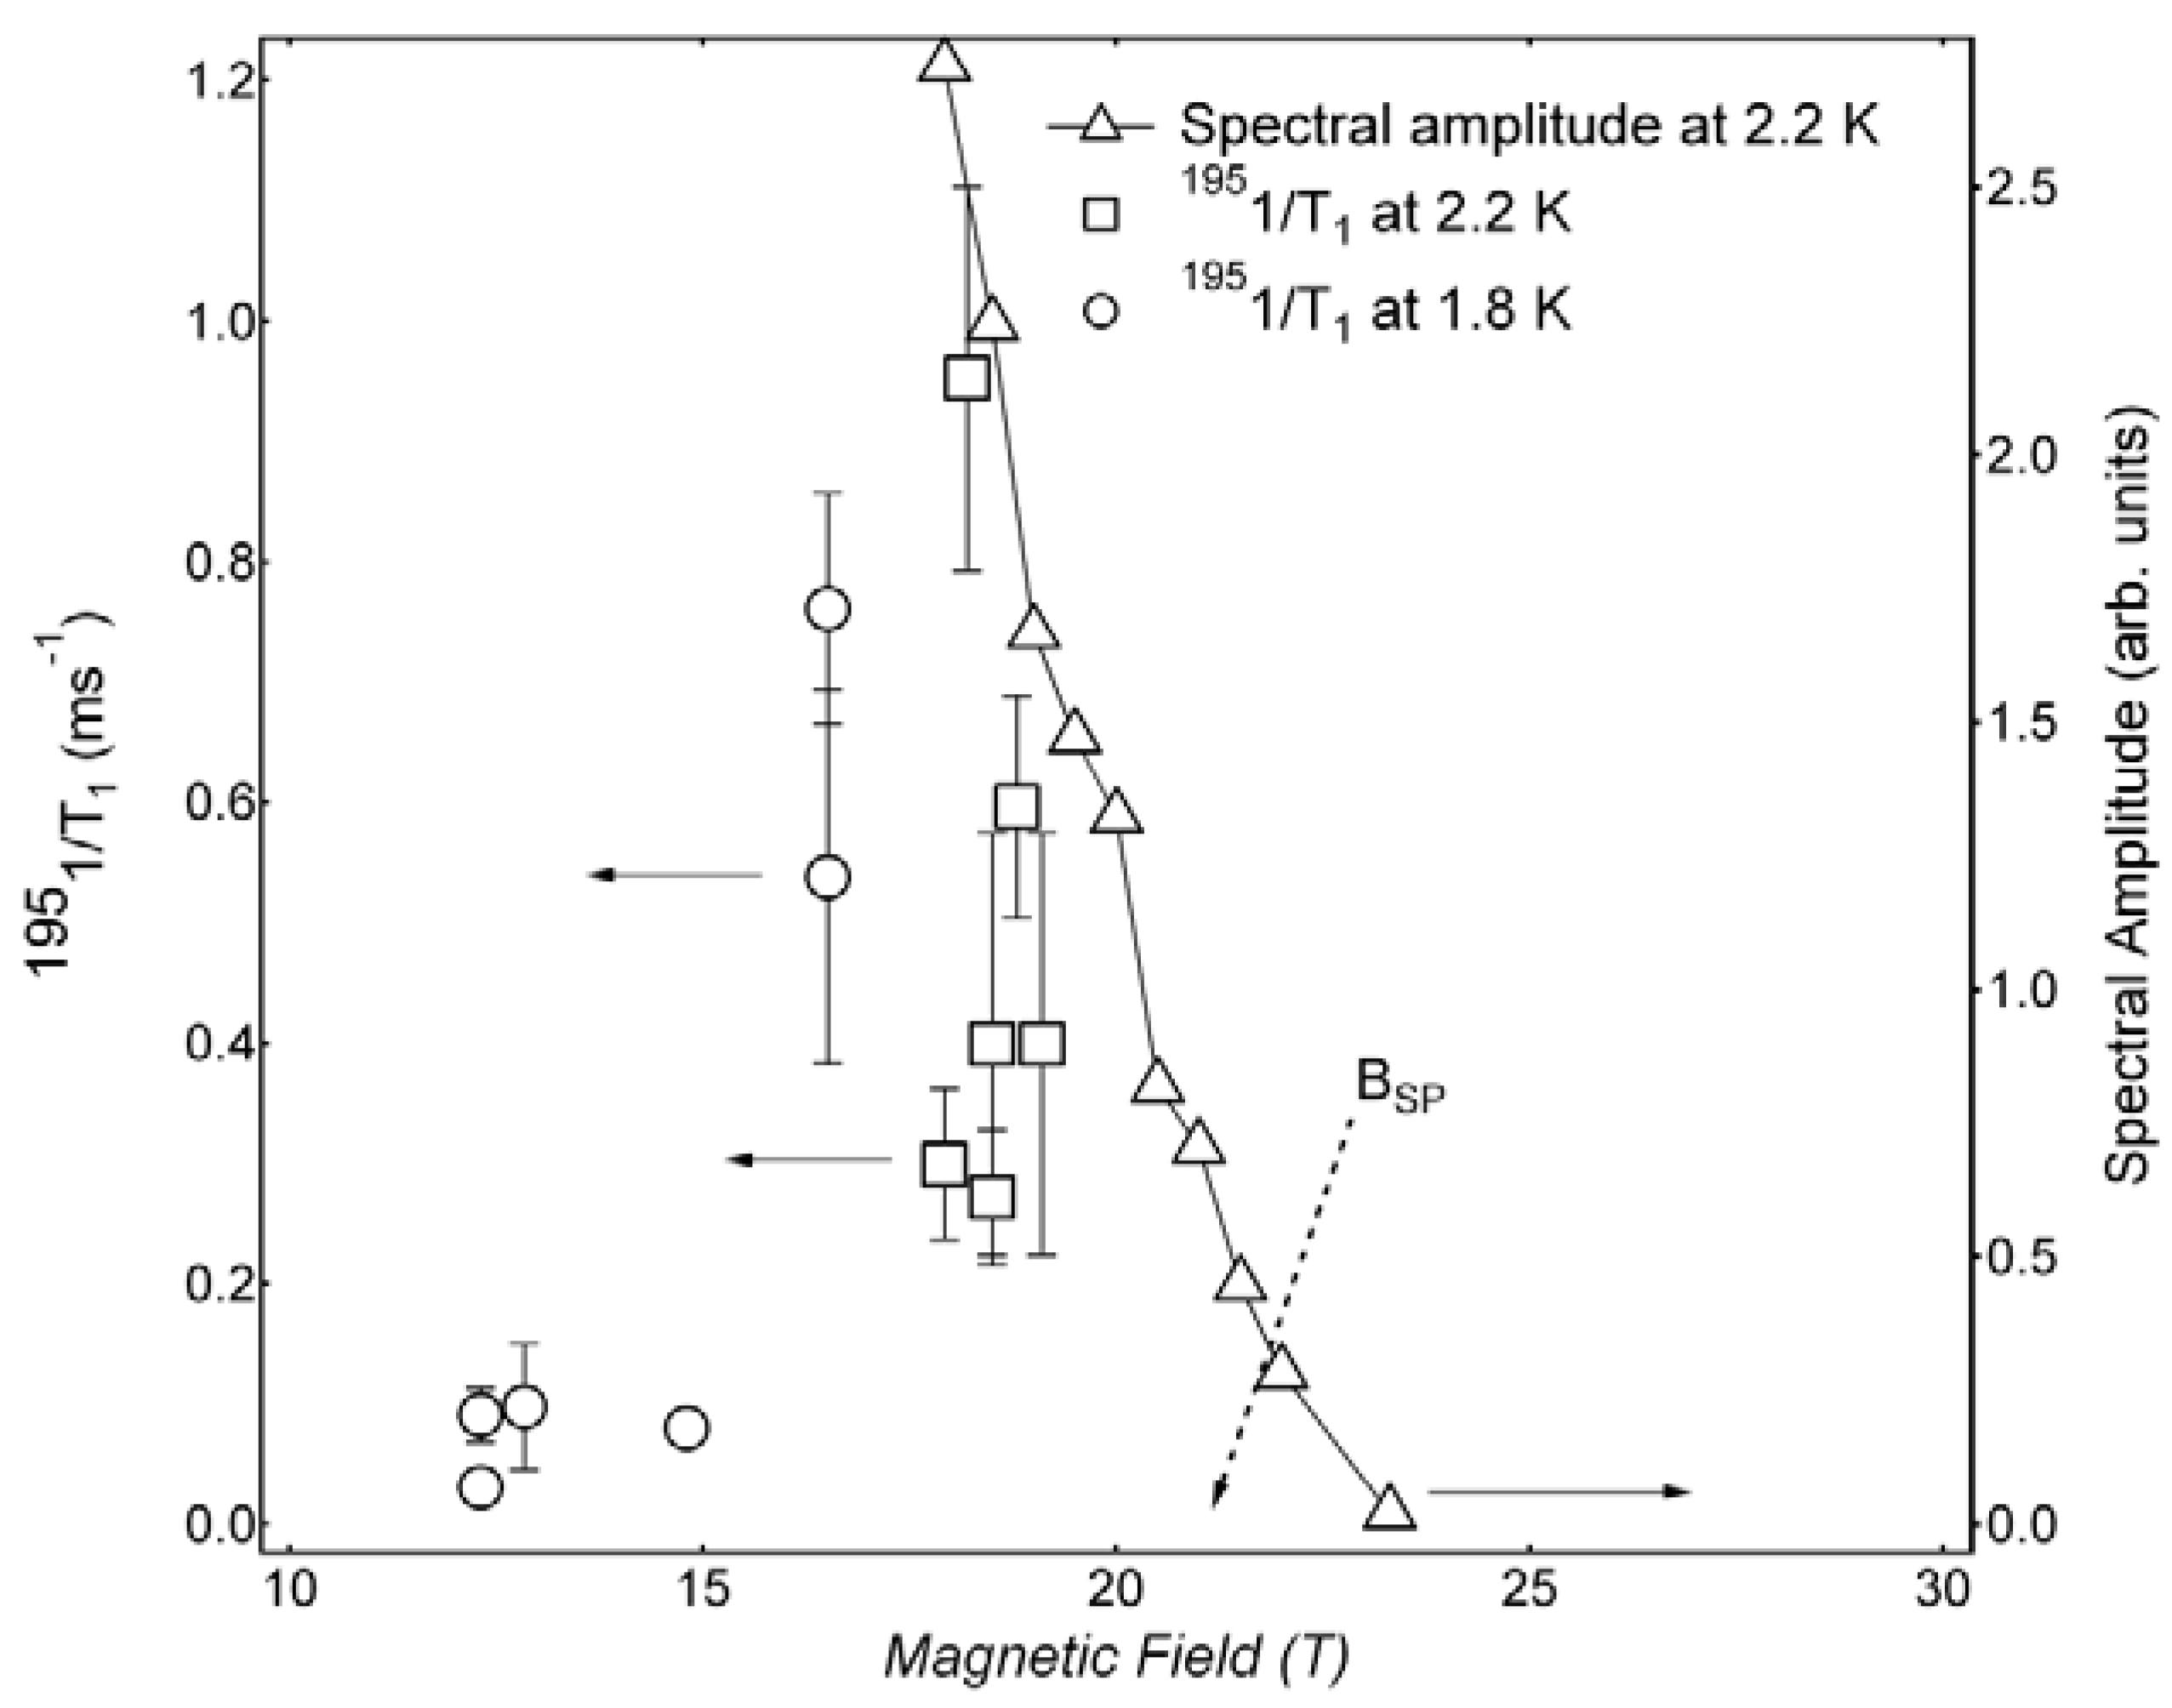
A summary of the field dependences of the
195Pt spectral amplitudes and the relaxation rates 1/T
1 at high magnetic fields near B
c are shown in
Figure 13. Although divergences in the relaxation rates may be expected as the phase boundary B
c is approached, the rapidly vanishing signal precluded any definitive determinations. Since the ratio of the relaxation rates of
195Pt to
1H is about 1000, scaling the
1H data in
Figure 10b would put 1/T
1 ~ 1.5 (ms)
−1 = 1500 s
−1 at B
c ~ 20 T, which seems plausible, base on the range of 1/T
1 values in
Figure 13.
Figure 13.
Magnetic field dependence of 195Pt NMR spectral amplitude at 2.2 K and relaxation rates 1/T1 at 2.2 and 1.8 K on a Per2[Pt(mnt)2] polycrystalline sample.
Figure 13.
Magnetic field dependence of 195Pt NMR spectral amplitude at 2.2 K and relaxation rates 1/T1 at 2.2 and 1.8 K on a Per2[Pt(mnt)2] polycrystalline sample.
7. Conclusions
We have used 1H NMR spectra and spin-relaxation rates (1/T1) to track the behavior of the spin ½ chain in Per2[Pt(mnt)2] over a broad range of temperature and magnetic field. Below the spin-Peierls transition (T < Tc), the linewidth and 1/T1 indicate the formation of a spin-singlet state, but features in magnetic field dependence of the susceptibility and 1/T1 show the presence of a minority paramagnetic spin population. These minority spins arise from unpaired spins in the [Pt(mnt)2] anions, and we find their effects are not observable above 10 T due to the increase in the Zeeman energy. In parallel, for T < Tc, with increasing magnetic field the majority spins in the singlet state begin to break down, and the effective spin-Peierls gap decreases. Hence above 10 T, the breaking of the spin chain begins to dominate the behavior of 1/T1. Near and above the critical field Bc, we find that the spectra progressively broaden with magnetic field in a manner consistent with the increase in the effective moment µeff of the dipole interaction, and follow a similar trend seen in torque magnetization studies, and also simulations of 1H NMR spectra. We estimate it would take about 60 T to fully recover µB in the dipole interaction. In contrast, the 195Pt spectra are only observable deep in the SP ground state due to the close proximity of the d-electron moment to the 195Pt nucleus (same atom and nearest neighbor). Hence with increasing temperature, the relaxation rate quickly becomes too fast to measure, and with increasing magnetic field, the breaking of the spin-singlet state creates strong variations in the local hyperfine fields and quickly broadens and shifts the spectral lines.
The signatures of the onset of the SP ground state, based on all NMR spectra and spin relaxation data taken in this study, is that the full SP state appears to form below the CDW transition seen in transport measurements, at least at low magnetic fields. However, at high fields, the two order parameters appear to be coupled more closely. Since NMR is a dynamic probe ω ≠ 0, and transport is essentially ω = 0, it is possible that the two methods are affected by different aspects of the transitions as the order parameters develop below T
c. For example, similar differences in apparent phase boundaries have been observed in the case of the field-induced spin density wave phases of (TMTSF)
2ClO
4 [
26]. Nevertheless, the study presented here is consistent with the notion that the CDW ground state formation is a necessary condition to drive the formation of the SP ground state, and the commensurability of the two order parameter periodicities (2:1) most likely promotes this interaction.
To go beyond the present study, a more detailed investigation of 1H NMR spectra and 1/T1 in the range 20 to 45 T will be needed to resolve features associated with subphases in the high field state. This presents a challenge since GHz range NMR spectroscopy with sufficient power is necessary to overcome the demands on bandwidth due to the increasing linewidths at very high magnetic fields.
