Article

Study of Anisotropic Plastic Behavior in High Pressure Torsion of Aluminum Single Crystal by Crystal Plasticity Finite Element Method

1
State Key Laboratory of Mechanical Transmissions, Chongqing University, Chongqing 400044, China
2
School of Mechanical, Materials and Mechatronic Engineering, University of Wollongong, Wollongong, NSW 2522, Australia
3
Department of Materials Science and Engineering, Kyoto University, Sakyo-ku 606-8501, Japan
*
Author to whom correspondence should be addressed.
Crystals 2017, 7(12), 362; https://doi.org/10.3390/cryst7120362
Submission received: 28 October 2017 / Revised: 25 November 2017 / Accepted: 4 December 2017 / Published: 6 December 2017
(This article belongs to the Special Issue Crystal Dislocations: Their Impact on Physical Properties of Crystals)

Abstract

:
In this study, a crystal plasticity finite element method (CPFEM) model has been developed to investigate the anisotropic plastic behavior of (001) aluminum single crystal during high-pressure torsion (HPT). The distributions of equivalent plastic strain and Mises stress recorded on the sample surface are presented. The directional variations of plastic strain and Mises stress with the development of four-fold symmetry pattern are observed along the sample circumference. The crystallographic orientation evolution along the tangential direction is studied, and the corresponding lattice rotation and slip trace are predicted, respectively. The plastic anisotropy mechanism is discussed in detail based on the theory of crystal plasticity. The simulation results reveal that the differences in slip systems activation (dominant slip and multiple slips) are responsible for the anisotropic plastic deformation in HPT.

1. Introduction

Interest in the use of severe plastic deformation (SPD) techniques to produce ultra fine-grained (UFG) or nanocrystalline structures of different materials has developed a great deal over the last two decades [1,2]. High-pressure torsion (HPT) is a SPD technique in which a sample is subjected to torsion straining under a high hydrostatic pressure [3]. Compared with the other SPD methods, such as equal-channel angular pressing (ECAP) [4] and accumulative roll bonding (ARB) [5], the most important advantage of the HPT process is that extremely high shear stain can be continuously achieved via simple means [6,7]. Due to its incomparable straining capacity, HPT has attracted extensive research interest for fabrication of UFG materials of pure metals and alloys, where polycrystals are typically used as starting materials [8,9].
Up until now, a number of studies have been reported on HPT processing of single crystals. In the case of single crystals, it is convenient to use a single-crystal structural state to exclude the influence of initial grain boundaries and overall initial orientations, aiding in the understanding of deformation behaviors during HPT. Astafurova et al. [10] and Pilyugin et al. [11,12] investigated the microstructure evolution of different single-crystalline materials during the HPT process. Kashihara and his co-workers [13] examined the texture evolution in {112} <111> aluminum single crystal processed by severe plastic deformation. Smirnova et al. [14,15] studied the developments of structure and orientational instability in face-centered cubic (FCC) single crystals (copper, nickel and alloys KhN77TYuR) deformed by torsion at quasi-hydrosatic pressure. Their results showed the differences in deformation behavior of different initially orientated single crystals. Hafok and Pippan [16,17] experimentally examined the texture evolution of nickel and copper single crystals subjected to HPT deformation. They reported that the texture of the (001)-oriented single crystal developed a four-fold symmetry along the sample tangential direction. Méric and Qailletaud [18] undertook conventional FEM simulation and anisotropic elasto-viscoplastic calculation derived from the slip theory for FCC single crystals loaded in torsion, respectively. The FEM method gave a homogeneous strain distribution along the circumference of the initial (001) single crystal specimen, while the micro-macro approach presented four more strained regions around <110> areas separated by four less-strained regions located in <100> areas. Nouailhas et al. [19] reported similar observations of strong anisotropic features using a crystallographic model based on the Schmid theory. Kaluza and Le [20] and Le and Piao [21] have quantitatively calculated the dislocation distribution inside a single crystal rod loaded in torsion within the framework of continuum dislocation theory. The non-uniform distribution of dislocations in equilibrium were found and a wavy deformation pattern comprising of four periods was observed during torsion. Even though research has already been done in the past, the reason underlying such anisotropic plastic bahavior during HPT processing of single-crystal metals is still unclear.
In our previous work [22], a crystal plasticity finite element method (CPFEM) model was developed to simulate the HPT processing of single crystals. It has been widely accepted that the CPFEM model is one of the best models for simulating the plastic deformation of crystalline materials [23,24], The predicted texture results were in good coherence with the experimental measurements, and considerable attention was devoted to revealing the texture evolution mechanism during the HPT process. In addition, the anisotropic deformation pattern on the surface of the HPT-processed sample could also be clearly observed. The purpose of this study is to further investigate such plastic anisotropy phenomena in HPT-deformed single crystals, adopting the CPFEM model. The underlying mechanism is discussed in detail based on the theory of crystal plasticity.

2. CPFEM Simulation Procedure

2.1. Crystal Plasticity Constitutive Model

The wide variety of currently available crystal plasticity models can be classified into two major types: the orientation gradient crystal plasticity method, which follows the crystal plasticity constitutive relations described by Asaro [25]; and the strain gradient crystal plasticity method, which is based on a scalar dislocation density-based constitutive frame proposed by Ashby [26]. The first type of model was employed in the simulation, as reported by Asaro [25]; under load, the crystalline material undergoes crystallographic slip, due to dislocation motion on the active slip systems and elastic deformation, which includes stretching and rotating of the crystal. The total deformation gradient (F) can be decomposed into two components:
F = F · F P
The velocity gradient (L) is evaluated from the deformation gradient by
L = F ˙ F 1 = L + L P
where
L = F ˙ · F 1 ;   L P = F · F ˙ P · F P 1 · F 1
Taking the symmetric and asymmetric parts of the above relations leads to the elastic and plastic strain rates D and D P , and the plastic spins Ω P and Ω induced by the lattice rotation and stretching:
D = D + D P ;   Ω = Ω + Ω P
By introducing the following symmetric and asymmetric tensors, respectively, for each slip system α ,
P ( α ) = 1 2 ( s ( α ) m ( α ) + m ( α ) s ( α ) ) ;   W ( α ) = 1 2 ( s ( α ) m ( α ) m ( α ) s ( α ) )
the plastic strain rate and spin for the crystal can be written as
D P = α = 1 N P ( α ) γ ˙ ( α ) ;   Ω P = α = 1 N W γ ˙ ( α )
where γ ˙ ( α ) is the resolved shear strain rate of the slip system α , s ( α ) and m ( α ) are the slip direction vector and the normal vector, respectively, in the current configuration.
The crystalline slip is assumed to follow the power law, which states that slip begins when the resolved shear stress reaches a critical value,
γ ˙ ( α ) = γ ˙ 0 ( α ) s g n ( τ ( α ) ) | τ ( α ) τ c ( α ) | n   for   | τ ( α ) | τ c ( α )
γ ˙ ( α ) = 0   for   | τ ( α ) | < τ c ( α )
and
s g n ( x ) = { 1 ,     x < 0   1 ,     x 0
where γ ˙ 0 ( α ) and n are the material parameters, τ c ( α ) is the critical resolved shear stress (CRSS) of the slip system α . The rate of change of the CRSS is expressed as
τ ˙ c ( α ) = β = 1 N h α β γ ˙ ( β )
The hardening models have been extensively studied by Taylor [27,28], Hutchinson [29], Peirce et al. [30], and Bassani and Wu [31,32]. Many comparative studies of the aforementioned hardening models have been carried out to simulate the finite- and large-strain deformations [33,34,35,36]. It has been found that the Bassani and Wu model was able to reflect the hardening of face-centered cubic (FCC) crystals more exactly, and was an accurate predictor of texture. Recently, the Bassani and Wu hardening model has been successfully employed to predict deformation behavior and texture evolution during ECAP [37,38] and HPT [22]. Therefore, in this study, the hardening model of Bassani and Wu was adopted. Their expressions for self and latent hardening are expressed as:
h α α = [ ( h 0 h s ) sec h 2 ( ( h 0 h s ) γ ( α ) τ 1 τ 0 ) + h s ] [ 1 + β = 1 β α N f α β tan h ( γ ( β ) γ 0 ) ]   for   α = β
h α β = q h α α   for   α β
where h α α is the self-hardening modulus and h α β denotes the latent hardening modulus, q is a latent hardening parameter, h 0 ,   h s ,   τ 0 and τ s are hardening moduli and shear stresses, γ is the shear strain, f α β is the interaction parameter between the two slip systems α and β . The factors f α β depend on the geometric relation between two slip systems. There are five constants for f α β ; namely, α 1 (no junction), α 2 (Hirth lock), α 3 (coplanar junction), α 4 (glissile junction) and α 5 (sessile junction).

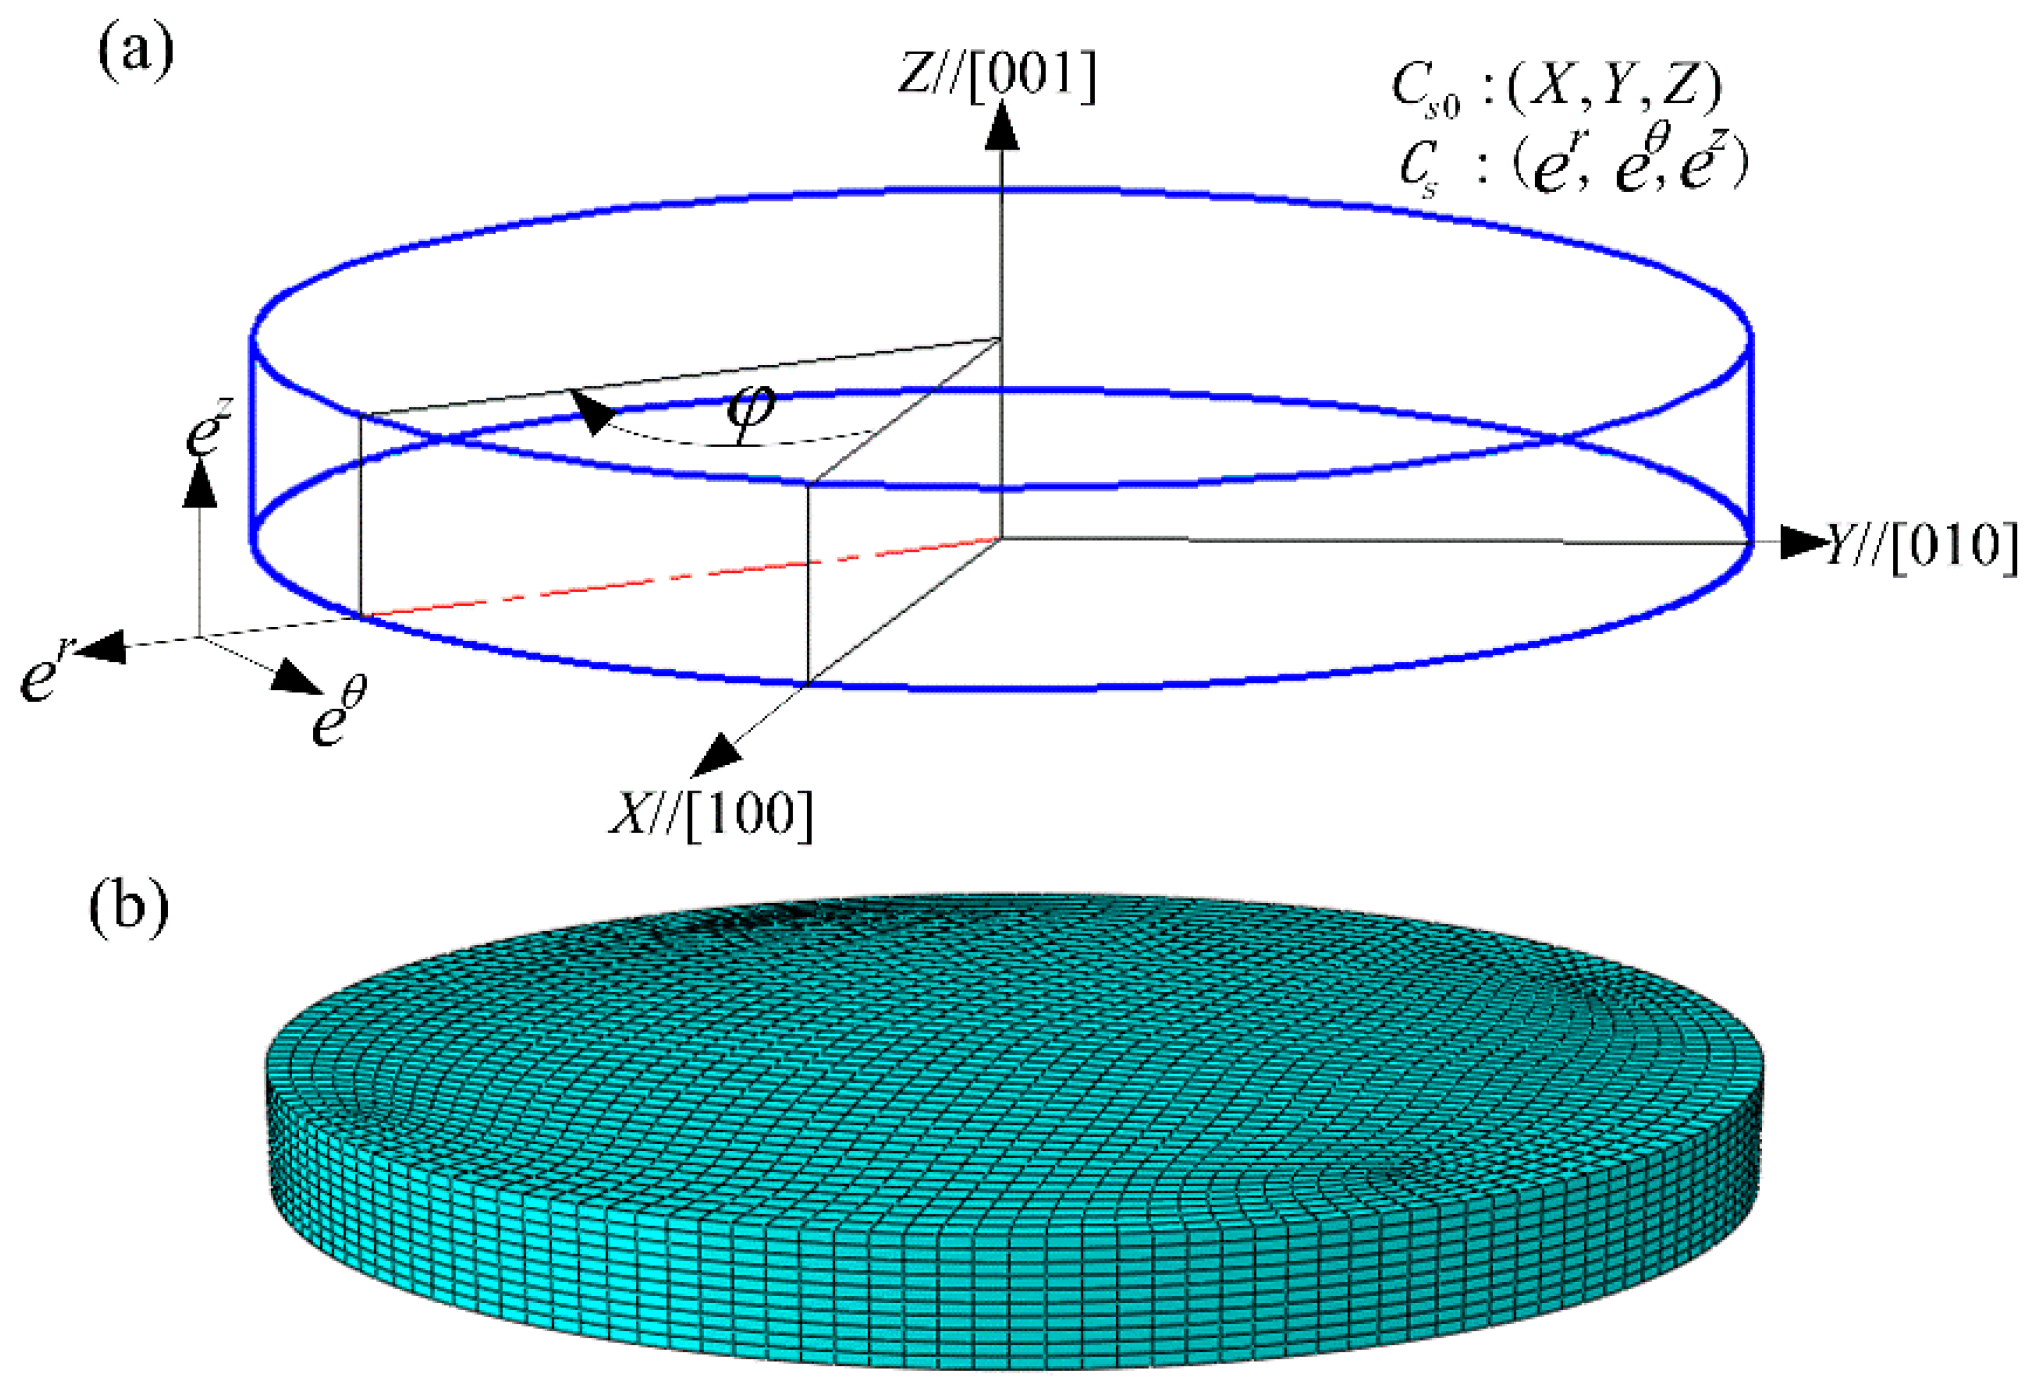
2.2. Finite Element Implementation

The commercial software ABAQUS 6.9-1 was used to simulate the deformation process of HPT, as shown in Figure 1. The disk-shaped sample with 10 mm of diameter and 0.8 mm of thickness was assumed to be a deformable body, while the upper and lower HPT anvils were set as rigid bodies. The starting material was oriented with the (001) crystallographic plane normal parallel to the Z axis, while the [100] crystallographic direction lying with the X axis; also known as the cube orientation. Because HPT deformation is applied on the thin disk-shaped samples, a cylindrical-polar coordinate system, C S , was established with the associated orthonormal base vector ( e r , e θ ,   e z ), where R, θ and Z denote the radial, tangential and axial directions, respectively. The angular value φ stands for the extent that material flows away from the X direction around the axial direction on the shear plane (the counterclockwise direction is positive, while the clockwise direction is negative), as illustrated in Figure 1a. The sample was meshed into 23,600 elements and 26,895 nodes in total, and C3D8R elements were applied, as shown in Figure 1b. During the simulation, the lower anvil was fixed. The rotation boundary condition along the Z axis was applied to the upper anvil, while the other freedoms of the upper anvil were set to be constrained.
The simulated material was aluminum single crystal, the elastic moduli of which were: C 11 = 112 , 000 MPa, C 12 = 66 , 000 MPa and C 44 = 28 , 000 MPa. The parameters in the constitutive equations employed in this study are listed in Table 1. Franciosi et al. obtained the slip system interaction parameters α 1 - α 5 by conducting the latent hardening experiment using aluminum single crystal [39]. Other parameters were identified by fitting the simulated stress-strain curve with the experimental results of single crystal aluminum [40,41]. These parameters have been validated in the CPFEM simulations of nano-indentation [42], cold rolling [43], and equal-channel angular pressing [37]. In the deformed aluminum material with FCC structure, it is assumed that slips occur on the {111} slip planes along the <110> slip directions. Their combination defines 12 different slip systems as indicated in Table 2.

3. Results

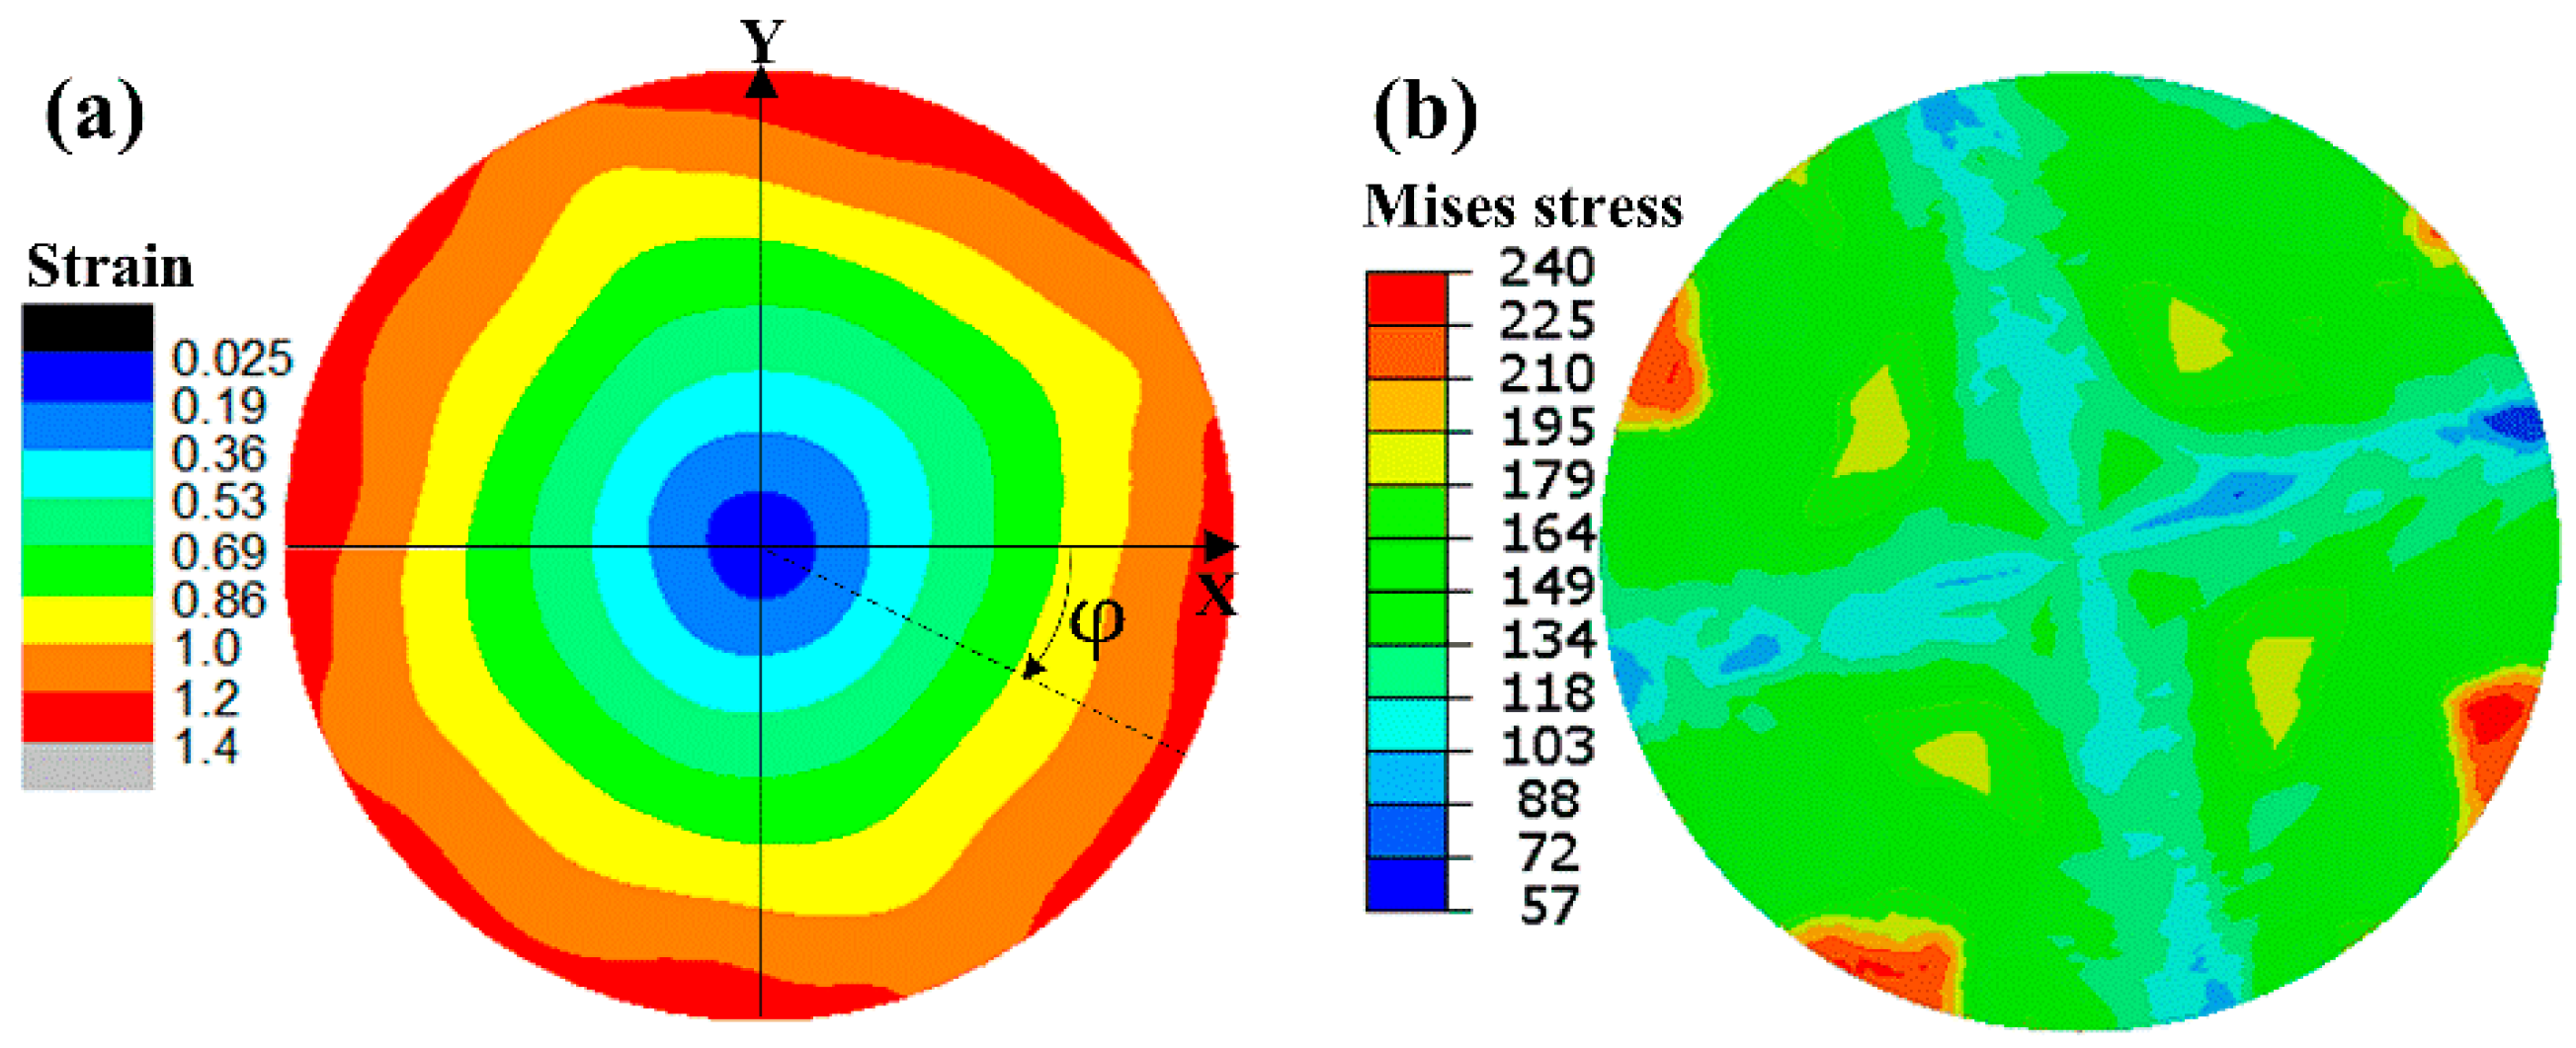
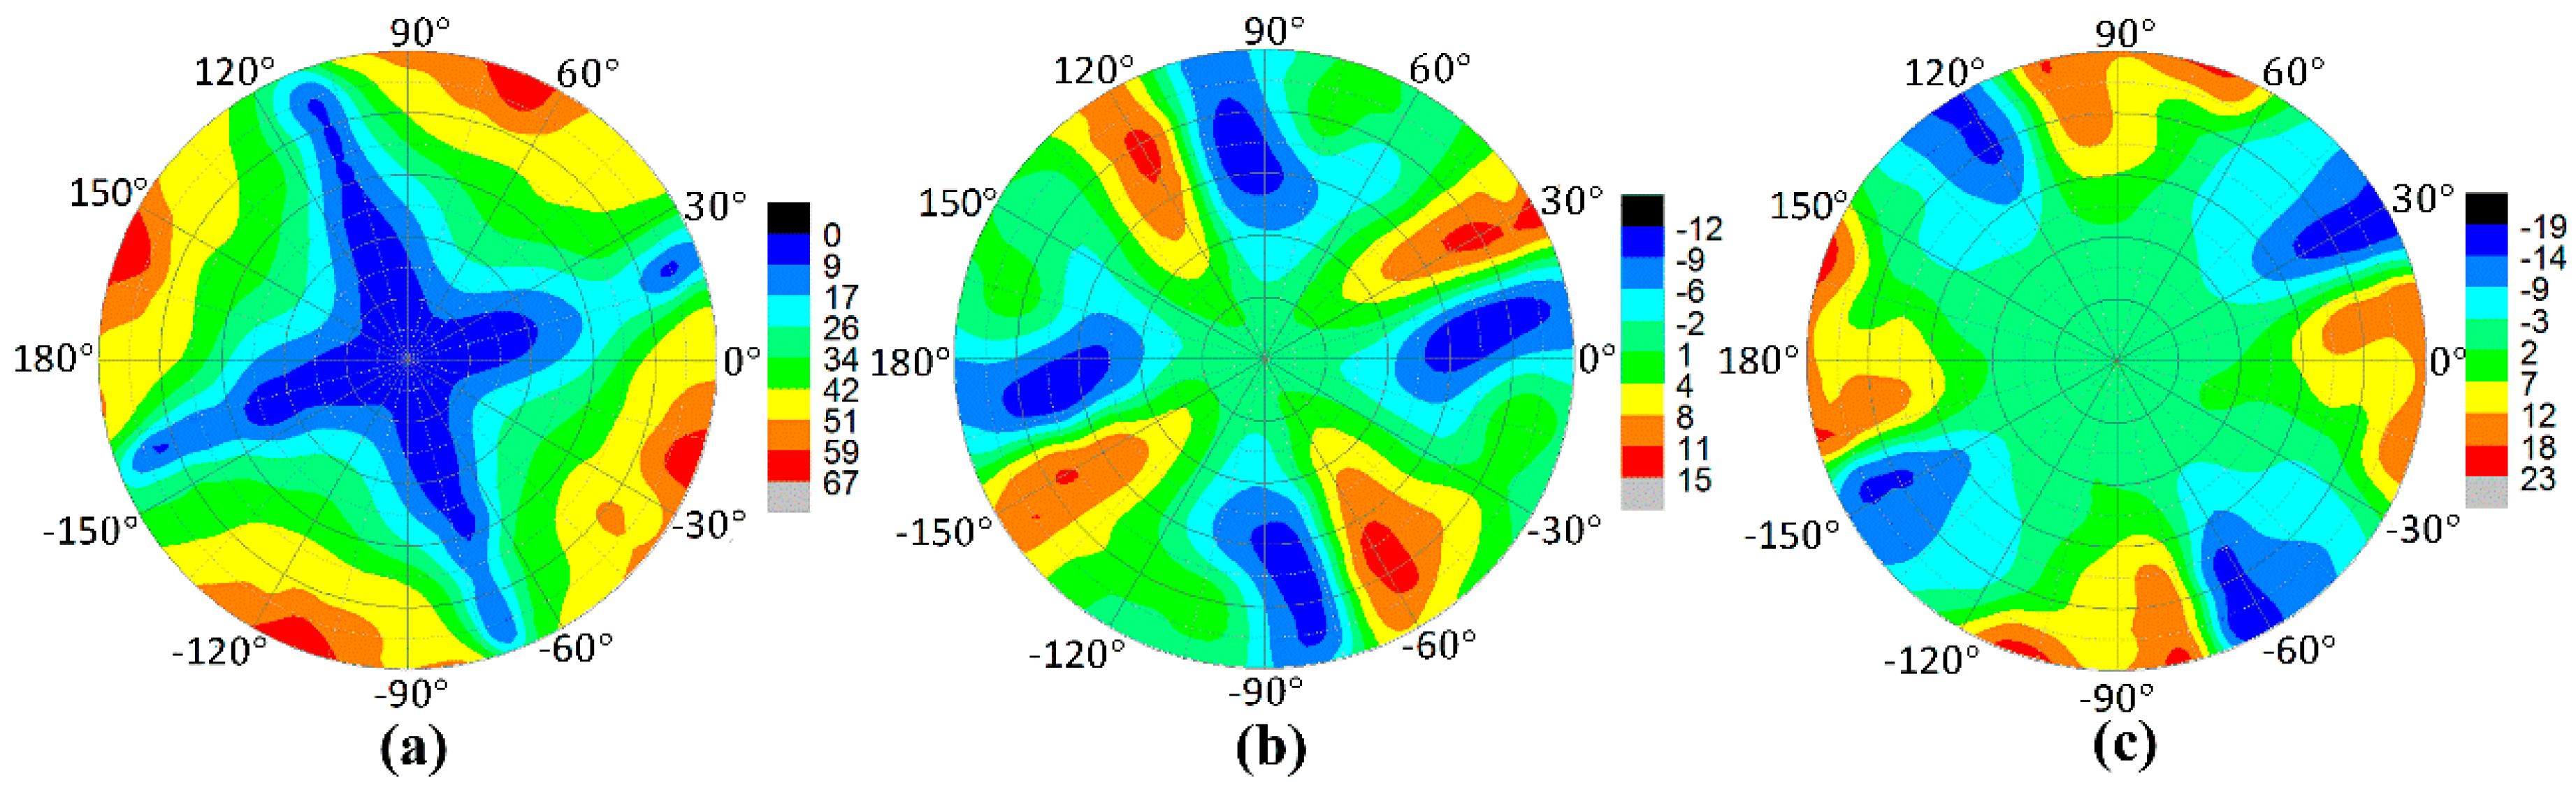
3.1. Distributions of Equivalent Plastic Strain and Mises Stress

Figure 2a,b shows the contour plots of equivalent plastic strain (variable PEEQ used in ABAQUS software 6.9-1) and Mises stress recorded on the top surfaces of (001) aluminum single crystal after N = 1/12 turn of HPT deformation, respectively. A pronounced strain gradient exists on the sample section, with the values increasing gradually from the center of the sample to the edge along the radial direction, as shown in Figure 2a. Moreover, Figure 2a reveals that the strain is non-homogeneously distributed along the circumference of the sample, especially close to the periphery. Four more-strained regions, separated by four-less strained ones with interval angles of 90°, can be observed. The similar strain distribution on the section of the sample has been predicted by simulation and observed experimentally in [18,19,44], which reported that the torsion deformation of a cylinder sample with respect to a [001] axis gave rise to the formation of four zones of intense deformation. As can be seen from Figure 2b, the directional variations of Mises stress along the circumferential direction are significant, and a four-fold symmetry distribution pattern develops. Within one section of the four-fold symmetry, the deformation localization can be obviously observed. These results differ greatly from those obtained through classic finite element simulation, as described in [45,46,47], which gave uniform strain and stress distributions along the circumferential direction of the sample deformed by HPT.

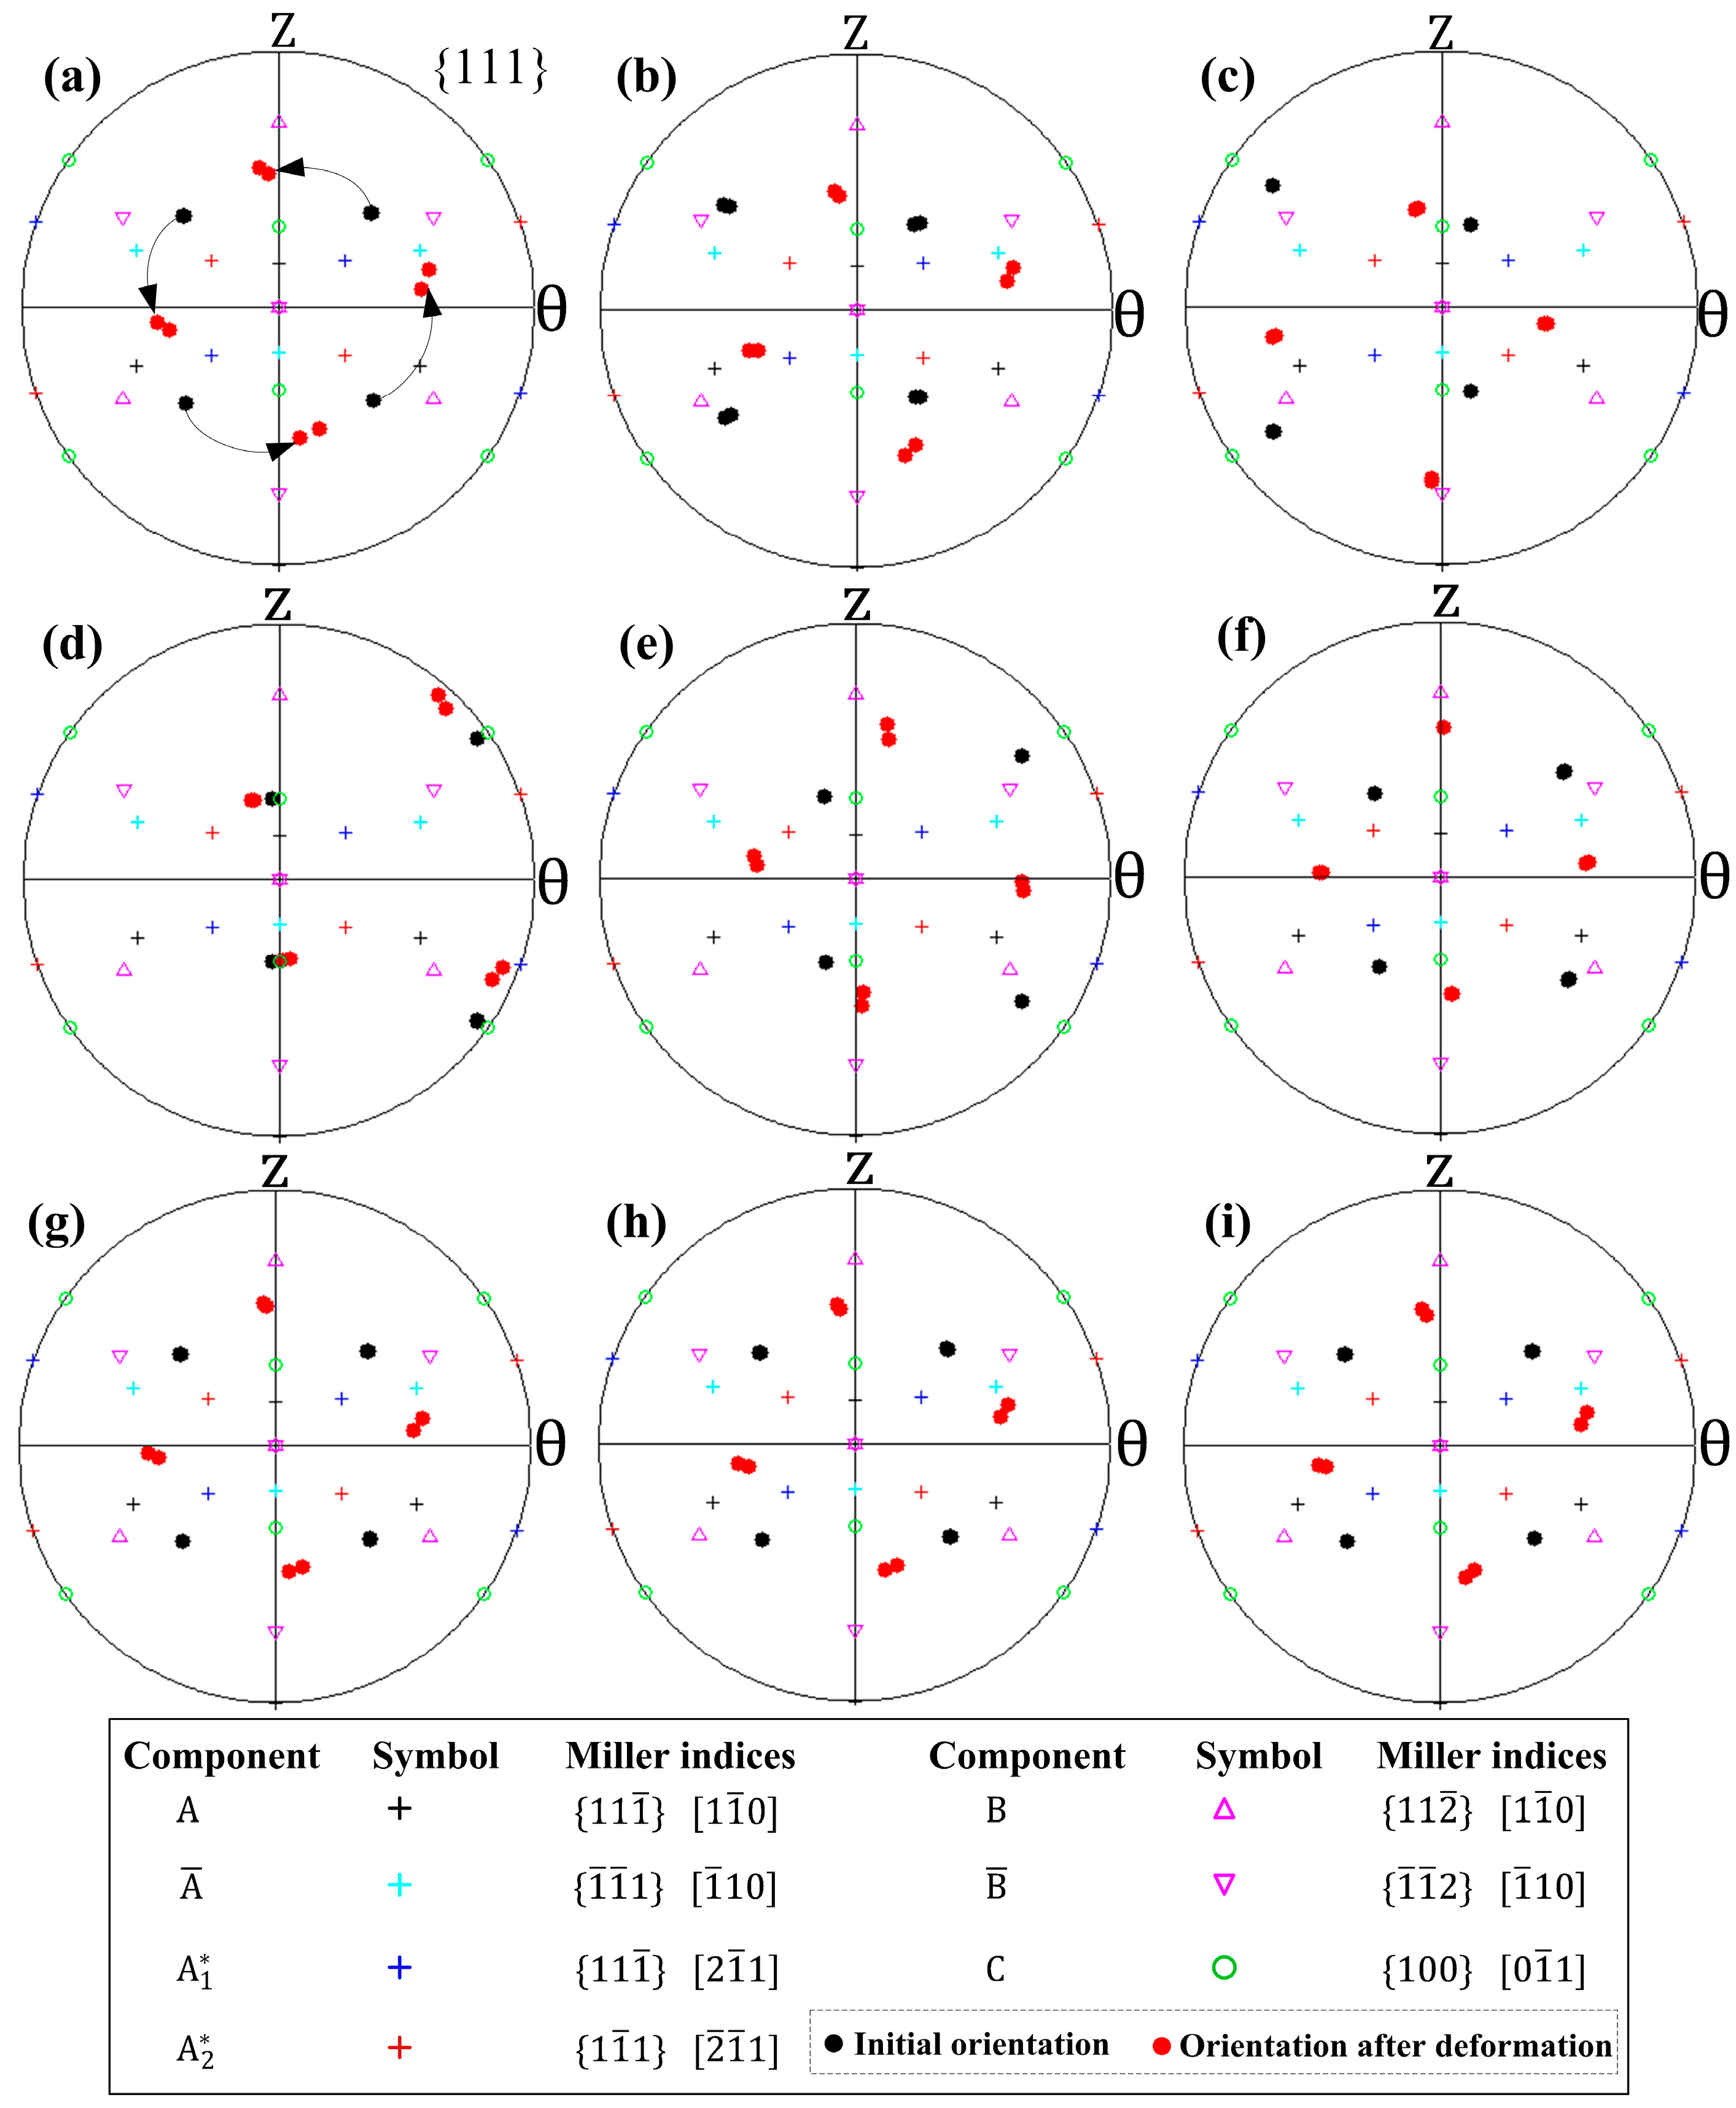
3.2. Texture Development Along the Tangential Direction

Figure 3 shows the texture development in the tangential direction of the initial (001) aluminum single crystal after N = 1/12 turn of HPT deformation in terms of {111} pole figures. The simulated pole figures were obtained from positions on the top surface of the disk sample, which have the same radius (r0/r ~ =1), but different values of φ . All the pole figures are recorded on the θ Z planes, and the locations of the main components of ideal torsion texture are also visualized by different symbols (after [48]). The black dots in the pole figures stand for the initial crystallographic orientations under un-deformed states, while the red dots denote the predicted orientations after deformation. Since HPT deformation is exerted on the small metallic discs, the initial crystallographic orientation changes between individual selected positions; it is close to the cube orientation (Figure 3a) for position φ = 30 ° , gradually approaches the ideal C component as the sample position changes from φ = 15 ° , 0 ° to φ = 18 ° (Figure 3b–d), then rotates gradually away from the ideal C (Figure 3e,f).
It can be seen from Figure 3a–f that the resultant orientations occupy positions deviating significantly from each other in the corresponding pole figures. For instance, the developed orientations have rotated to the rotated cube orientation around the radial axis in an anti-clockwise direction in Figure 3a, while the resulting orientations illustrate only limited divergence from the ideal C component in Figure 3d. The local crystal orientation results obtained in the present work are in good agreement with the previously published reports. Tóth et al. [49,50] reported that in simple shear of cube orientation the orientation change took place solely around the sample radial axis, leading to the rotated cube component. Hafok and Pippan [16] and Arzaghi et al. [51] have examined the texture evolution during HPT, respectively, and they reported that the C orientation could be maintained over a wide range of straining in HPT. Further examination of the pole figure in Figure 3g reveals that the simulated orientation of φ = 60 ° position is very similar with that of position φ = 30 ° . Due to the similarity, additional pole figures of φ = 150 ° and 120 ° were plotted, as shown in Figure 3h,i, respectively. It can be readily seen that the developed orientations recorded at these four different circumferential positions, with an interval of 90 ° about the torsion axis, occupy almost the same positions in the corresponding pole figures. From these observations, it can be concluded that the texture also develops a four-fold symmetry along the sample circumference. Hafok and Pippan [16] experimentally measured the texture evolution in the tangential direction of (001) nickel single crystal deformed by HPT. They also reported the phenomenon of repetition of the texture development and the evolution of a four-fold symmetry at the early stage of HPT deformation, which helps to validate the established CPFEM model of the HPT process.

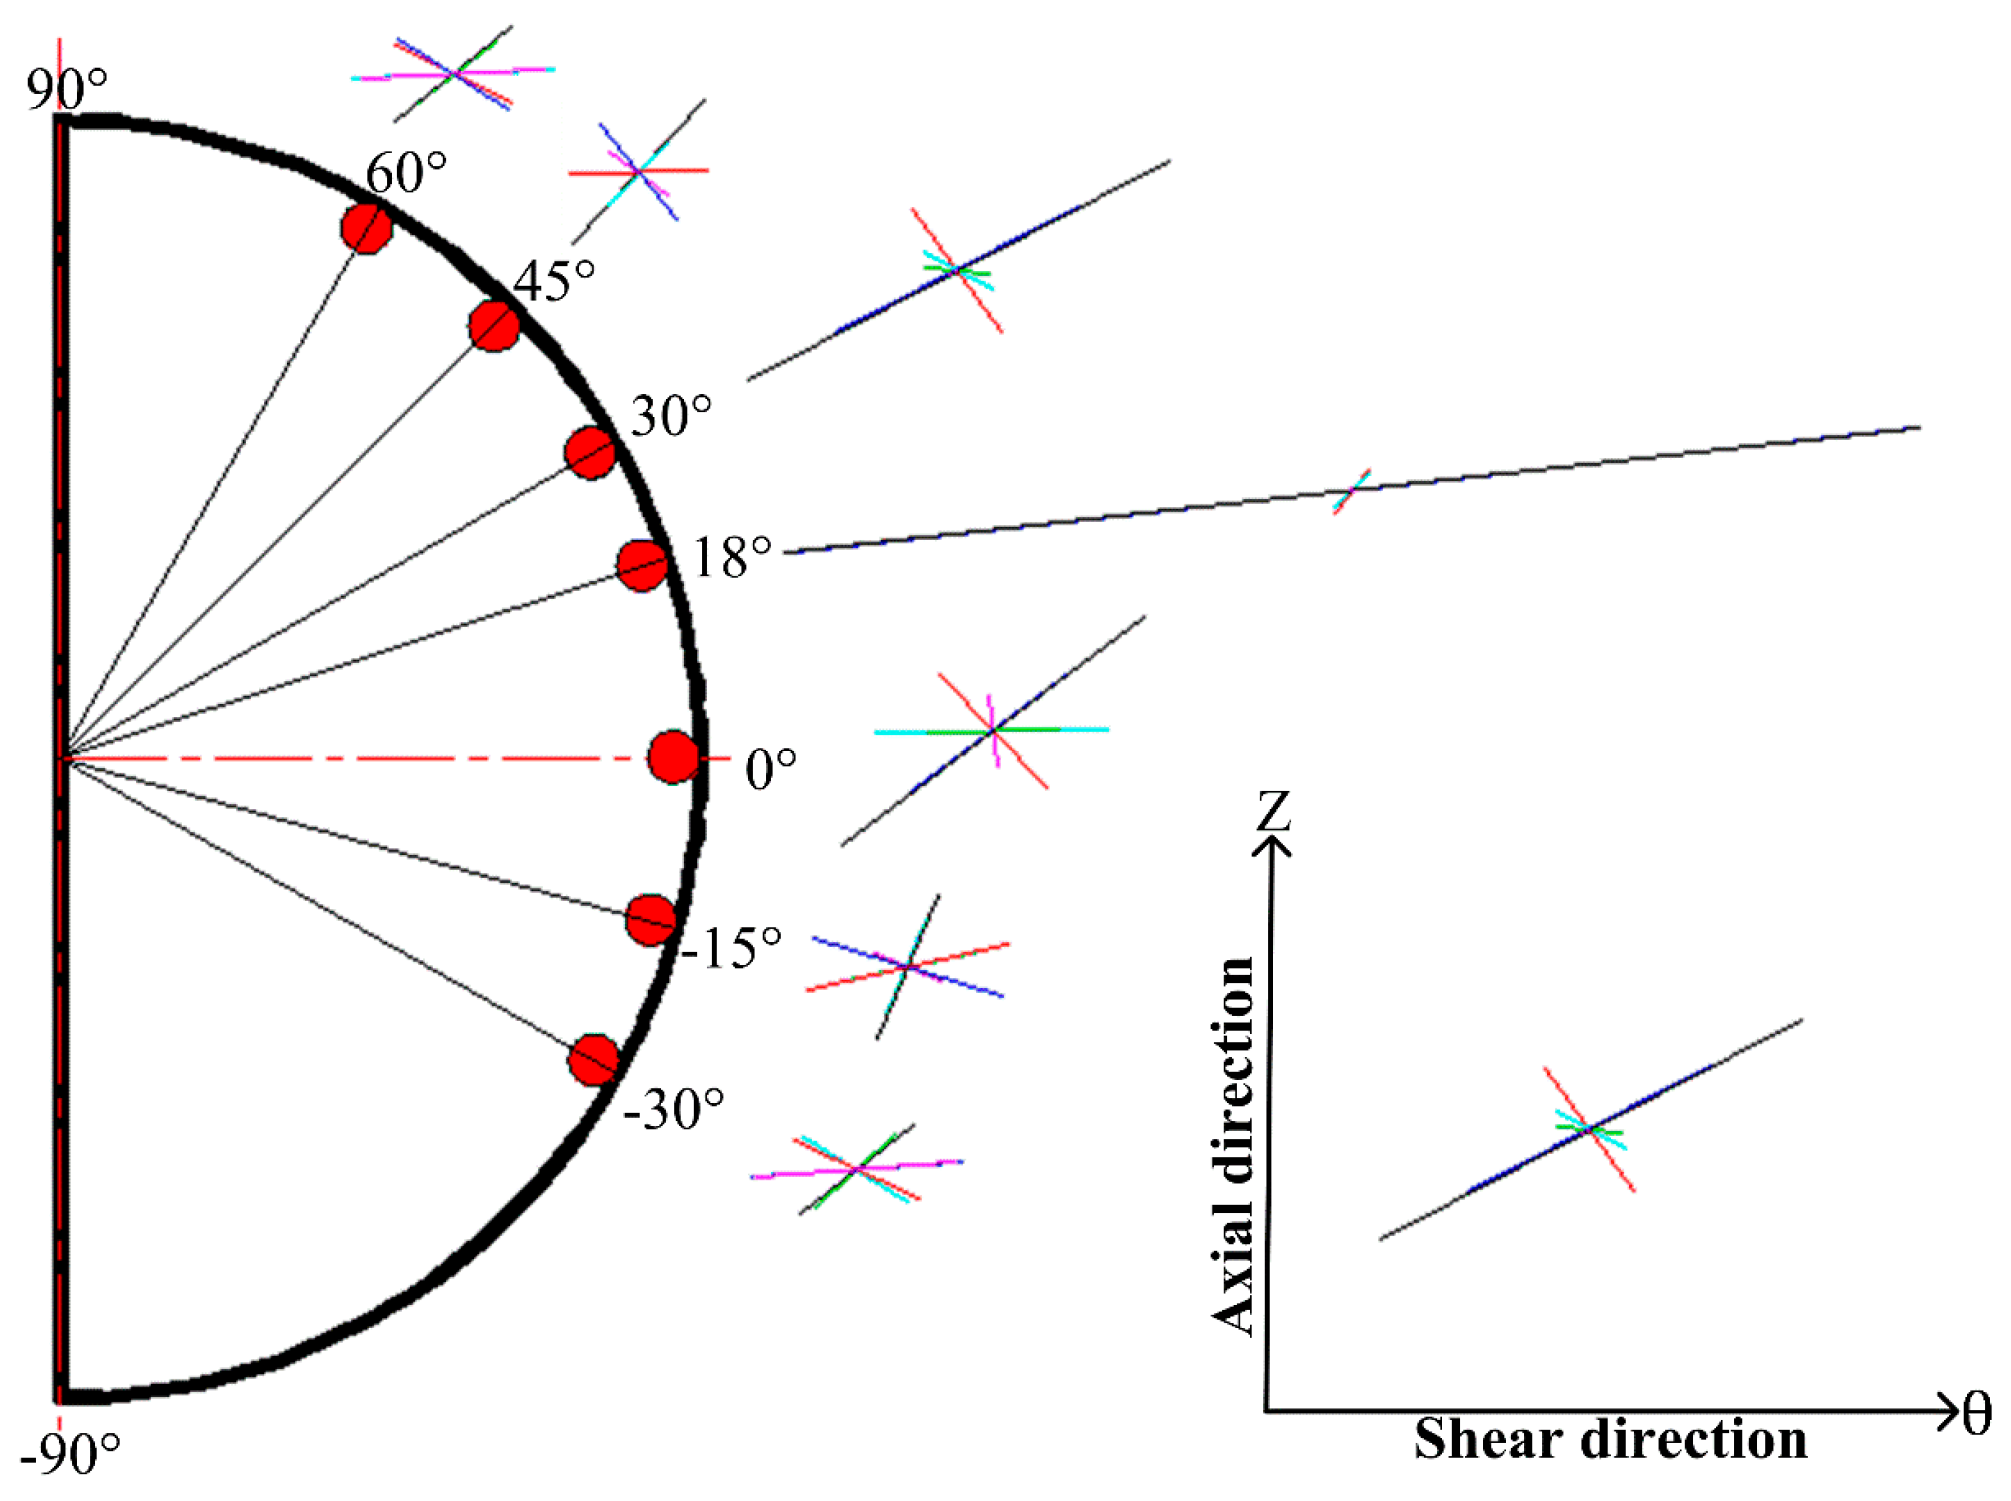
3.3. Lattice Rotation and Slip Trace along the Tangential Direction

Figure 4a–c show the contour maps of lattice rotation angles around the R, θ and Z axes, respectively, recorded on the top surfaces of the initial (001) aluminum single crystal after N = 1/12 turn of HPT deformation. The calculation of the lattice rotation was based on the method proposed by Wert et al. [52]. In all maps, positive values mean anti-clockwise lattice rotations, while negative angles mean clockwise rotations. It can be seen from Figure 4 that the lattice rotates along all three directions. The rotation angles around the R axis are much larger than the other axes. Tóth et al. reported the same finding of predominant single-sense rotations around the sample radial direction in [53,54]. When considering the lattice rotation distribution in Figure 4a, it is apparent that the R-axis lattice rotation also exhibits four-fold symmetry. Within one section of the four-fold symmetry, a careful inspection reveals that the R-axis lattice rotation varies significantly. Sample position φ = 18 ° has the smallest R-axis rotation, at less than 10°. The initial orientation of this particular position is close to the ideal C component, and the resulting orientation in Figure 2d therefore illustrates limited divergence. By contrast, the sample position close to φ = 30 ° has the largest R-axis rotation, at around 65°. This sample position has an initial orientation close to the cube orientation, and HPT deformation has caused the poles to rotate significantly away in Figure 2a. These coincide with the observations that the lattice rotation vectors converge for the components of ideal torsion texture, while for other orientations the opposite is true and divergence occurs [53,54,55].
Figure 5 displays the slip traces at various tangential positions (marked out by red dots, r0/r ~ =1) on the top surface of the initial (001) aluminum single crystal after N = 1/12 turn of HPT deformation. To save space, only the right-half surface is shown here. For each sample position, the six slip systems with the largest magnitudes of accumulative shear strain are presented. The direction of each straight line infers the orientation of the slip trace, while the length of the straight line represents the relative magnitude of the accumulative shear strain. The black, blue, red, cyan, green and magenta colors refer to the slip systems with the first largest magnitude to the sixth largest magnitude of the accumulative shear strain, respectively. All slip trace lines were plotted on the θ –Z planes, as illustrated in the bottom right-hand corner of Figure 5.
As can be seen from Figure 5, the simulated slip traces indicate different activation behaviors of slip systems along the circumferential direction. At φ = 30 ° position, the slips occur simultaneously on different systems, and the accumulative shear strains of the slip systems involved are approximately equal. The six slip systems can be treated as three sets that are all differently oriented. From position φ = 30 ° , through 15 ° and 0 ° , to 18 ° , the magnitudes of the accumulative shear strain corresponding to the first and second largest slip systems tend gradually larger. The slip trace developed at the φ = 18 ° position indicates that the deformation is governed by two dominant slip systems, namely a3 and d3, as defined in Table 2. The accumulative shear strains on the primary two slip systems are significantly large compared with the other slip systems. Furthermore, the slip directions of the two dominant slip systems are parallel with each other, and almost align with the shear direction. When further examining the sample positions from φ = 18 ° to 60 ° , it can be seen that the activated slip develops gradually from a dominant slip to multiple slips. The slip trace obtained at φ = 60 ° position possesses almost the same characteristics as those of φ = 30 ° , indicating the repeatability of the slip trace pattern along the sample circumference.

4. Discussion

In FCC crystals, the four slip planes are arranged symmetrically about the axes for the (001) aligned orientation. In HPT, a thin, disk-shaped sample is commonly adopted. When the sample is cylindrical, the (001) single crystal responds somewhat like a cube, and causes four-fold symmetrical deformation behaviors around the circumference. Within one section of the symmetry, pronounced local deformation variations are revealed, which is a consequence of the relative orientation of the shear applied by HPT, and of the local crystallographic axes. To achieve a deeper understanding of such deformation behaviors, the underlying mechanisms are discussed based on the theory of crystal plasticity.
During the HPT process, the rigid body rotation, Ω , is usually larger than for other SPD techniques due to severe shear deformation. Equation (4) suggests that Ω consists of two components: Ω P , caused by the slip, and Ω , caused by the lattice rotation. The Ω requirement in HPT for different material points along the tangential direction may be met by Ω P and Ω . Moreover, the torsional strain introduced in HPT activates different sets of slip systems for different circumferential positions. The slip mode with two dominant slip systems, as well as the multiple slips mode, in which many systems function together, are revealed in Figure 5.
At some sample positions—for example, φ = 18 ° —the slip mode is dominant slip. The accumulated shear strains are concentrated on the primary two slip systems, and the slip directions coincide with the macroscopic shear direction (see Figure 5). Under such circumstances, they are capable of generating a sufficiently large overall plastic spin ( Ω P ) to almost fully satisfy the requirement for the whole rigid body rotation ( Ω ). Therefore, the lattice rotation ( Ω ) is nearly zero at the φ = 18 ° position (see Figure 4a), leading to the near-initial orientation after deformation (see the pole figure in Figure 3d). The dominant slip is basically not influenced by other slip systems, and the material flows easily on the shear plane. Thus, relatively limited macroscopic strain hardening occurs at the φ = 18 ° position in Figure 2b.
For certain sample positions, such as φ = 30 ° , a multiple-slips mode can also be activated. The activated systems possess almost the same amount of accumulated shear strain, but orient along different directions (see Figure 5). Each of the slip systems of interest produces a rotation component, and as a result, the overall glide rotation ( Ω P ) is relatively small. The lattice must rotate to generate a large Ω to compensate the difference between Ω and Ω P , as shown at φ = 30 ° in Figure 4a, which leads to a considerable change in crystallographic orientation (see the pole figure in Figure 3a. The simultaneously activated slip systems interact with each other, and hinder the flow of the material. Therefore, strong macroscopic strain-hardening takes place at the φ = 30 ° position in Figure 2b.
At other sample positions along the circumferential direction, the slip conditions are somewhere in between these two slip modes of dominant slip and multiple slips. Accordingly, there are moderate increases in Mises stress, as shown in Figure 2b.

5. Conclusions

A CPFEM model integrated with Bassani and Wu hardening modulus has been successfully implemented to investigate the anisotropic plastic behavior of aluminum single crystal in HPT. The macroscopic equivalent plastic strain and Mises stress, crystallographic orientation evolution, lattice rotation and slip activities at the crystal level of various tangential positions have been predicted and analyzed. The main conclusions are summarized as follows.
  • The predicted equivalent plastic strain and Mises stress are directionally dependent along the sample circumference, and the development of a four-fold symmetry pattern is found on the sample surface.
  • The R-axis lattice rotations, slip traces, and the resulting crystallographic orientations change significantly along the circumferential direction, and also develop the feature of four-fold symmetry.
  • The dominant slip and multi-slip conditions are revealed along the sample circumference. It has been found that the differences in slip system activation contribute significantly to the anisotropic plastic behavior of single crystal during the HPT process.

Acknowledgments

Peitang Wei would like to acknowledge the financial support from China Scholarship Council. Guanyu Deng acknowledges Australian Academy of Science (AAS) and Japan Society for the Promotion of Science (JSPS) for awarding him an international fellowship. The authors acknowledge the fundamental research funds supported by Chongqing Research Program of Basic Research and Frontier Technology (No. cstc2017jcyjAX0101) and the Central Universities Project (No. 106112016CDJXY110005, 0903005203365, and 106112017CDJQJ118847).

Author Contributions

P.W. proposed the idea, performed the simulations, and analyzed the data; C.L. and H.L. analyzed the data and discussed the results; L.S., G.D. and K.T. contributed to the results discussion; All authors contributed to the document written and preparation of publication material.

Conflicts of Interest

The authors declare no conflict of interest.

References

  1. Langdon, T.G. Twenty-five years of ultrafine-grained materials: Achieving exceptional properties through grain refinement. Acta Mater. 2013, 61, 7035–7059. [Google Scholar] [CrossRef]
  2. Estrin, Y.; Vinogradov, A. Extreme grain refinement by severe plastic deformation: A wealth of challenging science. Acta Mater. 2013, 61, 782–817. [Google Scholar] [CrossRef]
  3. Bridgman, P.W. On torsion combined with compression. J. Appl. Phys. 1943, 14, 273. [Google Scholar] [CrossRef]
  4. Deng, G.; Lu, C.; Su, L.; Tieu, A.K.; Li, J.; Liu, M.; Zhu, H.; Liu, X. Influence of outer corner angle (OCA) on the plastic deformation and texture evolution in equal channel angular pressing. Comput. Mater. Sci. 2014, 81, 79–88. [Google Scholar] [CrossRef]
  5. Su, L.; Lu, C.; Deng, G.; Tieu, A.K.; Sun, X. Microstructure and mechanical properties of 1050/6061 laminated composite processed by accumulative roll bonding. Rev. Adv. Mater. Sci. 2013, 33, 33–37. [Google Scholar]
  6. Zhilyaev, A.; Langdon, T. Using high-pressure torsion for metal processing: Fundamentals and applications. Prog. Mater. Sci. 2008, 53, 893–979. [Google Scholar] [CrossRef]
  7. Edalati, K.; Horita, Z. A review on high-pressure torsion (HPT) from 1935 to 1988. Mater. Sci. Eng. A 2015, 652, 325–352. [Google Scholar] [CrossRef]
  8. Edalati, K.; Horita, Z. High-pressure torsion of pure metals: Influence of atomic bond parameters and stacking fault energy on grain size and correlation with hardness. Acta Mater. 2011, 59, 6831–6836. [Google Scholar] [CrossRef]
  9. Valiev, R.Z.; Zhilyaev, A.P.; Langdon, T.G. Hpt processing of metals, alloys, and composites. In Bulk Nanostructured Materials; John Wiley & Sons, Inc.: Hoboken, NJ, USA, 2013; pp. 88–151. [Google Scholar]
  10. Astafurova, E.G.; Tukeeva, M.S.; Maier, G.G.; Melnikov, E.V.; Maier, H.J. Microstructure and mechanical response of single-crystalline high-manganese austenitic steels under high-pressure torsion: The effect of stacking-fault energy. Mater. Sci. Eng. A 2014, 604, 166–175. [Google Scholar] [CrossRef]
  11. Khlebnikova, Y.V.; Egorova, L.Y.; Pilyugin, V.P.; Suaridze, T.R.; Patselov, A.M. Evolution of the structure of an α-titanium single crystal during high-pressure torsion. Tech. Phys. 2015, 60, 1005–1013. [Google Scholar] [CrossRef]
  12. Solov’eva, Y.V.; Pilyugin, V.P.; Starenchenko, S.V.; Tolmachev, T.P.; Starenchenko, V.A. Structure and mechanical properties of ni3ge single crystals under severe plastic deformation and heating. Bull. Russ. Acad. Sci. Phys. 2017, 81, 311–314. [Google Scholar] [CrossRef]
  13. Kashihara, K.; Tsujimoto, Y.; Terada, D.; Tsuji, N. Texture evolution in {112} <111> aluminum single crystals processed by severe plastic deformation. Mater. Charact. 2013, 75, 129–137. [Google Scholar] [CrossRef]
  14. Smirnova, N.A.; Levit, V.I.; Pilyugin, V.I.; Kuznetsov, R.I.; Davydova, L.S.; Sazonova, V.A. Evolution of structure of FCC Single crystals during strong plastic deformation. Phys. Met. Metallogr. 1986, 61, 127–134. [Google Scholar]
  15. Smirnova, N.A.; Levit, V.I.; Degtyarev, M.V.; Gundyrev, V.M.; Pilyugin, V.P.; Davydova, L.S. Development of orientational instability in FCC Single crystals at high degrees of plastic deformation. Phys. Met. Metallogr. 1988, 65, 141–151. [Google Scholar]
  16. Hafok, M.; Pippan, R. High-pressure torsion applied to nickel single crystals. Philos. Mag. 2008, 88, 1857–1877. [Google Scholar] [CrossRef]
  17. Pippan, R.; Scheriau, S.; Taylor, A.; Hafok, M.; Hohenwarter, A.; Bachmaier, A. Saturation of fragmentation during severe plastic deformation. Annu. Rev. Mater. Res. 2010, 40, 319–343. [Google Scholar] [CrossRef]
  18. Méric, L.; Cailletaud, G. Single crystal modeling for structural calculations: Part 2—Finite element implementation. Appl. Mech. Mater. 1991, 113, 171–182. [Google Scholar] [CrossRef]
  19. Nouailhas, D.; Cailletaud, G. Tension-torsion behavior of single-crystal superalloys: Experiment and finite element analysis. Int. J. Plast. 1995, 11, 451–470. [Google Scholar] [CrossRef]
  20. Kaluza, M.; Le, K.C. On torsion of a single crystal rod. Int. J. Plast. 2011, 27, 460–469. [Google Scholar] [CrossRef]
  21. Le, K.C.; Piao, Y. Distribution of dislocations in twisted bars. Int. J. Plast. 2016, 83, 110–125. [Google Scholar] [CrossRef]
  22. Wei, P.; Lu, C.; Tieu, K.; Su, L.; Deng, G.; Huang, W. A study on the texture evolution mechanism of nickel single crystal deformed by high pressure torsion. Mater. Sci. Eng. A 2017, 684, 239–248. [Google Scholar] [CrossRef]
  23. Wenk, H.R.; Van Houtte, P. Texture and anisotropy. Rep. Prog. Phys. 2004, 67, 1367–1428. [Google Scholar] [CrossRef]
  24. Roters, F.; Eisenlohr, P.; Hantcherli, L.; Tjahjanto, D.D.; Bieler, T.R.; Raabe, D. Overview of constitutive laws, kinematics, homogenization and multiscale methods in crystal plasticity finite-element modeling: Theory, experiments, applications. Acta Mater. 2010, 58, 1152–1211. [Google Scholar] [CrossRef]
  25. Asaro, R.J. Crystal plasticity. J. Appl. Mech. 1983, 50, 921–934. [Google Scholar] [CrossRef]
  26. Ashby, M.F. The deformation of plastically non-homogeneous materials. Philos. Mag. 1970, 21, 399–424. [Google Scholar] [CrossRef]
  27. Taylor, G.I. The mechanism of plastic deformation of crystals. Part I. Theoretical. Proc. R. Soc. London, Ser. A Math. Phys. Eng. Sci. 1934, 145, 362–387. [Google Scholar] [CrossRef]
  28. Taylor, G.I. The mechanism of plastic deformation of crystals. Part II. Comparison with observations. Proc. R. Soc. A Math. Phys. Eng. Sci. 1934, 145, 388–404. [Google Scholar] [CrossRef]
  29. Hutchinson, J.W. Elastic-plastic behaviour of polycrystalline metals and composites. Proc. R. Soc. A Math. Phys. Eng. Sci. 1970, 319, 247–272. [Google Scholar] [CrossRef]
  30. Peirce, D.; Asaro, R.J.; Needleman, A. An analysis of nonuniform and localized deformation in ductile single crystals. Acta Metall. 1982, 30, 1087–1119. [Google Scholar] [CrossRef]
  31. Wu, T.Y.; Bassani, J.L.; Laird, C. Latent hardening in single crystals I. Theory and experiments. Proc. R. Soc. A Math. Phys. Eng. Sci. 1991, 435, 1–19. [Google Scholar] [CrossRef]
  32. Bassani, J.L.; Wu, T.Y. Latent hardening in single crystals II. Analytical characterization and predictions. Proc. R. Soc. A Math. Phys. Eng. Sci. 1991, 435, 21–41. [Google Scholar] [CrossRef]
  33. Wu, P.D.; Neale, K.W.; Van, D.G.E. Simulation of the behaviour of fcc polycrystals during reversed torsion. Int. J. Plast. 1996, 12, 1199–1219. [Google Scholar] [CrossRef]
  34. Lin, G.; Havner, K.S. A Comparative study of hardening theories in torsion using the taylor polycrystal model. Int. J. Plast. 1996, 12, 695–718. [Google Scholar] [CrossRef]
  35. Kumar, A.V.; Yang, C. Study of work hardening models for single crystals using three dimensional finite element analysis. Int. J. Plast. 1999, 15, 737–754. [Google Scholar] [CrossRef]
  36. Siddiq, A.; Schmauder, S. Crystal plasticity parameter identification procedure for single crystalline material during deformation. J. Comput. Appl. Mech. 2006, 7, 1–15. [Google Scholar]
  37. Lu, C.; Deng, G.Y.; Tieu, A.K.; Su, L.H.; Zhu, H.T.; Liu, X.H. Crystal plasticity modeling of texture evolution and heterogeneity in equal channel angular pressing of aluminum single crystal. Acta Mater. 2011, 59, 3581–3592. [Google Scholar] [CrossRef]
  38. Deng, G.Y.; Lu, C.; Su, L.H.; Liu, X.H.; Tieu, A.K. Modeling texture evolution during ECAP of copper single crystal by crystal plasticity FEM. Mater. Sci. Eng. A 2012, 534, 68–74. [Google Scholar] [CrossRef]
  39. Franciosi, P.; Berveiller, M.; Zaoui, A. Latent hardening in copper and aluminium single crystals. Acta Metall. 1980, 28, 273–283. [Google Scholar] [CrossRef]
  40. Akef, A.; Driver, J.H. Orientation splitting of cube-oriented face-centred cubic crystals in plane strain compression. Mater. Sci. Eng. A 1991, 132, 245–255. [Google Scholar] [CrossRef]
  41. Liu, Q.; Hansen, N.; Maurice, C.; Driver, J. Heterogeneous microstructures and microtextures in cube-oriented al crystals after channel die compression. Metall. Mater. Trans. A 1998, 29, 2333–2344. [Google Scholar] [CrossRef]
  42. Liu, M.; Lu, C.; Tieu, K.A.; Peng, C.T.; Kong, C. A combined experimental-numerical approach for determining mechanical properties of aluminum subjects to nanoindentation. Sci. Rep. 2015, 5, 15072. [Google Scholar] [CrossRef] [PubMed]
  43. Si, L.Y.; Lu, C.; Huynh, N.N.; Tieu, A.K.; Liu, X.H. Simulation of rolling behaviour of cubic oriented Al single crystal with crystal plasticity fem. J. Mater. Process. Technol. 2008, 201, 79–84. [Google Scholar] [CrossRef]
  44. Quilici, S.; Forest, S.; Cailletaud, G. On size effects in torsion of multi- and polycrystalline specimens. J. Phys. IV 1998, 8, Pr8-325–Pr8-332. [Google Scholar]
  45. Yoon, S.C.; Horita, Z.; Kim, H.S. Finite element analysis of plastic deformation behavior during high pressure torsion processing. J. Mater. Process. Technol. 2008, 201, 32–36. [Google Scholar] [CrossRef]
  46. Figueiredo, R.B.; Cetlin, P.R.; Langdon, T.G. Using finite element modeling to examine the flow processes in quasi-constrained high-pressure torsion. Mater. Sci. Eng. A 2011, 528, 8198–8204. [Google Scholar] [CrossRef]
  47. Wei, P.; Lu, C.; Tieu, K.; Deng, G.; Wang, H.; Kong, N. Finite element analysis of high pressure torsion. Steel Res. Int. 2013, 84, 1246–1251. [Google Scholar] [CrossRef]
  48. Montheillet, F.; Cohen, M.; Jonas, J.J. Axial stresses and texture development during the torsion testing of Al, Cu and α-Fe. Acta Metall. 1984, 32, 2077–2089. [Google Scholar] [CrossRef]
  49. Tóth, L.S.; Jonas, J.J. Analytic prediction of texture and length changes during free-end torsion. Texture Stress Microstruct. 1989, 10, 195–209. [Google Scholar] [CrossRef]
  50. Skrotzki, W.; Tóth, L.S.; Klöden, B.; Brokmeier, H.G.; Arruffat-Massion, R. Texture after ecap of a cube-oriented ni single crystal. Acta Mater. 2008, 56, 3439–3449. [Google Scholar] [CrossRef]
  51. Arzaghi, M.; Fundenberger, J.J.; Toth, L.S.; Arruffat, R.; Faure, L.; Beausir, B.; Sauvage, X. Microstructure, texture and mechanical properties of aluminum processed by high-pressure tube twisting. Acta Mater. 2012, 60, 4393–4408. [Google Scholar] [CrossRef]
  52. Wert, J.A.; Liu, Q.; Hansen, N. Dislocation boundary formation in a cold-rolled cube-oriented al single crystal. Acta Mater. 1997, 45, 2565–2576. [Google Scholar] [CrossRef]
  53. Toth, L.S.; Gilormini, P.; Jonas, J.J. Effect of rate sensitivity on the stability of torsion textures. Acta Metall. 1988, 36, 3077–3091. [Google Scholar] [CrossRef]
  54. Tóth, L.S.; Neale, K.W.; Jonas, J.J. Stress response and persistence characteristics of the ideal orientations of shear textures. Acta Metall. 1989, 37, 2197–2210. [Google Scholar] [CrossRef]
  55. Barnett, M.R.; Montheillet, F. The generation of new high-angle boundaries in aluminium during hot torsion. Acta Mater. 2002, 50, 2285–2296. [Google Scholar] [CrossRef]
Figure 1. Three-dimensional HPT model: (a) configuration of the sample and coordinate systems, (b) meshes of the sample.
Crystals 07 00362 g001
Figure 2. The distributions of (a) equivalent plastic strain and (b) Mises stress on the surfaces of (001) aluminum single crystal after N = 1/12 turn of HPT deformation.
Crystals 07 00362 g002
Figure 3. The predicted {111} pole figures of the (001) aluminum single crystal in the tangential direction after N = 1/12 turn of HPT deformation. The pole figure were recorded at radius (r0/r ~ =1) with φ = (a) 30 ° , (b) 15 ° , (c) 0 ° , (d) 18 ° , (e) 30 ° , (f) 45 ° , (g) 60 ° , (h) 150 ° and (i) 120 ° .
Crystals 07 00362 g003
Figure 4. Lattice rotation angles recorded on the surfaces of the initial (001) aluminum single crystal after N = 1/12 turn of HPT deformation: (a) around R axis, (b) around θ axis and (c) around Z axis.
Crystals 07 00362 g004
Figure 5. Slip traces of various tangential positions on the surface of the initial (001) aluminum single crystal after N = 1/12 turn of HPT deformation.
Crystals 07 00362 g005
Table 1. Parameters in the constitutive model.
n γ 0 ˙ (1/s) h 0 (MPa) h s (MPa) τ 1 (MPa) τ 0 (MPa) γ 0 α 1 α 2 α 3 α 4 α 5 q
3000.00011000.016.360.0011.751.751.7522.251
Table 2. Notations of slip systems for FCC crystals.
Systema1a2a3b1b2b3c1c2c3d1d2d3
Slip plane(111)(111)(111)( 1 ¯ 11)( 1 ¯ 11)( 1 ¯ 11)(1 1 ¯ 1)(1 1 ¯ 1)(1 1 ¯ 1)(11 1 ¯ )(11 1 ¯ )(11 1 ¯ )
Slip direction[0 1 ¯ 1][10 1 ¯ ][ 1 ¯ 10][101][110][ 0 1 ¯ 1][011][110][10 1 ¯ ][011][101][ 1 ¯ 10]

