
Chemical Crystallography at the Advanced Light Source


1
Advanced Light Source, Lawrence Berkeley National Laboratory, Berkeley, CA 94720, USA
2
School of Chemistry and Centre for Science at Extreme Conditions, The University of Edinburgh, King’s Buildings, West Mains Road, Edinburgh EH9 3JJ, UK
3
Earth & Planetary Sciences, University of California, Santa Cruz, CA 95064, USA
*
Author to whom correspondence should be addressed.
Crystals 2017, 7(12), 382; https://doi.org/10.3390/cryst7120382
Submission received: 3 November 2017
/
Revised: 11 December 2017
/
Accepted: 12 December 2017
/
Published: 18 December 2017
(This article belongs to the Special Issue Advances in Synchrotron Radiation Applications for Crystal Structure Studies)
Abstract
:Chemical crystallography at synchrotrons was pioneered at the Daresbury SRS station 9.8. The chemical crystallography beamlines at the Advanced Light Source seek to follow that example, with orders of magnitude more flux than a lab source, and various in situ experiments. This article attempts to answer why a chemist would require synchrotron X-rays, to describe the techniques available at the ALS chemical crystallography beamlines, and place the current facilities in a historical context.

1. Introduction
Chemists have been benefiting from the precepts of crystallography since the time of the Braggs [1,2]. Initially diffraction was most helpful in confirming the molecular structure through unit cell determination, and the accompanying information on the corresponding crystal density [3]. By the 1930s and 1940s, actual structural determinations from intensity data were achievable [4], thanks to the work of Beevers and Lipson [5]. These were highly valued by chemists for their structural information, but were the product of painstaking work done only by dedicated crystallographers. Further improvements, over the following decades, in all facets of the experiment including data collection [6], analysis [7], structure solution [8], and computing in general led to crystallography being widely seen as an accessible and definitive technique for structural analysis. No longer the singular analysis featured in a publication, crystallography became another tool for the synthetic chemist and material scientist.
The Cambridge Structural Database has borne witness to extreme growth in the number of published crystal structures. Founded in 1965, the CSD has grown to over 875,000 curated structures, and from these structures comes a wealth of information on crystallography. Two prominent trends appear upon scrutiny of the CSD, an increase in complexity and an increase in resolved disorder. Among the data published in its inaugural year, the average structure submitted to the CSD had 23.7 atoms with 3D coordinates; in 2015 the average structure had 68.9 atoms. In 1965, only 5% of the structures contained resolved disorder, but in 2015, that number had increased to 30% [9]. Both complexity and disorder can be implicated in the failure of crystals to diffract sufficiently [10], which can stall a synthetic project.
Protein crystallographers, who have long been familiar with the negative implications of complexity and disorder, began to compensate for weak diffraction with the use of synchrotron X-rays in the late 1970s [11,12]. These original synchrotron X-ray experimental stations, known as beamlines, operated in a parasitic mode, harvesting the resulting light from particle physics experiments for which the synchrotron was designed and used. The demand for more intense X-ray sources led to the development of dedicated storage ring facilities, where a synchrotron accelerates the electrons to relativistic speeds, which are sustained with radio frequency pulses [13]. These facilities provided a more reliable X-ray beam to the experimentalists at the beamlines, known colloquially as users. One of the first of these facilities, designed for and dedicated to providing stable beams to users, and not particle physicists, was the Synchrotron Radiation Source (SRS) at Daresbury Labs (UK), which opened to users in 1980.
At the SRS and the other user-centreed storage ring facilities emergent at the time, protein crystallography beamlines became a universal fixture. Chemists would collect data on these beamlines, but they would often be stymied because the instruments were not optimised for typical small molecule data collection methods. Protein crystallography beamlines are optimised for longer wavelengths (typically 1 Å, with a functional range between 0.7 and 2 Å) and have historically featured only a single axis of rotation (ϕ), with no detector rotation available [14]. The resulting data on a chemical compound would be far more intense, but would have low completeness, and potentially problematic intensity data due to the large oblique correction required [15]. This situation drove a group of U.K. chemists and chemical crystallographers, led by Bill Clegg and Richard Catlow, to push for a beamline dedicated to chemical crystallography. The result was Station 9.8 [16], which was a transformative tool for the chemical crystallography community [17]. In addition to increasing the success rate of small and weakly diffracting crystals [18,19], the higher flux provided by Station 9.8 encouraged a growth of in situ techniques, where structural changes in response to stimuli could be observed. High pressure [20], high and low temperature, photocrystallographic [21], and environmental gas studies were performed at 9.8, and were more successful because the increased flux allowed for smaller samples, which were more likely to survive the experiment. After 28 years of providing X-rays to experiments and inspiration to younger, brighter synchrotrons, the SRS closed its shutters for the last time in August 2008. The pioneering work done at Station 9.8 has been carried on by other chemical crystallography beamlines around the world: I711 at Max-II [22], ChemMatCARS at the Advanced Photon Source, I19 at Diamond [23], and, most pertinent to this publication, 11.3.1 at the Advanced Light Source. Within this review, we will discuss the chemical crystallography capabilities and in situ diffraction experiments available at the Advanced Light Source, primarily on beamline 11.3.1. We will also discuss the future home of chemical crystallography at the ALS, beamline 12.2.1.
2. Benefits of Synchrotron Radiation for Chemical Crystallography
Early adopters of synchrotron radiation explored how these X-ray sources, with multiple orders of magnitude greater flux than those from a tube source [11], could affect crystallography. Bachman et al. quantified the relative scattering power of a crystal [24], defined here as S, using the following equation:
Marjorie Harding treated this S term as a coefficient to produce the following equation, which is a reasonable approximation of a crystal’s ability to diffract, , with respect to varying incident intensity, [10]:
The Lorentz correction, L, is equal to , and can be treated as ; therefore, we can use the following equation to approximate relative diffraction intensities:
The diffracted intensity, , is proportional to the wavelength squared; this is already exploited by any lab system with a Cu-Kα sealed tube. The common crystallographer refrain of “grow a bigger crystal” is a factor in this relationship, but access to synchrotron radiation, with the multiple order of magnitude improvements of X-ray flux, is likely to be more helpful (. What is most enlightening is the relationship between unit cell contents () and the volume of the unit cell. The diffracted intensity is inversely related to the square of the unit cell volume, and directly related to the squared electron sum within the unit cell, both of which are immutable properties of a sample crystal. This relationship indicates that many of the chemically interesting compounds being studied by crystallography, such as metal–organic frameworks (MOFs), are immediately at a disadvantage, which can be most easily addressed with more intensity from a synchrotron beamline.
The monochromators employed on most modern diffraction beamlines use Bragg diffraction from one crystal face to select the energy, then a second crystal face to direct the monochromated beam parallel to the incoming beam, but vertically displaced, to avoid white beam contamination [25]. The choice of monochromator crystal dictates characteristics of the resulting X-ray beam: each Bragg reflection has an intensity and rocking width that will affect the energy resolution and flux at the sample [26]. Many diffraction beamlines have chosen Si(111) as a good compromise between flux intensity and energy resolution. The resolving power of Si(111), defined as E/ΔE, is 7000, which is nearly two orders of magnitude better than that of some X-ray tube sources due to Ka1-Ka2 splitting, e.g., Mo = 165. Diffraction peaks from X-rays monochromated in this way are sharper due to this narrow energy bandwidth, which can be advantageous when dealing with highly mosaic and/or twinned crystals.
Synchrotron radiation was initially attractive because of the high photon flux available; however, there are other useful characteristics. Most obvious among these is the ability to choose a wavelength from a wide spectrum. As shown above, increasing the experimental wavelength can improve a poorly diffracting crystal, but absorption also increases with wavelength, therefore access to a continuum X-ray source allows the experimenter to optimize their sample as well as their desired experiment. Crystals composed of low Z elements, such as organic compounds, will have negligible absorption and will diffract more strongly at longer wavelengths. Compounds containing high-Z elements will have appreciable absorption, and will benefit from the use of small crystals at shorter wavelengths. The benefits of synchrotron chemical crystallography for small and weakly diffracting crystals have been nicely reviewed in [27]. The presence of absorption edges within the X-ray regime in many atomic scattering factors can be utilized to mitigate sample absorption, but also to differentiate between elements with a similar atomic numbers [28]. Experimental considerations can also influence the wavelength choice. A twinned crystal or a crystal with a large unit cell can benefit from an increase in wavelength due to the better spatial resolution of reflections on the detector [1,2]. Some in situ experiments, especially high-pressure, require the crystal to be loaded in an apparatus that restricts the solid angle of diffraction; decreasing the wavelength effectively contracts the reciprocal space and increases the number of reflections present in the same angular range [29].
3. Beamline Descriptions
3.1. Beamline 11.3.1
The photon flux to beamline 11.3.1 is provided by a standard ALS bending magnet with a field strength of 1.27 T. The optical design of 11.3.1 is extremely simple, with only two optical components: a monochromator followed by a mirror. This design has been described in detail previously, but a brief overview is provided here [30]. The monochromator is a silicon(111) channel-cut design. This design has been explained in depth previously [31], and has also been implemented at the Swiss Light source [32]. After the monochromator, there are horizontal slits, followed by the toroidal focusing mirror. This optical arrangement delivers X-rays within the range 0.7–2.0 Å [33]. The beamline critical energy, which is the median energy of a photon from the source spectrum, is 3 keV (4 Å).
Data collections on 11.3.1 are done on a conventional, three-circle, fixed chi Bruker D8 diffractometer (Bruker, Madison, WI, USA) rotating about a horizontal axis, which is shown in Figure 1. The APEX3 suite of programs is used to generate data collection strategies, collect data, and analyze data. The diffractometer is currently equipped with a Bruker PHOTON II CPAD detector, which allows for shutterless data collection. An Oxford Cryosystems Cryostream 800+ (Oxford Cryosystems, Long Hanborough, Oxfordshire, UK) provides sample cooling to 85 K and heating to 500 K; a CryoIndustries Cryocool-G2B-LT (Cryo Industries of America, Manchester, NH, USA) is available for helium temperature work (>18 K). An Incoatec microfocus molybdenum tube source (Incoatec GmbH, Geesthacht, Germany) is being commissioned for screening crystals on days without synchrotron X-rays. The simplicity of the end station, in that it is composed of commercial, user-friendly components, has allowed users to focus their attention on challenging samples and in situ experiments.
3.2. Beamlines 12.2.1 and 12.2.2
In 2001, the Advanced Light Source underwent an upgrade to replace three of its 1.27 T bend electromagnets with 6 T superconducting bend magnets [34]. These three magnets, called “superbends”, have become valuable sources of shorter wavelength X-rays due to their higher critical energy of 12 keV. The first superbend beamlines were installed for protein crystallography in 2004 [35], with beamlines for tomography [36], extreme conditions diffraction [37], and Laue microdiffraction [38] built in the following years. A new superbend beamline for chemical crystallography, numbered 12.2.1, is currently being built adjacent to the extreme conditions beamline, 12.2.2. Both 12.2.1 and 12.2.2 have been designed to offer X-rays suitable for chemical crystallography, with wavelength ranges of 0.5–2.0 Å and 0.3–2.0 Å, respectively.
Beamlines 12.2.1 and 12.2.2 have each been built in the standard ALS superbend beamline design, with a parabolic collimating mirror directing the X-rays into a Kohzu double crystal Si(111) monochromator (Kohzu Precision, Kawasaki, Kanagawa, Japan) [37]. The monochromated light is captured by a second, toroidal mirror, which focuses within the X-ray hutch. On 12.2.1, the focus point in the hutch will be coincident with the sample position, but on 12.2.2, the toroidal mirror focus point serves two purposes. A Stoe Eulerian cradle diffractometer (STOE & Cie GmbH, Darmstadt, Germany) is currently being commissioned at the focus, but a pair of Kirkpatrick–Baez (KB) mirrors image a pair of slits near the focus, and this KB pair can deliver a microfocus beam to a second instrument in the hutch. The second instrument in the 12.2.2 hutch consists of a single Huber rotation axis (ϕ) (HUBER Diffraktionstechnik GmbH & Co KG, Rimsting, Germany), upon which are fine sample alignment stages. Diffraction data are collected on a Perkin Elmer amorphous silicon detector (PerkinElmer Corporation, Santa Clara, CA, USA). This system is very robust, and can accommodate a multitude of DAC types and external apparatus such as sample heating and cooling systems. These two end stations are shown in Figure 2. Table 1 illustrates the defining characteristics of all the beamlines discussed here.
4. In Situ Experiments
4.1. High Pressure
Exerting high pressure on crystalline samples has long been the domain of the mineral physics community, but experimental improvements have made this technique more accessible to the chemistry community. Single-crystal, high-pressure experiments offer chemists a unique opportunity to apply an isotropic mechanical force to a molecular lattice or framework structure and observe the structural changes. There are numerous excellent reviews on this technique, from both chemical [39,40] and mineralogical perspectives [41].
At the Advanced Light Source, most of the high-pressure work on chemical compounds has been performed at beamline 11.3.1; however, the 11.3.1 X-ray spectrum is not ideal for all high-pressure experiments due to the lack of flux at shorter wavelengths. Since 2014, high-pressure, single-crystal experiments have also been available on beamline 12.2.2. Experimental aims should be considered when deciding on which beamline to collect data. The current 11.3.1 diffractometer configuration can accommodate only small diamond anvil cells (DACs) such as the Merrill-Bassett type DAC [42], whereas larger, heavier DACs, such as the BX90 [43], can be accommodated on beamline 12.2.2. The current 11.3.1 diffractometer has three circles of rotation, whereas the four-circle diffractometer on 12.2.2 is still under commissioning. Another consideration is the incident beam size: 11.3.1 has a beam size close to 280 μm2 and the sample chamber should be large enough to minimize the beam clipping the gasket edge. 12.2.2, conversely, has a much finer beam that can easily be switched between 30 and 10 μm2 by slitting down the incident X-ray beam. The 12.2.2 set-up favours higher pressure experiments (>10 GPa), which have small sample sizes and sample chambers. Diffraction completeness can be improved upon, with sufficient flux, by decreasing the wavelength of the incident X-ray beam, which can be achieved with ease by users on both beamlines; however, achieving higher completeness is easier on 12.2.2, with access to high flux at short wavelengths (See Table 1).
Owing to the diverse user bases of both 11.3.1 and 12.2.2, there has been a large variety of high-pressure work carried out. Compression of a molecular solid usually results in a reduction in unit cell parameters but there are some exceptional compounds that expand on compression. Porous framework materials exhibit the largest negative linear compressibility (NLC) behaviour, but in some classes of small molecules, such as the metallocyanides, significant NLC can be displayed. (C6F5Au)2 (μ-1,4-diisocyanobenzene) was studied to 4 GPa and ZAG-4 (zinc alkyl gate) to 9 GPa on beamline 11.3.1 [44,45]. In a separate study on 11.3.1, ZAG-6 was also shown to undergo NLC as well as exhibiting bond rearrangement and a pressure-induced reversible proton transfer between water molecules and the phosphonate group of the MOF [46].
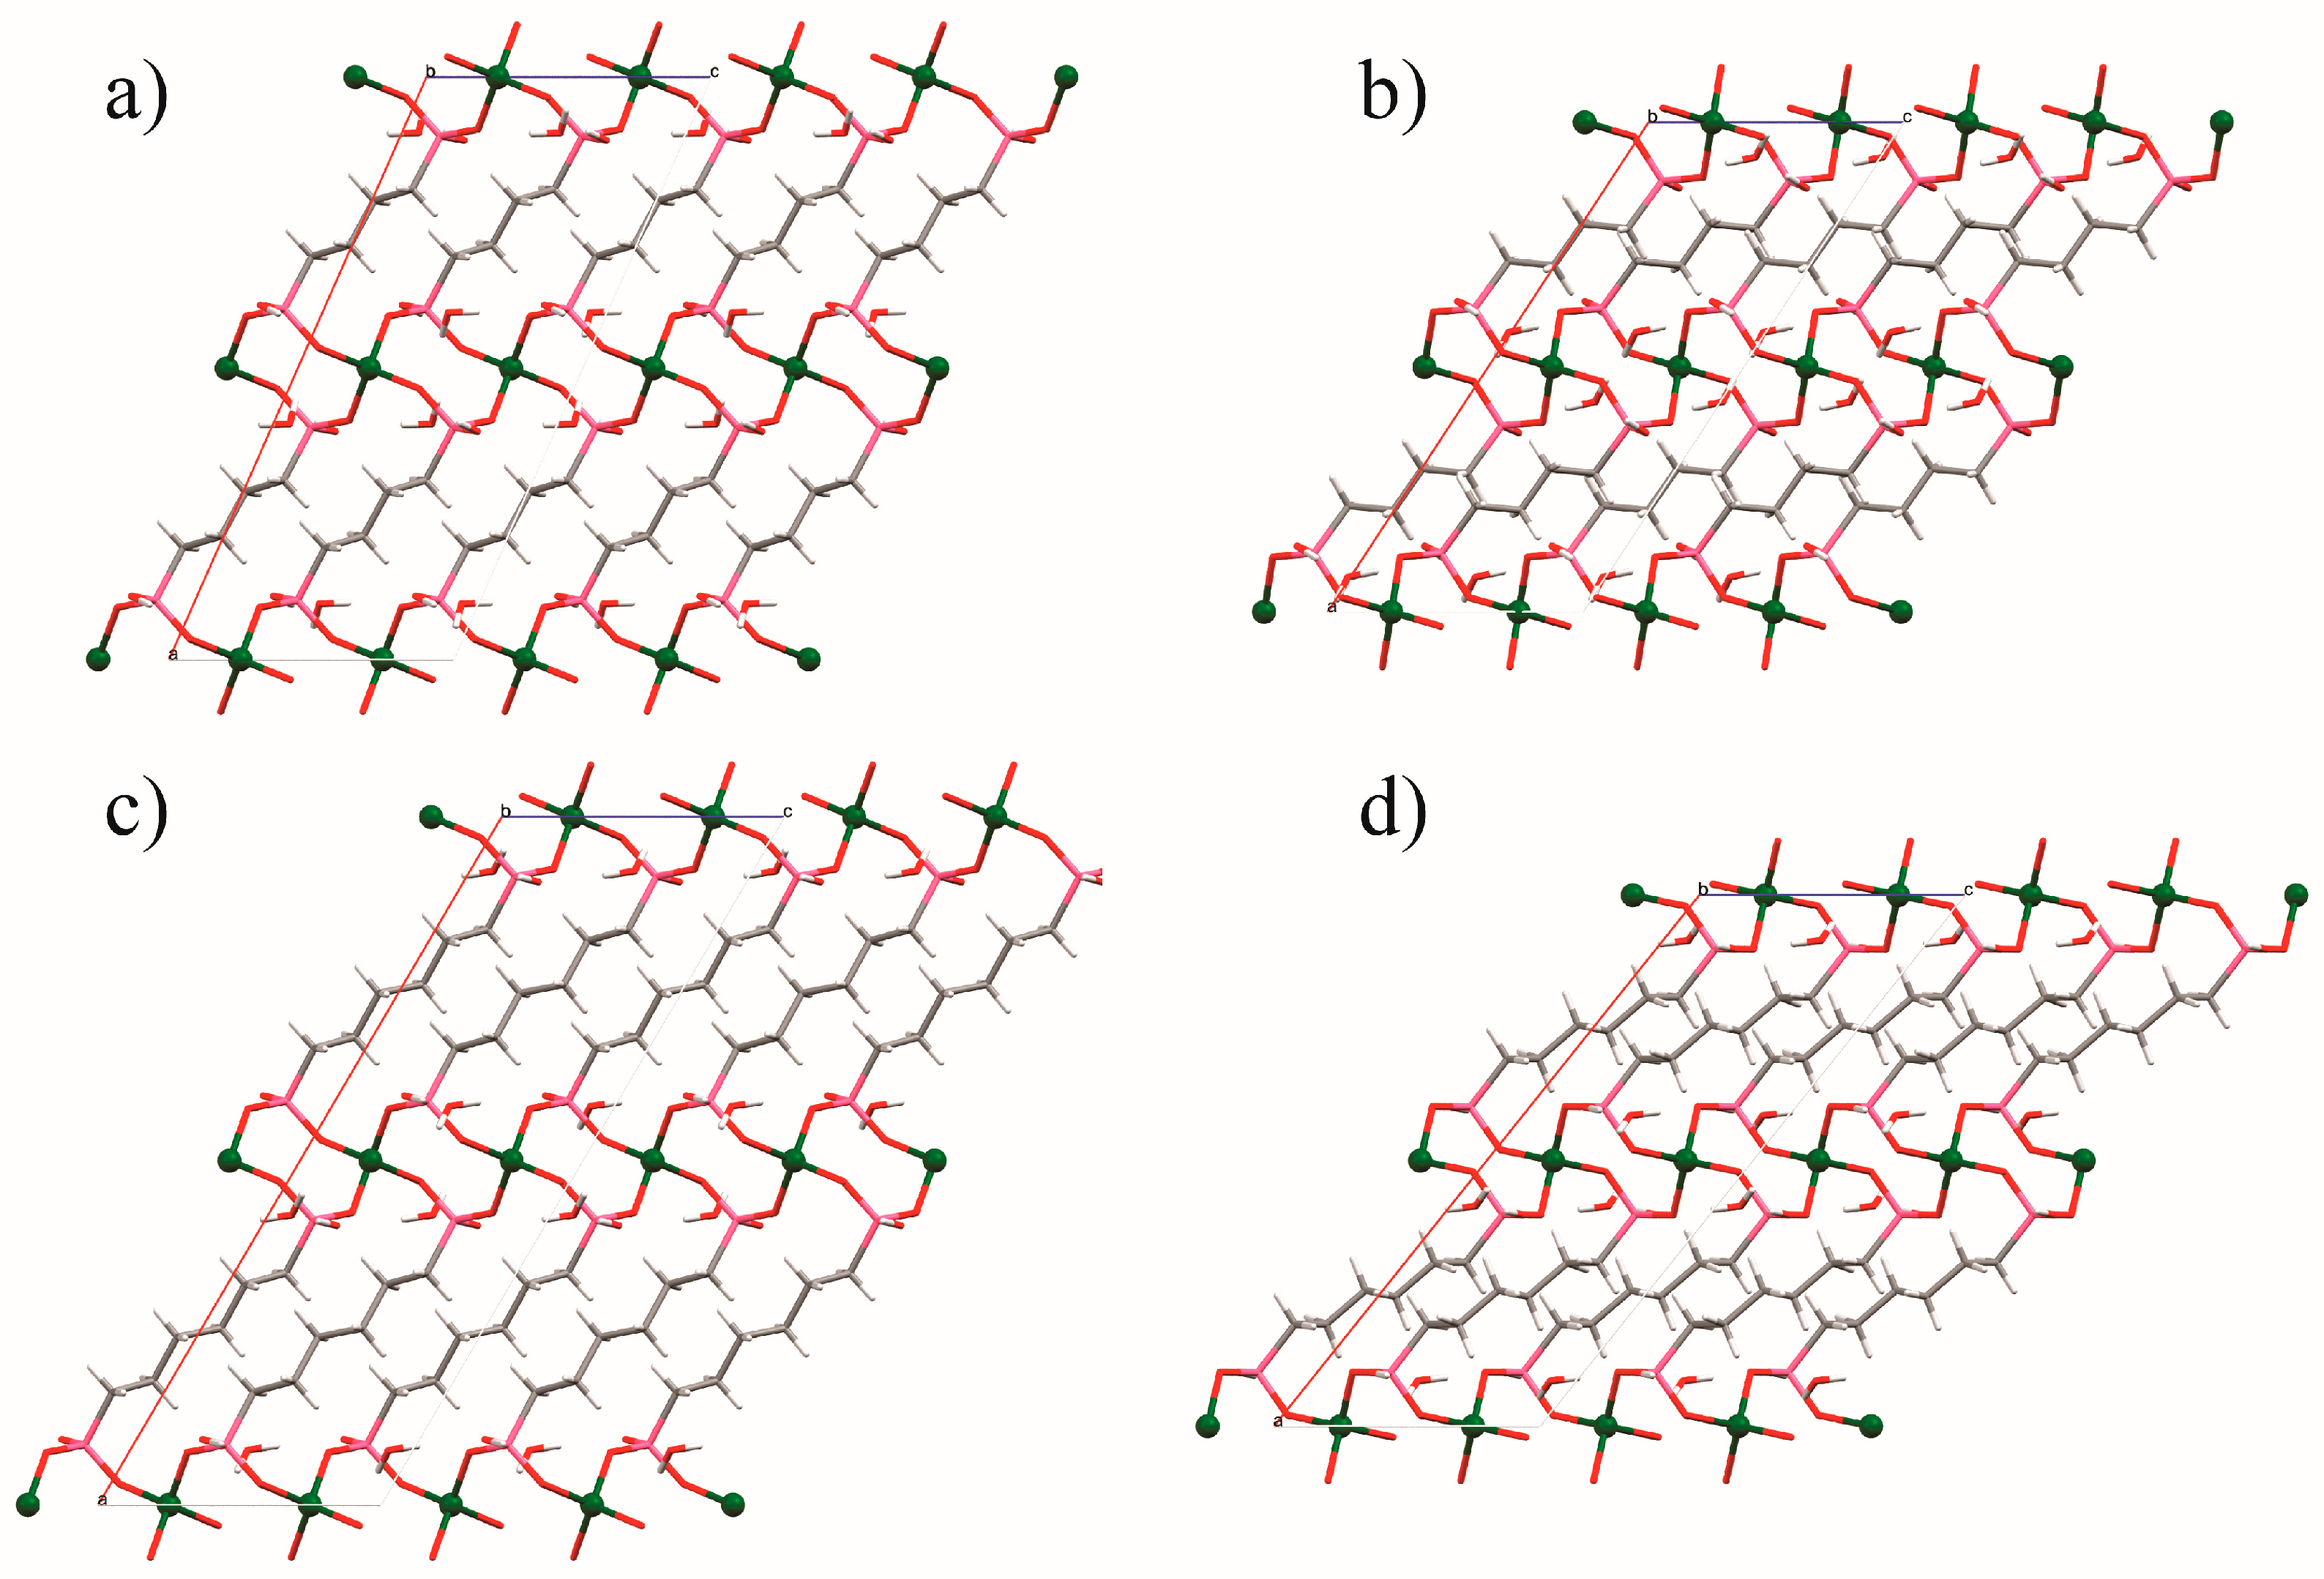
The study of MOFs at pressure is of great interest due to their applications in gas storage, catalysis and material science. Structural changes resulting from the application of hydrostatic pressure and the reversibility of these structural changes were studied in ZAG-4 (Zn(HO3PC4H8PO3H)·2H2O) and exhibited both positive and negative linear compressibility to 9 GPa along the b-axis with complete reversibility on decompression [45]. The ambient and maximally compressed structures of both ZAG-4 and ZAG-6 are shown in Figure 3. More recently, Kapustin et al. were able to show that crystals of MOF-520 “retrofitted” with additional 4.4′-biphenyldicarboxylate linkers were more robust under pressure [47].
High pressure is also useful for probing conformational changes and intermolecular phenomena, such as hydrogen bonding and π···π interactions. Woodall et al. investigated the aurophilic (Au···Au) interactions of a series of Au(I) trimers as a function of pressure and temperature by crystallographic means on 11.3.1 [48]. Spin-crossover (SCO) effects can be initiated by external forces such as pressure, temperature, irradiation, or a magnetic field. SCO events can result in huge variations in a material’s structure, conductivity, or magnetic properties. Pressure-induced spin crossover has been studied in [FeL12] (ClO4)2 (L1 = 2,6-bis[3-methylpyrazol-1-yl]-pyrazine) [49] and in FeII(Metz)6](FeIIIBr4)2 (Metz = methyltetrazole) [50].
Phase changes are commonly encountered on applying pressure and are of interest to researchers studying structure–property relationships. Form I of tris(μ2-3,5-diisopropyl-1,2,4-triazolato-κ2N1:N2)trigold(I) exhibited four successive phase transitions to 3 GPa, and each phase was characterised on beamline 11.3.1 [51]. Lawsonite, CaAl2Si2O7(OH)2·H2O, a subduction-zone mineral of geochemical interest, was studied to 12 GPa on 12.2.2 and underwent a phase transition at 9 GPa that had only been observed previously by spectroscopy [52]. The high-pressure behaviour of the hybrid Pb–halide perovskites, CH3NH3PbI3 and CH3NH3PbBr3, was observed to include at least one phase change in each compound before 2 GPa [53].
4.2. Photocrystallography
Photocrystallography involves a structural or electronic transition of a compound upon exposure to light. As complete conversion depends upon the light penetrating the whole crystal, synchrotron sources are ideal as they allow for the use of much smaller crystals than could be used effectively in a laboratory instrument.
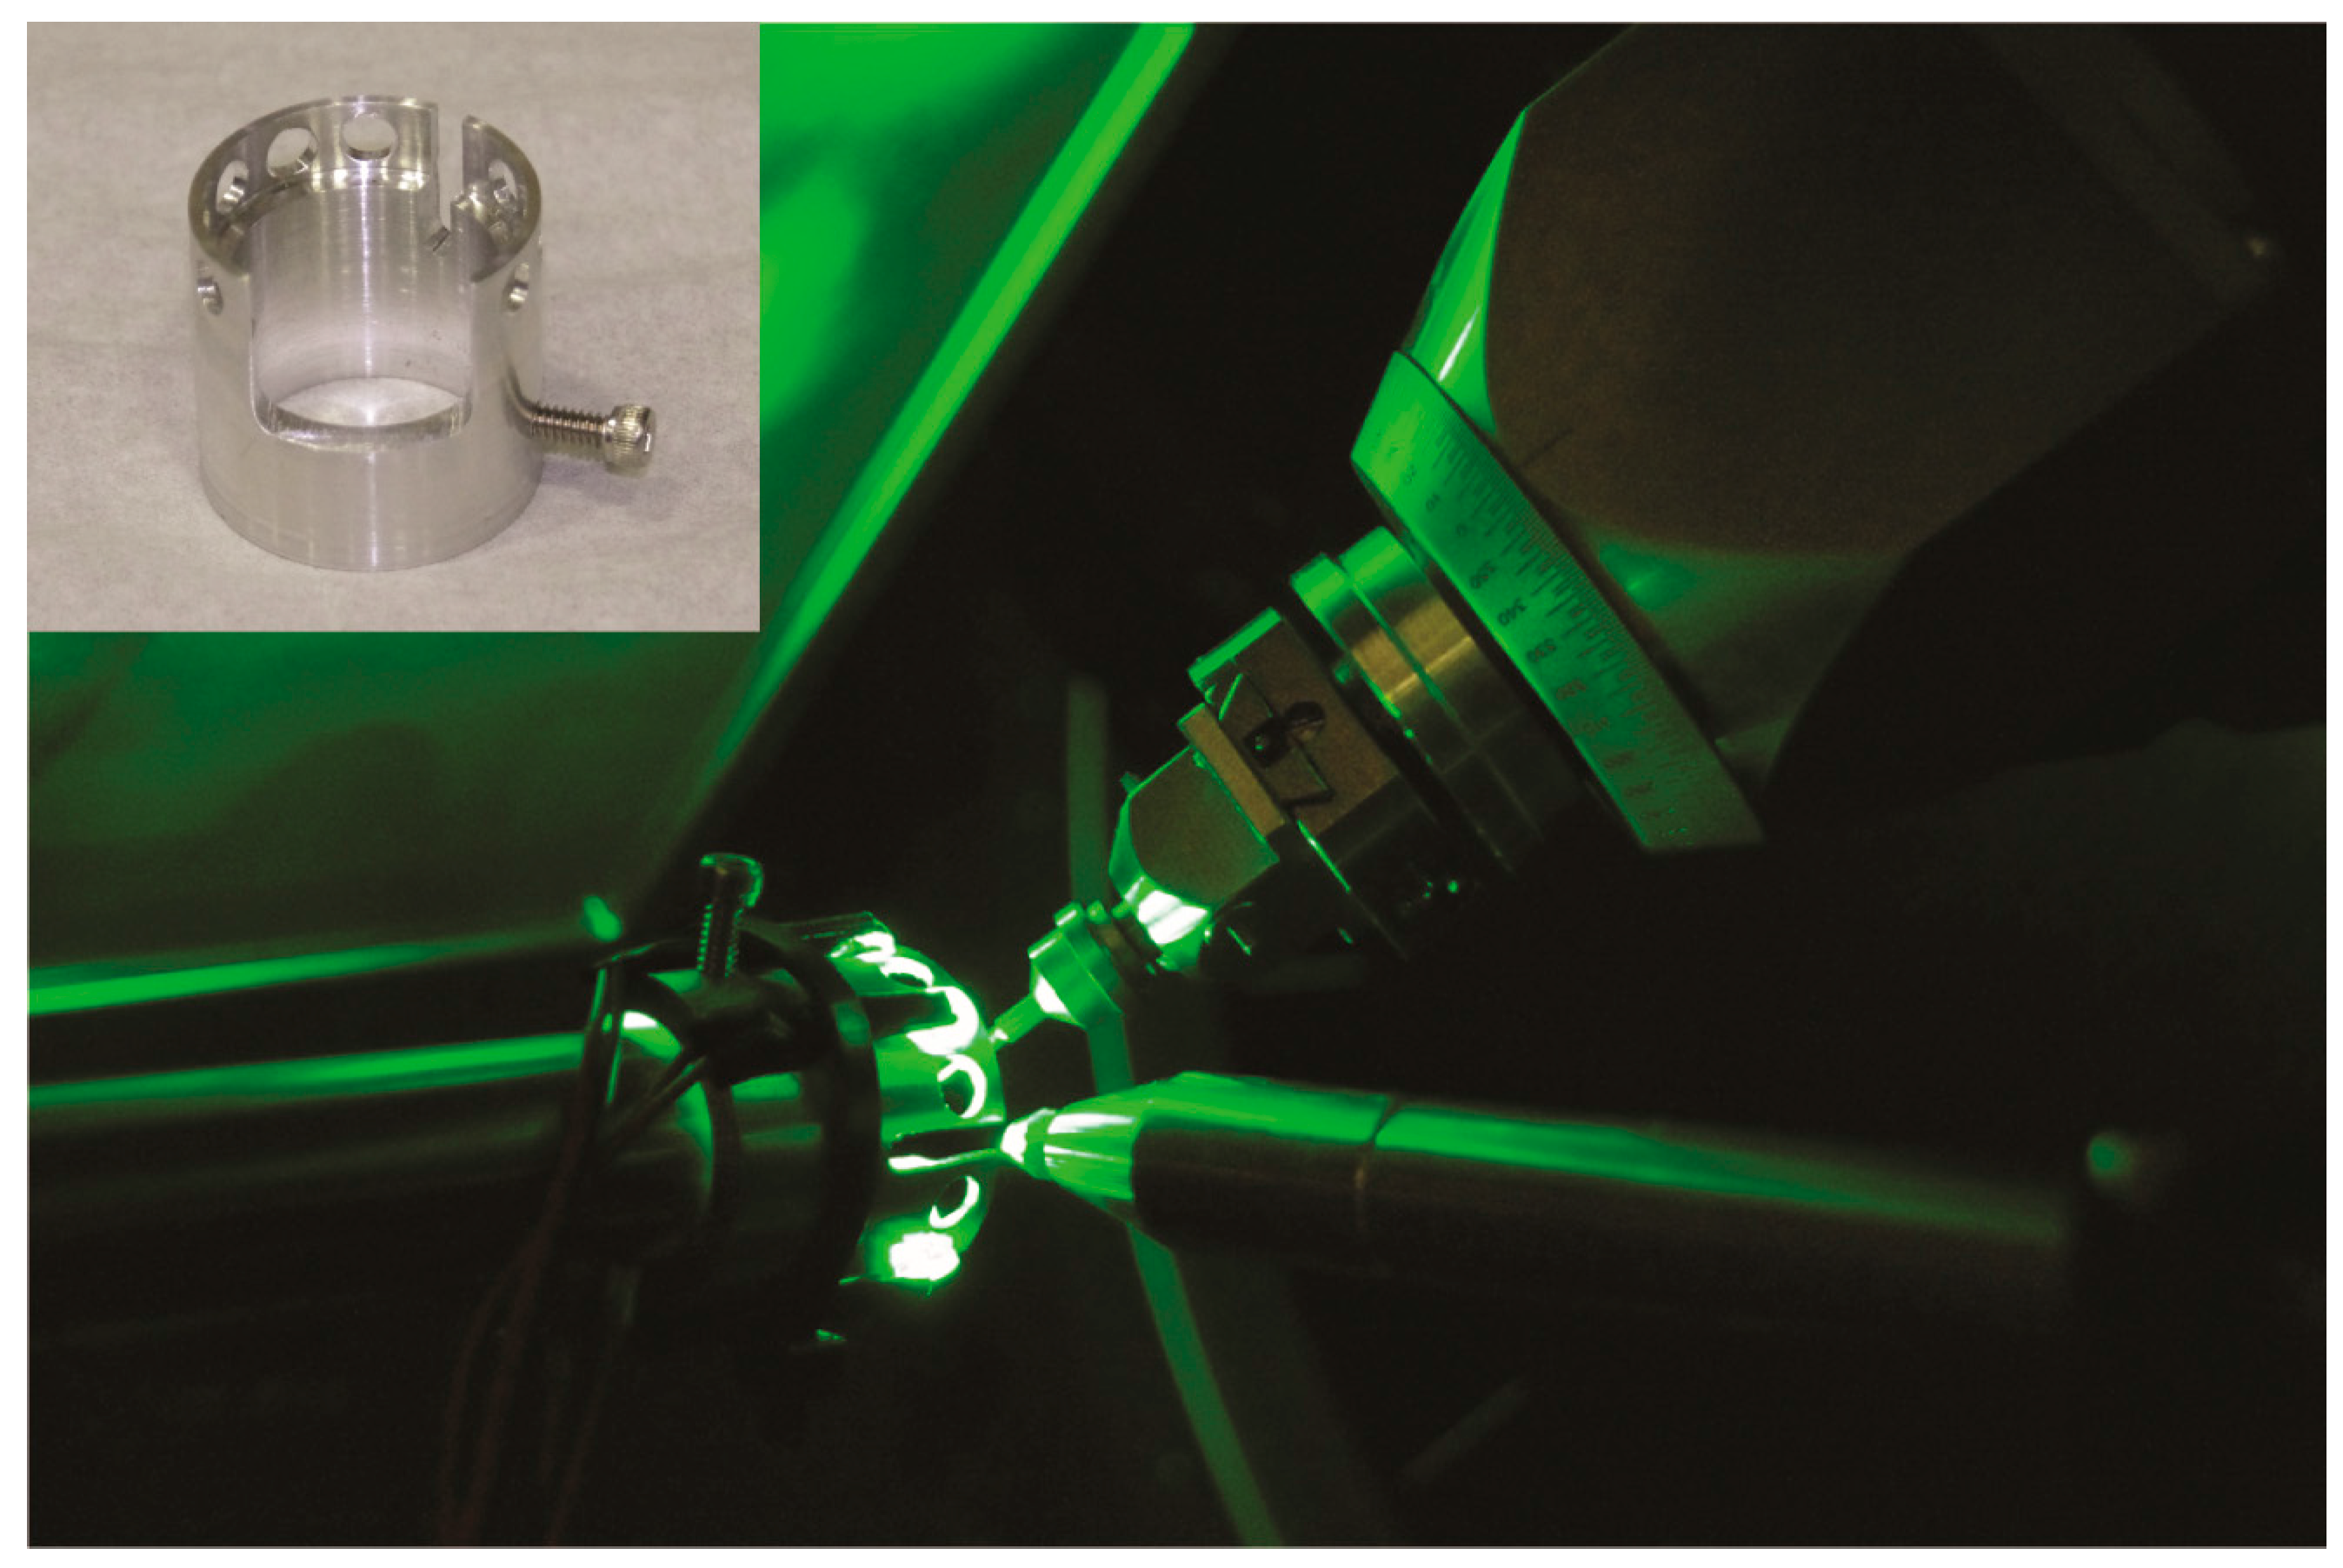
Beamline 11.3.1 uses a system of LEDs fitted into an aluminium ring as the source of UV, visible, or IR light [54], as shown in Figure 4. The benefits of LED over LASER irradiation are three-fold: first, LEDs are cheaper and readily commercially available in a range of wavelengths; secondly, LEDs have minimal radiative heating effects on the sample, which may result in the decomposition of the metastable state; and finally, LEDs have lower light intensity than LASERs, which gives greater control over the rate of photoactivation while reducing the risk of crystal damage from the high-intensity light. The aluminium ring itself, shown in the inset of Figure 4, aids in the photoactivation by dispersing any radiant heat while providing a reflective surface to maximize light coverage of the crystal.
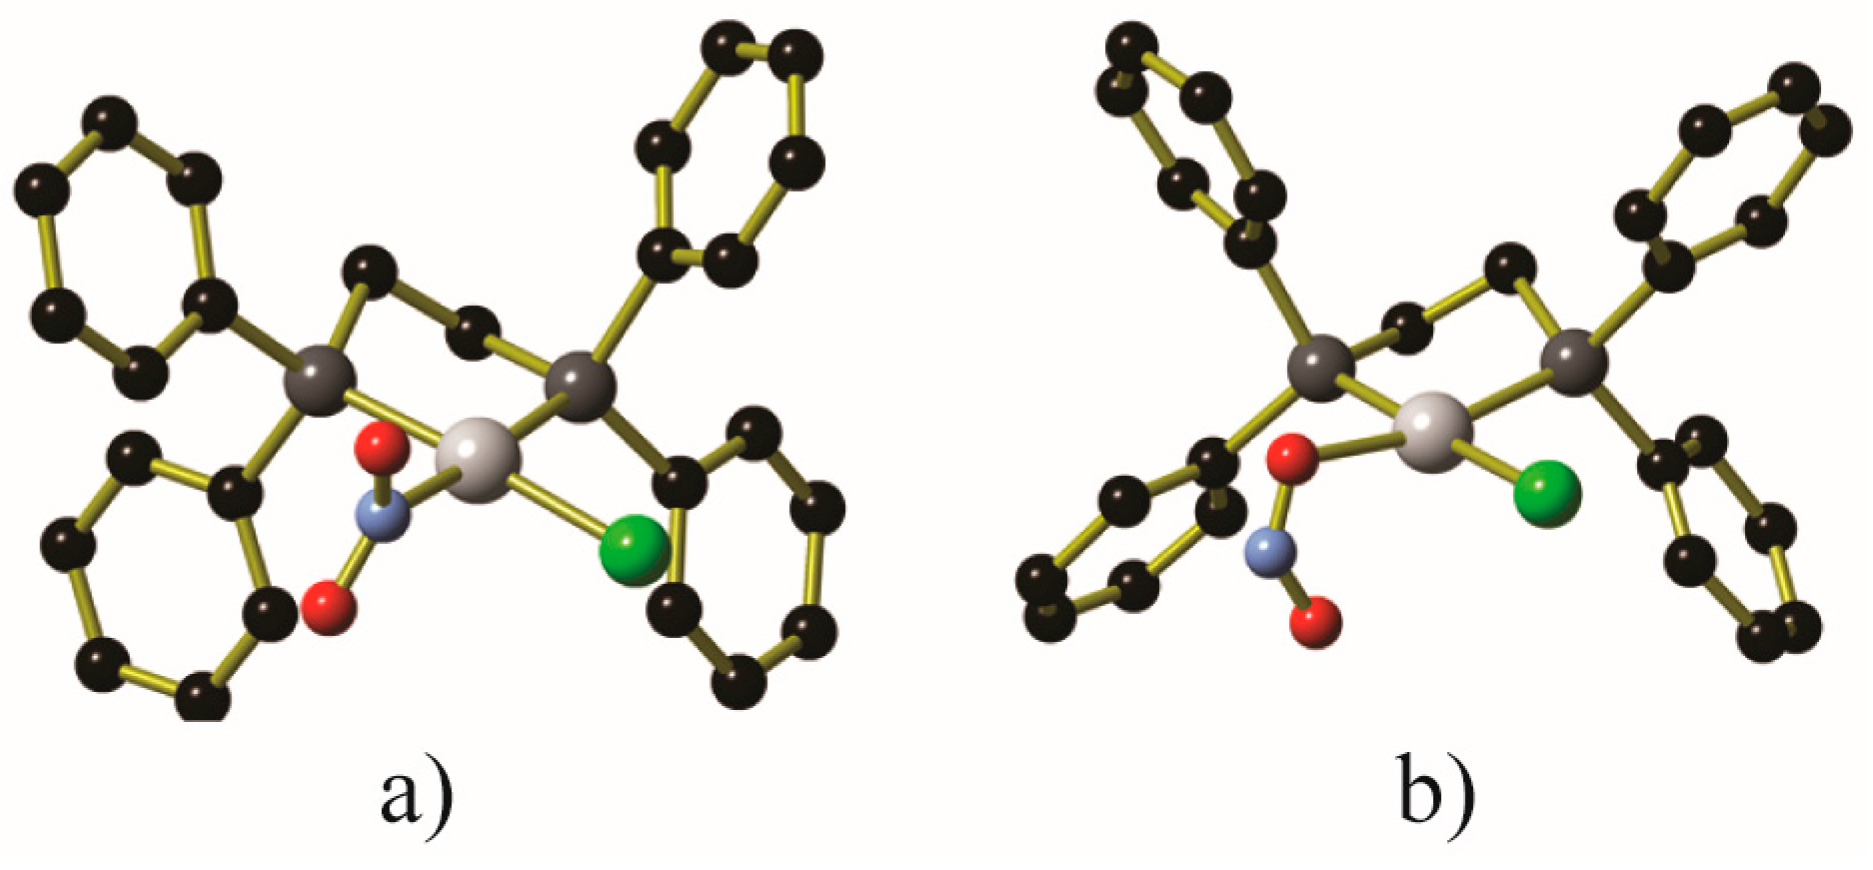
One of the common photocrystallographic experiments is the nitro to nitrito interconversion of coordinated nitrite anions, illustrated in Figure 5. The LED light ring has been used to induce the complete nitro/nitrito interconversion in Ni(Ph2PCH2CH2PPh2)Cl(NO2) upon exposure to 400 nm light for approximately 2 h at 100 K, with a 70% conversion observed after only 20 min of illumination [21]. The metastable endo-Ni(Ph2PCH2CH2PPh2)Cl(ONO) was stable for 1 h when the crystal was kept in the dark at 100 K, and variable temperature studies showed that Ni(Ph2PCH2CH2PPh2)Cl(ONO) was stable at temperatures up to 160 K. At temperatures higher than 160 K, the nitrito ligand reverted to its nitro binding mode.
Partial conversions could be obtained by illumination of Ni(aep)(NO2)2, Ni(aepy)(NO2)2 (aep = 1-(2-aminoethyl)piperidine, aepy = 1-(2-aminoethyl)pyrrolidine) [55], Pd(PPh3)2(NO2)2 and Pd(AsPh3)2(NO2)2 [56] (Figure 6). The conversion rate varied from 16% for endo-Ni(aep)(ONO)2 after exposure to 470 nm light, to 46% for endo-Pd(PPh3)2(ONO)2 after exposure to 362 nm light (up from 30% using 400 nm light). In addition to displaying lower nitrite to nitrito conversion, the nitrito anions in Ni(aepy)(ONO)2 and Pd(AsPh3)2(ONO)2 also display some endo or exo binding mode disorder. In all cases, the metastable nitrito isomer is only stable within a limited thermal range: Pd(PPh3)2(ONO)2 and Pd(AsPh3)2(ONO)2 revert to the nitrite isomer at temperatures above 240 K, Ni(aepy)(ONO)2 reverts at temperatures above 120 K, while Ni(aep)(ONO)2 is only stable between 60 and 110 K.
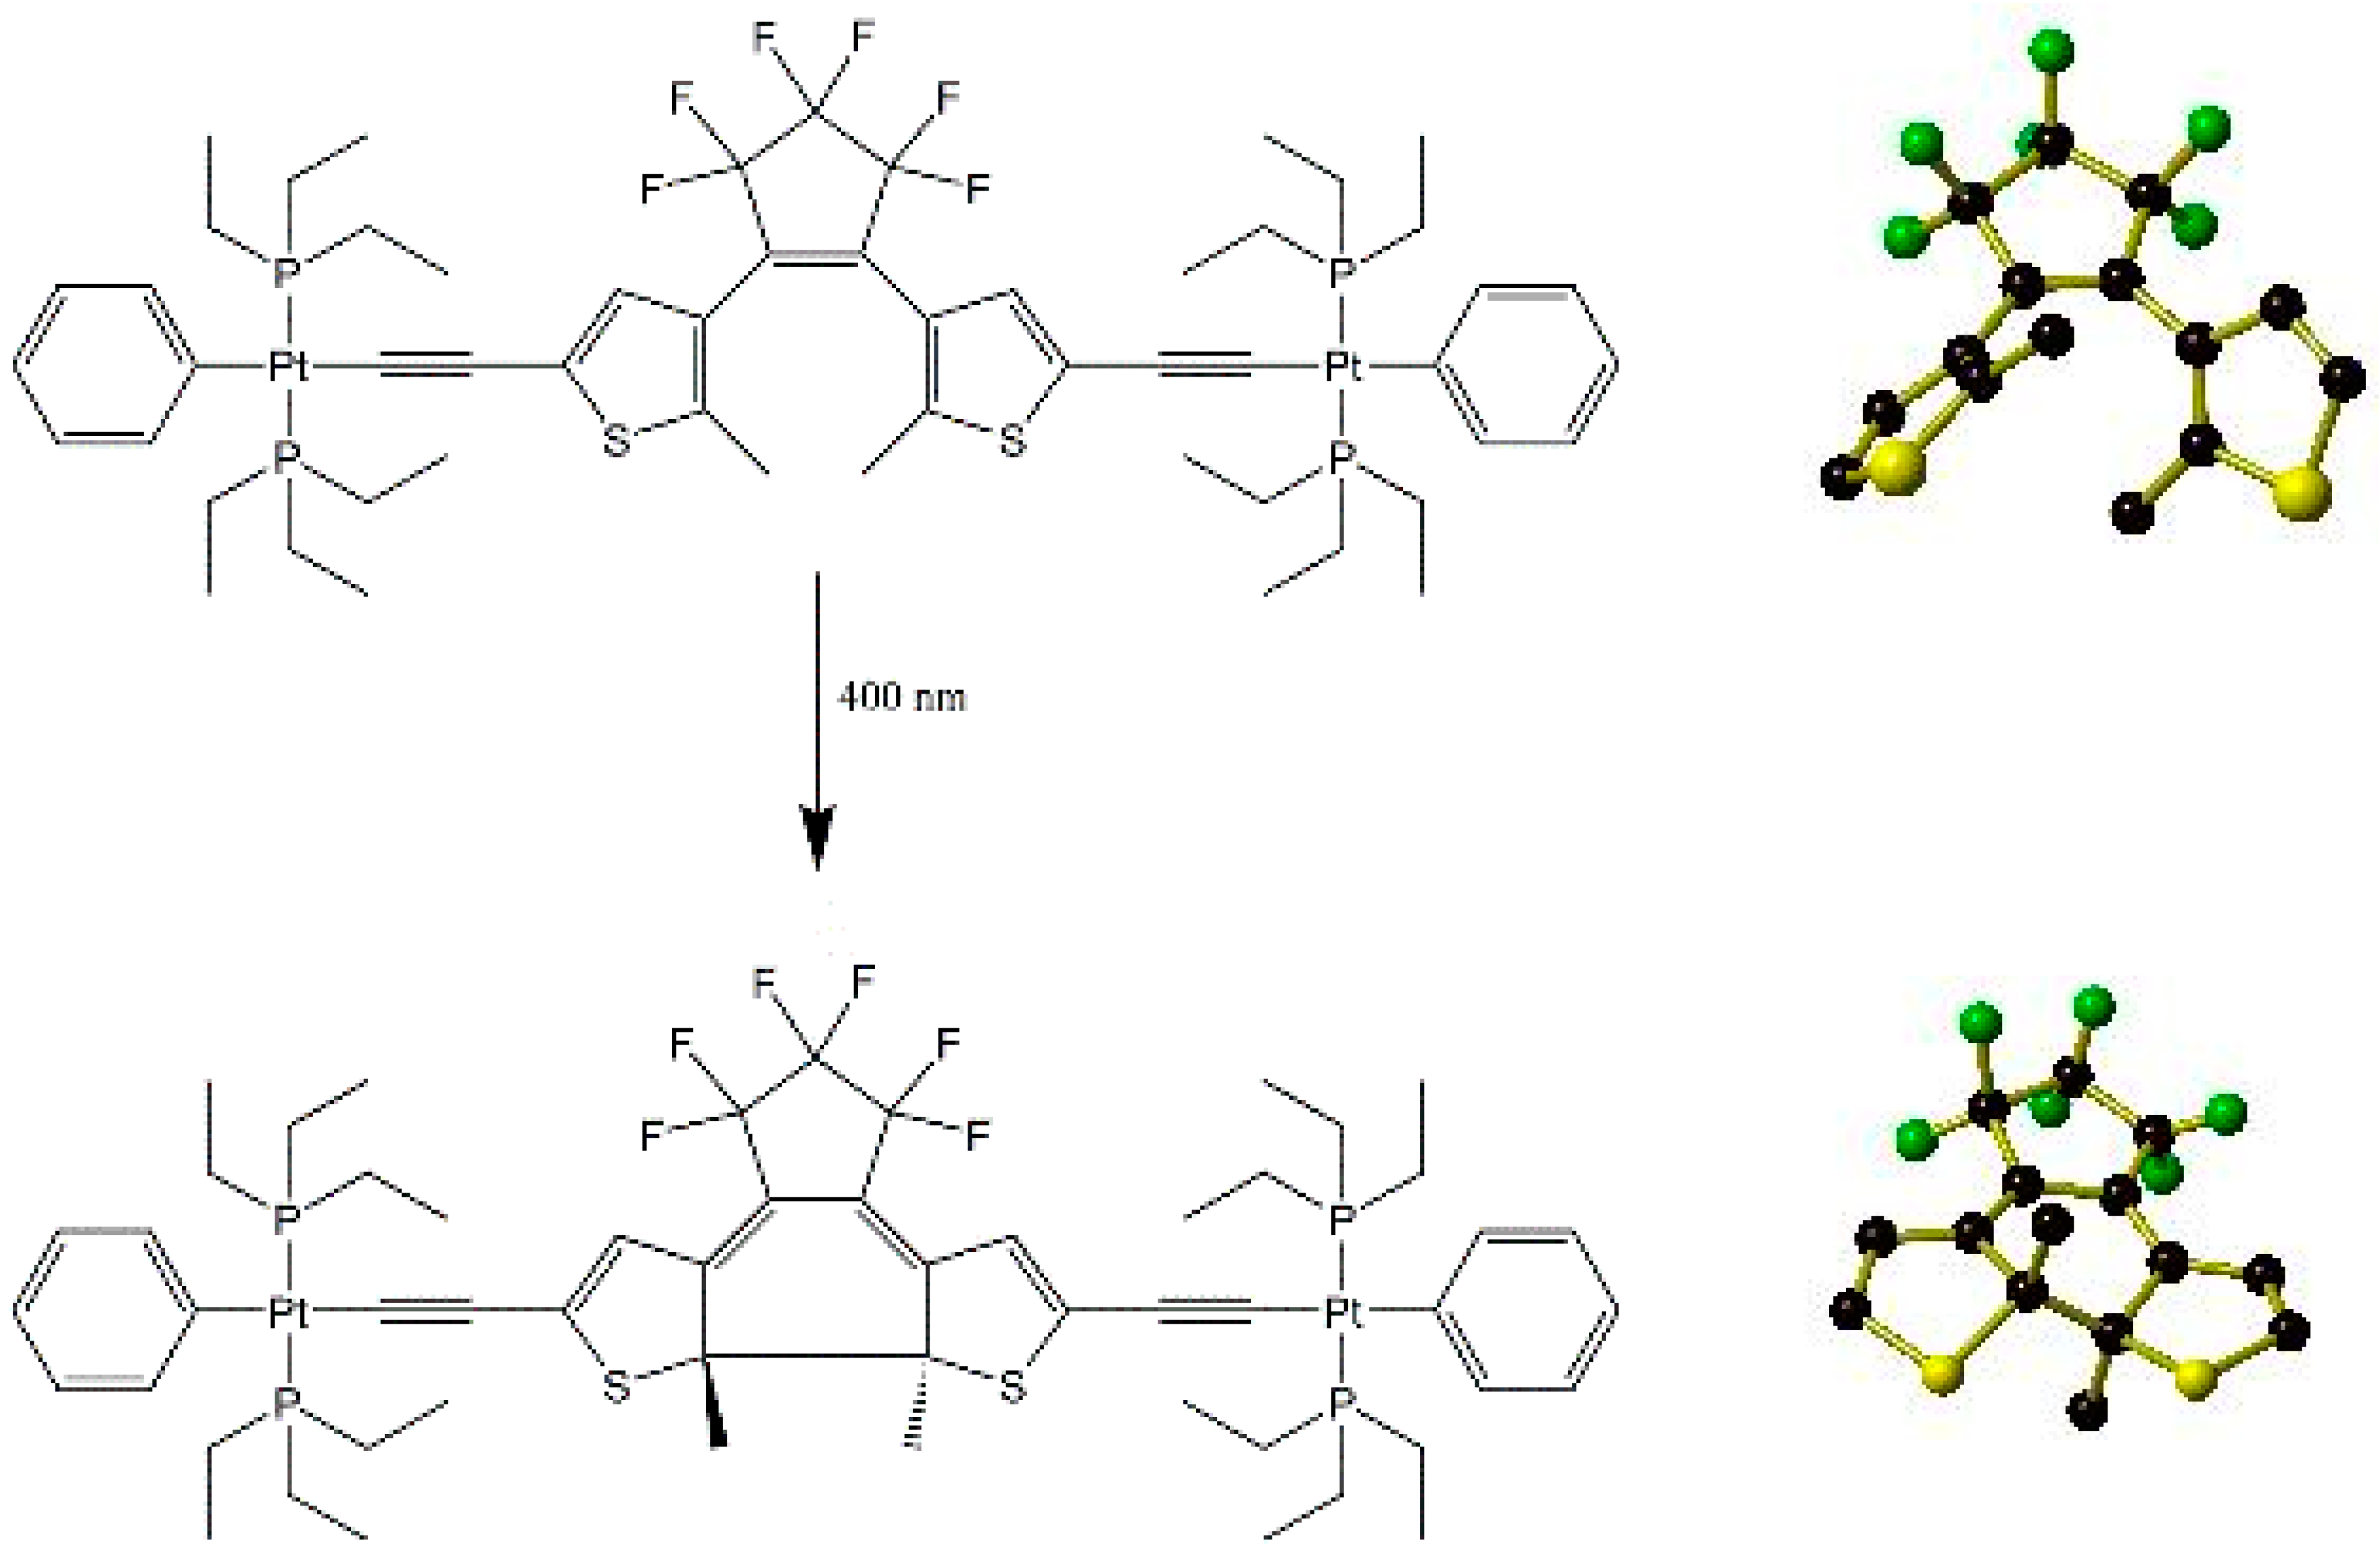
Irradiation has also been used to initiate chemical reaction in the solid state. For example, the ring-closing reaction shown below in Figure 7 may be induced in a single crystal of a substituted dithienylethene (DTE) precursor [(PEt3)2PhPt(C≡C)(DTE)(C≡C)Pt(PEt3)2Ph] by irradiating with 400 nm light for approximately 20 min [57]. This leads to approximately 80% conversion from the ring-opened to ring-closed forms. Attempts to reverse this by irradiating the crystal with 530 or 600 nm light were unsuccessful despite the near quantitative reversibility in the solution state of the ring closure reaction by exposure to 500 or 632.8 nm light.
4.3. Environmental Gas/Vacuum
The environmental gas cell at 11.3.1 is one of several in use around the world that allow for the atmosphere surrounding the single crystal to be removed and, if desired, replaced with a gas environment of choice [58,59]. First developed at the ALS in collaboration with the University of St Andrews [60,61], several subsequent modifications have been made in collaboration with the University of California, Berkeley [62]. The environmental gas cell, shown in Figure 8, has an advantage over traditional sealed capillary gas-loading in that it does not require prior knowledge of the desired desolvation temperature or gas loading pressure, allowing the crystallographer to adapt the experiment in response to individual crystal behaviour. This can save a great deal of time, as frequently the as-synthesised, dehydrated, gas-loaded, and re-exposure to air datasets may all be collected on the same crystal; alternatively, the dehydration/gas loading experiment may be halted before the desired conditions are reached should the crystal decompose or reach complete desolvation earlier than expected.
Initial activation of the single crystal inside the environmental cell is achieved by a combination of evacuation using a vacuum pump located inside the X-ray hutch and, if necessary, heating the sample to temperatures of up to 500 K using an Oxford Cryosystems Cryostream 800+. The gas cell may be connected to either of two separate gas loading systems, a manual CO2-loading manifold that is permanently located inside the X-ray hutch, or a vented toxic gas cabinet located outside the X-ray hutch. The toxic gas cabinet has the capacity for three separate lecture bottle-sized gas cylinders, each connected to a common gas mixing chamber, from which a single line feeds the gas to the environmental cell. This allows for multiple experiments with different gases to be conducted on the same crystal without needing to change gas cylinders mid-experiment. A manual valve located inside the hutch isolates the environmental cell from the gas cabinet system to prevent accidental over-pressurisation and structural failure of the environmental cell. Gas pressure to the cell is controlled by sequentially opening and closing a series of computer-controlled valves between the manual regulator and the mixing chamber, and a final computer-controlled valve releases the gas as far as the manual valve inside the hutch. Any excess pressure may be relieved via a vacuum line that joins the main gas line between the mixing chamber and the X-ray hutch. For safety reasons, this second vacuum pump is located inside the gas cabinet itself. To date, the gas cabinet has been used to load crystals with Ar; various saturated and unsaturated hydrocarbons; CH2O (via a temporary fifth gas line); CO, Kr, N2, NO, N2O, NO2, O2, SO2, and Xe.
Thus far, the environmental gas cell has been used almost exclusively to investigate the interactions between activated porous extended coordination frameworks (frequently possessing a vacant coordination site) and gaseous guest molecules, or the structural transitions these frameworks undergo upon desolvation. The beamline is also equipped for data collection on crystals sealed in capillaries that have been evacuated and/or gas-dosed in a custom-built capillary loader at the University of California, Berkeley campus [62].
Evacuation of single crystals in the gas cell commonly results in the removal of solvent molecules, leaving a desolvated crystal that may, e.g., in the case of Co2(dobdc)(H2O)2·solvate (aka Co2(dhtp)(H2O)2, CPO-27-Co or MOF-74-Co, dobdc = dhtp = 2,5-dioxido-1,4-benzenedicarboxylate) [63], or may not, e.g., Zr6O4(OH)4(fumarate)6·solvate (aka MOF-801) [64], contain vacant coordination sites as a result. Upon re-exposure to the atmosphere, the location and order of occupation of any water adsorption sites may be monitored.
The dehydration procedure may also provide insight into defect-containing frameworks such as UiO-66 [65], in which the bridging terephthalate (or terephthalate-derived) ligands are only present at 80–95% of the 12 available sites on the ZrIV6(O)4(OH)4(CO2)12 clusters (Figure 9). Pairs of single oxygen atom species (H2O, OH−, or O2−) replace the missing terephthalate ligands, potentially leading to a charge balance discrepancy. By dehydrating a single crystal, the authors were able to observe the removal of these single oxygen atom species (shown as hollow circles in Figure 9), while a separate single oxygen atom species (shown in green in Figure 9) within hydrogen-bonding distance of the μ3-OH− and μ3-O2− anions within each cluster is retained even after heating to 500 K under vacuum. This supports the assignment of the coordinated single oxygen atom species as H2O molecules and those held in place by hydrogen bonds as OH− anions.
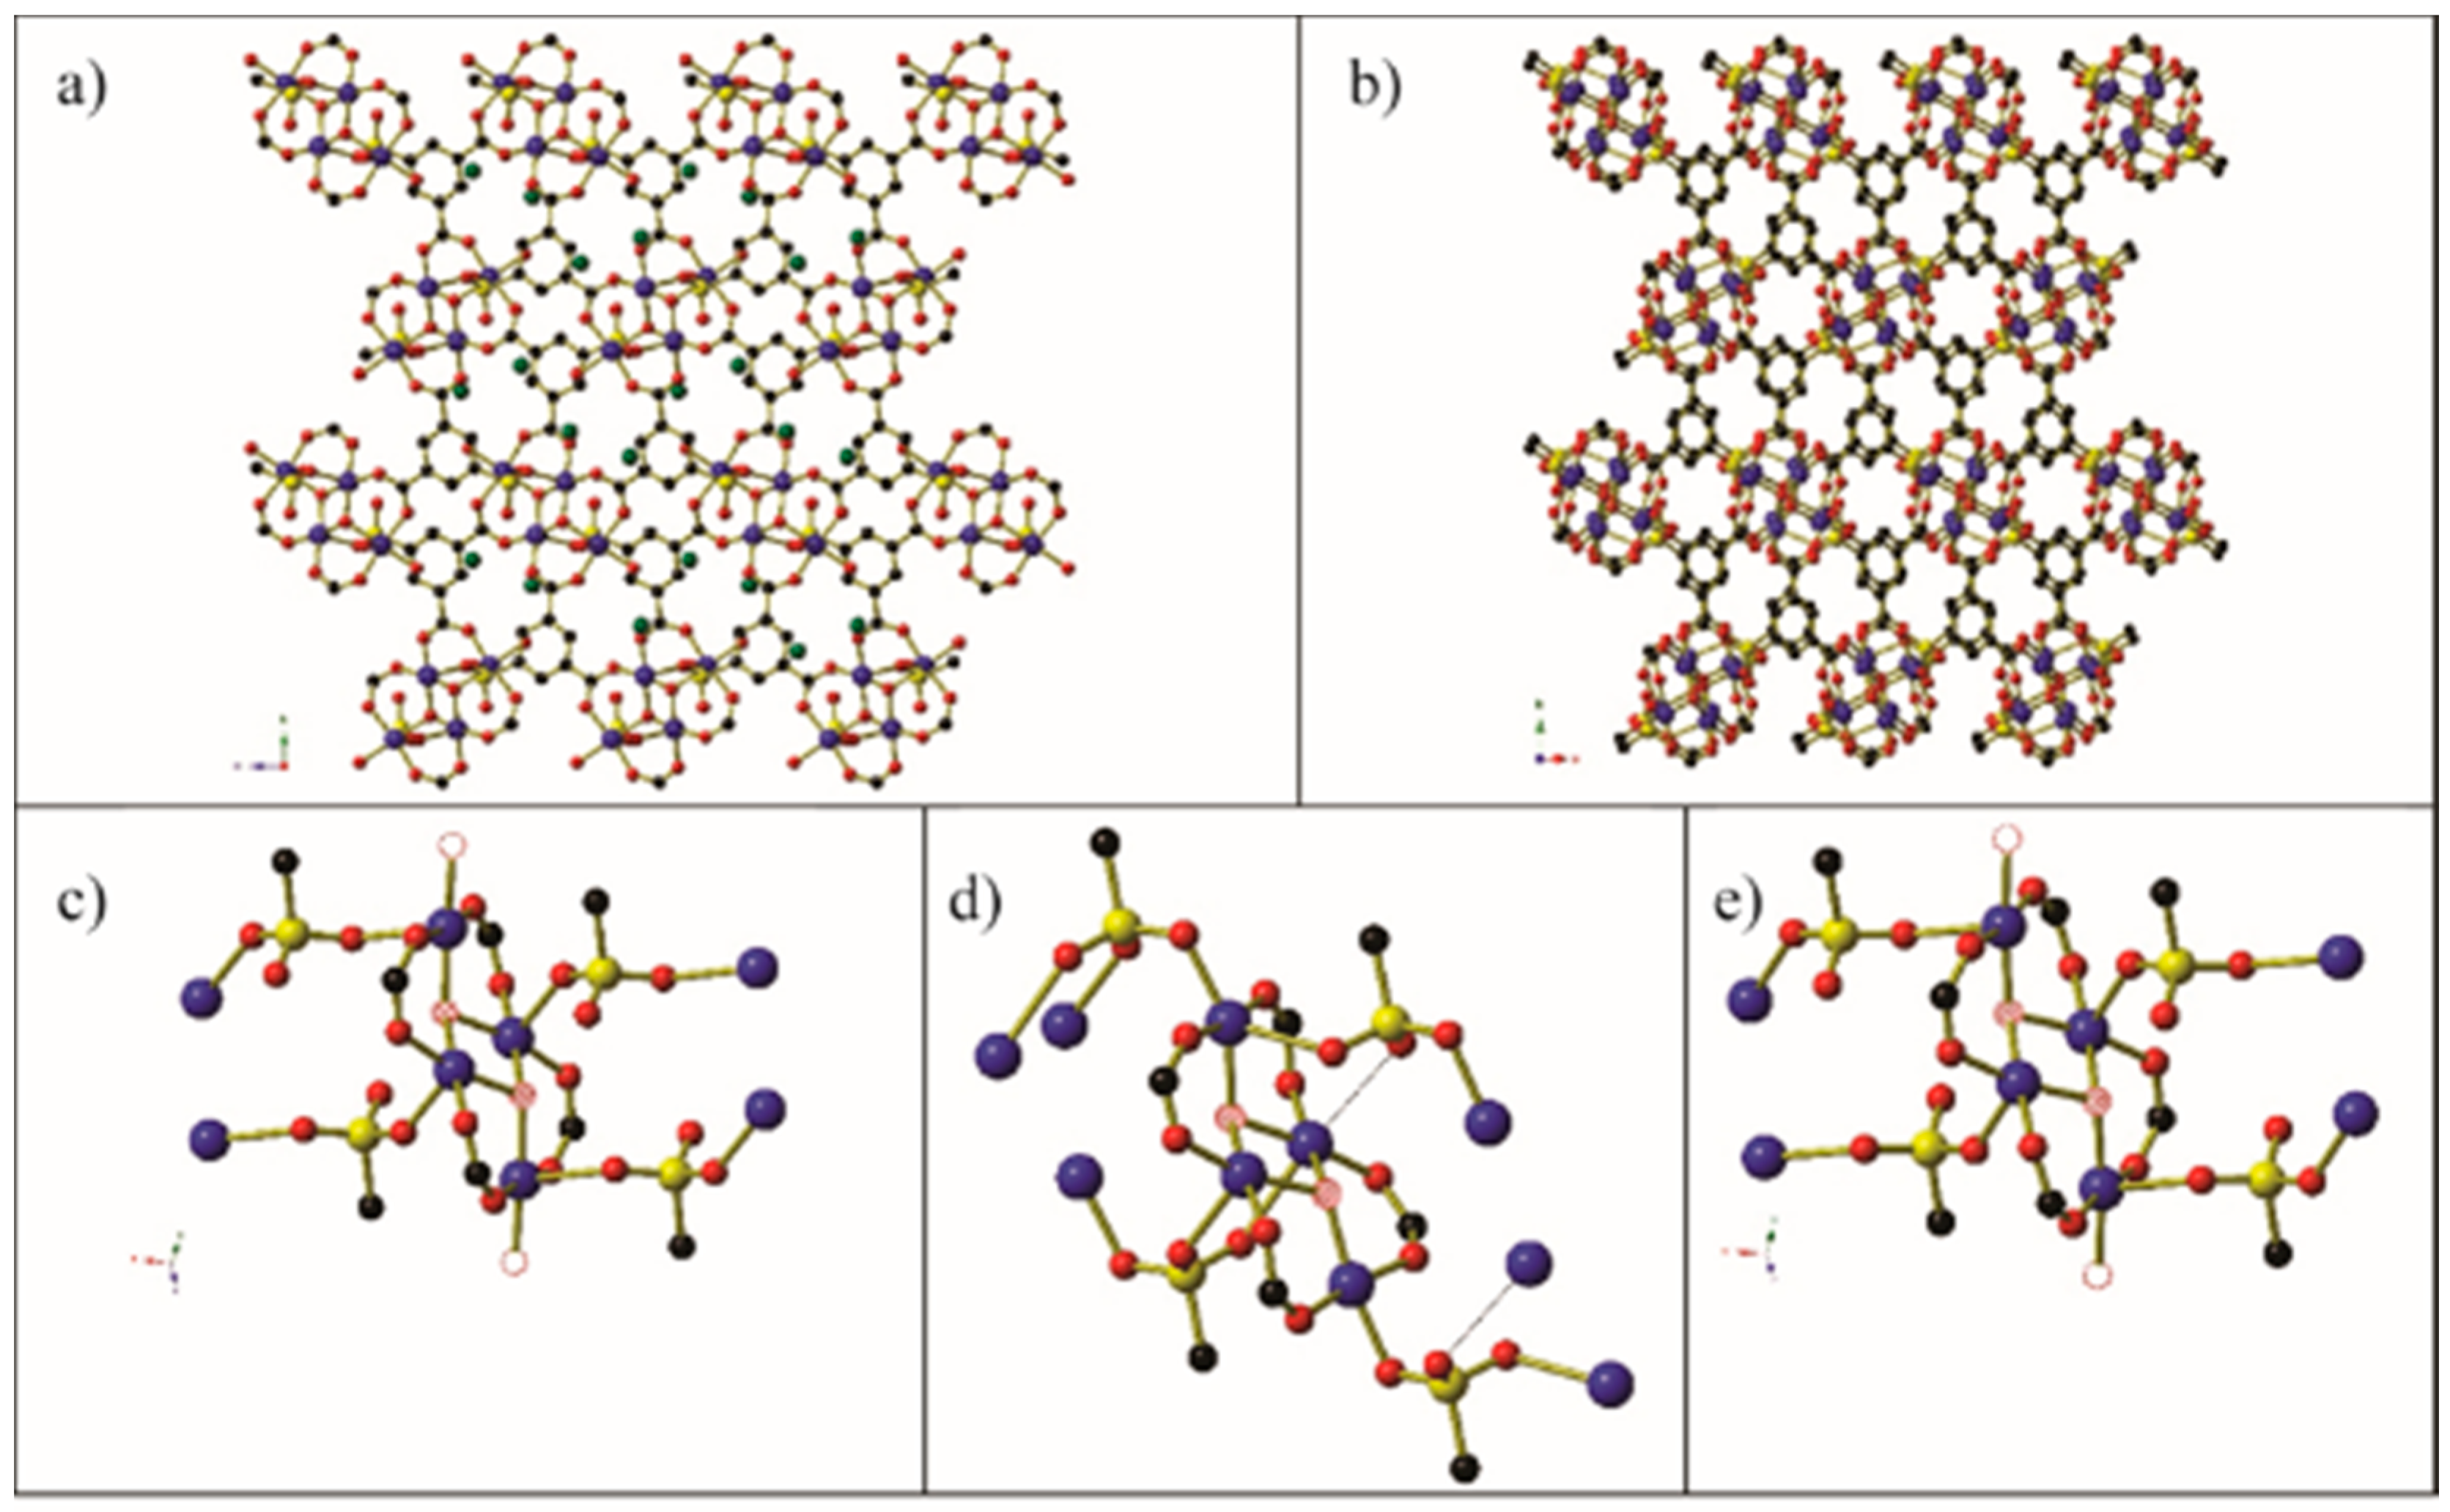
On rare occasions, this desolvation of the crystal can cause a structural rearrangement of the framework, for example Cu-SIP-3 (Cu2(OH)(sip)(H2O), sip = 5-sulfidoisophthalate) [66]. The full frameworks before and after dehydration are shown in Figure 10. The water molecules (shown as hollow circles in Figure 10) on the two peripheral copper centres on each Cu4 cluster unit are removed upon desolvation, causing a change in both the coordination environment of the CuII centres and the binding mode of the sulfido group on the sip3− bridging ligands. Before dehydration, both the central and peripheral CuII centres adopt square pyramidal coordination environments in which the sulfido group occupies the Jahn–Teller elongated apical coordination site, and the two symmetry-related peripheral copper centres also have a water molecule occupying an equatorial coordination site. After dehydration, all four copper centres are crystallographically distinct, and the equatorial water molecules on the peripheral Cu centres have been replaced by sulfido oxygen atoms. This shift in the sip ligands causes a change in the coordination environments of three of the four copper centres, which are best observed by comparison of Figure 10c,d. By opening the environmental gas cell and re-exposing the crystal to the air, the crystal takes up atmospheric water and reverts to the hydrated form of the crystal.
When using the gas cell to observe interactions between single crystals and the surrounding atmosphere, the environmental gas cell may be used as either a static atmosphere or a flow cell. To date, only one study has been published describing the use of the flow cell capabilities of the environmental gas cell at 11.3.1, namely the in situ oxidation of the coordination framework MFM-300 from VIII2(OH)2(L) (L = biphenyl-3,3′,5,5′-tetracarboxylate) to VIV2(O)2(L) [67]. This was achieved by heating the crystal to 150 °C for 2 h under a constant flow of air. The conversion of the framework from VIII-μ2-OH−-VIII to VIV-μ2-O2−-VIV (Figure 11) was observed by a contraction of this vanadium–oxygen bond length from 1.948(2) Å to 1.838(1) Å, and the loss of the hydrogen atom from the bridging hydroxide was confirmed in the bulk phase by neutron powder diffraction.
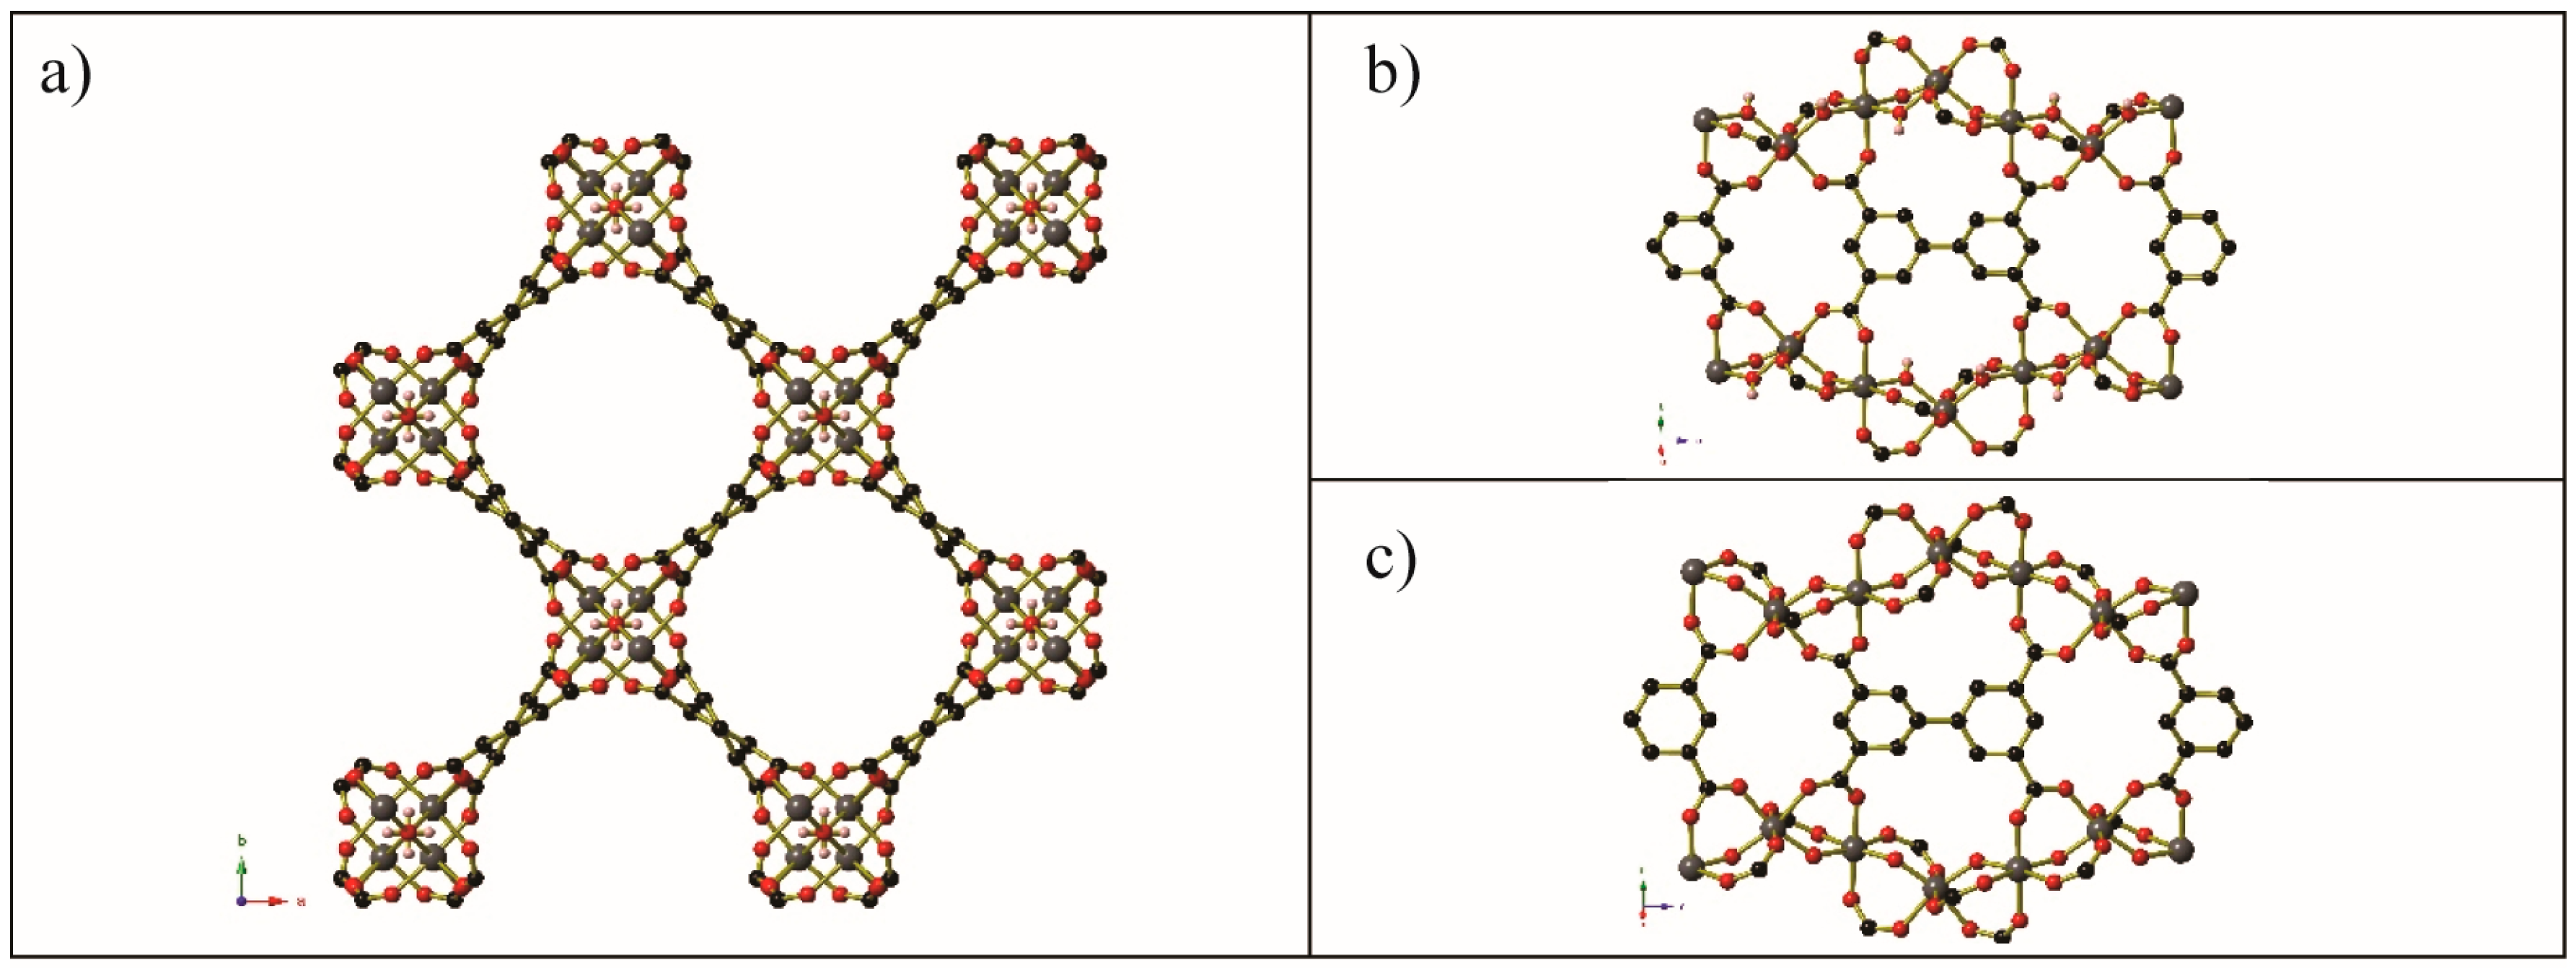
Experiments involving the dehydration and subsequent gas-loading of Co2(dobdc)(H2O)2 have been performed with a wide variety of gases. The porous honeycomb-like framework remains intact after activation, and the coordinated water molecules may be replaced with CO2 [68], NO [60], CO, CH4, and Ar (and N2 or O2 using a custom-made capillary gas loader at UC Berkeley) [62]. A selection of these is depicted in Figure 12. In the cases of CO2, O2, N2, and Ar, gas molecules are not limited to interacting with the vacant coordination sites on the Co centres of the frameworks; rather, there are additional gas molecules located within the channels of the framework.
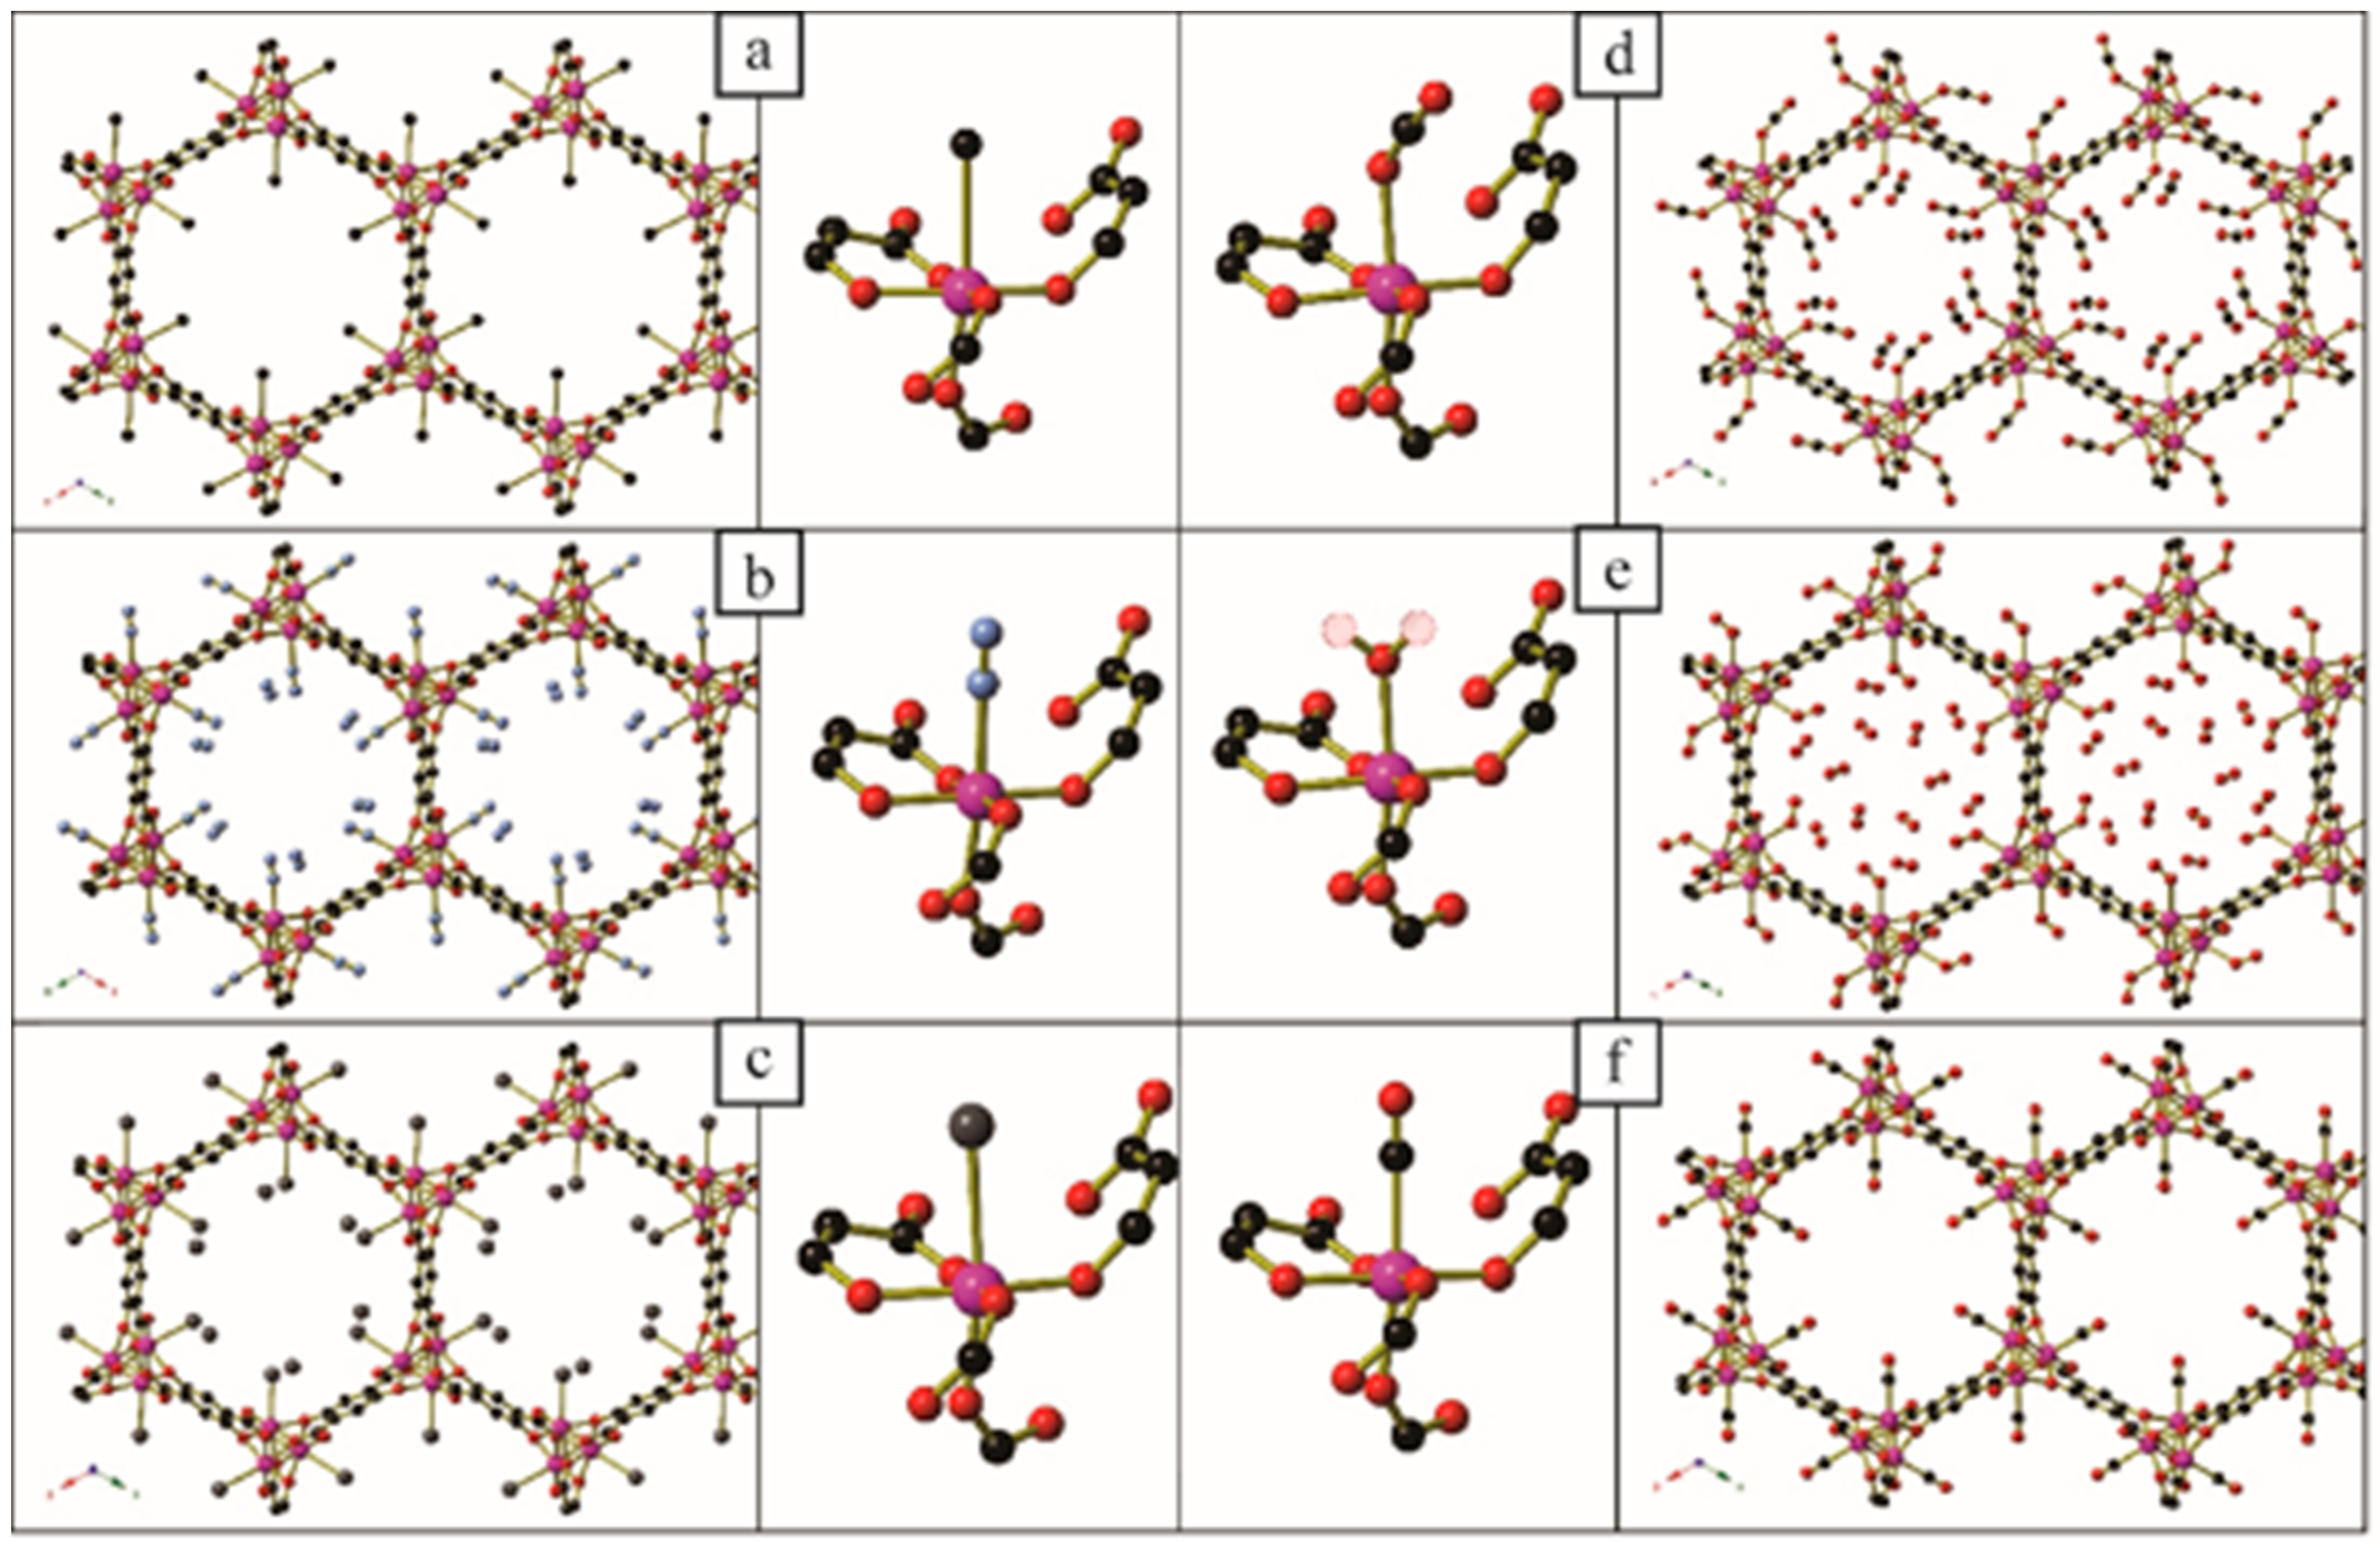
Gas-loading experiments using sealed capillaries in place of the gas cell have also been conducted on Co-BTTri (Co3[(Co4Cl)3(BTTri)8]2, BTTri = 1,3,5-tri(1H-1,2,3-triazol-5-yl)benzene) [69]. The desolvation and O2-loading steps were completed on different crystals, each of which was flame-sealed in a capillary under He or O2 atmosphere, respectively. While complete removal of coordinated methanol molecules could not be achieved (a peak of electron density corresponding to ~37.5% of an oxygen atom persisted above the framework Co centres), a coordinated O2 molecule could be observed bound to the framework Co centres after loading the crystal with oxygen gas (see Figure 13). The binding of O2 in place of methanol has a minimal effect on the Co–N bond lengths, and the gas-loaded crystal displays a Co–O bond length of 1.937(6) Å, which is suggestive of only partial reduction of the O2 as opposed to complete reduction to superoxide O2−.
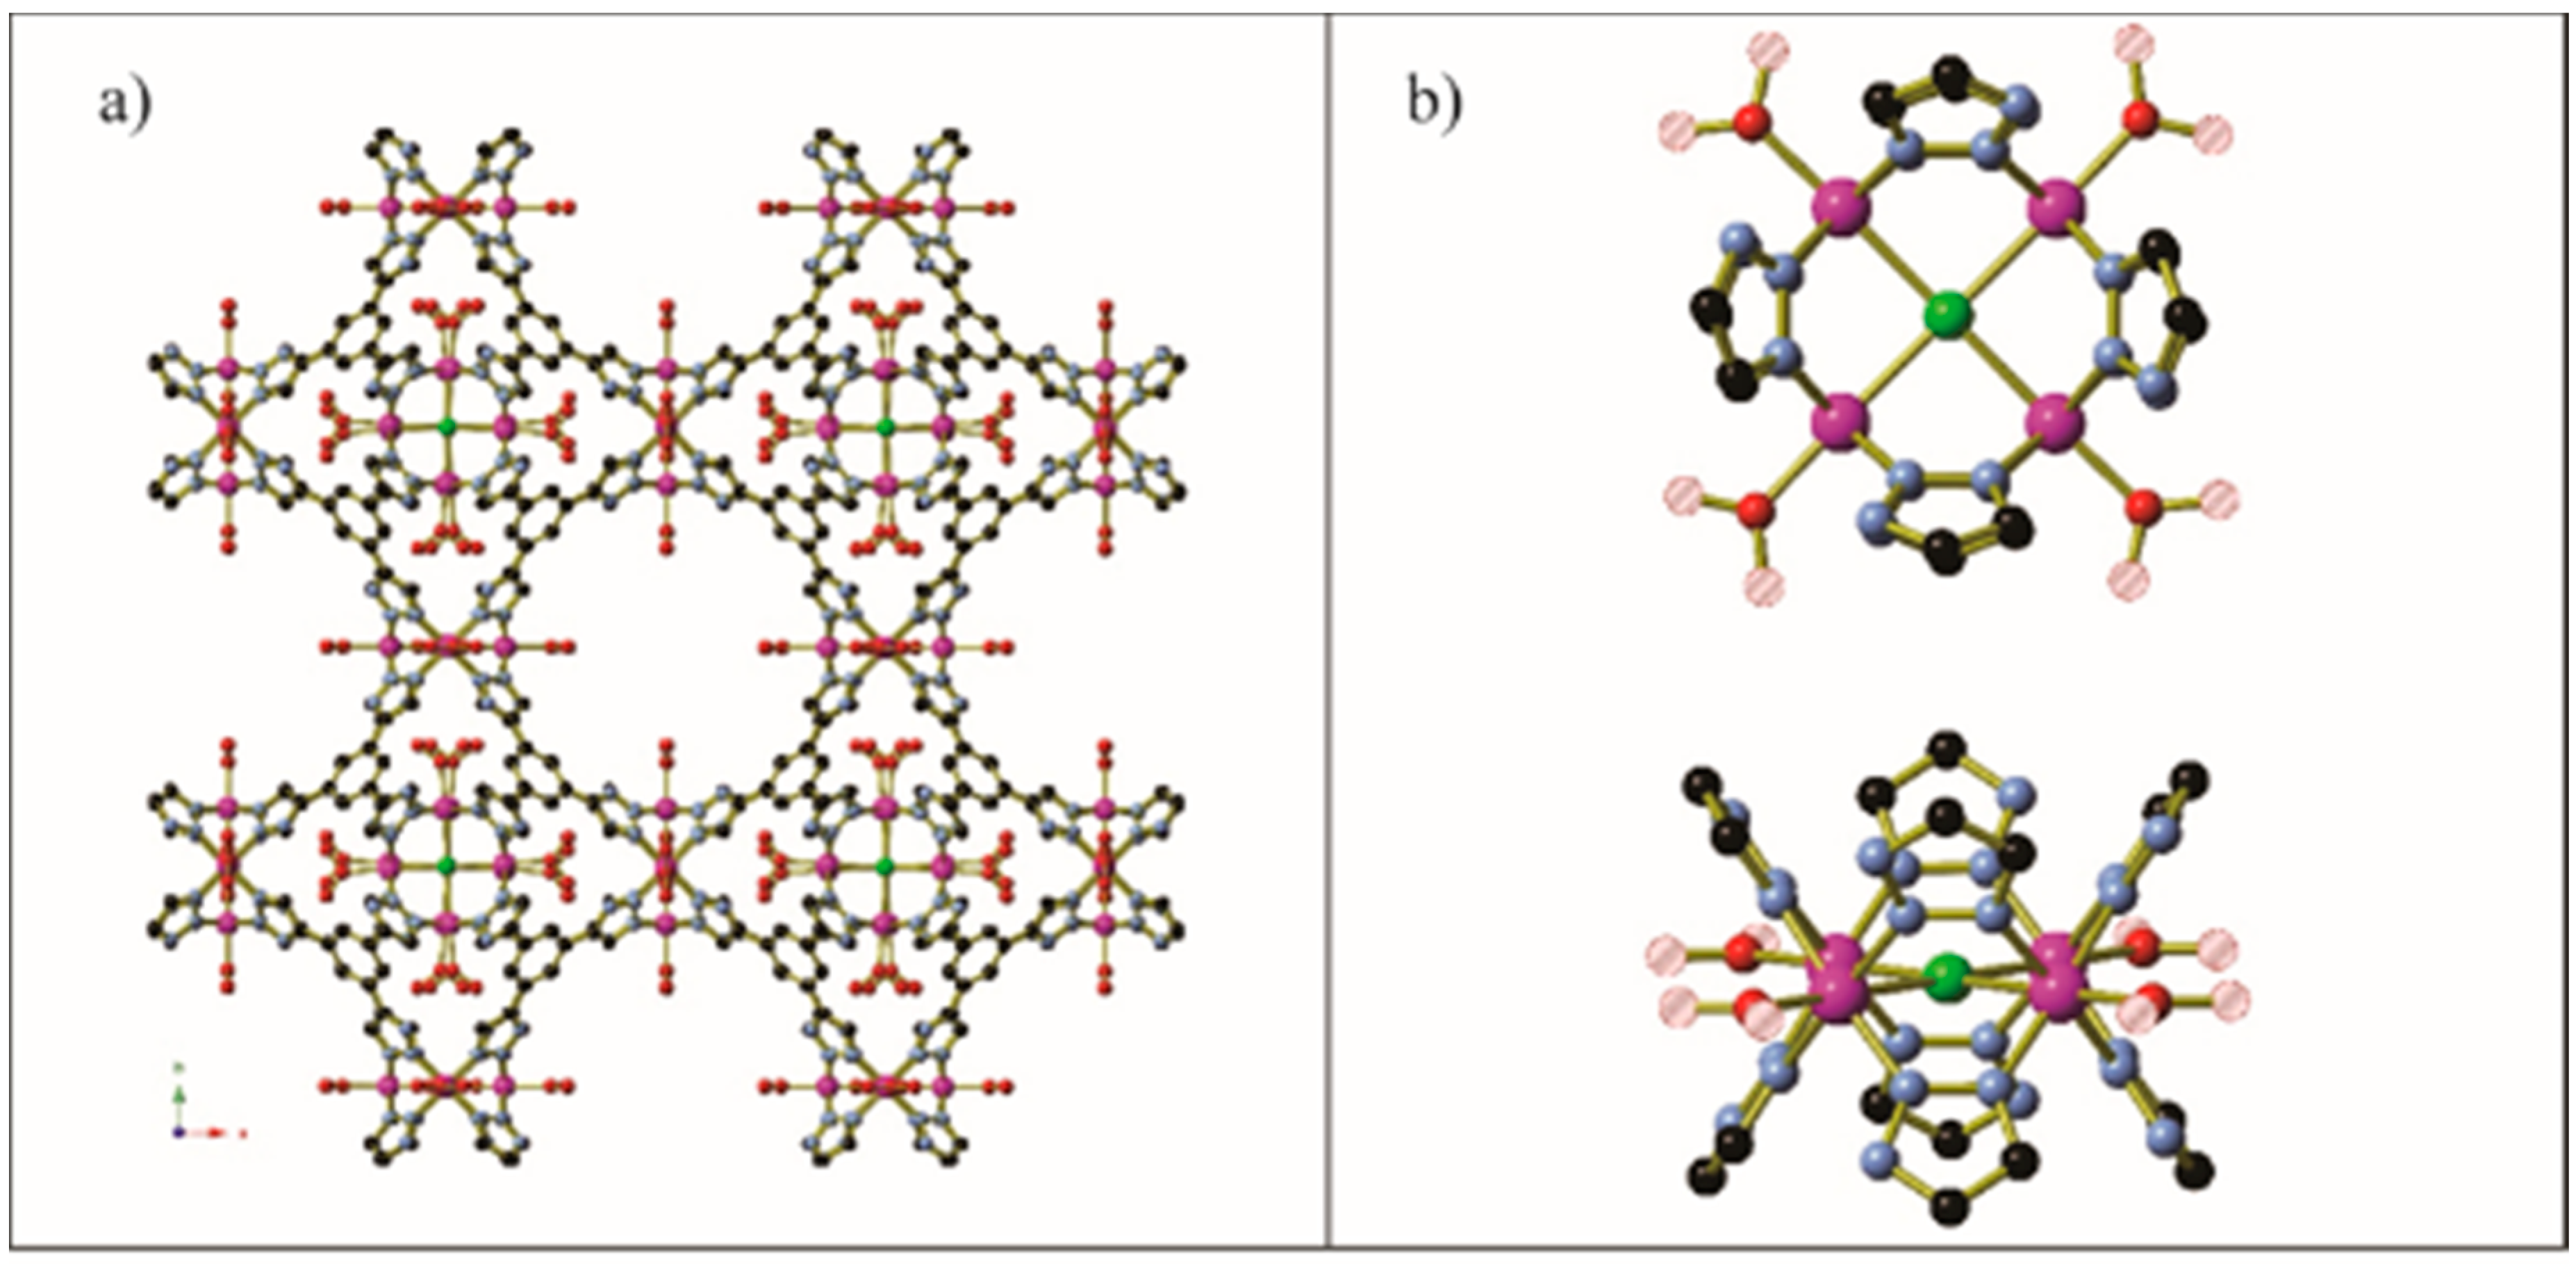
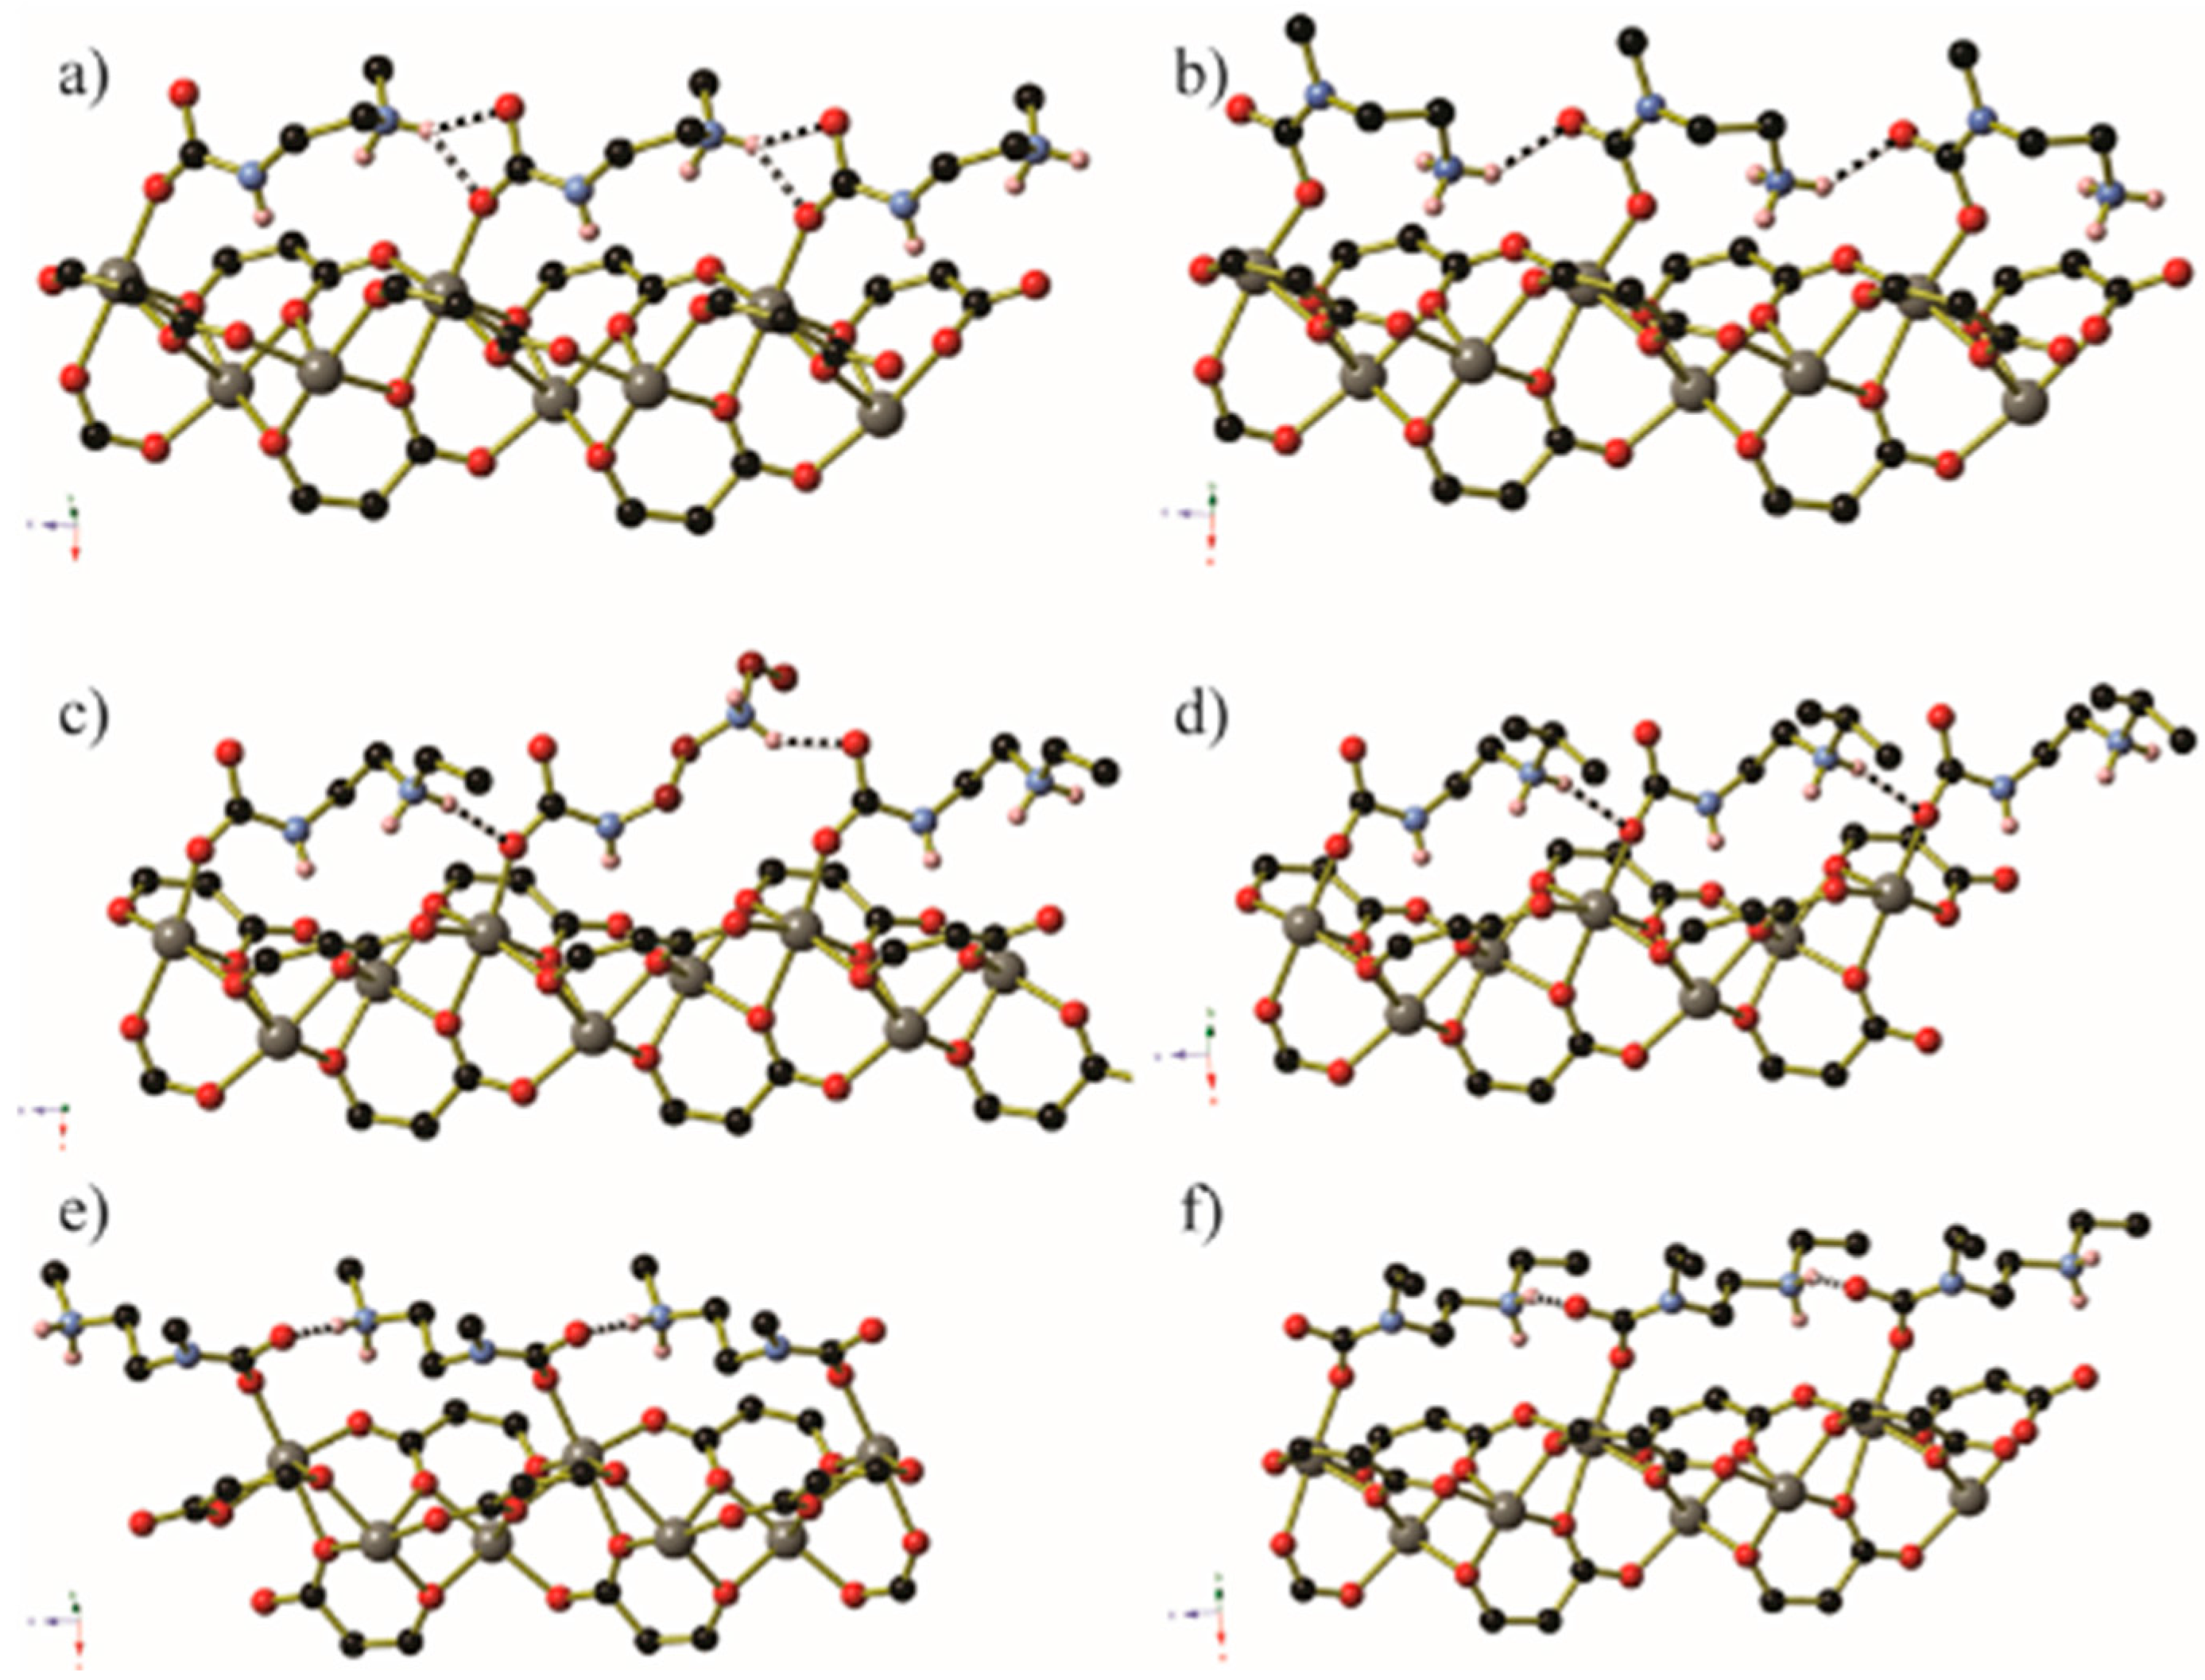
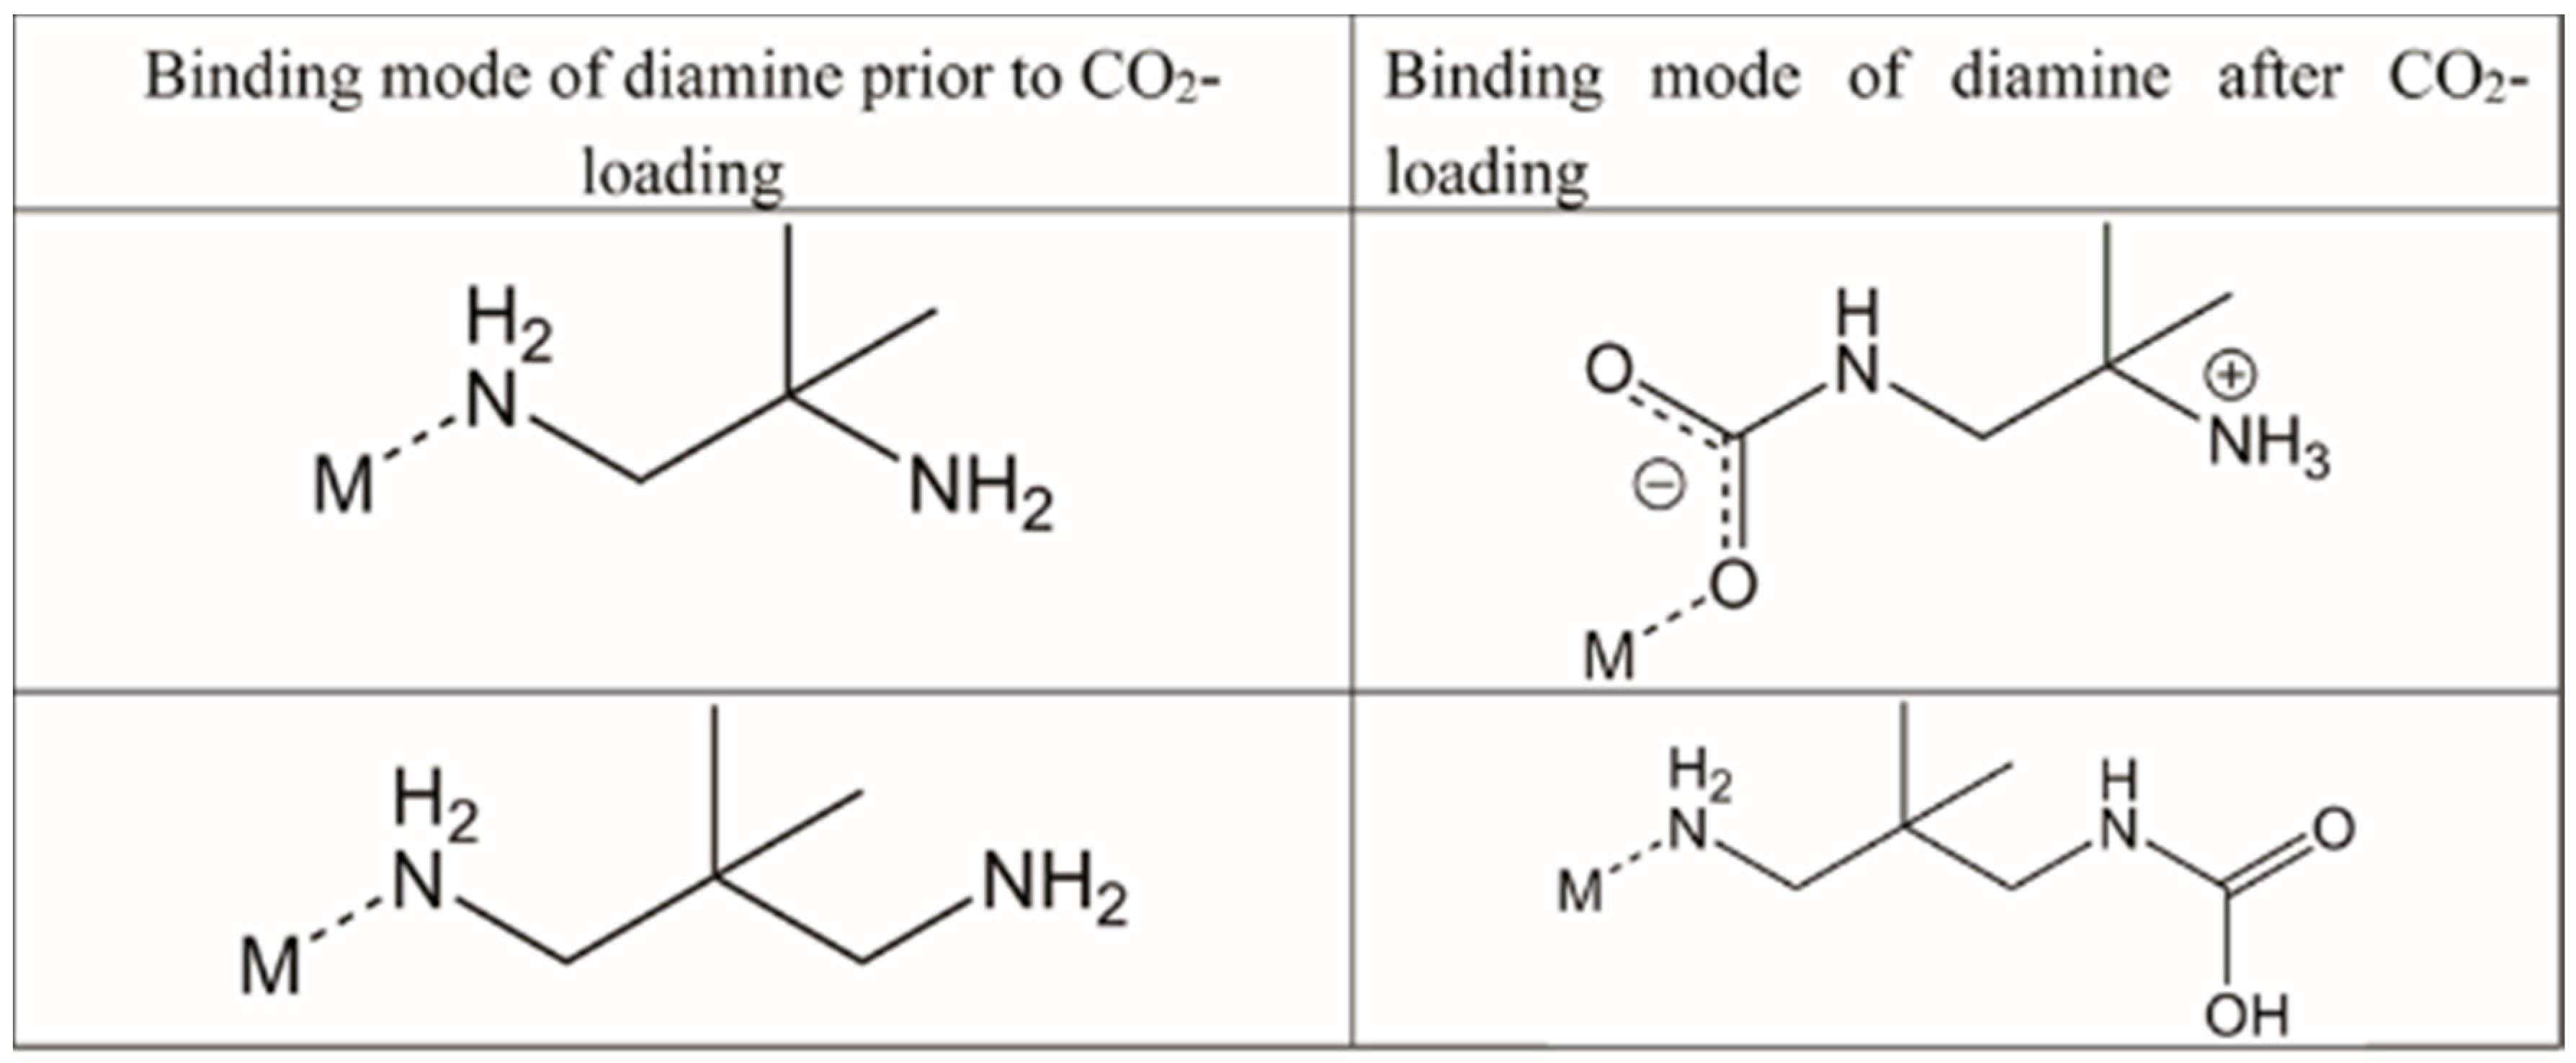
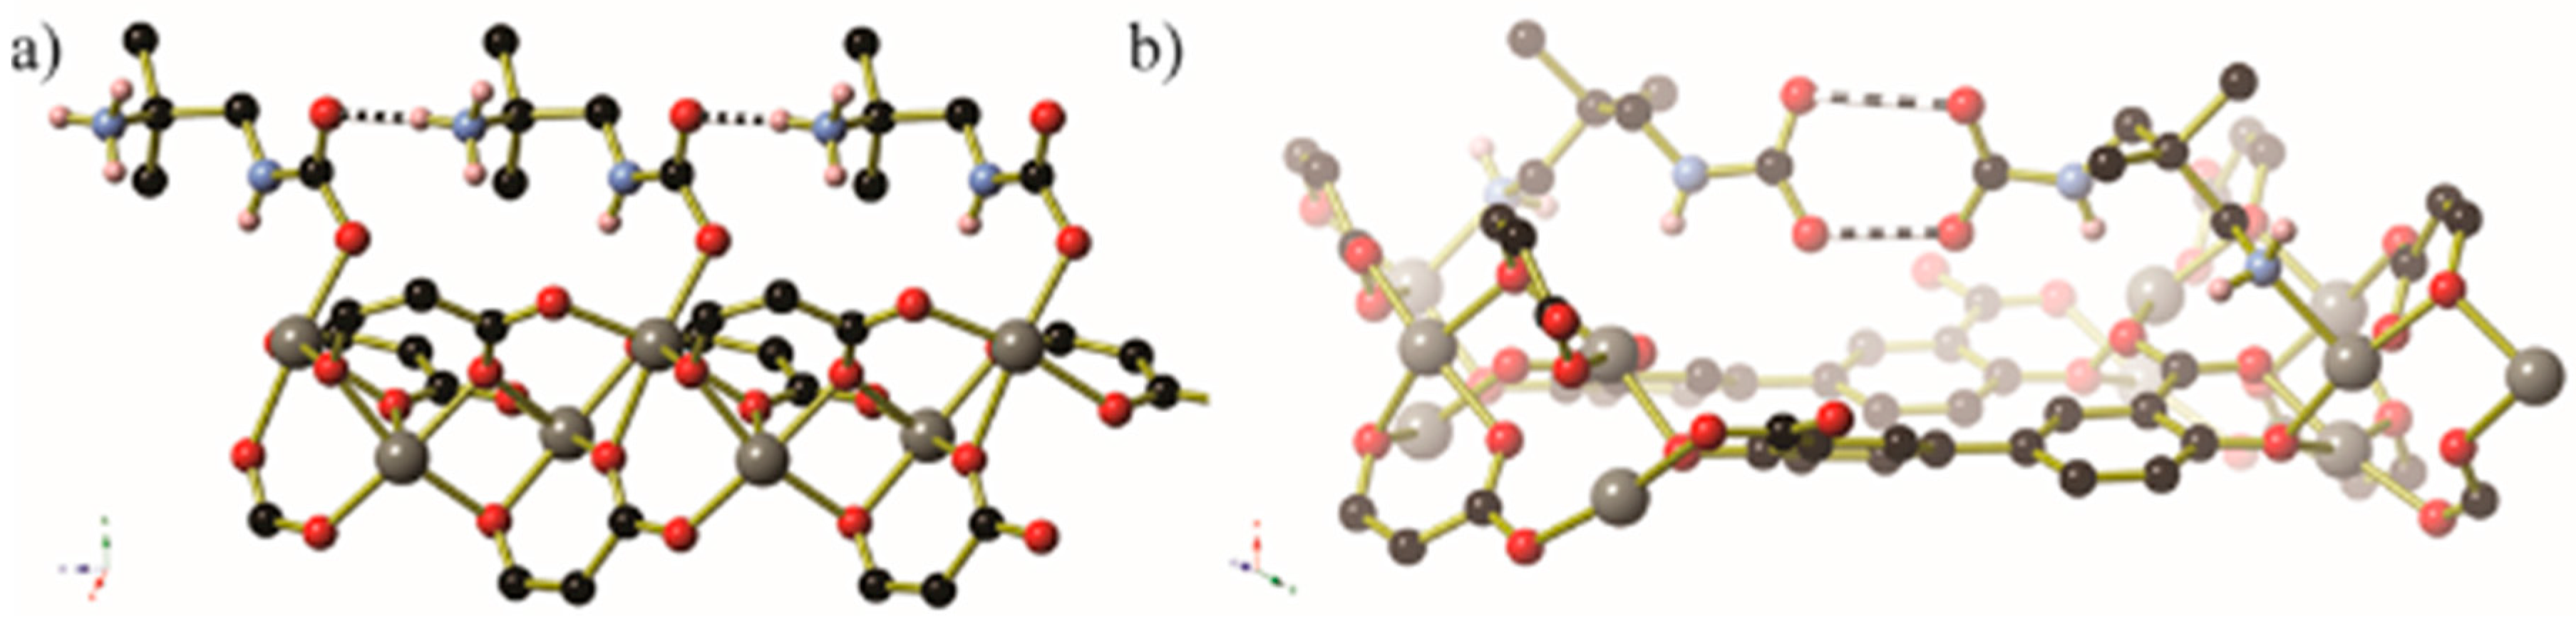
Guest gas molecules may interact with host systems in other ways besides binding to metals with vacant coordination sites. Recent work at the University of California, Berkeley [70], has shown that when N-alkylated ethylenediamines are appended to the Zn2(dobpdc) (dobpdc4− = 4,4′-dioxidobiphenyl-3,3′-dicarboxylate) coordination framework (Figure 14) it is possible for CO2 molecules to be inserted into the M–NH2R bond to give coordinated zwitterionic ammonium carbamate ligands. The coordinated carbamate anion then forms hydrogen bonds to the ammonium end of an adjacent ligand. The nature of this hydrogen bond varies from diamine to diamine, but is summarised in Table 2 and Figure 15. Similar CO2 insertion occurs when the appended diamines are (R,R)- and (S,S)-1,2-diaminocyclohexane [71].
In certain circumstances, the CO2 molecule reacts with the non-coordinated amine of the monodentate diamine molecule, giving rise to a carbamic acid moiety [72]. By lengthening the alkyl chain between the amines from ethyl to propyl, the CO2 binding mode changes from inserting between the metal centre and coordinated amine nitrogen atom to form a carbamate zwitterion, binding to the terminal amine group to give a carbamic acid (Figure 16 and Figure 17). The carbamic acid moieties participate in acetic acid-type hydrogen bonding pairs across the edges of the honeycomb-like Zn2(dobpdc) coordination framework, rather than along the columns of metal centres that extend parallel to the c-axis as occurs in the CO2-insertion cases described above (Figure 17).
5. The Future of Chemical Crystallography at the ALS
Beamline 11.3.1 began operating in 2004; in the following 13 years, nearly 700 peer-reviewed publications have resulted from this stable, user-friendly, high-intensity X-ray facility. 11.3.1 has never been the most intense chemical crystallography beamline; I19 at Diamond and ChemMatCARS at the APS have superior flux density. 11.3.1’s popularity can be explained by the combination of intensity and user-friendliness. Future plans for chemical crystallography at the ALS centre on retaining this combination while increasing the available X-ray flux and further optimizing for fast and reliable data collection.
In 2018, operations at 11.3.1 are scheduled to transfer to beamline 12.2.1, which has as its source a superconducting bending magnet. This new beamline will have two orders of magnitude more X-ray flux at 0.7749 Å, the typical data collection wavelength, as well as greater access to shorter wavelengths. The existing diffractometry will move to the new beamline, but additional systems are planned. A robotic diffractometer, from SmarAct, which has unlimited rotational access on ω and ϕ as well as high rotation rates, has been purchased, and is currently being commissioned offline. This will increase the data acquisition rate, due to its speed, especially if integrated with a high frame-rate pixel detector, and should be compatible with automated sample changing.
Beamline 12.2.2 will continue to have access to even shorter wavelength radiation than 12.2.1. This capability will be further exploited with the commissioned use of the Stoe Stadi-Vari Eulerian cradle diffractometer. This system will be able to hold 1 kg DACs with 10 μm stability, but will also be able to do ambient-pressure, short-wavelength diffraction, which may be attractive to those desiring charge density data. Both 12.2.1 and 12.2.2 will be equipped with high-resolution monochromators capable of a wide range of energies, and both are planning on incorporating X-ray fluorescence detectors, which will make resonant wavelength experiments much more accessible. In situ capabilities will continue to advance: an environmental gas cell capable of holding 300 bar of pressure will begin commissioning in early 2018.
As a user facility serving scientists worldwide, the Advanced Light Source has earned its reputation for excellence through consulting with its user base and meeting their scientific needs. The chemical crystallography-oriented beamlines at the ALS are no exception, and have succeeded primarily due the beamline scientists dedicating time and energy to giving users what they need. The future for chemical crystallography is bright at the ALS, and with further collaborations with user groups who desire more X-ray flux or access to in situ experiments, it can only become more brilliant.
Acknowledgments
The Advanced Light Source is a DOE Office of Science User Facility under contract no. DE-AC02-05CH11231. Beamline 12.2.2 and CMB are supported by supported by COMPRES, the Consortium for Materials Properties Research in Earth Sciences under NSF Cooperative Agreement EAR 1606856. NG is supported by The University of Edinburgh, EPSRC Doctoral Training Account & ALS Doctoral Fellowship. The development of the gas cell used in this work was partially funded by the Center for Gas Separations Relevant to Clean Energy Technologies, an Energy Frontier Research Center funded by the U.S. Department of Energy, Office of Science, Basic Energy Sciences under Award #DE-SC0001015.
Author Contributions
All authors participated in the conception and writing of the paper.
Conflicts of Interest
The authors declare no conflict of interest.
References and Notes
- Bragg, W.L. The structure of some crystals as indicated by their diffraction of X-rays. Proc. R. Soc. Lond. Ser. A 1913, 89, 248–277. [Google Scholar] [CrossRef]
- Bragg, W.H.; Bragg, W.L. The structure of the diamond. R. Soc. Lond. Ser. A 1913, 89, 277–291. [Google Scholar] [CrossRef]
- Becker, K.; Rose, H. Röntgenspektroskopie an organischen verbindungen. Z. Phys. 1923, 14, 369–373. [Google Scholar] [CrossRef]
- Robertson, J.M. 255. An X-ray study of the phthalocyanines. Part II. Quantitative structure determination of the metal-free compound. J. Chem. Soc. (Resumed) 1936, 1, 1195–1209. [Google Scholar] [CrossRef]
- Lipson, H.; Beevers, C.A. An improved numerical method of two-dimensional fourier synthesis for crystals. Proc. Phys. Soc. 1936, 48, 772. [Google Scholar] [CrossRef]
- Tate, M.W.; Eikenberry, E.F.; Barna, S.L.; Wall, M.E.; Lowrance, J.L.; Gruner, S.M. A large-format high-resolution area X-ray-detector based on a fiberoptically bonded charge-coupled-device (CCD). J. Appl. Cryst. 1995, 28, 196–205. [Google Scholar] [CrossRef]
- Sheldrick, G.M. A short history of SHELX. Acta Cryst. Sect. A 2008, 64, 112–122. [Google Scholar] [CrossRef] [PubMed]
- Woolfson, M.M. Direct methods in crystallography. Rep. Prog. Phys. 1971, 34, 369. [Google Scholar] [CrossRef]
- Groom, C.R.; Bruno, I.J.; Lightfoot, M.P.; Ward, S.C. The Cambridge structural database. Acta Cryst. Sect. B 2016, 72, 171–179. [Google Scholar] [CrossRef] [PubMed]
- Harding, M.M. Recording diffraction data for structure determination for very small crystals. J. Synchrotron Radiat. 1996, 3, 250–259. [Google Scholar] [CrossRef] [PubMed]
- Leigh, J.B.; Rosenbaum, G. Synchrotron X-ray sources: A new tool in biological structural and kinetic analysis. Annu. Rev. Biophys. Bioeng. 1976, 5, 239–270. [Google Scholar] [CrossRef] [PubMed]
- Harmsen, A.; Leberman, R.; Schulz, G.E. Comparison of protein crystal diffraction patterns and absolute intensities from synchrotron and conventional X-ray sources. J. Mol. Biol. 1976, 104, 311–314. [Google Scholar] [CrossRef]
- Einfeld, D.; Klotz, W.D.; Muelhaupt, G.; Mueller, T.; Richter, R. Bessy, an 800 MeV storage ring dedicated to synchrotron radiation. IEEE Trans. Nucl. Sci. 1979, 26, 3801–3802. [Google Scholar] [CrossRef]
- Duke, E.M.H.; Johnson, L.N. Macromolecular crystallography at synchrotron radiation sources: Current status and future developments. Proc. R. Soc. A Math. Phys. Eng. Sci. 2010, 466, 3421–3452. [Google Scholar] [CrossRef]
- Wu, G.; Rodrigues, B.L.; Coppens, P. The correction of reflection intensities for incomplete absorption of high-energy X-rays in the CCD phosphor. J. Appl. Cryst. 2002, 35, 356–359. [Google Scholar] [CrossRef]
- There is a discrepency in how instruments were referred to at the SRS versus most modern light source facilites. At the SRS, beamlines were referred to as “Stations,” probably due to the fact that multiple instrumental stations were arranged about a common beamline. At most modern facilites, beamlines are single purpose, and branchlines are indicated in the facilites’ naming convention.
- Cernik, R.J.; Clegg, W.; Catlow, C.R.A.; Bushnell-Wye, G.; Flaherty, J.V.; Greaves, G.N.; Burrows, I.; Taylor, D.J.; Teat, S.J.; Hamichi, M. A new high-flux chemical and materials crystallography station at the SRS Daresbury. 1. Design, construction and test results. J. Synchrotron Radiat. 1997, 4, 279–286. [Google Scholar] [CrossRef] [PubMed]
- Bom, A.; Bradley, M.; Cameron, K.; Clark, J.K.; Van Egmond, J.; Feilden, H.; MacLean, E.J.; Muir, A.W.; Palin, R.; Rees, D.C.; et al. A novel concept of reversing neuromuscular block: Chemical encapsulation of rocuronium bromide by a cyclodextrin-based synthetic host. Angew. Chem. Int. Ed. 2002, 41, 265–270. [Google Scholar] [CrossRef]
- Rajaraman, G.; Murugesu, M.; Sañudo, E.C.; Soler, M.; Wernsdorfer, W.; Helliwell, M.; Muryn, C.; Raftery, J.; Teat, S.J.; Christou, G.; Brechin, E.K. A family of manganese rods: Syntheses, structures, and magnetic properties. J. Am. Chem. Soc. 2004, 126, 15445–15457. [Google Scholar] [CrossRef] [PubMed]
- Dawson, A.; Allan, D.R.; Belmonte, S.A.; Clark, S.J.; David, W.I.F.; McGregor, P.A.; Parsons, S.; Pulham, C.R.; Sawyer, L. Effect of high pressure on the crystal structures of polymorphs of glycine. Cryst. Growth Des. 2005, 5, 1415–1427. [Google Scholar] [CrossRef]
- Warren, M.R.; Brayshaw, S.K.; Johnson, A.L.; Schiffers, S.; Raithby, P.R.; Easun, T.L.; George, M.W.; Warren, J.E.; Teat, S.J. Reversible 100% linkage isomerization in a single-crystal to single-crystal transformation: Photocrystallographic identification of the metastable [Ni(dppe)(η1-ONO)Cl] isomer. Angew. Chem. Int. Ed. 2009, 48, 5711–5714. [Google Scholar] [CrossRef] [PubMed]
- Cerenius, Y.; Stahl, K.; Svensson, L.A.; Ursby, T.; Oskarsson, A.; Albertsson, J.; Liljas, A. The crystallography beamline I711 at MAX II. J. Synchrotron Radiat. 2000, 7, 203–208. [Google Scholar] [CrossRef] [PubMed]
- Nowell, H.; Barnett, S.A.; Christensen, K.E.; Teat, S.J.; Allan, D.R. I19, the small-molecule single-crystal diffraction beamline at Diamond Light Source. J. Synchrotron Radiat. 2012, 19, 435–441. [Google Scholar] [CrossRef] [PubMed]
- Bachmann, R.; Kohler, H.; Schulz, H.; Weber, H.P. Structure investigation of a 6μm CaF2 crystal with synchrotron radiation. Acta Cryst. Sect. A Found. Cryst. 1985, 41, 35–40. [Google Scholar] [CrossRef]
- Caciuffo, R.; Melone, S.; Rustichelli, F.; Boeuf, A. Monochromators for X-ray synchrotron radiation. Phys. Rep. 1987, 152, 1–71. [Google Scholar] [CrossRef]
- Beaumont, J.H.; Hart, M. Multiple Bragg reflection monochromators for synchrotron X radiation. J. Phys. E Sci. Instrum. 1974, 7, 823. [Google Scholar] [CrossRef]
- Clegg, W. Synchrotron chemical crystallography. J. Chem. Soc. Dalton Trans. 2000, 19, 3223–3232. [Google Scholar] [CrossRef]
- Helliwell, M. Anomalous scattering for small-molecule crystallography. J. Synchrotron Radiat. 2000, 7, 139–147. [Google Scholar] [CrossRef] [PubMed]
- Merrill, L.; Bassett, W.A. Miniature diamond anvil pressure cell for single crystal X-ray diffraction studies. Rev. Sci. Instrum. 1974, 45, 290–294. [Google Scholar] [CrossRef]
- Thompson, A.C.; Padmore, H.A.; Oliver, A.G.; Teat, S.J.; Celestre, R.S.; Clark, S.M.; Domning, E.E.; Franck, K.D.; Morrison, G.Y. A simple high performance beamline for small molecule chemical crystallography. AIP Conf. Proc. 2004, 708, 482–493. [Google Scholar]
- Padmore, H.A.; Thompson, A.C.; Jun, F. A double crystal monochromator using tangentially bent crystals in combination with toroidal mirror focusing. Nucl. Instrum. Methods Phys. Res. A 2001, 467, 650–653. [Google Scholar] [CrossRef]
- Flechsig, U.; Jaggi, A.; Spielmann, S.; Padmore, H.A.; MacDowell, A.A. The optics beamline at the Swiss Light Source. Nucl. Instrum. Methods Phys. Res. A 2009, 609, 281–285. [Google Scholar] [CrossRef]
- There is often confusion when crystallographers first become acquainted with a beamline, due to the synchrotron tendency to describe beamlines and instruments by energy and not wavelength. Attempts have been made here to only refer to wavelengths, but a simple aproximation can be done if energy units are needed: E(keV) = 12/(lambda(Å)).
- Robin, D.; Benjegerdes, R.; Biocca, A.; Bish, P.; Brown, W.; Byrne, W.; Calais, D.; Chin, M.; Corradi, C.; Coulomb, D.; et al. Successful completion of the ALS superbend project. Presented at the European Particle Accelerator Conference, Paris, France, 3–7 June 2002; pp. 215–217. [Google Scholar]
- MacDowell, A.A.; Celestre, R.S.; Howells, M.; McKinney, W.; Krupnick, J.; Cambie, D.; Domning, E.E.; Duarte, R.M.; Kelez, N.; Plate, D.W.; et al. Suite of three protein crystallography beamlines with single superconducting bend magnet as the source. J. Synchrotron Radiat. 2004, 11, 447–455. [Google Scholar] [CrossRef] [PubMed]
- MacDowell, A.; Parkinson, D.; Haboub, A.; Schaible, E.; Nasiatka, J.; Yee, C.; Jameson, J.; Ajo-Franklin, J.; Brodersen, C.R.; McElrone, A.J. X-ray micro-tomography at the Advanced Light Source. Proc. SPIE 2012. [Google Scholar] [CrossRef]
- Kunz, M.; MacDowell, A.A.; Caldwell, W.A.; Cambie, D.; Celestre, R.S.; Domning, E.E.; Duarte, R.M.; Gleason, A.E.; Glossinger, J.M.; Kelez, N.; et al. A beamline for high-pressure studies at the Advanced Light Source with a superconducting bending magnet as the source. J. Synchrotron Radiat. 2005, 12, 650–658. [Google Scholar] [CrossRef] [PubMed]
- Tamura, N.; Kunz, M.; Chen, K.; Celestre, R.S.; MacDowell, A.A.; Warwick, T. A superbend X-ray microdiffraction beamline at the advanced light source. Mater. Sci. Eng. A 2009, 524, 28–32. [Google Scholar] [CrossRef]
- Katrusiak, A. High-pressure crystallography. Acta Cryst. Sect. A 2008, 64, 135–148. [Google Scholar] [CrossRef] [PubMed]
- Boldyreva, E.V. High-pressure diffraction studies of molecular organic solids. A personal view. Acta Cryst. Sect. A 2008, 64, 218–231. [Google Scholar] [CrossRef] [PubMed]
- Ballaran, T.B.; Kurnosov, A.; Trots, D. Single-crystal X-ray diffraction at extreme conditions: A review. High Press. Res. 2013, 33, 453–465. [Google Scholar] [CrossRef]
- Moggach, S.A.; Allan, D.R.; Parsons, S.; Warren, J.E. Incorporation of a new design of backing seat and anvil in a Merrill-Bassett diamond anvil cell. J. Appl. Cryst. 2008, 41, 249–251. [Google Scholar] [CrossRef]
- Kantor, I.; Prakapenka, V.; Kantor, A.; Dera, P.; Kurnosov, A.; Sinogeikin, S.; Dubrovinskaia, N.; Dubrovinsky, L. BX90: A new diamond anvil cell design for X-ray diffraction and optical measurements. Rev. Sci. Instrum. 2012, 83, 125102. [Google Scholar] [CrossRef] [PubMed]
- Woodall, C.H.; Brayshaw, S.K.; Schiffers, S.; Allan, D.R.; Parsons, S.; Valiente, R.; Raithby, P.R. High-pressure crystallographic and spectroscopic studies on two molecular dithienylethene switches. CrystEngComm 2014, 16, 2119–2128. [Google Scholar] [CrossRef] [Green Version]
- Gagnon, K.J.; Beavers, C.M.; Clearfield, A. MOFs under pressure: The reversible compression of a single crystal. J. Am. Chem. Soc. 2013, 135, 1252–1255. [Google Scholar] [CrossRef] [PubMed]
- Ortiz, A.U.; Boutin, A.; Gagnon, K.J.; Clearfield, A.; Coudert, F.X. Remarkable pressure responses of metal-organic frameworks: Proton transfer and linker coiling in zinc alkyl gates. J. Am. Chem. Soc. 2014, 136, 11540–11545. [Google Scholar] [CrossRef] [PubMed]
- Kapustin, E.A.; Lee, S.; Alshammari, A.S.; Yaghi, O.M. Molecular retrofitting adapts a metal-organic framework to extreme pressure. ACS Cent. Sci. 2017, 3, 662–667. [Google Scholar] [CrossRef] [PubMed]
- Woodall, C.H.; Fuertes, S.; Beavers, C.M.; Hatcher, L.E.; Parlett, A.; Shepherd, H.J.; Christensen, J.; Teat, S.J.; Intissar, M.; Rodrigue-Witchel, A.; et al. Tunable trimers: Using temperature and pressure to control luminescent emission in Gold(I) pyrazolate-based trimers. Chem. Eur. J. 2014, 20, 16933–16942. [Google Scholar] [CrossRef] [PubMed] [Green Version]
- Shepherd, H.; Tonge, G.; Hatcher, L.; Bryant, M.; Knichal, J.; Raithby, P.; Halcrow, M.; Kulmaczewski, R.; Gagnon, K.; Teat, S. A high pressure investigation of the order-disorder phase transition and accompanying spin crossover in [FeL12](ClO4)2 (L1 = 2,6-bis{3-methylpyrazol-1-yl}-pyrazine). Magnetochemistry 2016, 2, 9. [Google Scholar] [CrossRef] [Green Version]
- Rodríguez-Velamazán, J.A.; Fabelo, O.; Beavers, C.M.; Natividad, E.; Evangelisti, M.; Roubeau, O. A Multifunctional Magnetic Material under Pressure. Chem. Eur. J. 2014, 20, 7956–7961. [Google Scholar] [CrossRef] [PubMed]
- Woodall, C.H.; Christensen, J.; Skelton, J.M.; Hatcher, L.E.; Parlett, A.; Raithby, P.R.; Walsh, A.; Parker, S.C.; Beavers, C.M.; Teat, S.J.; et al. Observation of a re-entrant phase transition in the molecular complex tris([mu]2-3,5-diisopropyl-1,2,4-triazolato-[kappa]2N1:N2)trigold(I) under high pressure. IUCrJ 2016, 3, 367–376. [Google Scholar] [CrossRef] [PubMed]
- O’Bannon, E.; Beavers, C.M.; Kunz, M.; Williams, Q. The high-pressure phase of lawsonite: A single crystal study of a key mantle hydrous phase. J. Geophys. Res. Solid Earth 2017, 122, 6294–6305. [Google Scholar] [CrossRef]
- Jaffe, A.; Lin, Y.; Beavers, C.M.; Voss, J.; Mao, W.L.; Karunadasa, H.I. High-Pressure single-crystal structures of 3D lead-halide hybrid perovskites and pressure effects on their electronic and optical properties. ACS Cent. Sci. 2016, 2, 201–209. [Google Scholar] [CrossRef] [PubMed]
- Brayshaw, S.K.; Knight, J.W.; Raithby, P.R.; Savarese, T.L.; Schiffers, S.; Teat, S.J.; Warren, J.E.; Warren, M.R. Photocrystallography — Design and methodology for the use of a light-emitting diode device. J. Appl. Cryst. 2010, 43, 337–340. [Google Scholar] [CrossRef]
- Brayshaw, S.K.; Easun, T.L.; George, M.W.; Griffin, A.M.E.; Johnson, A.L.; Raithby, P.R.; Savarese, T.L.; Schiffers, S.; Warren, J.E.; Warren, M.R.; et al. Photocrystallographic identification of metastable nitrito linkage isomers in a series of nickel(ii) complexes. Dalton Trans. 2012, 41, 90–97. [Google Scholar] [CrossRef] [PubMed]
- Warren, M.R.; Brayshaw, S.K.; Hatcher, L.E.; Johnson, A.L.; Schiffers, S.; Warren, A.J.; Teat, S.J.; Warren, J.E.; Woodall, C.H.; Raithby, P.R. Photoactivated linkage isomerism in single crystals of nickel, palladium and platinum di-nitro complexes — A photocrystallographic investigation. Dalton Trans. 2012, 41, 13173–13179. [Google Scholar] [CrossRef] [PubMed] [Green Version]
- Brayshaw, S.K.; Schiffers, S.; Stevenson, A.J.; Teat, S.J.; Warren, M.R.; Bennett, R.D.; Sazanovich, I.V.; Buckley, A.R.; Weinstein, J.A.; Raithby, P.R. Highly efficient visible-light driven photochromism: Developments towards a solid-state molecular switch operating through a triplet-sensitised pathway. Chem. Eur. J. 2011, 17, 4385–4395. [Google Scholar] [CrossRef] [PubMed]
- Warren, J.E.; Pritchard, R.G.; Abram, D.; Davies, H.M.; Savarese, T.L.; Cash, R.J.; Raithby, P.R.; Morris, R.; Jones, R.H.; Teat, S.J. A prototype environmental gas cell for in situ small-molecule X-ray diffraction. J. Appl. Cryst. 2009, 42, 457–460. [Google Scholar] [CrossRef]
- Cox, J.M.; Walton, I.M.; Benson, C.A.; Chen, Y.S.; Benedict, J.B. A versatile environmental control cell for in situ guest exchange single-crystal diffraction. J. Appl. Cryst. 2015, 48, 578–581. [Google Scholar] [CrossRef]
- Allan, P.K. A Study of Metal-Organic Frameworks for the Storage and Release of Medical Gases. Ph.D. Thesis, University of St Andrews, St Andrews, UK, 2012. [Google Scholar]
- Renouf, C.L. Coordinatively Unsaturated Metal-Organic Frameworks for Olefin Separations. Ph.D. Thesis, University of St Andrews, St Andrews, UK, 2013. [Google Scholar]
- Gonzalez, M.I.; Mason, J.A.; Bloch, E.D.; Teat, S.J.; Gagnon, K.J.; Morrison, G.Y.; Queen, W.L.; Long, J.R. Structural characterization of framework-gas interactions in the metal-organic framework Co2(dobdc) by in situ single-crystal X-ray diffraction. Chem. Sci. 2017, 8, 4387–4398. [Google Scholar] [CrossRef] [PubMed]
- Mercado, R.; Vlaisavljevich, B.; Lin, L.C.; Lee, K.; Lee, Y.; Mason, J.A.; Xiao, D.J.; Gonzalez, M.I.; Kapelewski, M.T.; Neaton, J.B.; et al. Force field development from periodic density functional theory calculations for gas separation applications using metal-organic frameworks. J. Phys. Chem. C 2016, 120, 12590–12604. [Google Scholar] [CrossRef]
- Furukawa, H.; Gándara, F.; Zhang, Y.B.; Jiang, J.; Queen, W.L.; Hudson, M.R.; Yaghi, O.M. Water adsorption in porous metal-organic frameworks and related materials. J. Am. Chem. Soc. 2014, 136, 4369–4381. [Google Scholar] [CrossRef] [PubMed]
- Trickett, C.A.; Gagnon, K.J.; Lee, S.; Gándara, F.; Bürgi, H.B.; Yaghi, O.M. Definitive molecular level characterization of defects in UiO-66 crystals. Angew. Chem. Int. Ed. 2015, 54, 11162–11167. [Google Scholar] [CrossRef] [PubMed]
- Allan, P.K.; Xiao, B.; Teat, S.J.; Knight, J.W.; Morris, R.E. In situ single-crystal diffraction studies of the structural transition of metal-organic framework copper 5-sulfoisophthalate, Cu-SIP-3. J. Am. Chem. Soc. 2010, 132, 3605–3611. [Google Scholar] [CrossRef] [PubMed]
- Lu, Z.; Godfrey, H.G.W.; da Silva, I.; Cheng, Y.; Savage, M.; Tuna, F.; McInnes, E.J.L.; Teat, S.J.; Gagnon, K.J.; Frogley, M.D.; et al. Modulating supramolecular binding of carbon dioxide in a redox-active porous metal-organic framework. Nat. Commun. 2017, 8, 14212. [Google Scholar] [CrossRef] [PubMed]
- Queen, W.L.; Hudson, M.R.; Bloch, E.D.; Mason, J.A.; Gonzalez, M.I.; Lee, J.S.; Gygi, D.; Howe, J.D.; Lee, K.; Darwish, T.A.; et al. Comprehensive study of carbon dioxide adsorption in the metal-organic frameworks M2(dobdc) (M = Mg, Mn, Fe, Co, Ni, Cu, Zn). Chem. Sci. 2014, 5, 4569–4581. [Google Scholar] [CrossRef]
- Xiao, D.J.; Gonzalez, M.I.; Darago, L.E.; Vogiatzis, K.D.; Haldoupis, E.; Gagliardi, L.; Long, J.R. Selective, tunable O2 binding in Cobalt(II)–triazolate/pyrazolate metal-organic frameworks. J. Am. Chem. Soc. 2016, 138, 7161–7170. [Google Scholar] [CrossRef] [PubMed]
- Siegelman, R.L.; McDonald, T.M.; Gonzalez, M.I.; Martell, J.D.; Milner, P.J.; Mason, J.A.; Berger, A.H.; Bhown, A.S.; Long, J.R. Controlling cooperative CO2 adsorption in diamine-appended Mg2(dobpdc) metal-organic frameworks. J. Am. Chem. Soc. 2017, 139, 10526–10538. [Google Scholar] [CrossRef] [PubMed]
- Martell, J.D.; Porter-Zasada, L.B.; Forse, A.C.; Siegelman, R.L.; Gonzalez, M.I.; Oktawiec, J.; Runčevski, T.; Xu, J.; Srebro-Hooper, M.; Milner, P.J.; et al. Enantioselective recognition of ammonium carbamates in a chiral metal-organic framework. J. Am. Chem. Soc. 2017, 139, 16000–16012. [Google Scholar] [CrossRef] [PubMed]
- Milner, P.J.; Siegelman, R.L.; Forse, A.C.; Gonzalez, M.I.; Runčevski, T.; Martell, J.D.; Reimer, J.A.; Long, J.R. A diaminopropane-appended metal-organic framework enabling efficient CO2 capture from coal flue gas via a mixed adsorption mechanism. J. Am. Chem. Soc. 2017, 139, 13541–13553. [Google Scholar] [CrossRef] [PubMed]
Figure 1.
The experimental end station on beamline 11.3.1.
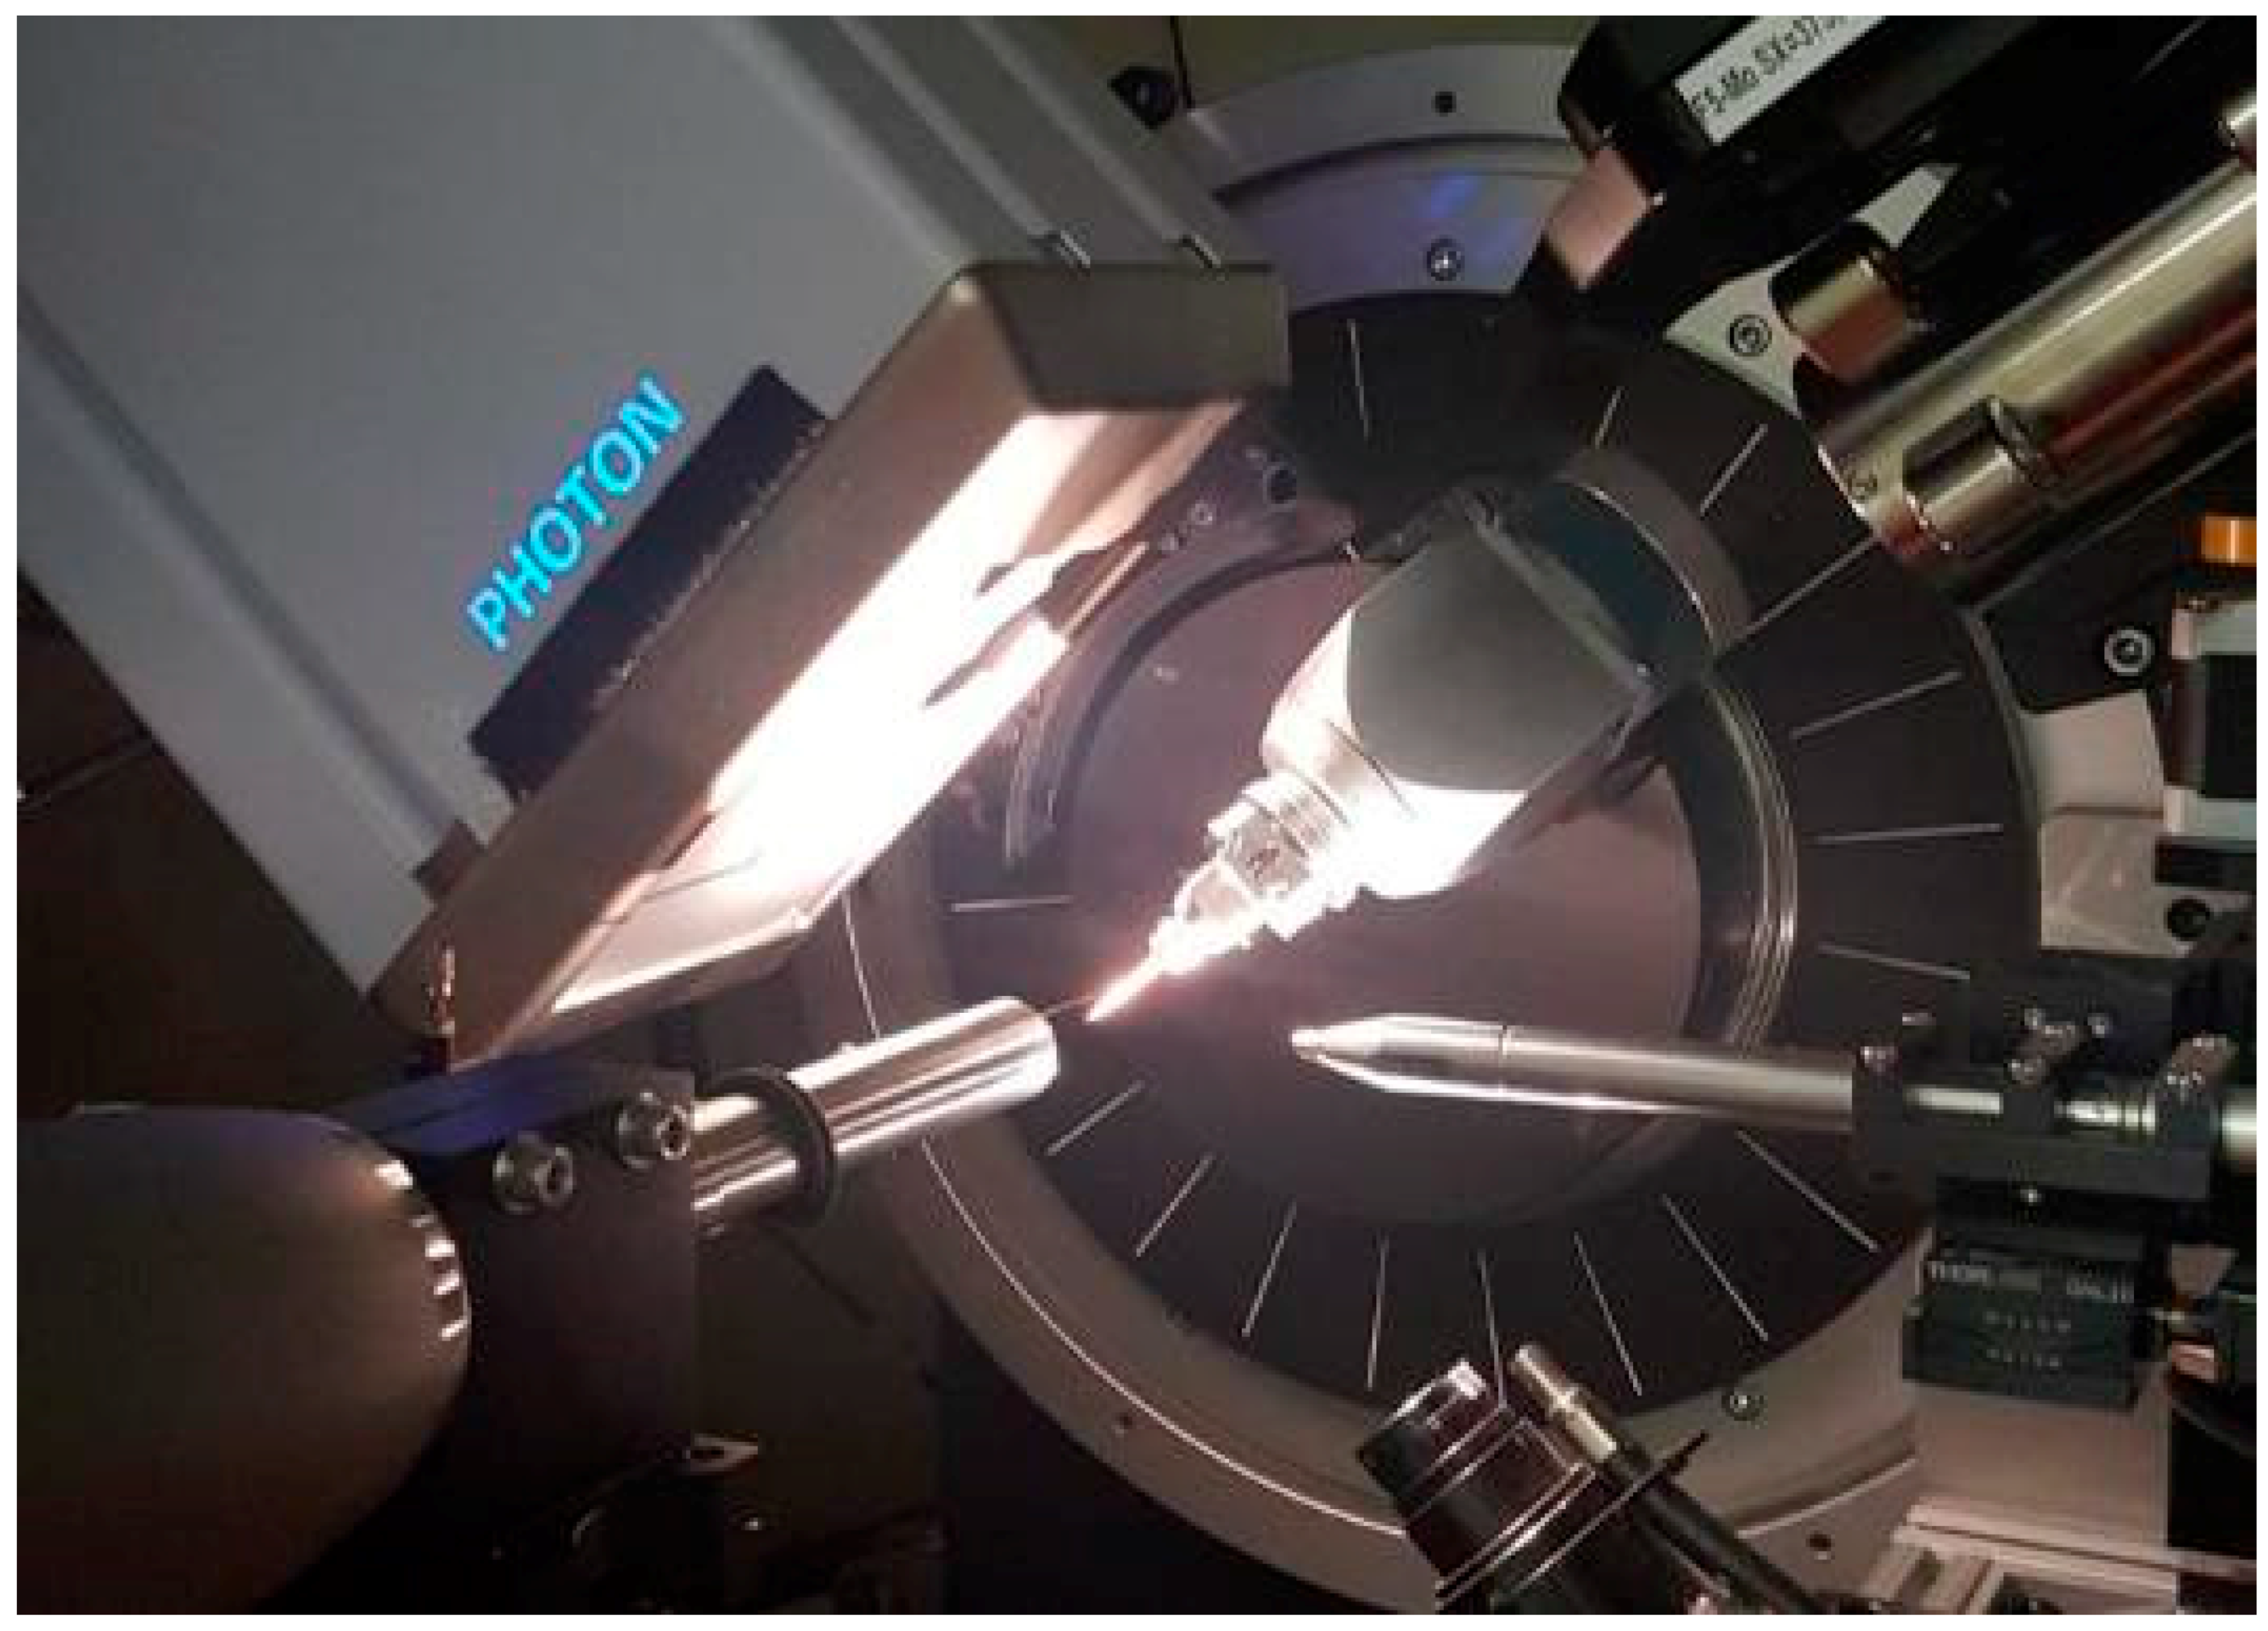
Figure 2.
The two experimental end stations available on beamline 12.2.2: Left is the single axis, microfocus end station equipped with a BX90 DAC; and right is the Stoe Stadi-Vari diffractometer that is currently being commissioned, carrying a Merrill–Bassett DAC.
Figure 2.
The two experimental end stations available on beamline 12.2.2: Left is the single axis, microfocus end station equipped with a BX90 DAC; and right is the Stoe Stadi-Vari diffractometer that is currently being commissioned, carrying a Merrill–Bassett DAC.
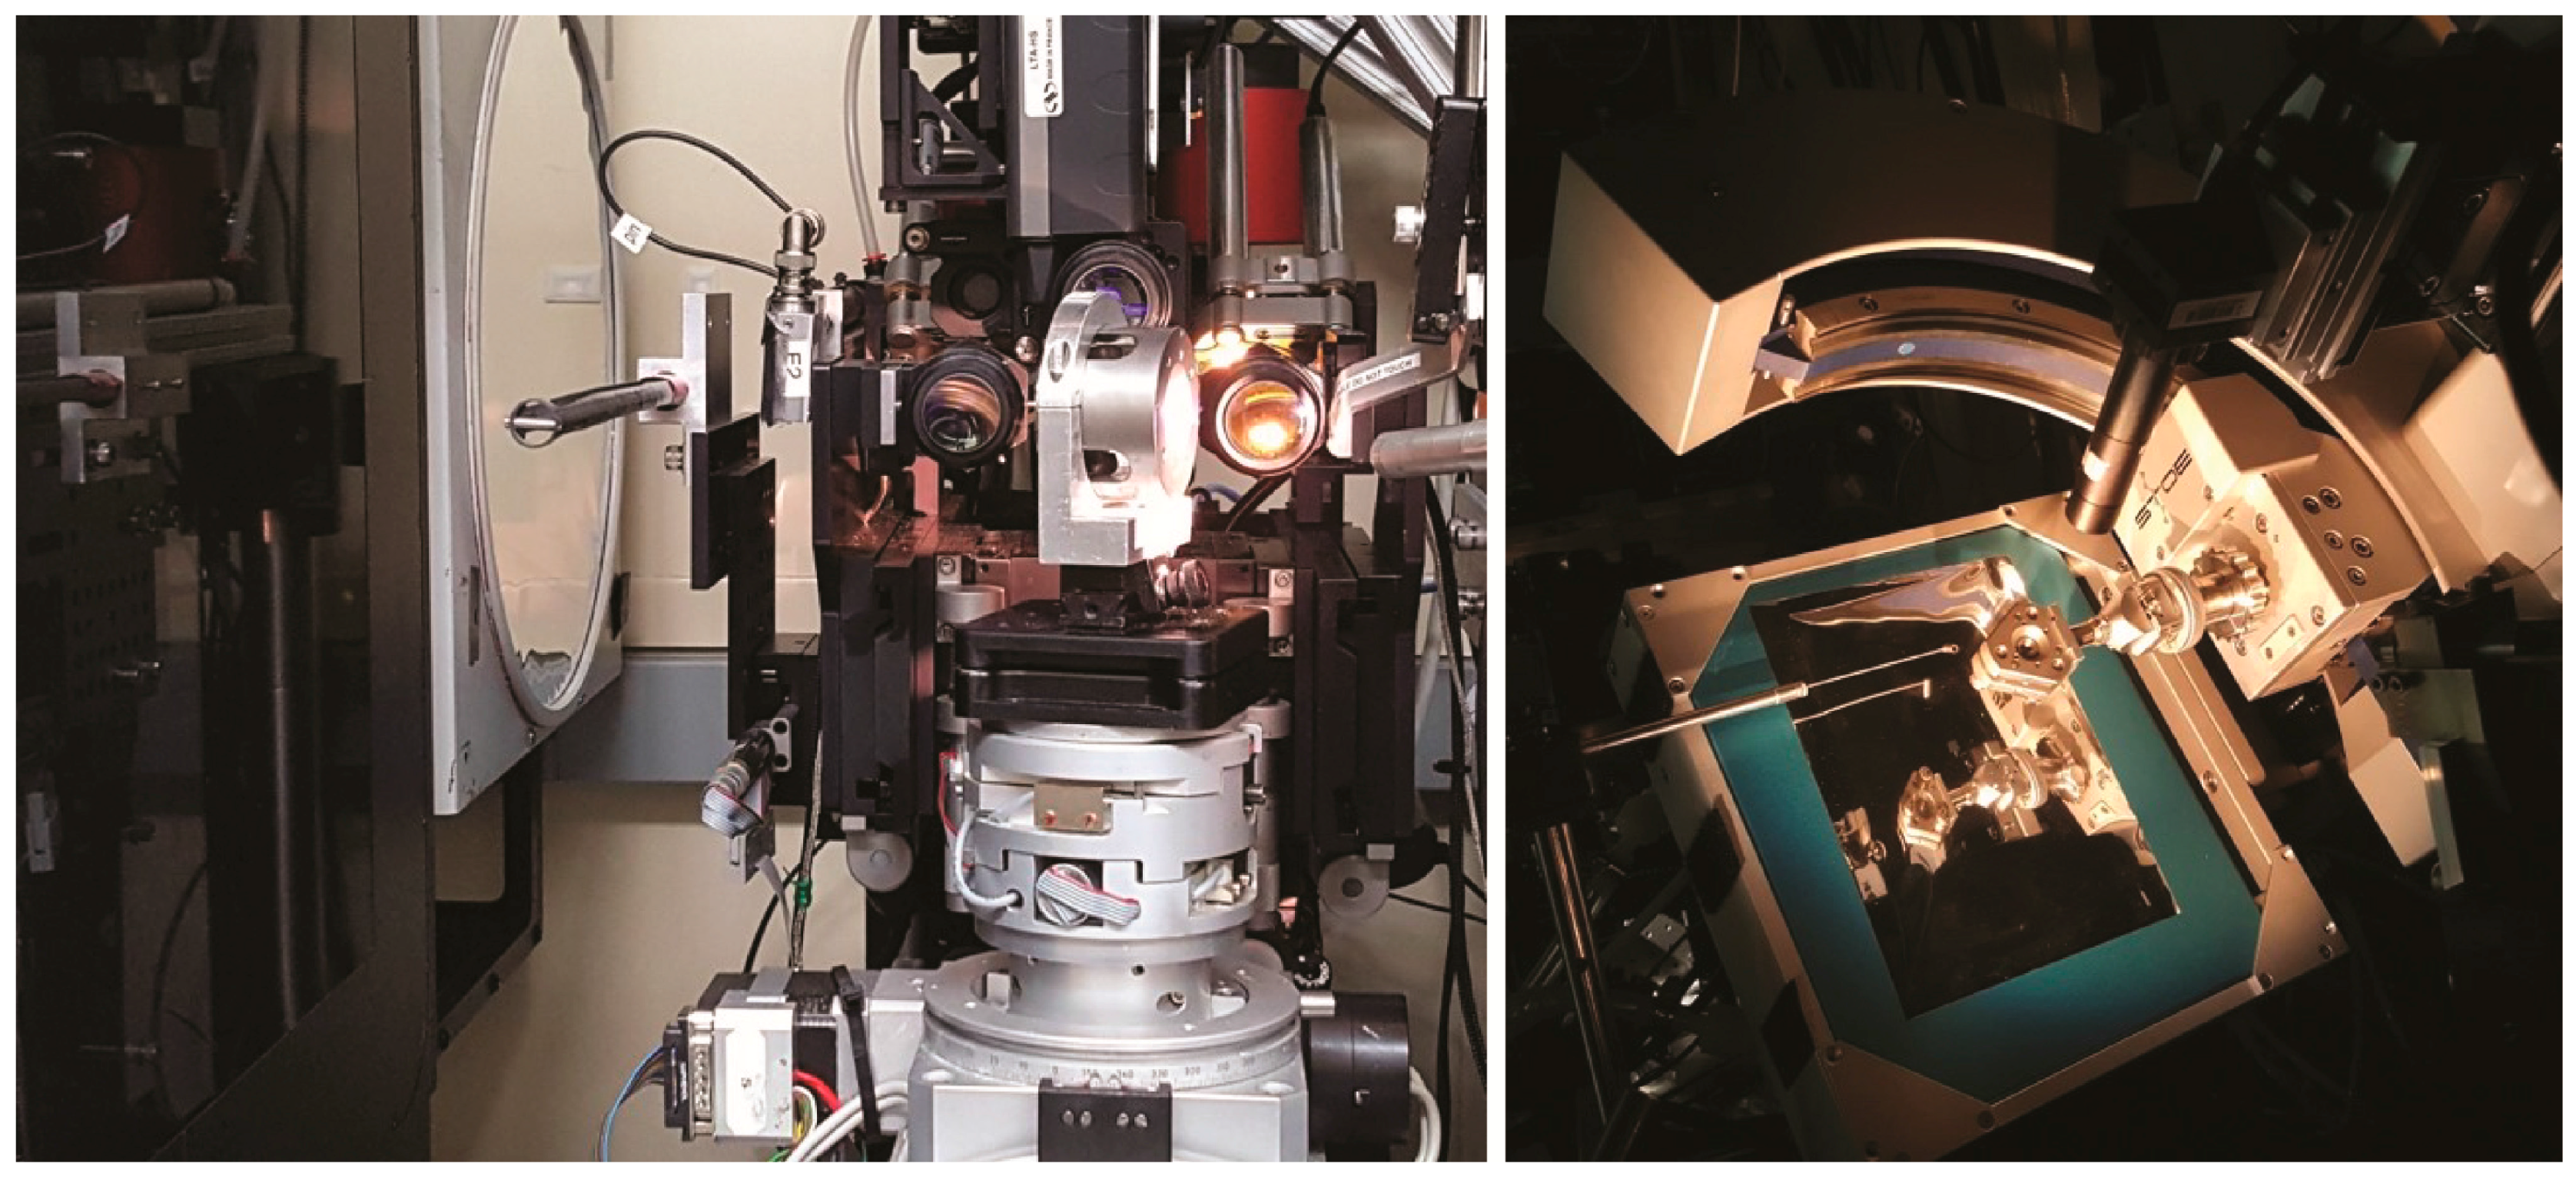
Figure 3.
(a) The ambient pressure structure of ZAG-4 and (b) the structure of ZAG-4 at 7.32 GPa. (c) The ambient pressure structure of ZAG-6 and (d) the structure of ZAG-6 at 6.69 GPa. Zinc atoms are green, carbon gray, phosphorous pink, oxygen red, and hydrogen white. Images were generated from data contained in [45] and [46].

Figure 4.
An image of the 11.3.1 LED array for photocrystallography. The aluminium ring (inset) is attached to the Cryostream nozzle.
Figure 4.
An image of the 11.3.1 LED array for photocrystallography. The aluminium ring (inset) is attached to the Cryostream nozzle.

Figure 5.
Depictions of the (a) nitro and (b) endo-nitrito binding modes within Ni(Ph2PCH2CH2PPh2)Cl(NO2). Generated from data contained in [19]. Hydrogen atoms have been omitted for clarity. Key: Pt: gray, C: black, N: light blue, O: red, Cl: green.
Figure 5.
Depictions of the (a) nitro and (b) endo-nitrito binding modes within Ni(Ph2PCH2CH2PPh2)Cl(NO2). Generated from data contained in [19]. Hydrogen atoms have been omitted for clarity. Key: Pt: gray, C: black, N: light blue, O: red, Cl: green.

Figure 6.
Crystallographic structural determinations of the metastable species of (a) Ni(aep)(NO2)2, (b) Ni(aepy)(NO2)2, (c) Pd(PPh3)2(NO2)2 and (d) Pd(AsPh3)2(NO2)2. Generated from data contained in [55] and [56]. In all cases, residual nitro ligands are shown using blue bonds and hollow atoms; exo-nitrito ligands (if any) are shown with green bonds and striped atoms, while endo-nitrito ligands are shown using red bonds and hatched atoms or gold bonds with solid atoms. Hydrogen atoms and additional disordered NO2− moieties in (d) were omitted for clarity Key: Pt/Ni: gray, C: black, N: light blue, O: red, P: dark gray, As: purple.

Figure 7.
ChemDraw representation of the full photoinduced ring closing reaction of the DTE moiety within [(PEt3)2PhPt(C≡C)(DTE)(C≡C)Pt(PEt3)2Ph] upon exposure to 400 nm light (left) with close-up views of the DTE moiety only before (top) and after (bottom) the ring closure. For clarity, hydrogen atoms and peripheral organometallic groups have been omitted. Generated from data contained in [54].

Figure 8.
A photo of the environmental gas cell, as mounted on the 11.3.1 diffractometer. The Cryostream nozzle is shown to the left of the gas cell, with the collimator in the foreground.
Figure 8.
A photo of the environmental gas cell, as mounted on the 11.3.1 diffractometer. The Cryostream nozzle is shown to the left of the gas cell, with the collimator in the foreground.
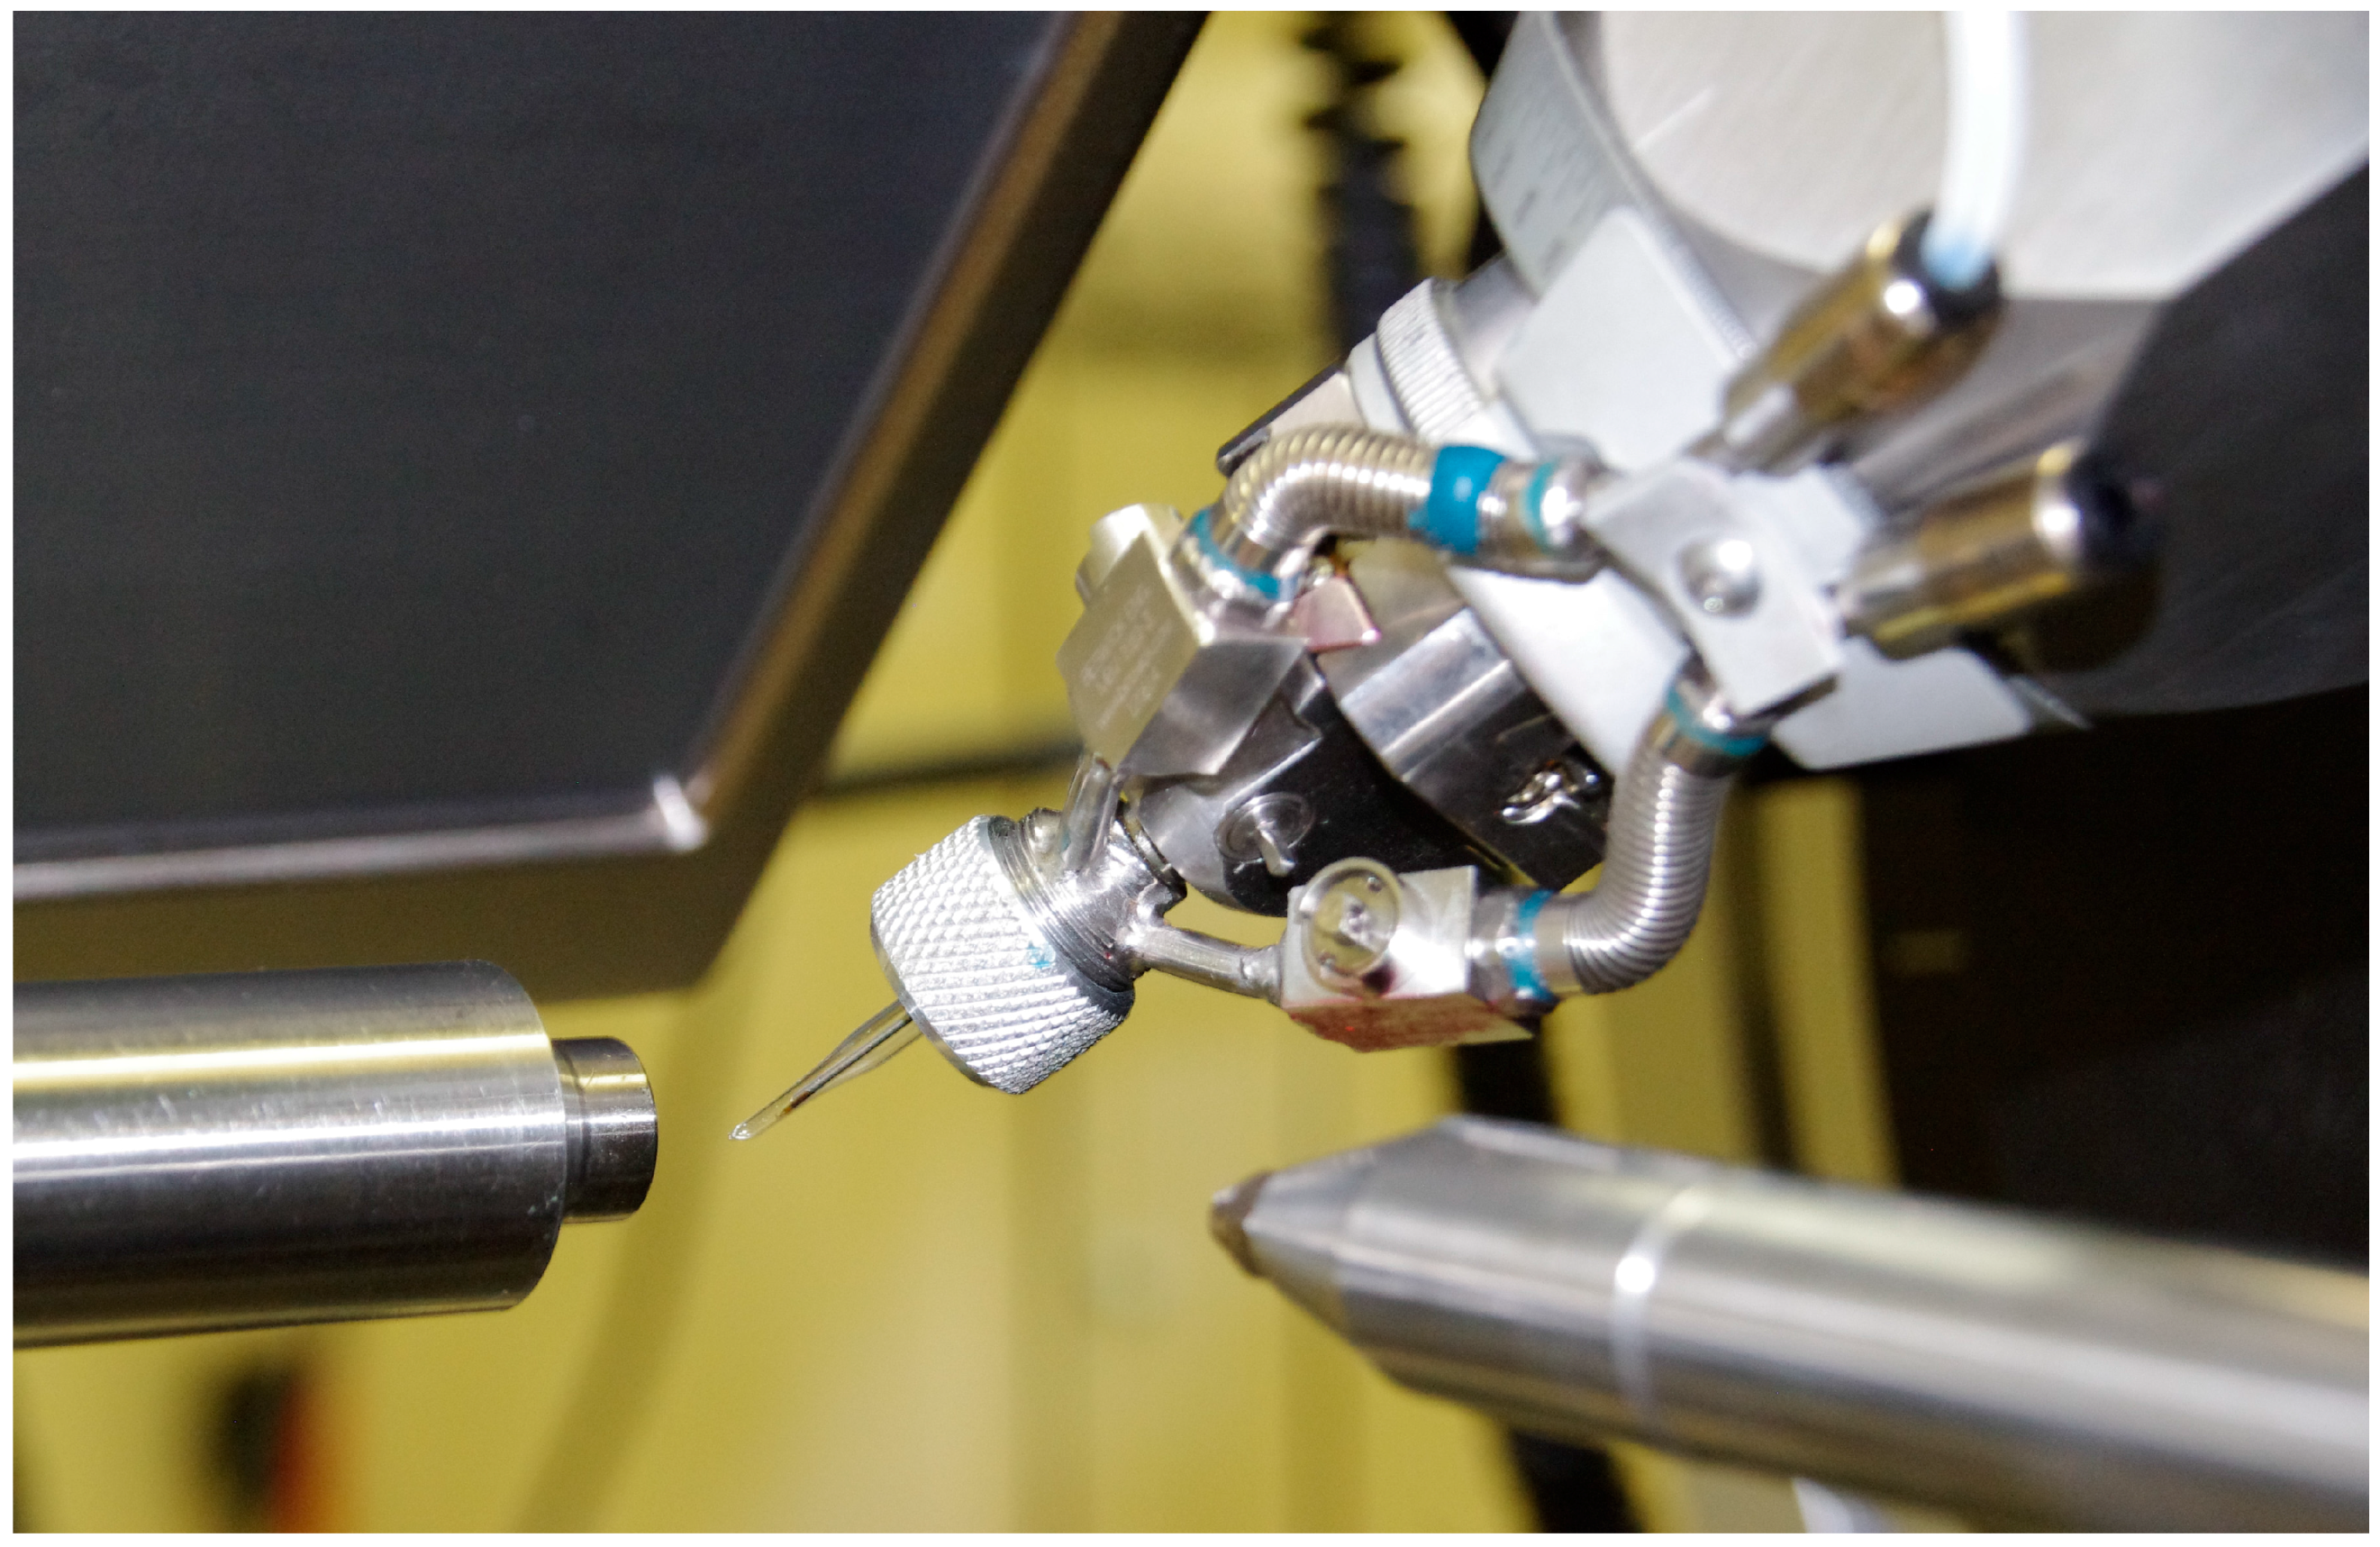
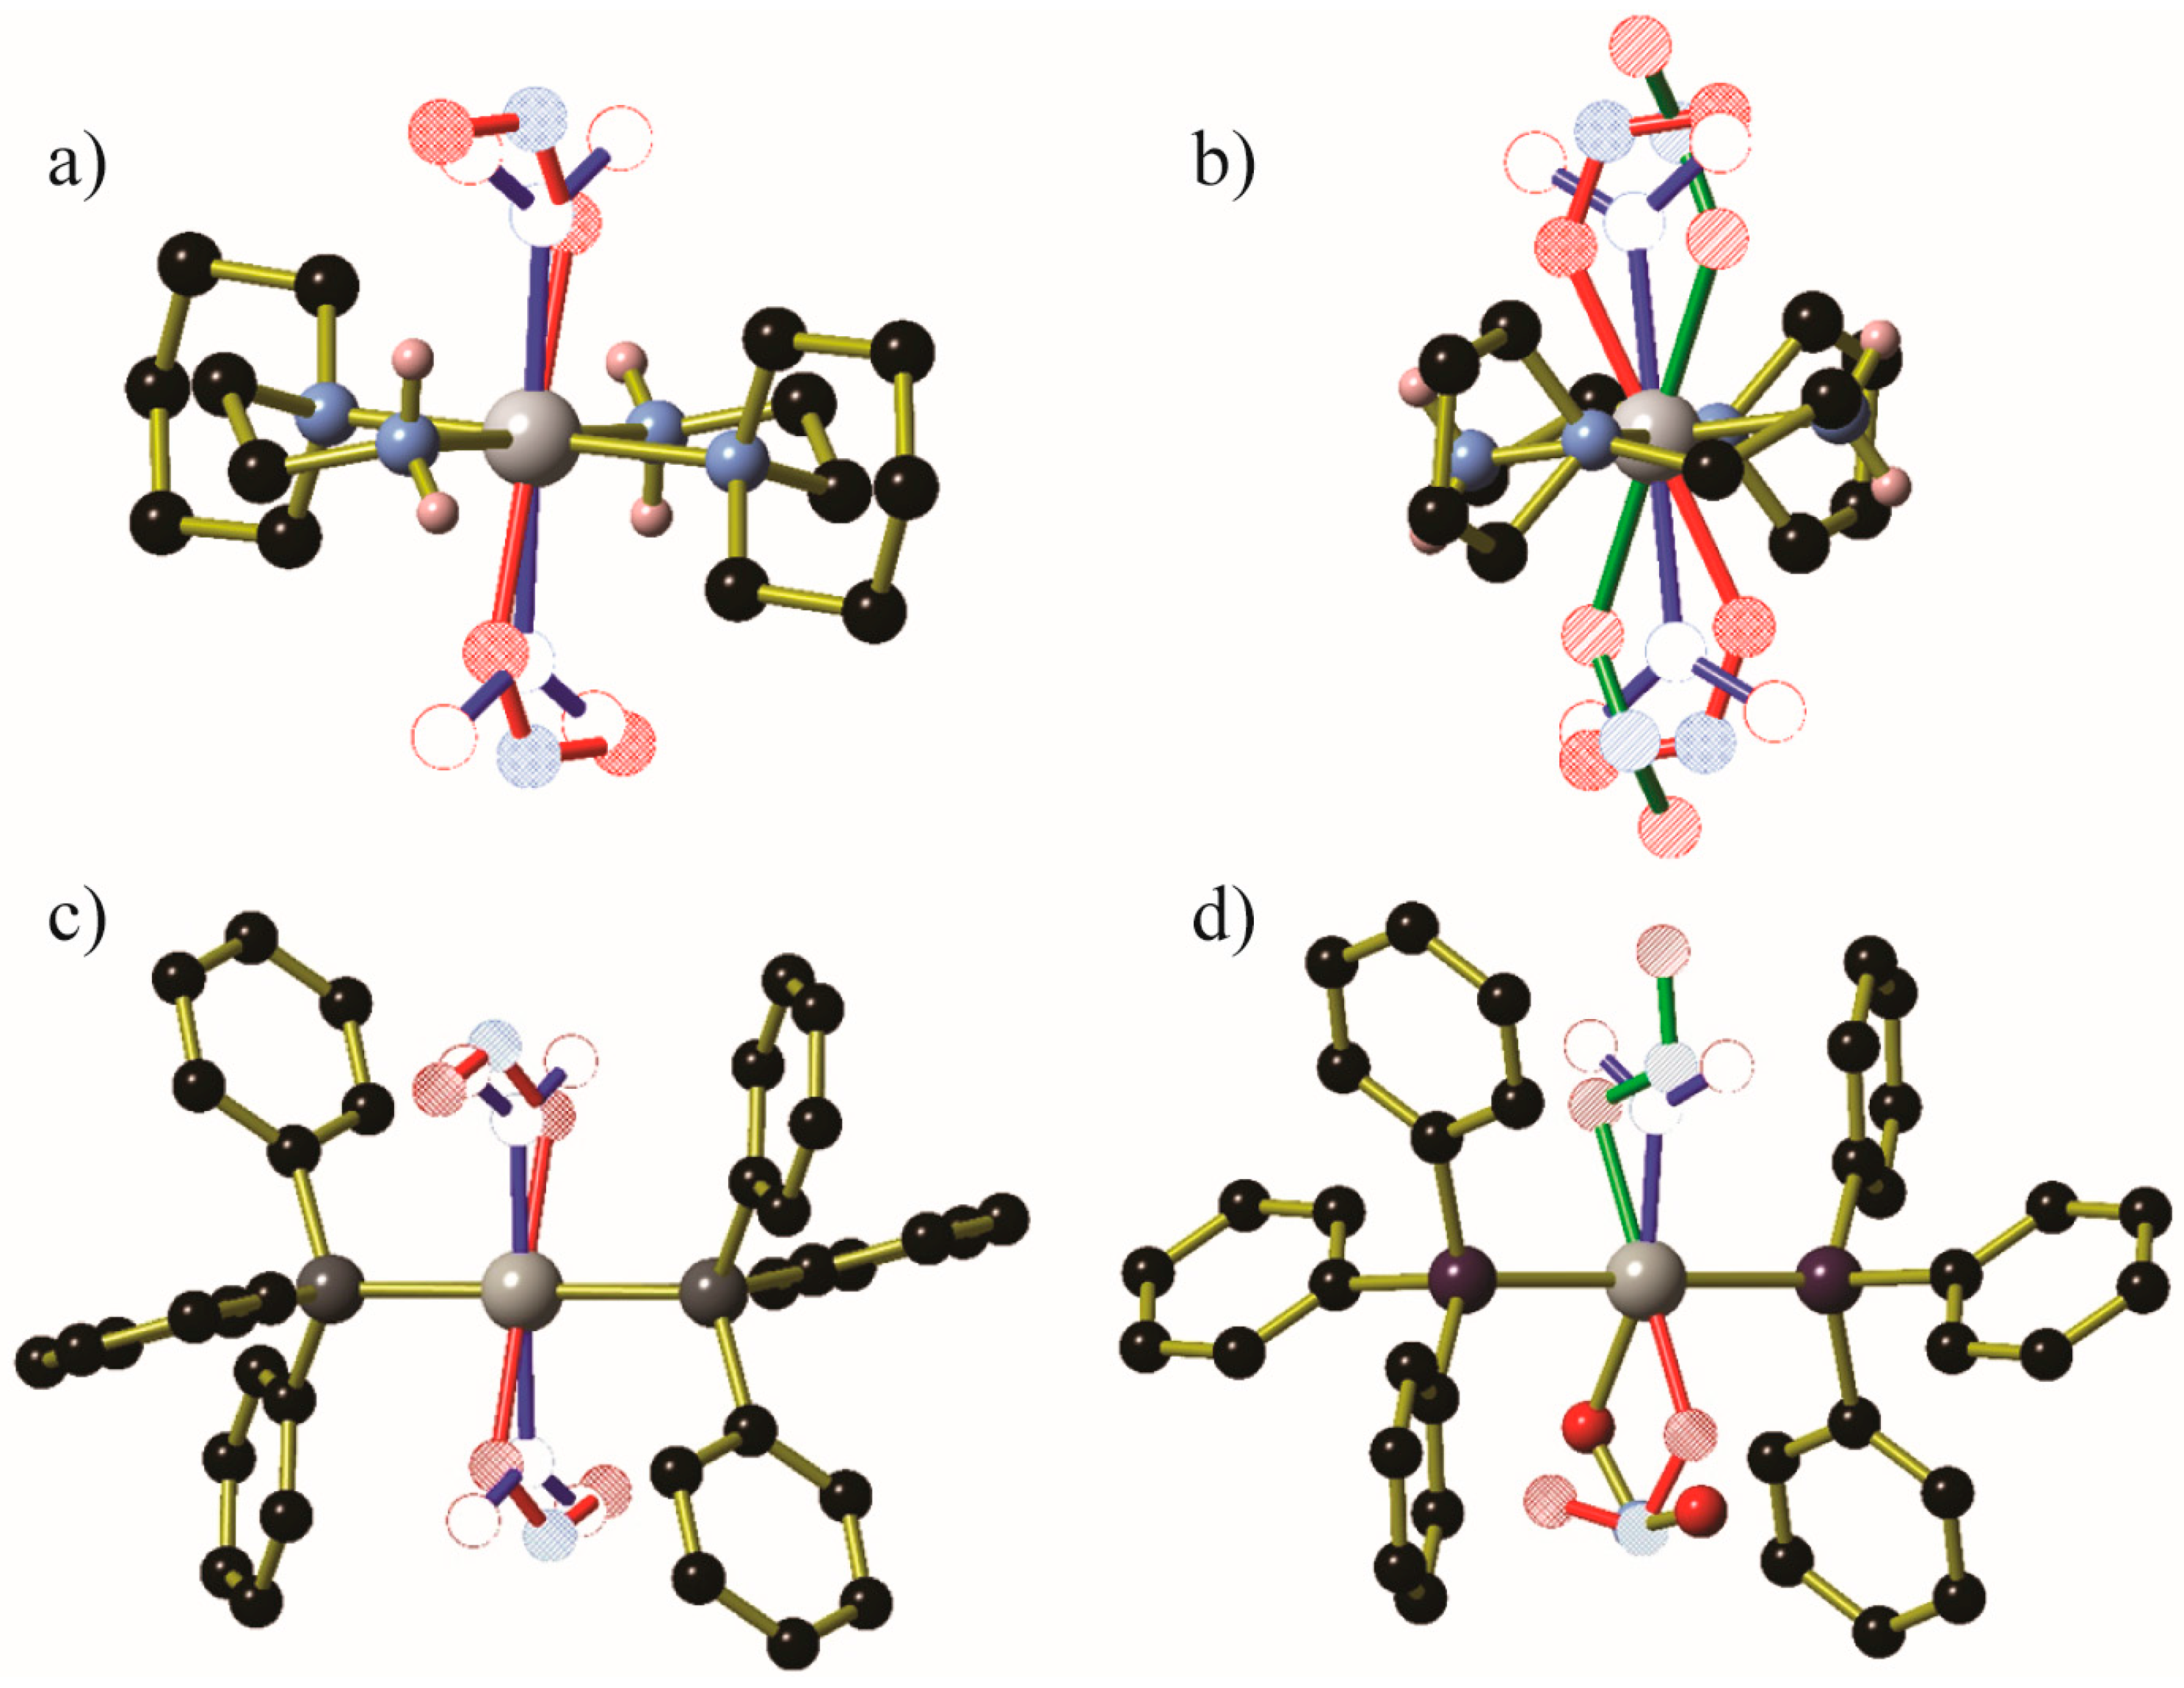
Figure 9.
The structure of UiO-66 shown in full (a,b) and the ZrIV6(O)4(OH)4(CO2)12clusters (right) within UiO-66. For simplicity, only one atom is shown for the μ3-OH−/O2−anions, which are depicted as hatched circles. Hydrogen-bonded OH− anions are shown in green in (b) and (c). Water molecules that are removed under a vacuum are shown as hollow circles in the corner of (c). Hydrogen atoms have been omitted for clarity. Generated using data from [65].
Figure 10.
(a) The hydrated form of Cu- sip -3 as viewed along the a-axis. Guest water molecules that occupy channels within the crystal are shown as green circles. (b) The dehydrated form of Cu- sip -3 as viewed along the c-axis. (c) The [Cu4(OH)2(CO2)4(O3S)4(H2O)2] cluster found in the hydrated form of Cu- sip -3. Hatched red circles and hollow red circles represent the μ3-hydroxide anions and coordinated water molecules, respectively. (d) The [Cu4(OH)2(CO2)4(O3S)4(H2O)2] cluster found in the dehydrated form of Cu- sip -3. Thin black lines depict long Cu···O separations (~2.84 Å). (e) The [Cu4(OH)2(CO2)4(O3S)4(H2O)2] cluster found in the re-hydrated crystal of Cu- sip -3. Generated using data from [66].

Figure 11.
(a) The full MFM-300 framework as viewed along the c-axis. (b) A segment of the VIII(OH)(CO2)2 chains within MFM-300 that extend parallel to the c-axis. (c) A segment of the VIV(O)(CO2)2 chains within MFM-300 that extend parallel to the c-axis. Aromatic hydrogen atoms have been omitted for clarity; dark gray spheres represent vanadium centres. Generated from data in [67].

Figure 12.
Segments of the gas-loaded single crystal structure of (a) Co2(dobdc)·2CH4, (b) Co2(dobdc)·3.8N2, (c) Co2(dobdc)·2Ar, (d) Co2(dobdc)·2.9CO2, (e) Co2(dobdc)·5.9O2, and (f) Co2(dobdc)·0.58CO. There is disorder of the unbound O atom in the coordinated O2 molecule of Co2(dobdc)·5.9O2; these partial occupancy atoms are shown as hatched red circle. Key: Co: pink, C: black, O: red, Ar: dark gray. Bonds are shown between the Co centre and Ar atoms for clarity of comparison, this separation is ~2.93 Å. Generated from data found in [68] and [62].

Figure 13.
(a) The anionic [(Co4Cl)3(BTTri)8]3− framework in Co-BTTri-O2. (b) Two views of the anionic [Co4Cl(triazole)8]− cluster in Co-BTTri-O2. The non-coordinated O atom of the O2 molecule is disordered over two sites, which are shown as red striped circles. Key: Co: pink, C: black, O: red, N: light blue, Cl: green. Generated from data in [69].

Figure 14.
A view of the diamine-appended Zn2(dobpdc) framework prior to CO2 loading. The image shown is of the N,N′-dimethyl ethylenediamine variant. For clarity, hydrogen atoms and the minor orientation of the diamine have been omitted. Reproduced from data in [70].
Figure 14.
A view of the diamine-appended Zn2(dobpdc) framework prior to CO2 loading. The image shown is of the N,N′-dimethyl ethylenediamine variant. For clarity, hydrogen atoms and the minor orientation of the diamine have been omitted. Reproduced from data in [70].
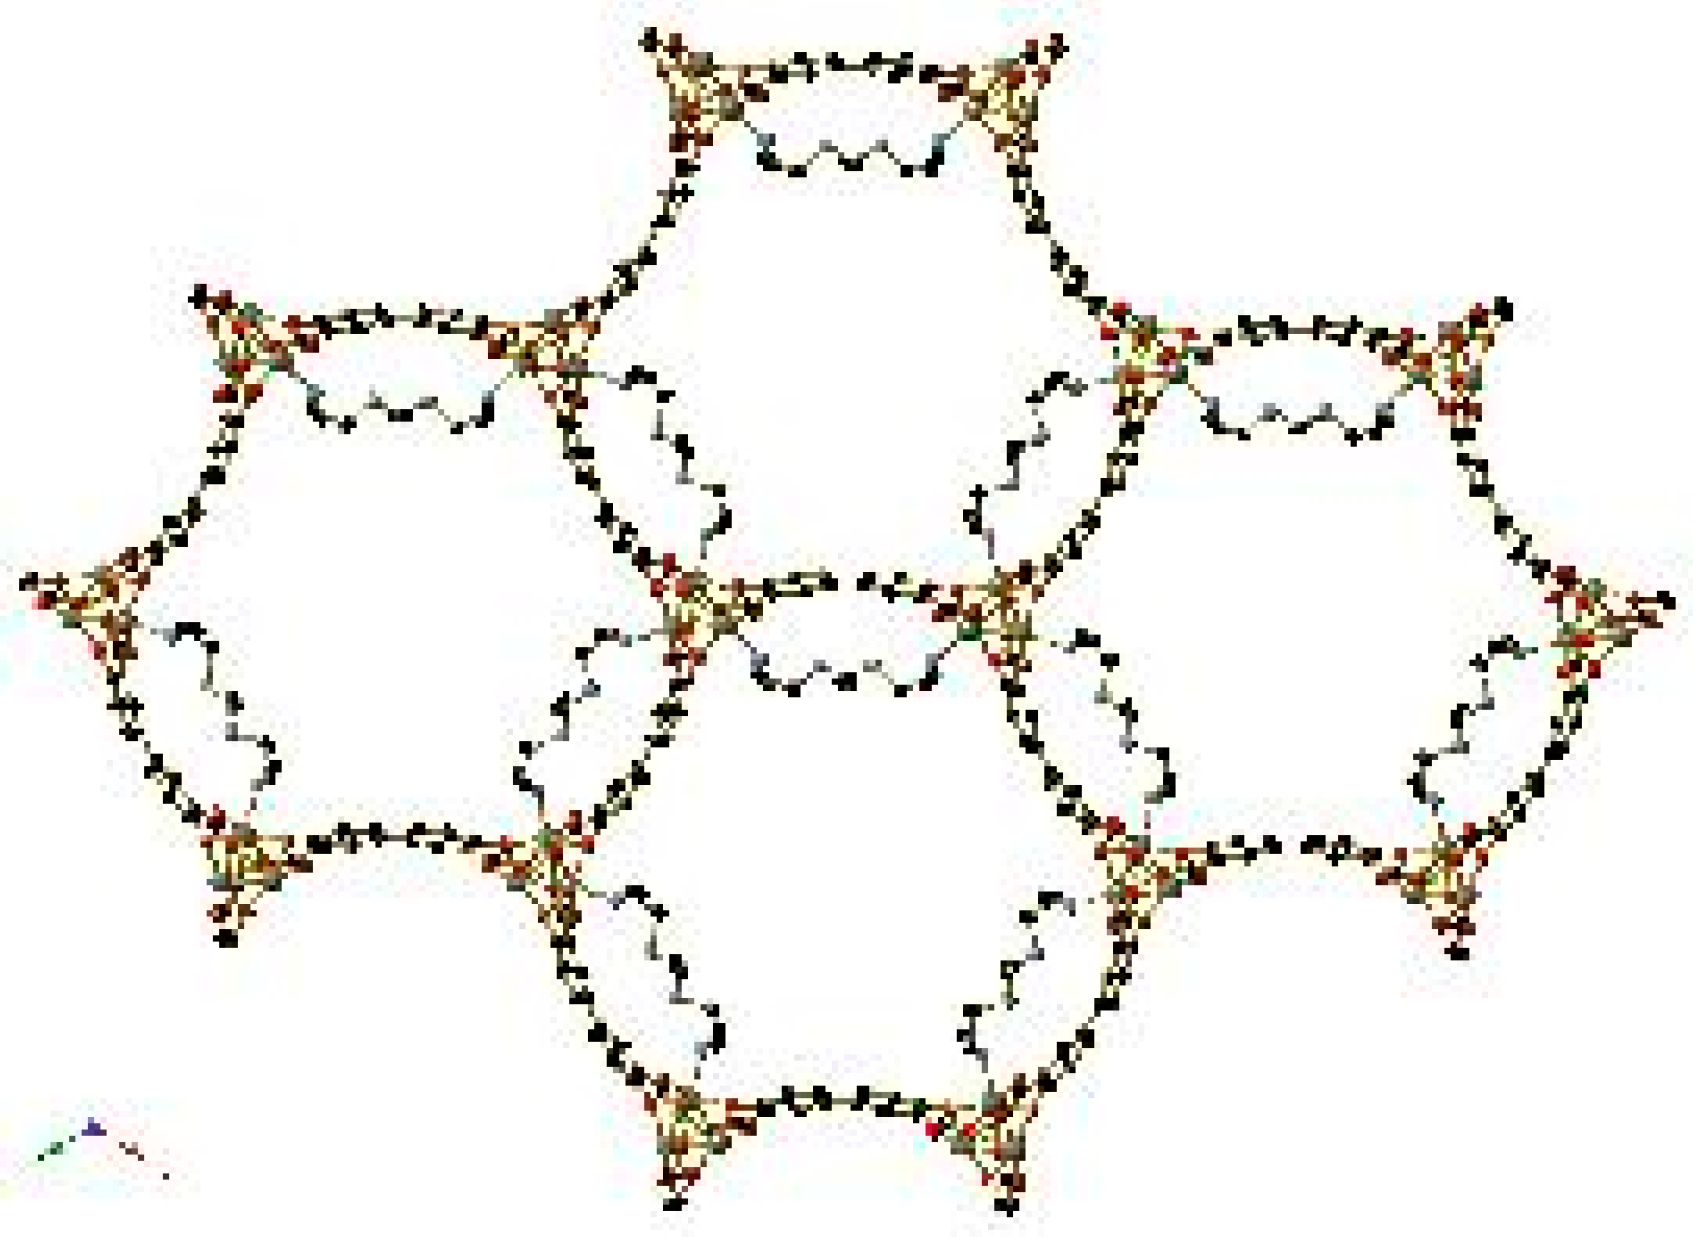
Figure 15.
The hydrogen bonding interactions between pendant groups upon CO2 insertion between the Zn2(dobpdc) framework (a) and (b) N-methyl ethylenediamine, (c) N-ethyl ethylenediamine, (d) N-isopropyl ethylenediamine, (e) N,N′-dimethyl ethylenediamine, and (f) N,N′-diethyl ethylenediamine. Non-amine hydrogen atoms have been omitted for clarity. In (c), a minor orientation of the N-ethyl ethylenediamine core is shown using red carbon atoms. Reproduced from data in [70].

Figure 16.
Illustrations of the different interactions between the coordinated diamine and the metal centres and the CO2 molecules for 1,1-dimethyl ethylenediamine and 2,2-dimethyl propylenediamine.
Figure 16.
Illustrations of the different interactions between the coordinated diamine and the metal centres and the CO2 molecules for 1,1-dimethyl ethylenediamine and 2,2-dimethyl propylenediamine.

Figure 17.
The hydrogen bonding interactions surrounding the (a) 1,1-dimethyl ethylenediamine-, and (b) 2,2-dimethyl propylenediamine-appended Zn2(dobpdc) framework. Non-amine hydrogen atoms have been omitted for clarity. Produced using data from [72].
Figure 17.
The hydrogen bonding interactions surrounding the (a) 1,1-dimethyl ethylenediamine-, and (b) 2,2-dimethyl propylenediamine-appended Zn2(dobpdc) framework. Non-amine hydrogen atoms have been omitted for clarity. Produced using data from [72].


Table 1.
Capabilities and characteristics of chemical crystallography beamlines at the Advanced Light Source.
Table 1.
Capabilities and characteristics of chemical crystallography beamlines at the Advanced Light Source.
| 11.3.1. | 12.2.1. * | 12.2.2. | ||
|---|---|---|---|---|
| End Station 1 * | End Station 2 | |||
| Wavelength Range (Å) | 2–0.7 | 2–0.5 | 2–0.3 | 2–0.3 |
| Energy Range (keV) | 6–17 | 6–24 | 6–40 | 6–40 |
| Peak Flux photons/s/0.01%BW | 1.7 × 10¹⁰ at 1.239 Å | 1.08 × 10¹² at 1.068 Å ** | 1.4 × 10¹¹ at 0.6199 Å | |
| Source | 1.27 T Bend | 4.37 T Superbend | 5.29 T Superbend | |
| Spot Size (μm²) | 280 × 90 | 30 × 80 | 30 × 80 | 10 × 10 |
| 30 × 30 | ||||
| Diffractometer | Bruker D8 | Stoe Stadi Vari | Huber | |
| Scannable axes | ϕ/ω | ϕ/ω | ϕ | |
| Detector | PHOTON II CPAD | RDI CMOS | Perkin Elmer a-Si | |
| RDI CMOS * | ||||
| Temperature control | Oxford Cryostream 800+ Cryocool-G2B-LT | Oxford Cryostream 700+ | ||
| 18–500 K | 85–500 K | |||
| DAC capabilities | Merrill-Bassett or smaller | ≤1 kg BX90 | ≤5 kg, e.g., BX90, Mao-Bell | |
* Under construction or commissioning; ** Calculated.
Table 2.
Summary and comparison of binding mode, loading, and hydrogen bonding information for the N-alkylated ethylenediamine-appended Zn2(dobpdc).
Table 2.
Summary and comparison of binding mode, loading, and hydrogen bonding information for the N-alkylated ethylenediamine-appended Zn2(dobpdc).
| Diamine Coordinated via 1°, 2° or 3° Amine | Diamine Molecules Adsorbed per Zn2(dobpdc) Formula Unit | Carbamate Oxygen Atom Involved in Intermolecular N-H···O-C Hydrogen Bonds | CO2 Molecules Adsorbed per Zn2(dobpdc) Formula Unit | |
|---|---|---|---|---|
 | 1° | Inconclusive | Bifurcated | 1.62 |
| 2° | Non-coordinated (intramolecular H-bonds to coordinated O) | |||
 | 1° | 1.68 | Coordinated (major) Non-coordinated (minor) | 1.5 |
 | 1° | 1.94 | Coordinated | 1 |
 | 2° | 1.5 | Non-coordinated | 1.5 |
 | 2° | 1 | Non-coordinated | 1 |
 | 1° | 1.83 | * | * |
 | 1° | 1.65 | * | * |
* Single crystal analysis of the CO2-loaded materials unavailable at time of publication.
© 2017 by the authors. Licensee MDPI, Basel, Switzerland. This article is an open access article distributed under the terms and conditions of the Creative Commons Attribution (CC BY) license (http://creativecommons.org/licenses/by/4.0/).
Share and Cite
MDPI and ACS Style
McCormick, L.J.; Giordano, N.; Teat, S.J.; Beavers, C.M. Chemical Crystallography at the Advanced Light Source. Crystals 2017, 7, 382. https://doi.org/10.3390/cryst7120382
AMA Style
McCormick LJ, Giordano N, Teat SJ, Beavers CM. Chemical Crystallography at the Advanced Light Source. Crystals. 2017; 7(12):382. https://doi.org/10.3390/cryst7120382
Chicago/Turabian StyleMcCormick, Laura J., Nico Giordano, Simon J. Teat, and Christine M. Beavers. 2017. "Chemical Crystallography at the Advanced Light Source" Crystals 7, no. 12: 382. https://doi.org/10.3390/cryst7120382
Note that from the first issue of 2016, this journal uses article numbers instead of page numbers. See further details here.