Article

Synthesis and Characterization of New Sr3(BO3)2 Crystal for Stimulated Raman Scattering Applications

Institute of Crystal Materials & Key Laboratory of Functional Crystal Materials and Devices, Shandong University, Jinan 250100, China
*
Authors to whom correspondence should be addressed.
Crystals 2017, 7(5), 125; https://doi.org/10.3390/cryst7050125
Submission received: 10 March 2017 / Revised: 24 April 2017 / Accepted: 24 April 2017 / Published: 28 April 2017
(This article belongs to the Section Crystalline Materials)

Abstract

:
A new kind of borate crystalline material Sr3(BO3)2 with a similar calcite type structure was designed and synthesized by solid state reaction method, moreover, the single crystal growth was attempted with traditional Czochralski pulling method. Crystal phase of Sr3(BO3)2 was investigated by using X-Ray powder diffraction (XRPD) at room temperature and found similar to Ca3(BO3)2 crystal with space group of R-3c. The phase stability was studied by means of thermogravimetric differential thermal analysis (TG/DTA) and high temperature XRPD up to 1350 °C, where an obvious endothermic peak was observed in DTA curve around 1250 °C, and weak splits of diffraction peaks were found at temperatures above 1250 °C, indicating the existence of structure transformation for Sr3(BO3)2 crystal. Raman properties were studied experimentally and theoretically by using density functional perturbation theory, though the strongest frequency shift of Sr3(BO3)2 crystal (900 cm−1) was comparable to that of Ca3(BO3)2 (927 cm−1), the line width of the strongest Raman peak obtained for Sr3(BO3)2 (5.72 cm−1) was much lower than Ca3(BO3)2 (7.01 cm−1), indicating a larger Raman gain for Sr3(BO3)2 crystal, which would be favorable for stimulated Raman scattering application.

1. Introduction

As one of the earliest nonlinear optical processes, in recent years, stimulated Raman scattering (SRS) has become an important and efficient method for frequency conversion to fulfill various applications including optical molecular imaging, structure analysis, biology monitoring, and medical treatment [1,2,3,4,5,6,7]. Different from the optical frequency doubling, SRS is a third-order nonlinear optical process with many advantages such as larger angular acceptance, and no walk-off angle and phase-matching (PM) direction [8]. In the early years, SRS experiments were mostly based on liquids and gases including CH4, N2, and benzene etc. [9]. However, some flaws such as poisonousness and instability restrict their application in SRS. Besides the liquids and gases SRS mediums, solid materials, especially crystals, were applied in SRS. Since the 1980s, several new artificial crystals—Such as Ba(NO3)2, BaWO4 and YVO4 crystals—Have been studied for SRS applications [10,11,12,13,14,15]. These crystals were revealed to possess many merits for SRS process, including larger Raman gain coefficient, stable thermal and mechanical properties, good chemical stability, non-deliquescence, and small volume etc. However, the relatively low anti-optical damage threshold and the long cut-off wavelength restricted their applications for SRS in the ultraviolet waveband [16,17].
SRS is an inelastic scattering process with inevitable energy loss. Therefore, both the Raman gain coefficient and the anti-optical damage threshold are critical parameters for selecting Raman crystals [18]. Among the artificial crystal materials, borate crystals are famous for laser application in deep ultraviolet due to the high anti-optical damage threshold and high transmittance in a wide transmission spectrum. In the borate series crystals, the calcite phase Ca3(BO3)2 crystal with point group-3m (space group R-3c) was reported to be promising for SRS application from deep ultraviolet to near infrared [18]. However, the SRS performance could see further improvement. In general, a cation with larger ionic radius would be beneficial in inducing a larger Raman gain in crystals with a certain structure. Taking the reported AWO4 (A = Ca, Sr and Ba) type crystals for instance, the BaWO4 crystal was found to possess better Raman properties than SrWO4 and CaWO4 crystals, such as more narrow line width (2.2, 2.7, and 4.8 cm−1 for BaWO4, SrWO4, and CaWO4 crystals, respectively), larger Raman gain (8.5, 5.0, and 3.0 cm/GW @1064 nm for BaWO4, SrWO4, and CaWO4 crystals, respectively), and larger Raman shift (926, 922, and 908 cm−1 for BaWO4, SrWO4, and CaWO4 crystals, respectively) [19,20,21]. Hence, it is interesting and necessary to discuss and compare the Raman properties of Ca3(BO3)2 type crystals, including Ca3(BO3)2, Mg3(BO3)2, and Sr3(BO3)2. However, only Ca3(BO3)2 has been studied up to date [18].
According to the Goldschmidt’s Rules [22], it might be possible to substitute an ion in polyhedron with another ion with the same valence and low discrepancy of ionic radius (<15%). As far as Ca3(BO3)2 type crystals are concerned, though the magnesium (Mg), strontium (Sr), and Barim (Ba) belong to the IIA elements, only the Sr (rSr(+2) = 1.12 Å [23]) possess comparable ionic radius to that of Ca2+ (rCa(+2) = 1.00 Å [23]), while the Mg2+ and Ba2+ show a large ionic radius discrepancy over 15%. Additionally, it had been known that the crystal symmetry of Mg3(BO3)2 grown by Czochralski (Cz) method was orthorhombic (space group Pnmn and point group mmm) [24], different to the trigonal Ca3(BO3)2 crystal. In contrast, the Sr3(BO3)2 was reported to be trigonal and share the same crystal symmetry with Ca3(BO3)2 [25]. In order to evaluate the SRS properties of Sr3(BO3)2, the single crystal growth was attempted and related properties were characterized in this work.

2. Structure Analysis and New Crystal Design

The Sr3(BO3)2 was first reported by Richter and Müller in 1980, and revealed to belong to trigonal system and R-3c space group (ICSD No. 93395) [25], and the lattice parameters were reported to be a = b = 9.046 Å and c = 12.566 Å [26]. Figure 1 presents the crystal structure of Sr3(BO3)2, where the [BO3]3− group were observed to form a regular triangle in the same plane normal to the crystallographic c-axis, and the three terminal oxygen atoms were linked with Sr atoms, which were similar to Ca3(BO3)2 crystal (Figure 1a,b). It can be observed from Figure 1c,d that the [BO3]3− groups were parallel to each other. The twisty Sr-O octahedron and the triangular [BO3]3− group were shown in Figure 1e,f, respectively. It was noticed that the Mg3(BO3)2 crystal belongs to the Pnmn space group (point group mmm), and the lattice parameters were reported to be a = 5.4014 Å, b = 8.4233 Å, c = 4.5071 Å, α = β = γ = 90°, and V = 205.1 Å3 [27]. It can be presumed that the variation of ionic radius resulted in the change of lattice parameters, leading to the structure transformation from trigonal to orthorhombic when the ion varied from Sr2+ to Mg2+.
The potential Raman properties of Mg3(BO3)2, Ca3(BO3)2, and Sr3(BO3)2 crystals were theoretically studied within the framework of density functional perturbation theory by using the Cambridge Sequential Total Energy Package (CASTEP) code [28]. The exchange and correlation potential were described in a generalized gradient approximation of Perdew-Burke-Erenzerhof functionality (GGA-PBE) [29], and the interaction between the valence electrons and the core electrons was described by norm-conserving pseudopotentials [30]. The cutoff energy and Monkhorst-Pack k-point were set to 380 eV and 4 × 4 × 4. The primitive cells containing 22 atoms were used to reduce the computational cost. All the configurations were fully optimized before the Raman spectrum calculation with the error of a and c lattices within 2%. As it can be observed in Figure 2, the strongest Raman shifts for Mg3(BO3)2, Ca3(BO3)2, and Sr3(BO3)2 crystals appeared at 895, 909, and 886 cm−1, respectively, associated with the symmetrical stretching vibration of [BO3]3− group. It was noticed that the Ca3(BO3)2 and Sr3(BO3)2 crystals showed more plentiful peaks than Mg3(BO3)2, which might be associated with their different crystal structures, as both the Ca3(BO3)2 and Sr3(BO3)2 crystals belong to the same space group R-3c, while Mg3(BO3)2 belongs to space group Pnmn. The plentiful peaks of Ca3(BO3)2 and Sr3(BO3)2 crystals would be beneficial for achieving applicable wavelengths in the field of SRS.

3. Experimental

The polycrystalline Sr3(BO3)2 was prepared by using solid state reaction method, where the starting materials were SrCO3 (99.95%) and H3BO3 (99.99%) powders, which were weighed in stoichiometric ratio, according to the chemical reaction equation below,
3SrCO3 + 2H3BO3 = Sr3(BO3)2 + 3CO2↑ + 3H2O
In order to compensate the evaporation of B2O3 during the solid-state reaction and crystal growth processes, an excess of H3BO3 (1.0 wt %) was added to the starting materials. All the starting materials were fully mixed for at least 24 h to ensure homogeneity. Then mixed raw materials were sintered at 1000 °C for 10 h to decompose H3BO3 and SrCO3 completely. After that the sintered raw materials were ground, mixed again and pressed into pieces, which were charged into an alumina crucible and sintered at 1250 °C for at least 40 h to synthesize the polycrystalline Sr3(BO3)2.
A J40 single crystal growth furnace was used to grow Sr3(BO3)2 single crystal. The prepared polycrystalline Sr3(BO3)2 blocks were put into an Ir crucible (ø60mm) in the furnace, where the atmosphere was controlled to be a mixture of 2 vol % air and 98 vol % N2. It is important to find out the melting point of Sr3(BO3)2 in the first run, so the heating rate was kept slow enough when the floating compounds on the melt got shrinking. The melt was maintained at 50 °C higher than the observed melting point for several hours to make the melt homogeneous. Then the temperature was slowly decreased for seeding. Ca3(BO3)2 crystal seed along the c-axis was used to grow Sr3(BO3)2 single crystal. It was found that the melting point of Sr3(BO3)2 crystal was higher than Ca3(BO3)2 (1470 °C [31]), so the seeding process was carried out within a short period in order to get rid of seed fusing. During the crystal growth, the pulling rate was controlled at 0.4 mm/h and the rotation rate was varied from 15 to 20 rmp. For the purpose of decreasing the thermal stress in as-grown crystal, a long period (~100 h) was implemented to cool down the Sr3(BO3)2 crystal to room temperature.
The thermogravimetric and differential thermal analysis (TG-DTA) for Sr3(BO3)2 was carried out with a Diamond TMA thermal mechanical analyzer, provided by Perkin Elmer Corporation. The heating rate was 10 °C/min and the flow rate of N2 was 50 mL/min.
In order to study the crystal structure and possible phase transition of Sr3(BO3)2, the synthesized polycrystalline Sr3(BO3)2 and the grown Sr3(BO3)2 crystal blocks were selected for X-ray Powder Diffraction (XRPD) characterization (Bruker D8 Advance X-Ray Diffractometer equipped with Cu-Kα radiation and a semiconductor array detector (Bruker LynxEye)). High temperature structure analysis for Sr3(BO3)2 crystal was carried out by using an in situ XRPD equipped with a high temperature in situ attachment (Anton Paar HTK-2000N). The tested temperature was operated from 1150 °C to 1350 °C, and the diffraction spectra were recorded with step of 50 °C. The heating rate was controlled to be 10 °C/min and the retention time at each desired temperature was 5 min.
The powder Raman spectra of the grown Sr3(BO3)2 crystal obtained by Cz method was measured from 20 to 7500 cm−1 by an FT-IR & Raman Spectrograph (NEXUS 670) with a high resolution of 0.09 cm−1. The used exciting source was a 1064 nm laser pumped by a Nd:YVO4 crystal.

4. Results and Discussion

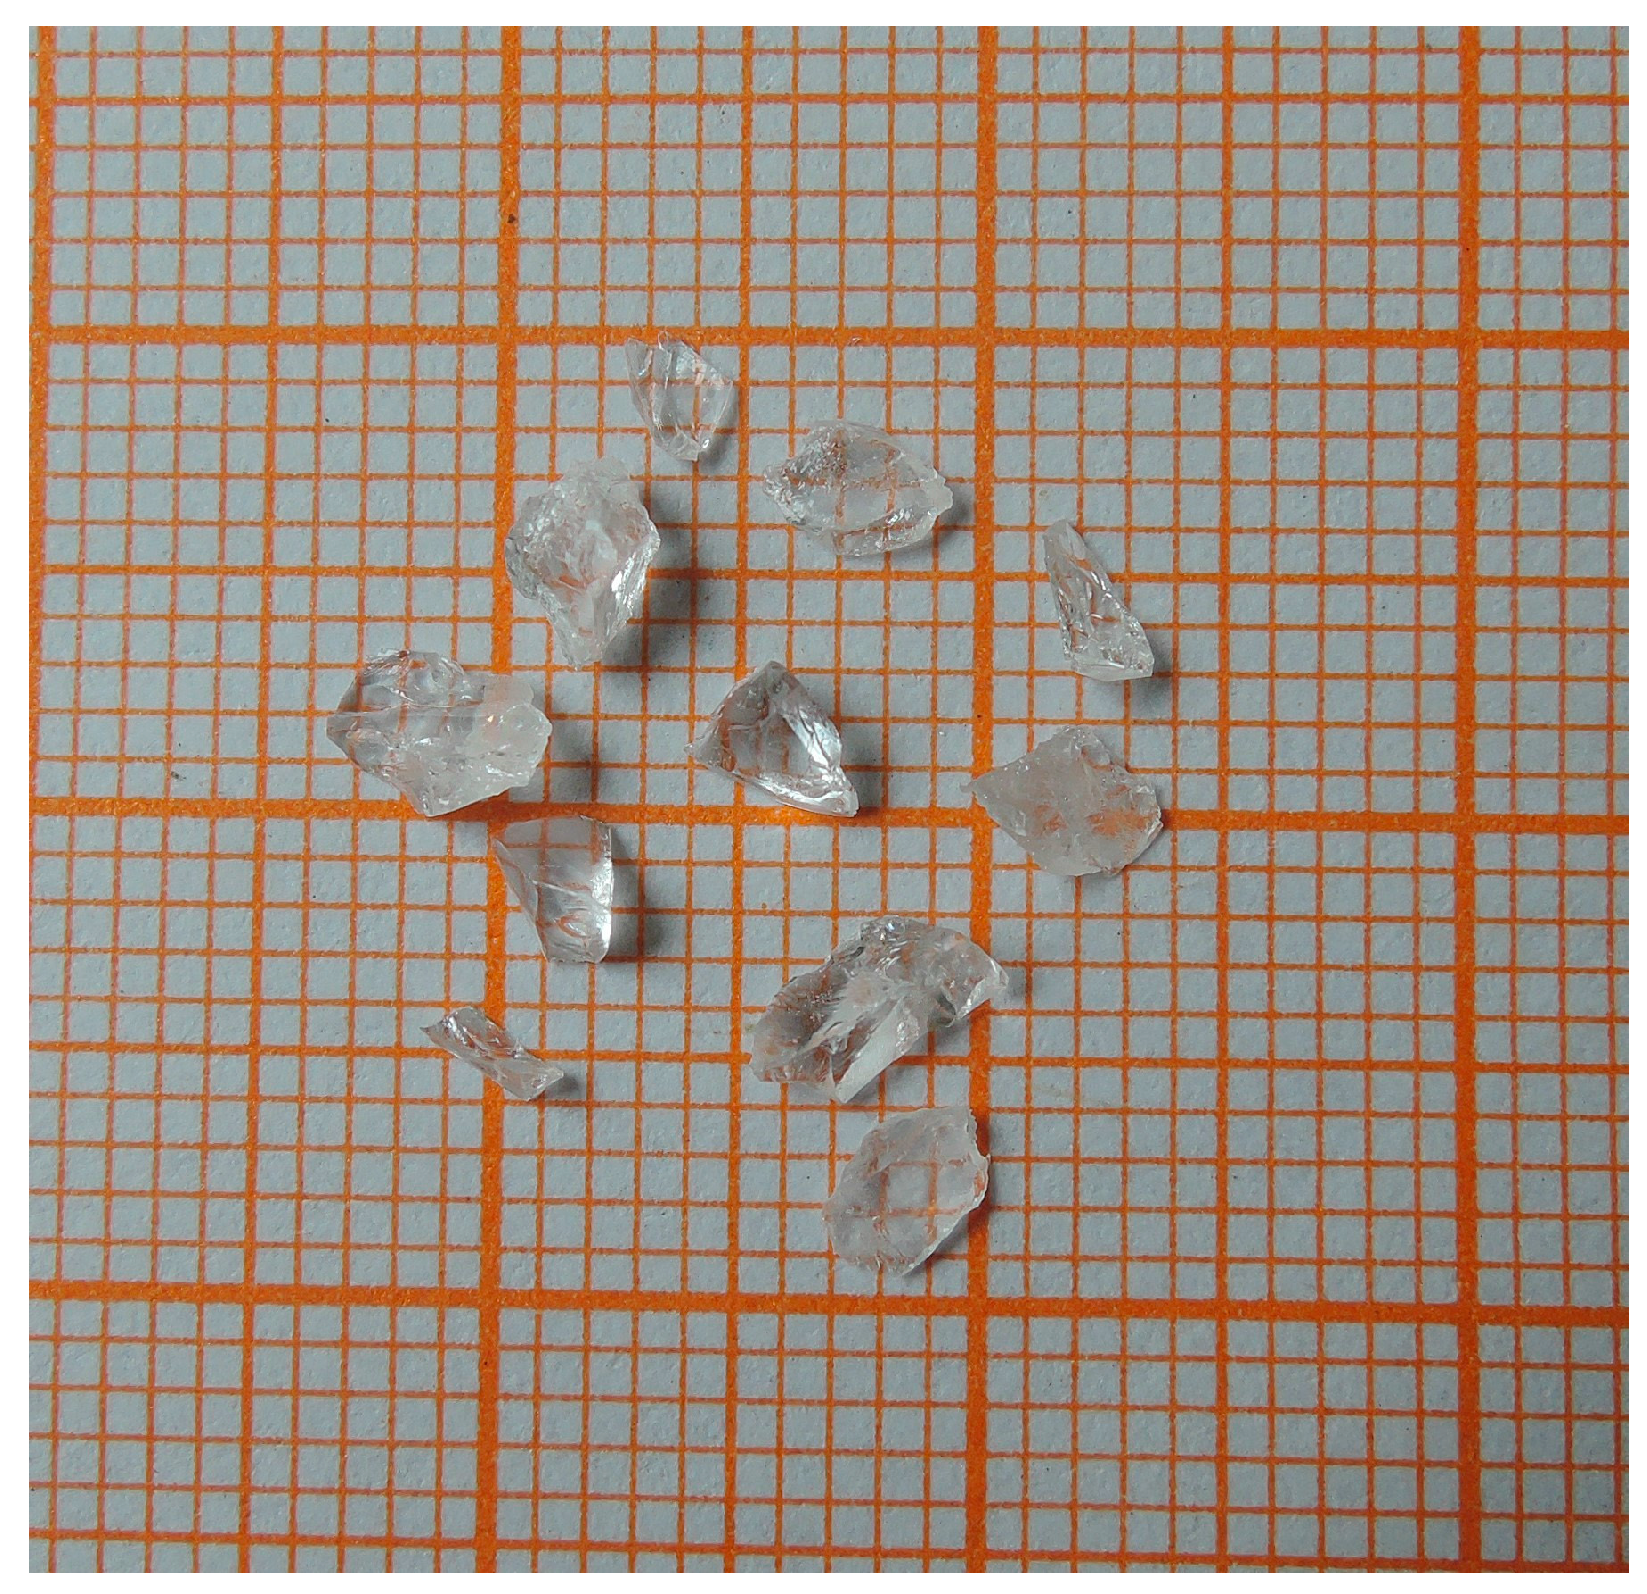
4.1. Single Crystal Growth

The Sr3(BO3)2 crystal was grown by using Cz-pulling method. It was observed that the Sr3(BO3)2 crystal was transparent in the furnace after pulling out of the melt, however, crystal cracks slowly emerged during the following cooling process. As crystal cracks spread, the Sr3(BO3)2 crystal was finally broken into pieces, as shown in Figure 3. This phenomenon always occurred no matter how the component or temperature gradient was adjusted.

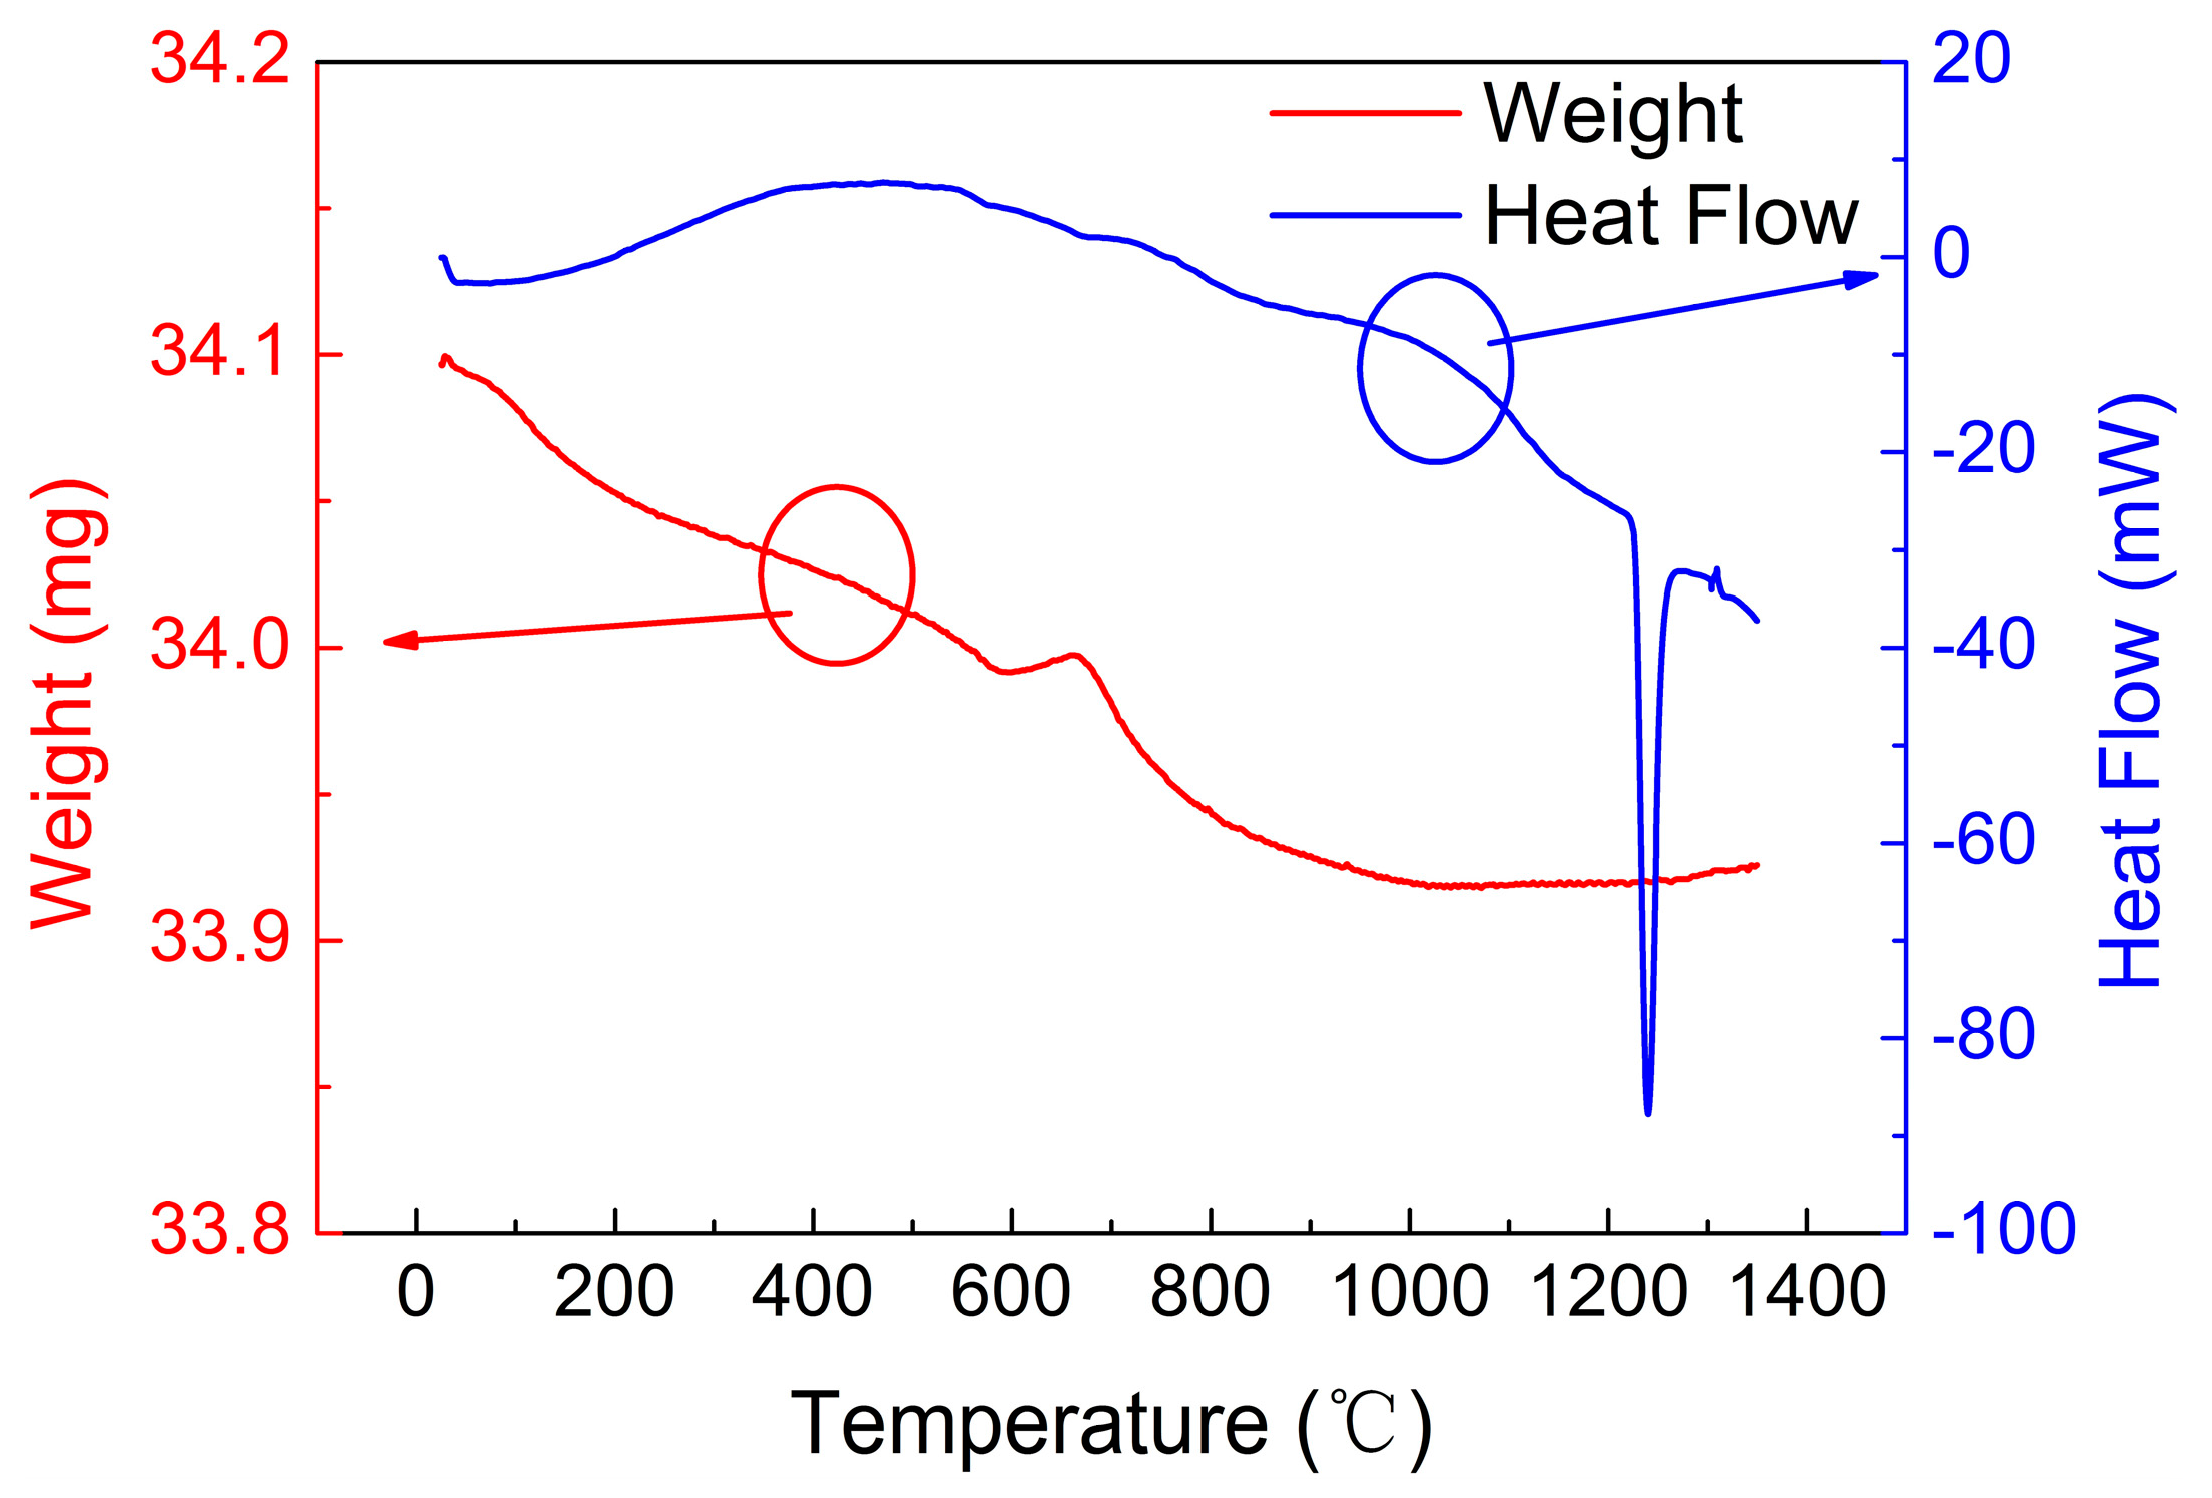
4.2. Thermogravimetric and Differential Thermal Analysis

The thermogravimetric and differential thermal analysis were measured from 20 °C to 1350 °C. Figure 4 gives the measured TG-DTA curves, where the mass loss was less than 0.6% over the tested temperature range (the red line in Figure 4) and an endothermic peak in DTA curve (the blue line in Figure 4) was observed at around 1250 °C. According to previous reports, the melting point for Ca3(BO3)2 was 1479 °C [31], higher than 1285 °C for Sr3(BO3)2 [32]. However, in this work, the melting point for Sr3(BO3)2 was judged to be higher than Ca3(BO3)2, since the Ca3(BO3)2 crystal seed melted rapidly when dipped into the Sr3(BO3)2 melt during the seeding process. Therefore, the endothermic peak observed at round 1250 °C was presumed to be associated with a phase transition.

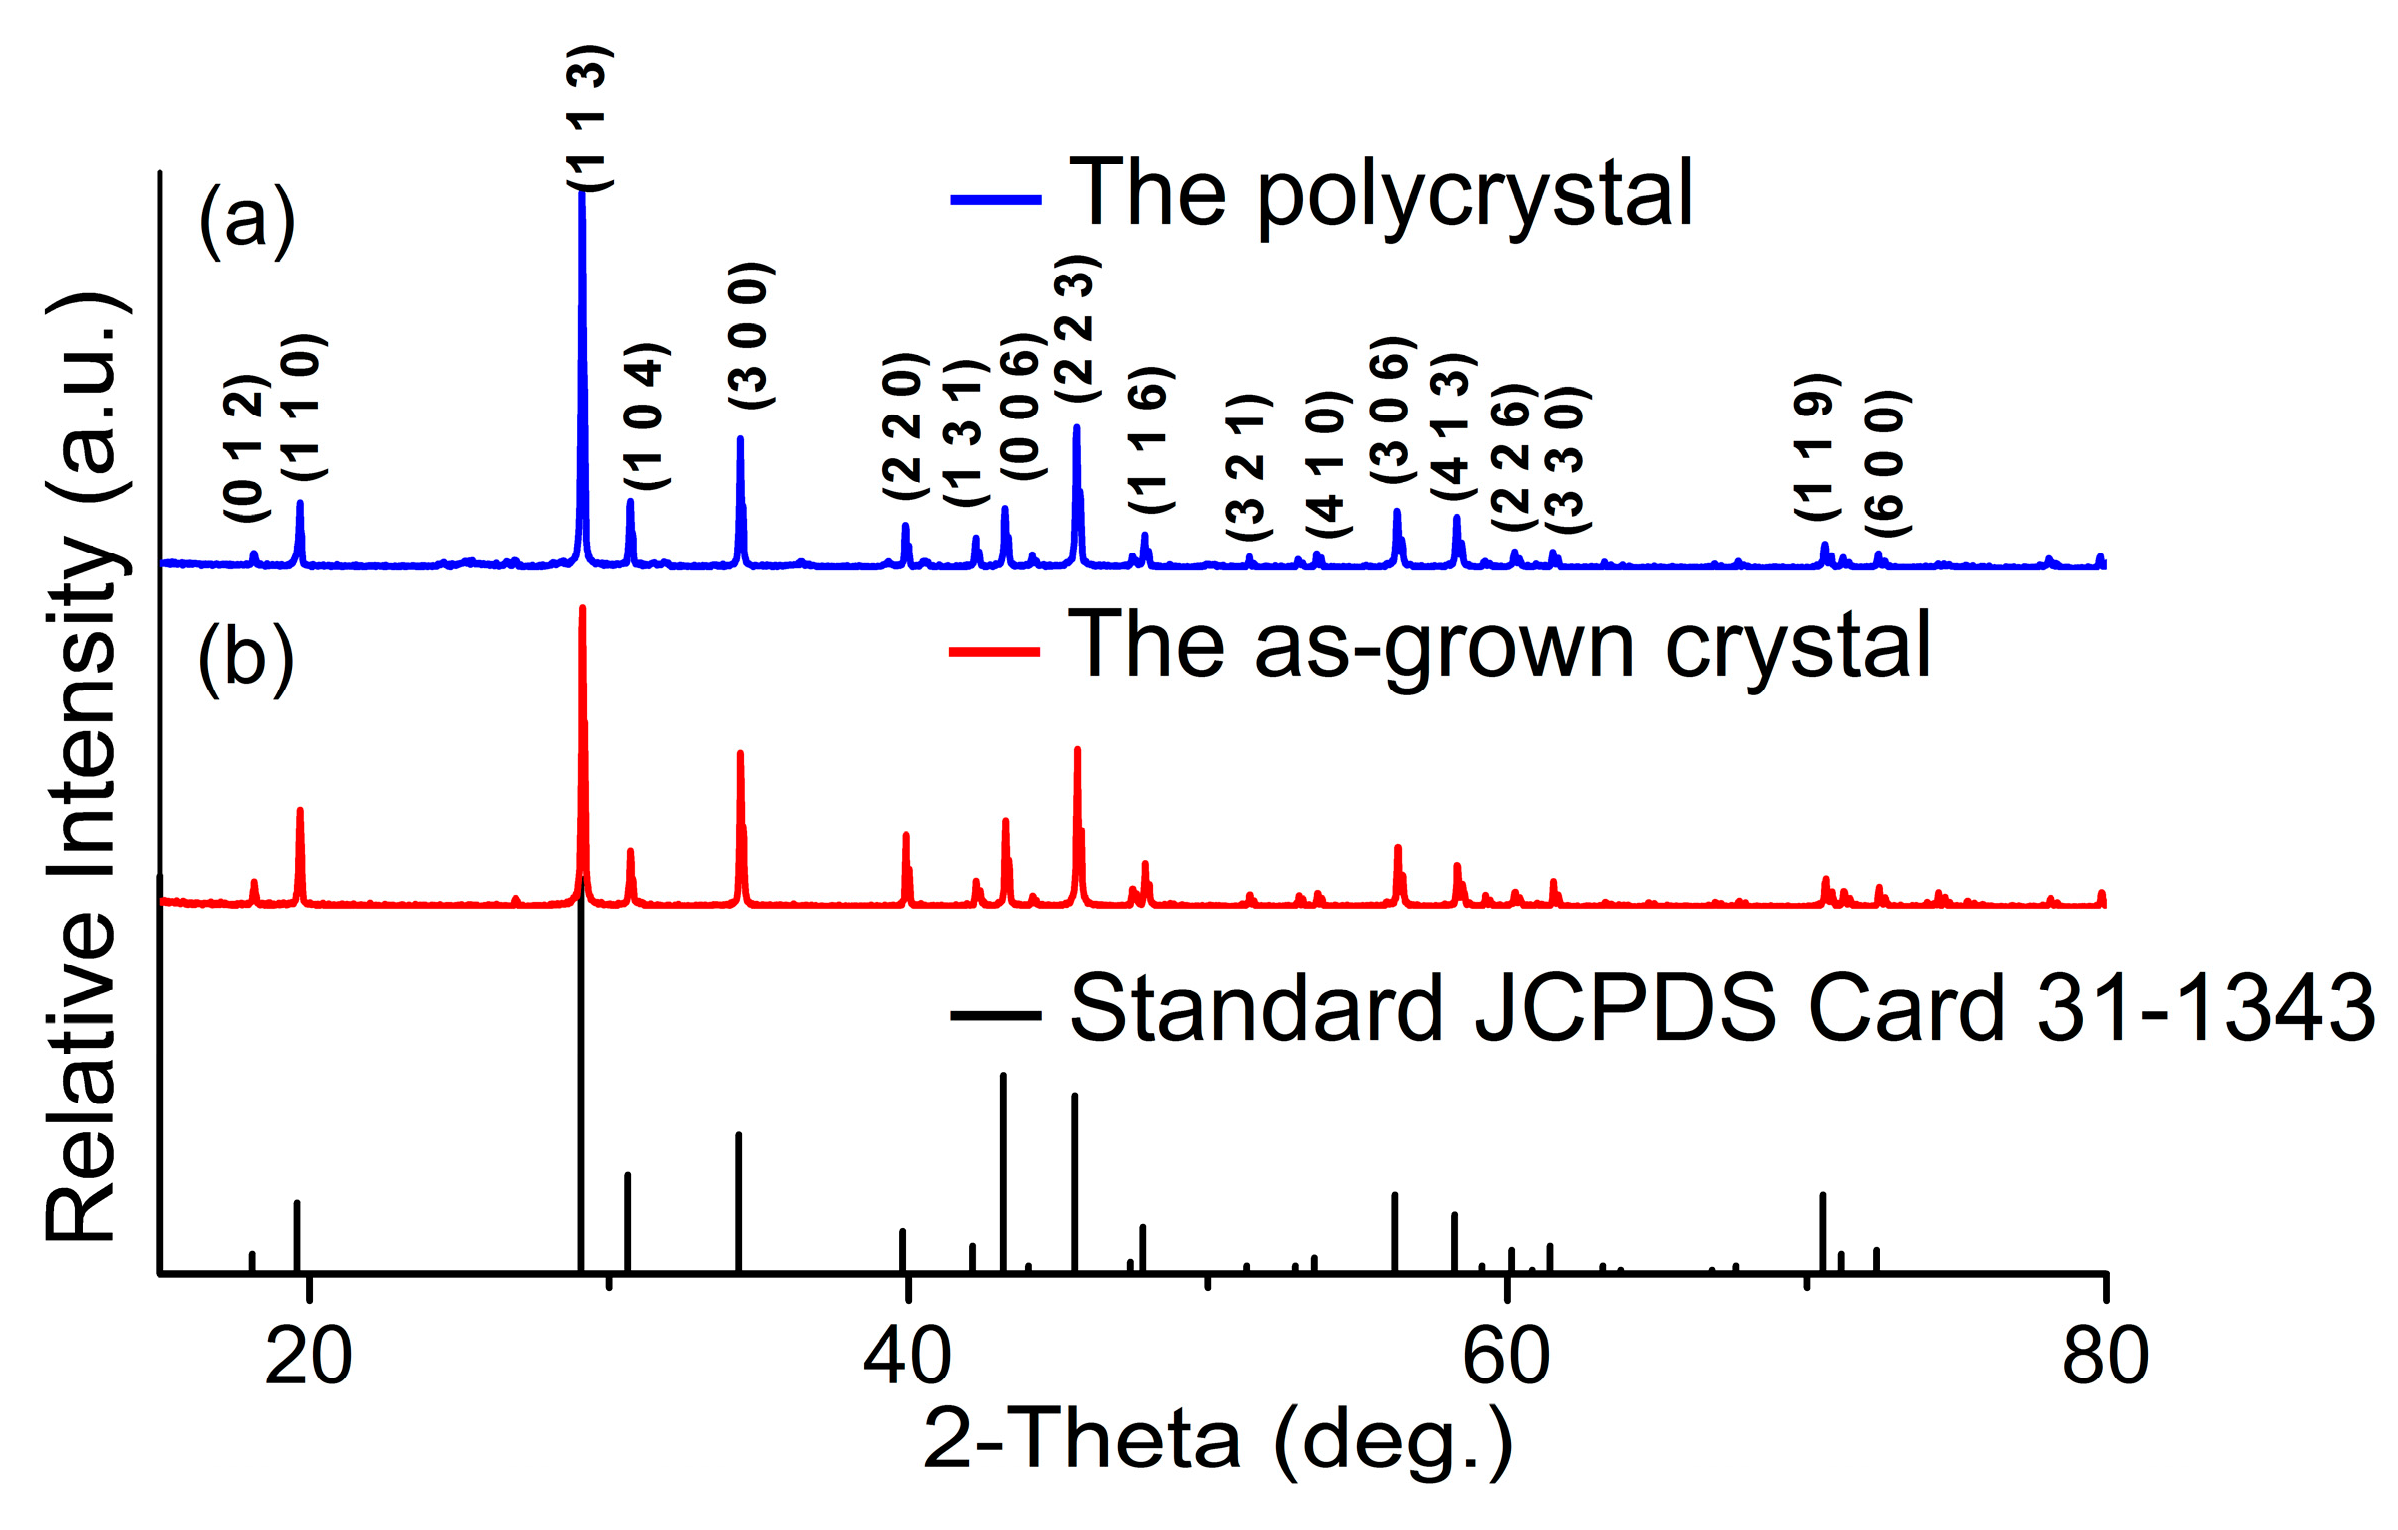
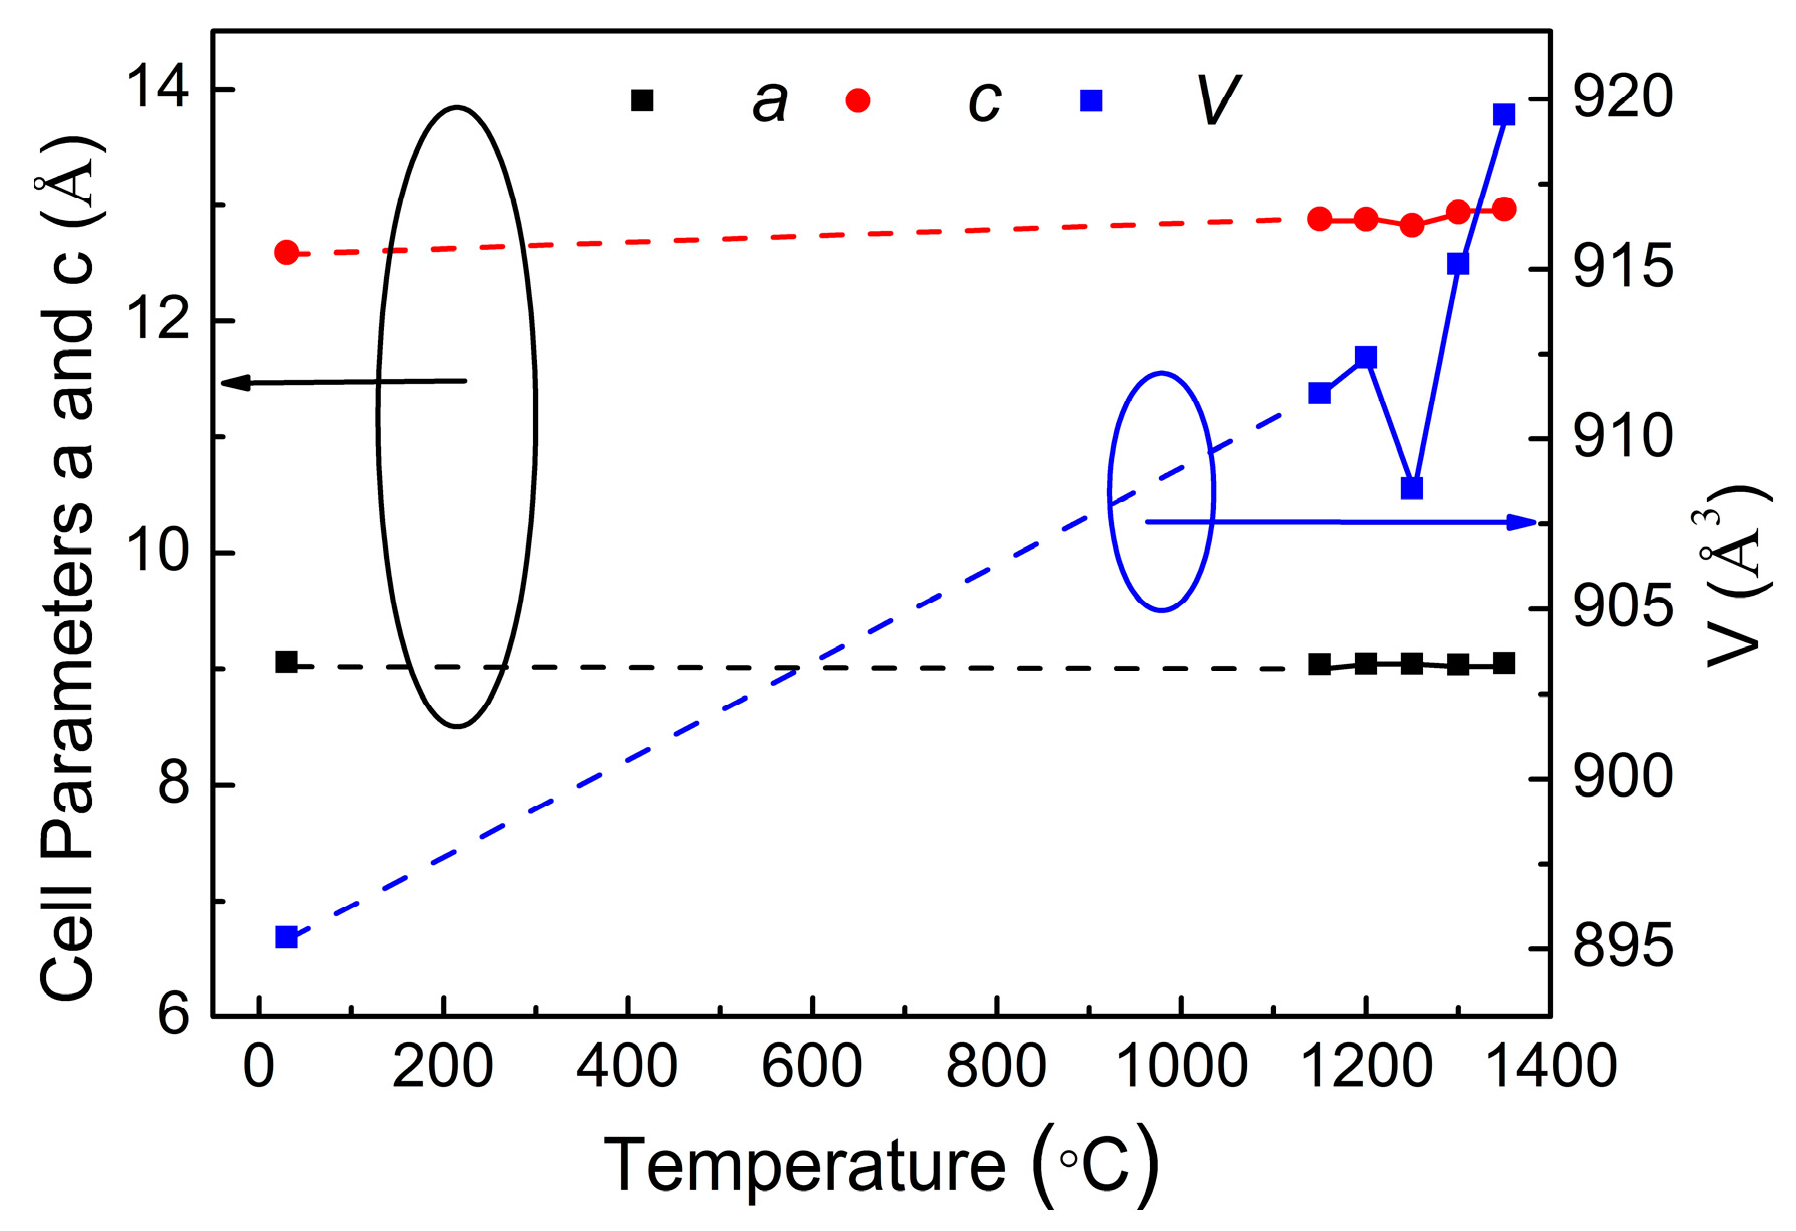
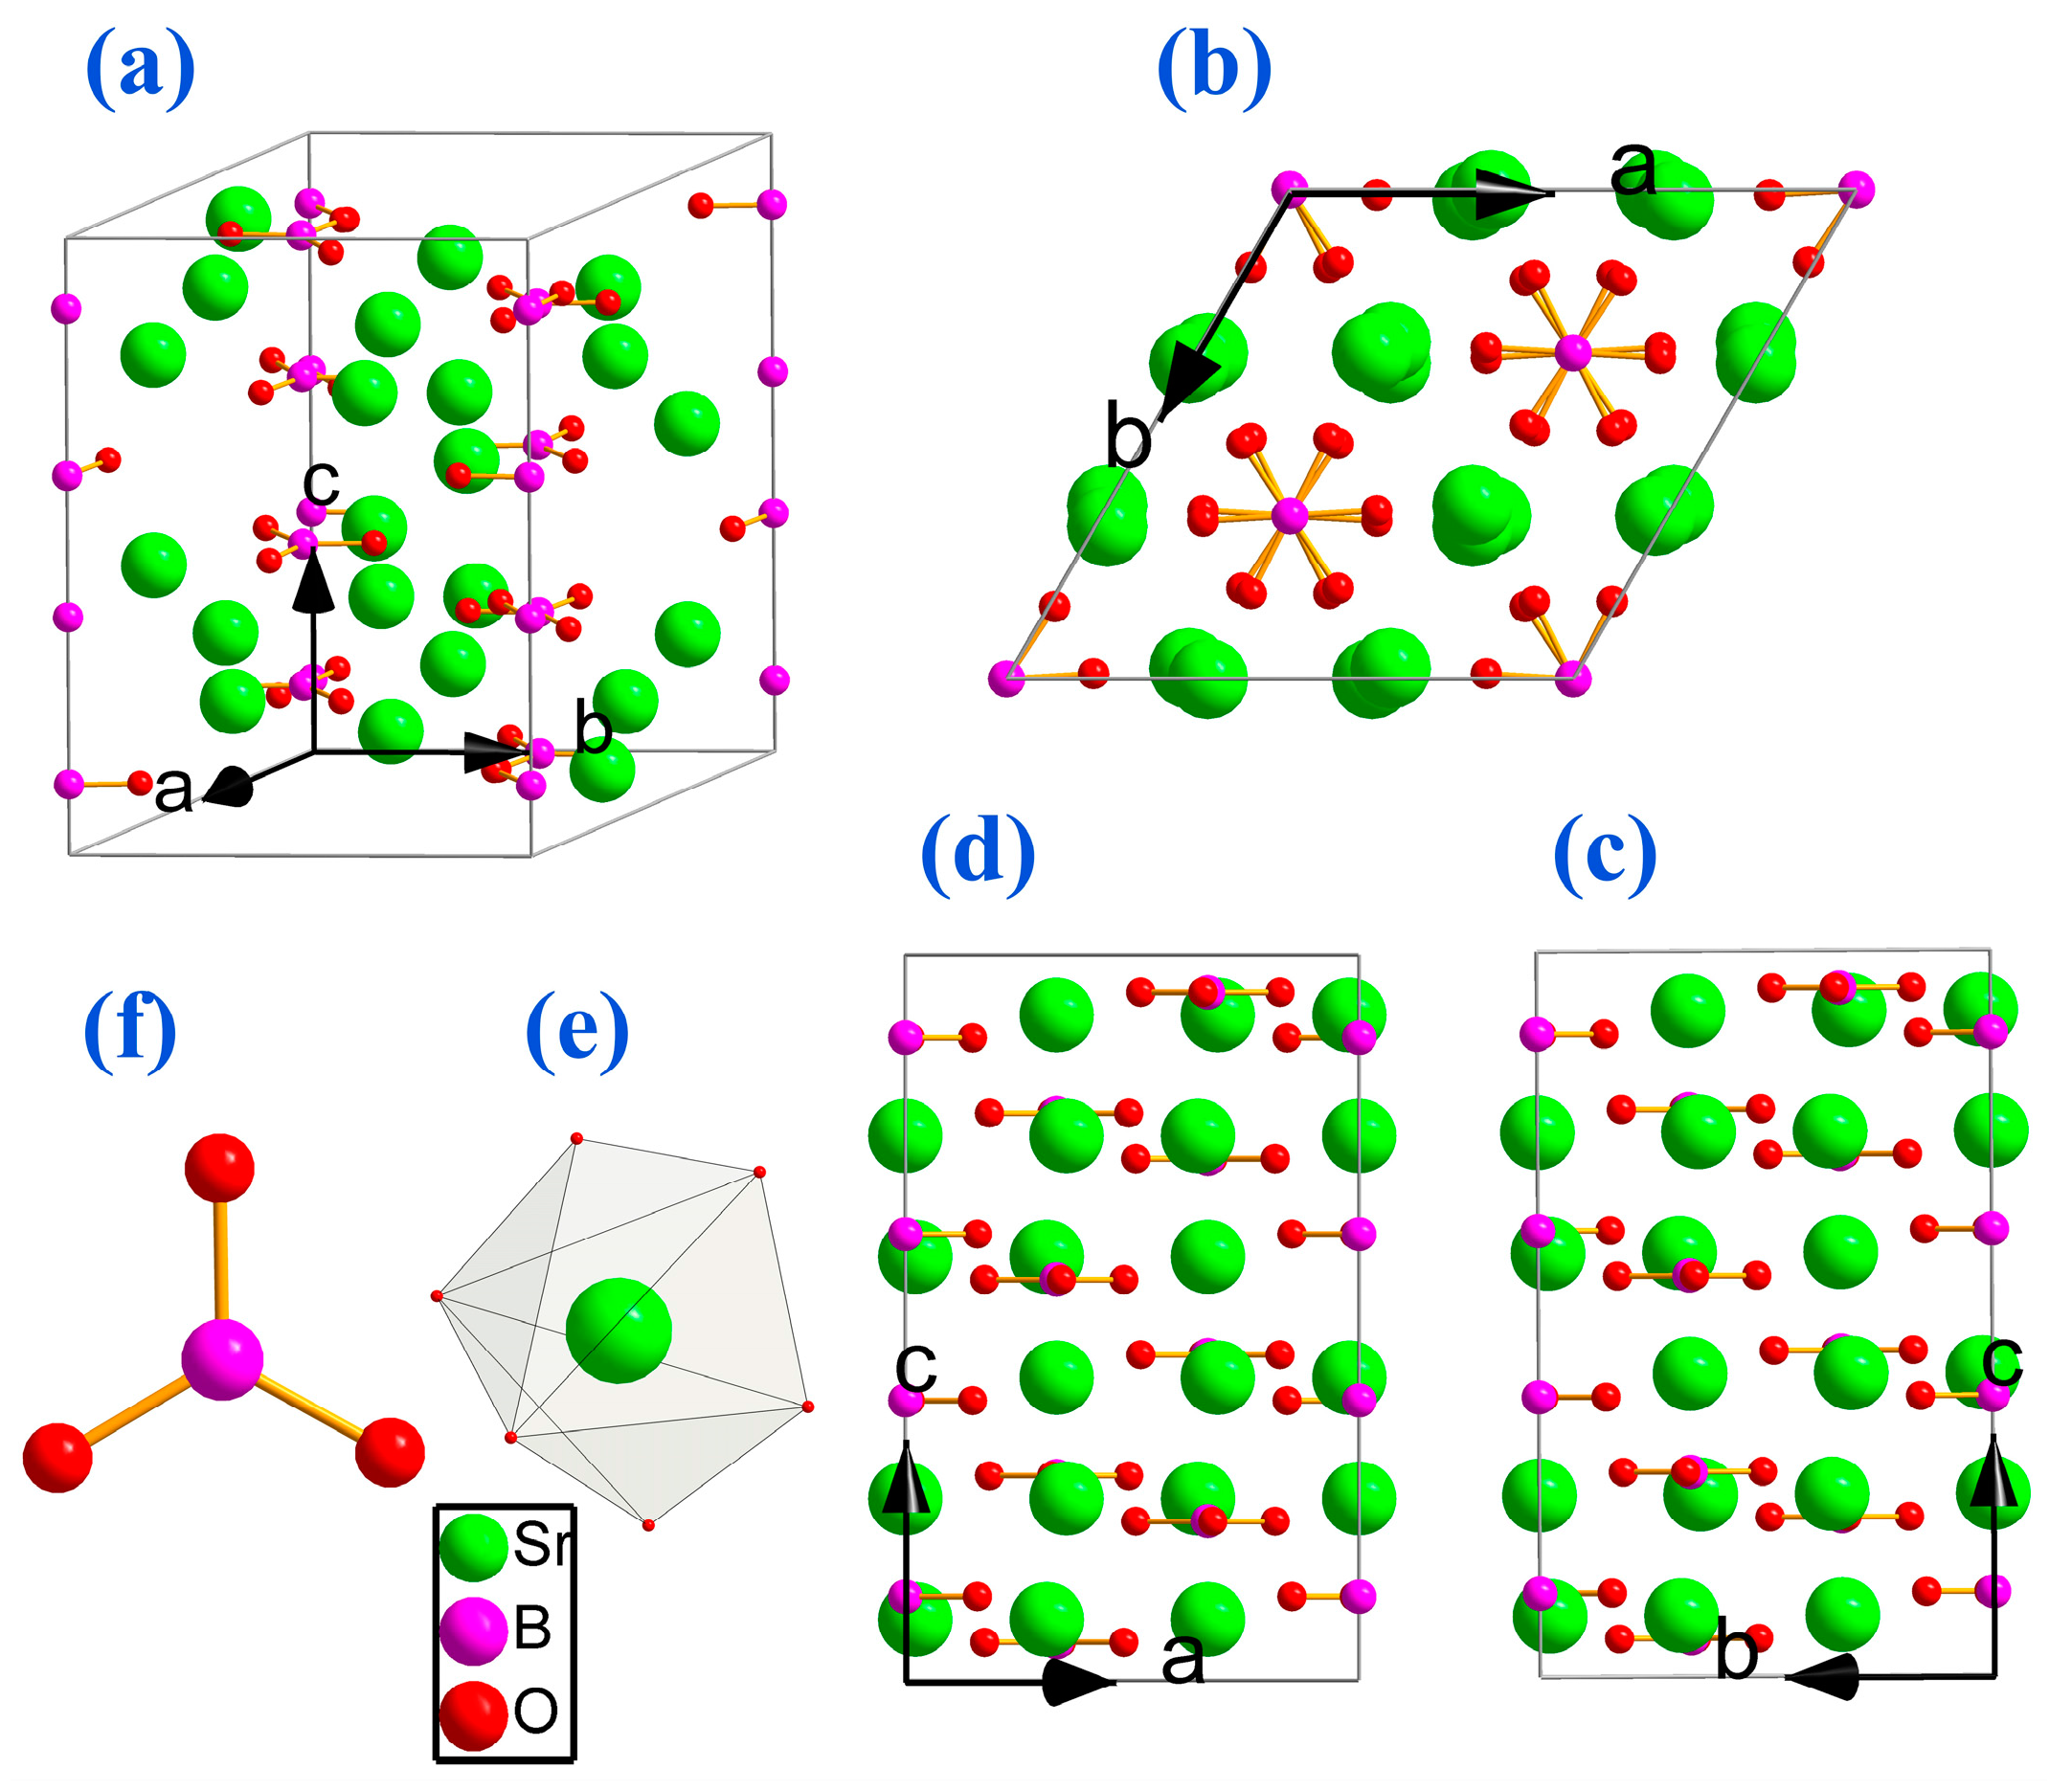
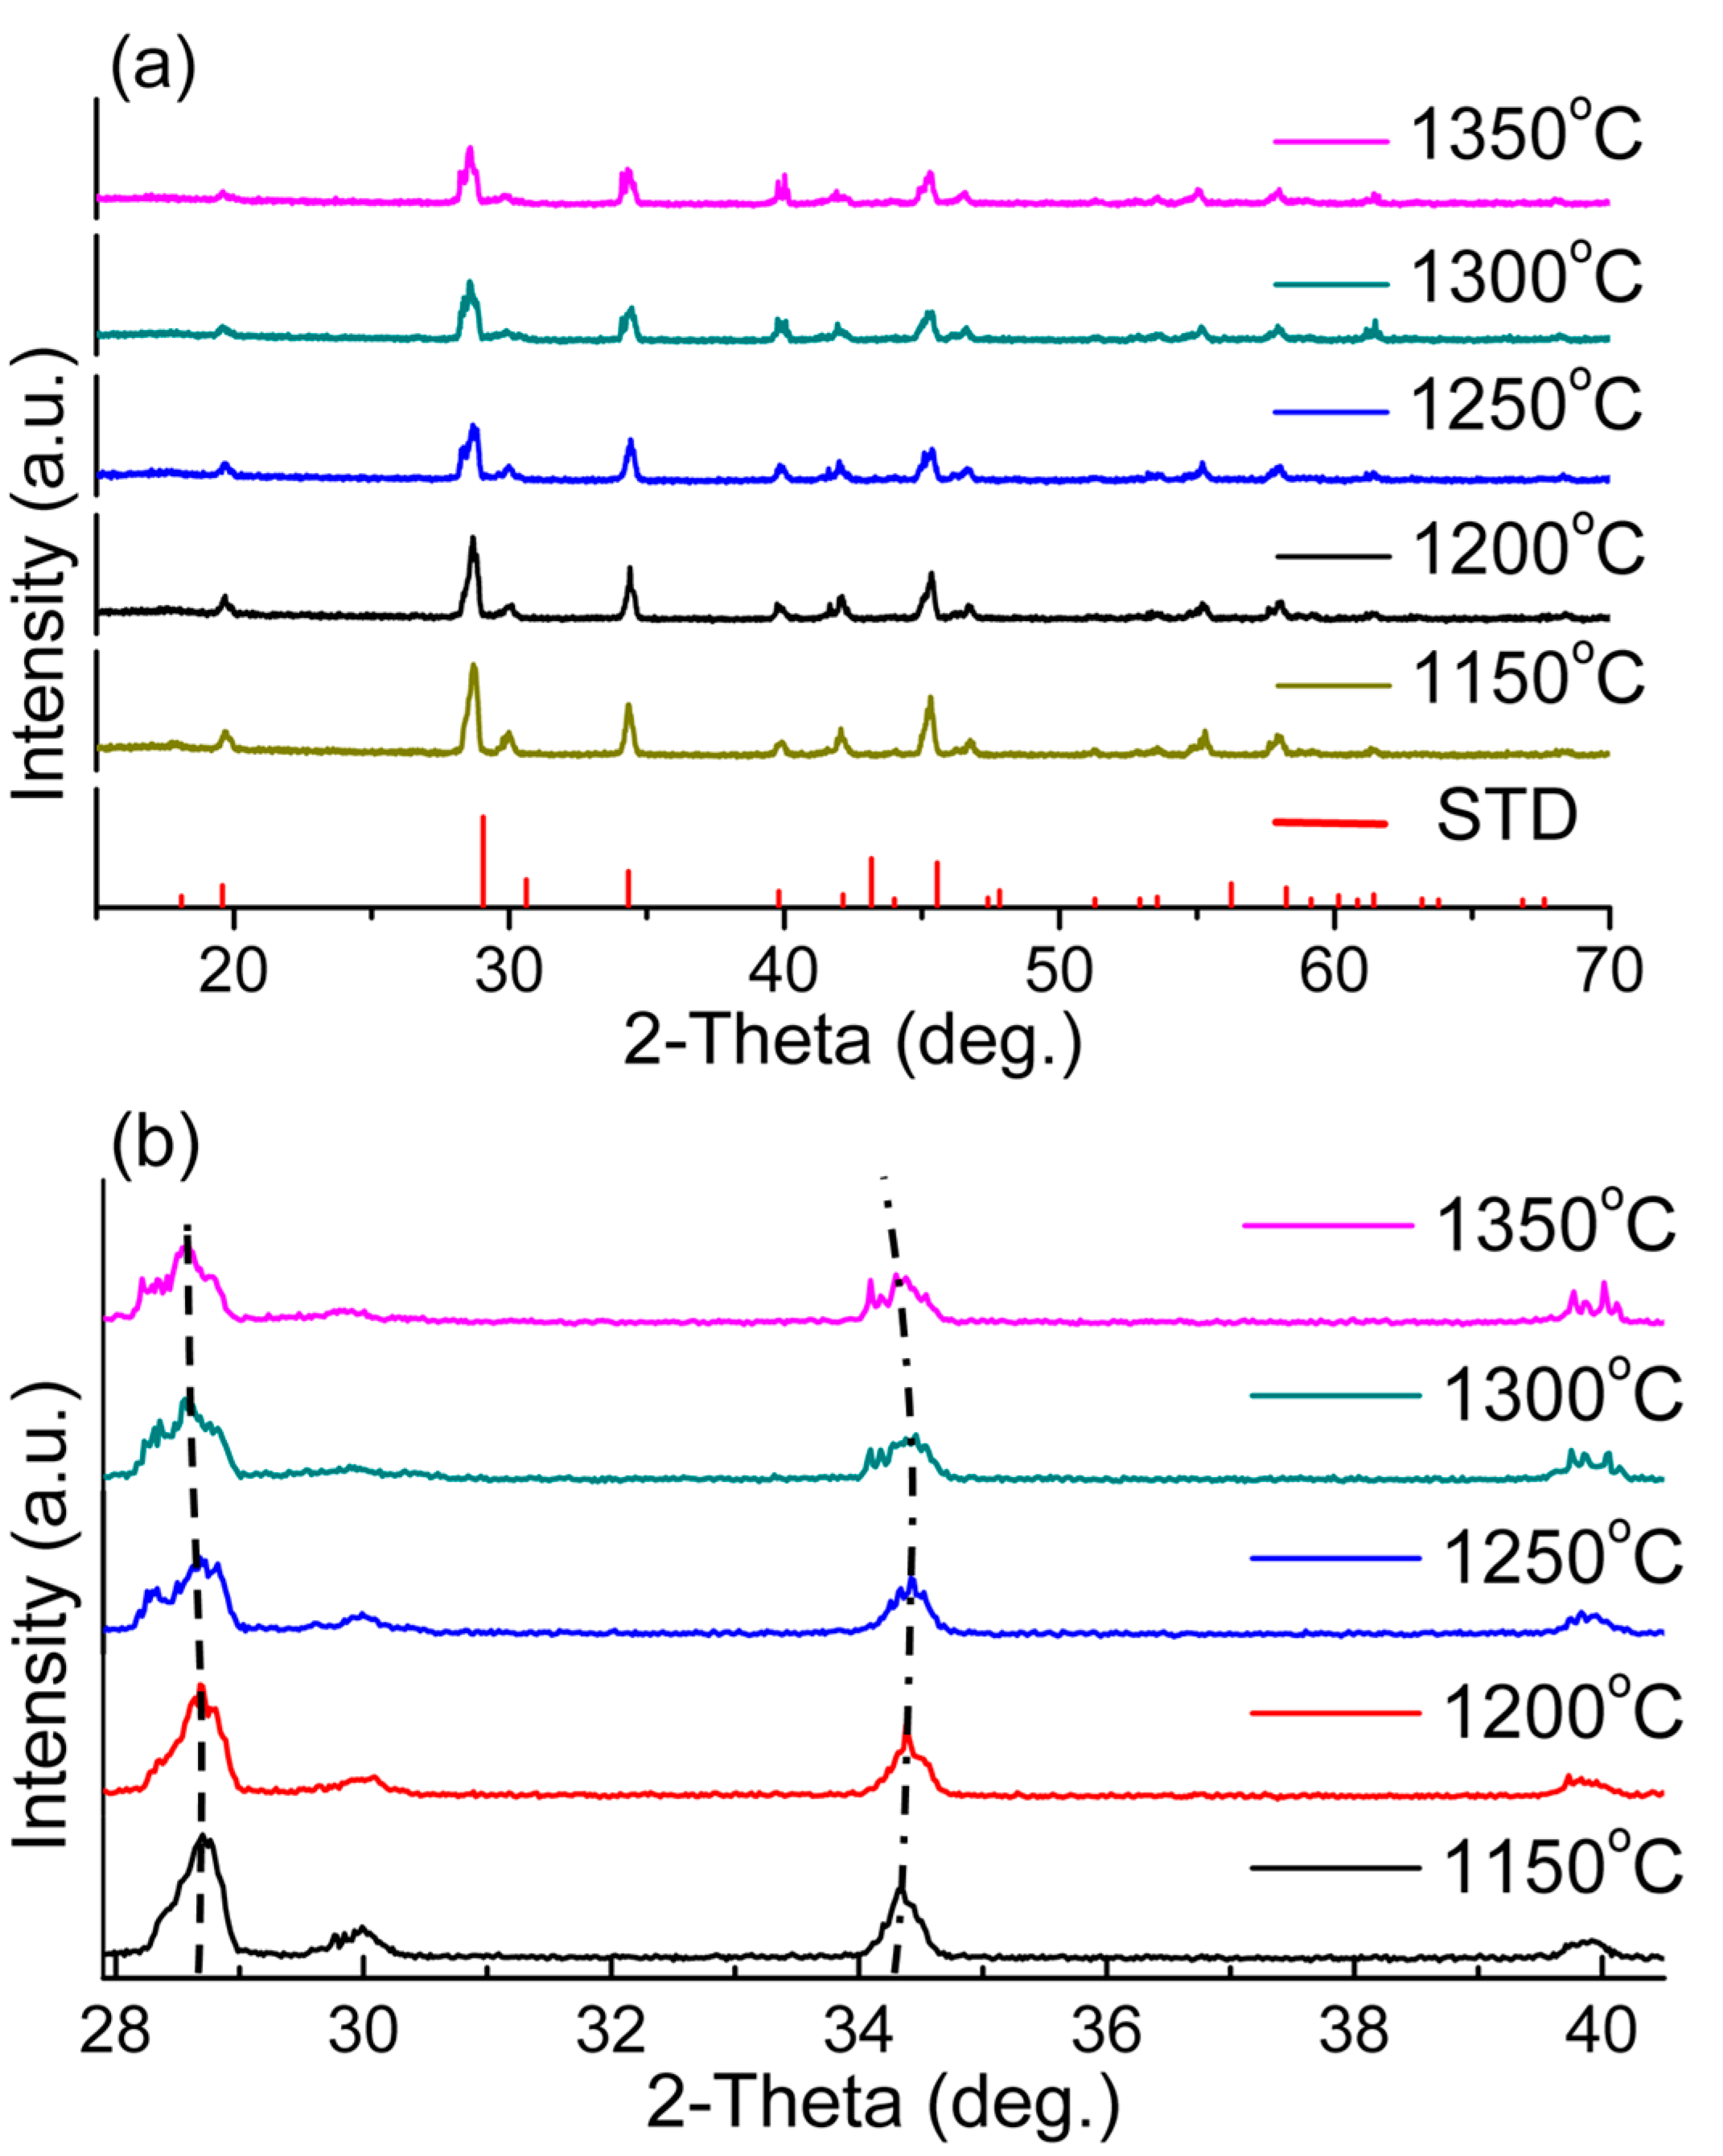
4.3. Structure and Phase Transition Analysis

Figure 5 shows the XRPD pattern of as-grown Sr3(BO3)2 crystals as well as that of polycrystalline sample prepared by solid state reaction for comparison, where all the refraction peaks of the as-grown bulk crystal sample and polycrystalline sample were in consistent with the standard diffraction data (JCPDS No. 31–1343), indicating the Sr3(BO3)2 samples before and after Cz growth possess the same crystal phase. The cell parameters for Sr3(BO3)2 crystals were analyzed utilizing Jade Version 6 with necessary steps including phase retrieval, subtracting the background and stripping the Kα2-lines with cubic spline, smoothing and fitting all profiles [33]. In the end, the cell parameters were obtained to be a = b = 9.02895(0.002125) Å, c = 12.54646(0.002462) Å, α = β = 90°, γ = 120°, and V = 885.78(4.72) Å3, slightly lower than the reported values [26].
In order to further determine the phase transition for Sr3(BO3)2 crystal, high temperature XRPD measurement was carried out. Figure 6 presents the XRPD patterns of Sr3(BO3)2 crystal samples measured from 1150 °C to 1350 °C. It was found from Figure 6a that the main diffraction peaks of Sr3(BO3)2 sample were still consistent with the standard data, while some splitting peaks appeared at the diffraction angles (θ) of 28.70°, 34.34°, and 40.02° when the temperature increased above 1250 °C, corresponding to (113), (300), and (220) planes (JCPDS No. 31–1343), respectively. It was found that the diffraction angles (θ) for (113), (300), and (220) planes were all shifted to high angle region then to low angle region, as shown in Figure 6b.
It is known that the relationship between cell parameters and interplanar spacing (d) for crystals with R-3c space group was as follows:
1 d h k l = a 2 V [ ( h 2 + k 2 + l 2 ) sin 2 α + 2 ( h k + h l + k l ) ( cos 2 α cos α ) ]
where a, V, and α are cell parameters; h, k, and l are indices of crystal face; and dhkl is the interplanar spacing of (hkl) plane. According to Bragg equation (2dsinθ = nλ), the values of interplanar spacing d for different crystal planes were also related to the diffraction angle θ. Therefore, the variation tendency of 2-Theta could be attributed to the change of d values. Table 1 lists the dhkl values for different crystal planes calculated from XRPD data measured at different temperatures.
In order to illustrate the change of crystal structure for Sr3(BO3)2, the variations of cell parameters as a function of temperature up to 1350 °C were draw in Figure 7, where a distinct drop was found at 1250 °C. The split of diffraction peaks observed at temperatures above 1250 °C and the significant change of cell parameters at 1250 °C indicating a new crystal phase was formed, which was in accordance with the TG-DTA experimental results. Therefore, the conclusion can be drawn that the endothermic peak in DTA curve observed around 1250 °C should be a reflection of phase transition other than its melting point.

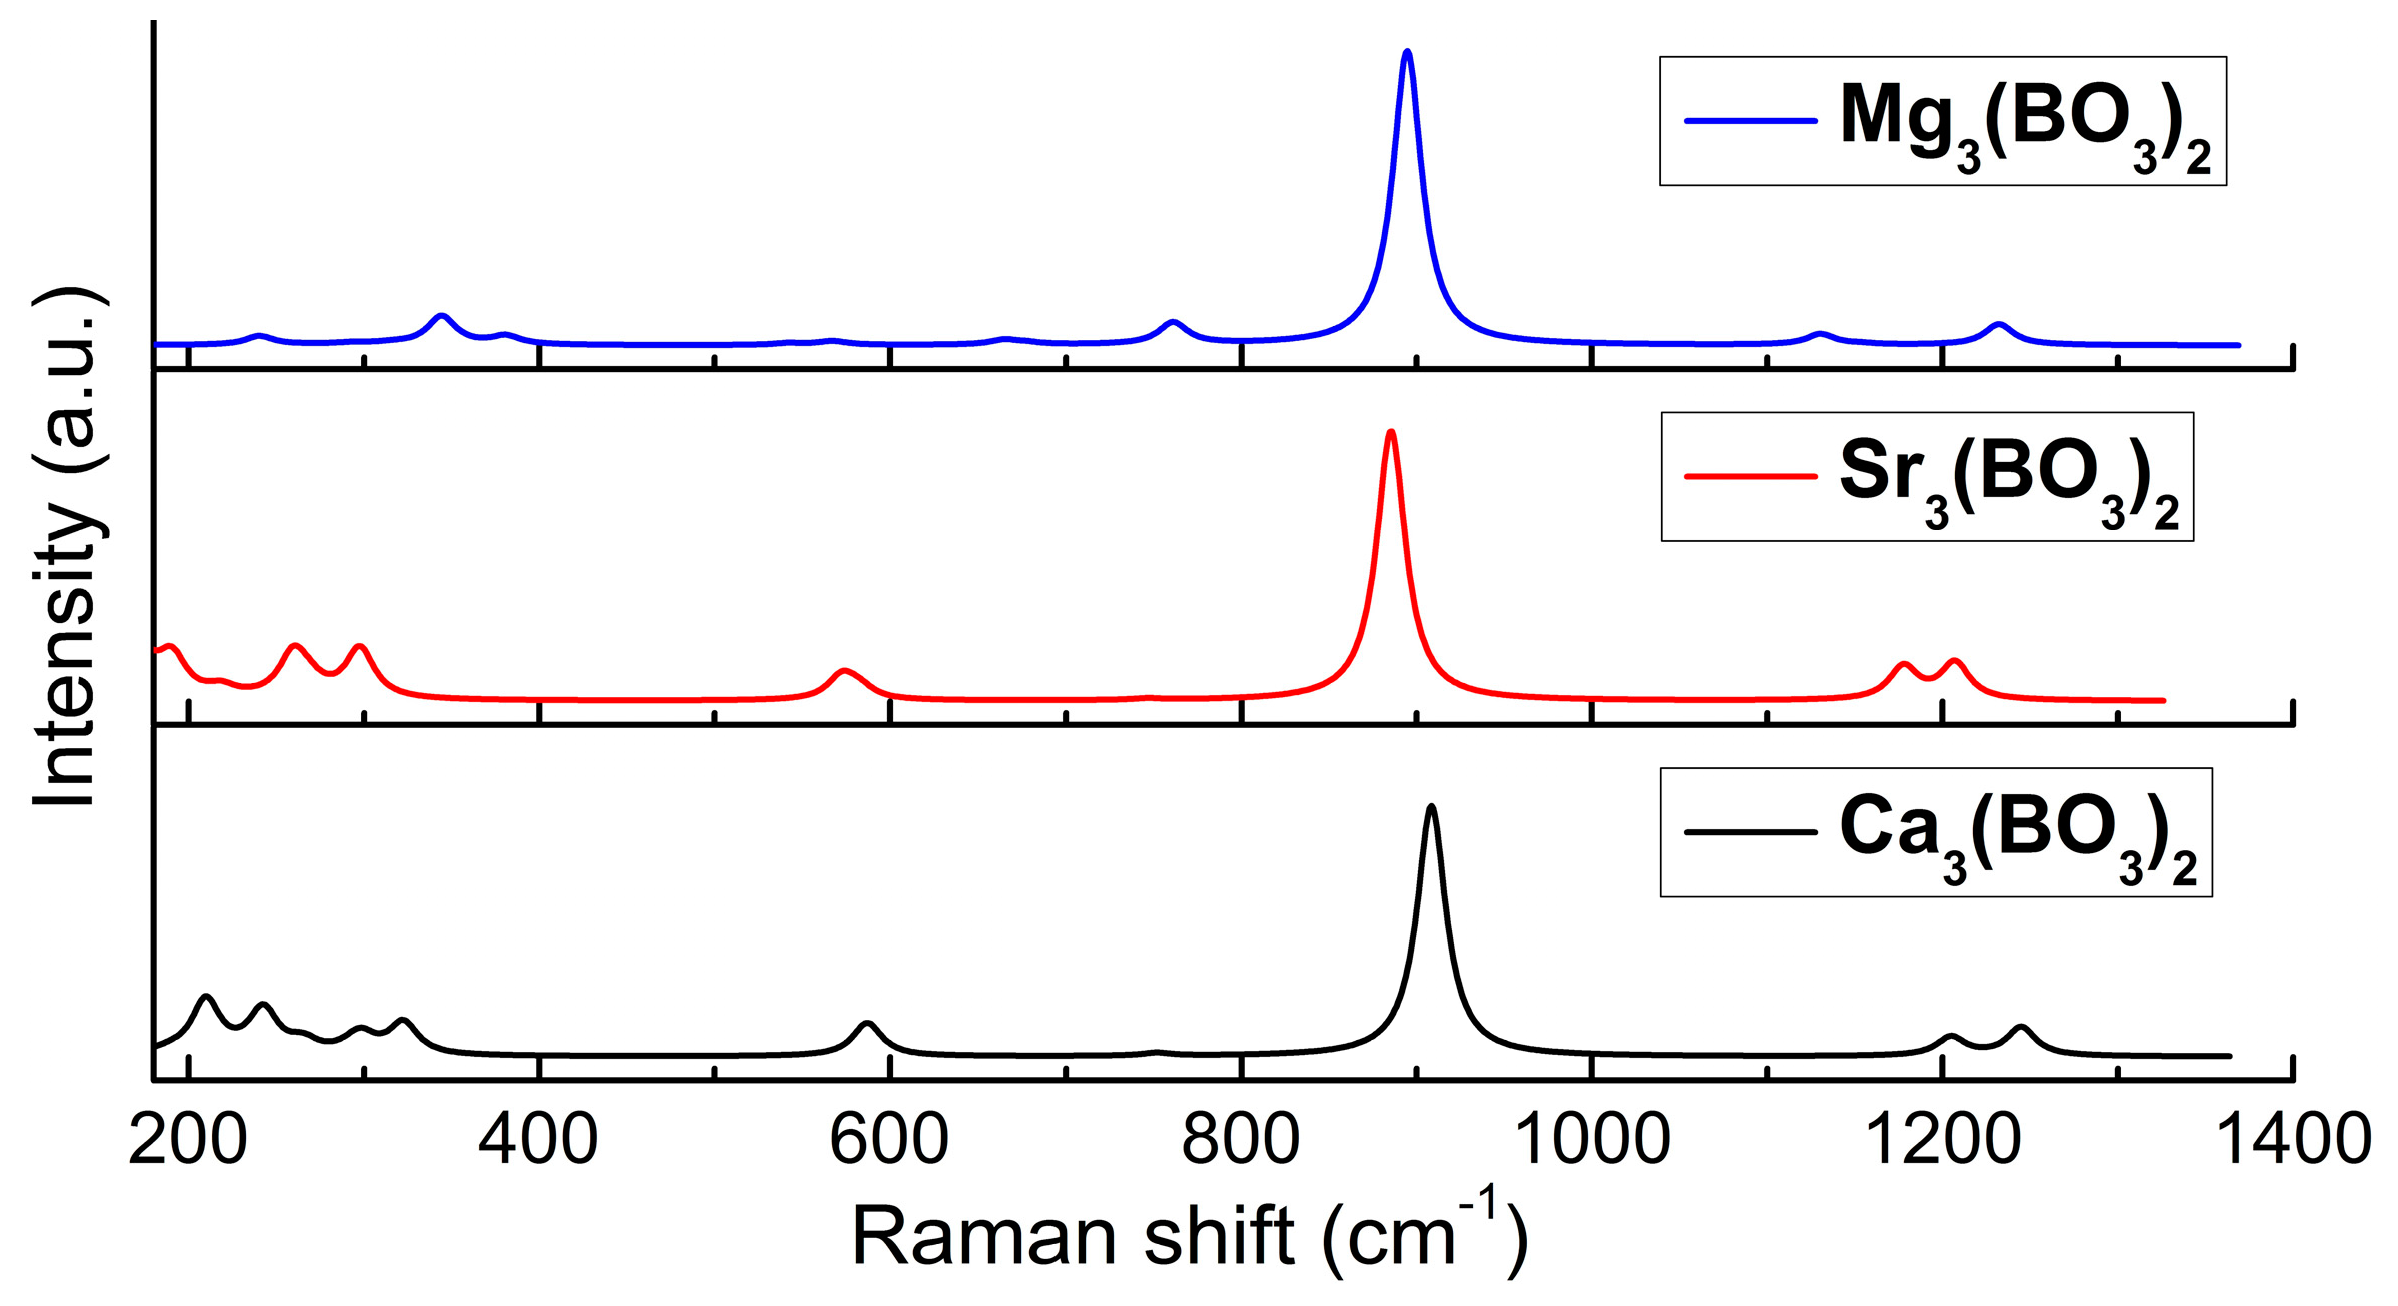
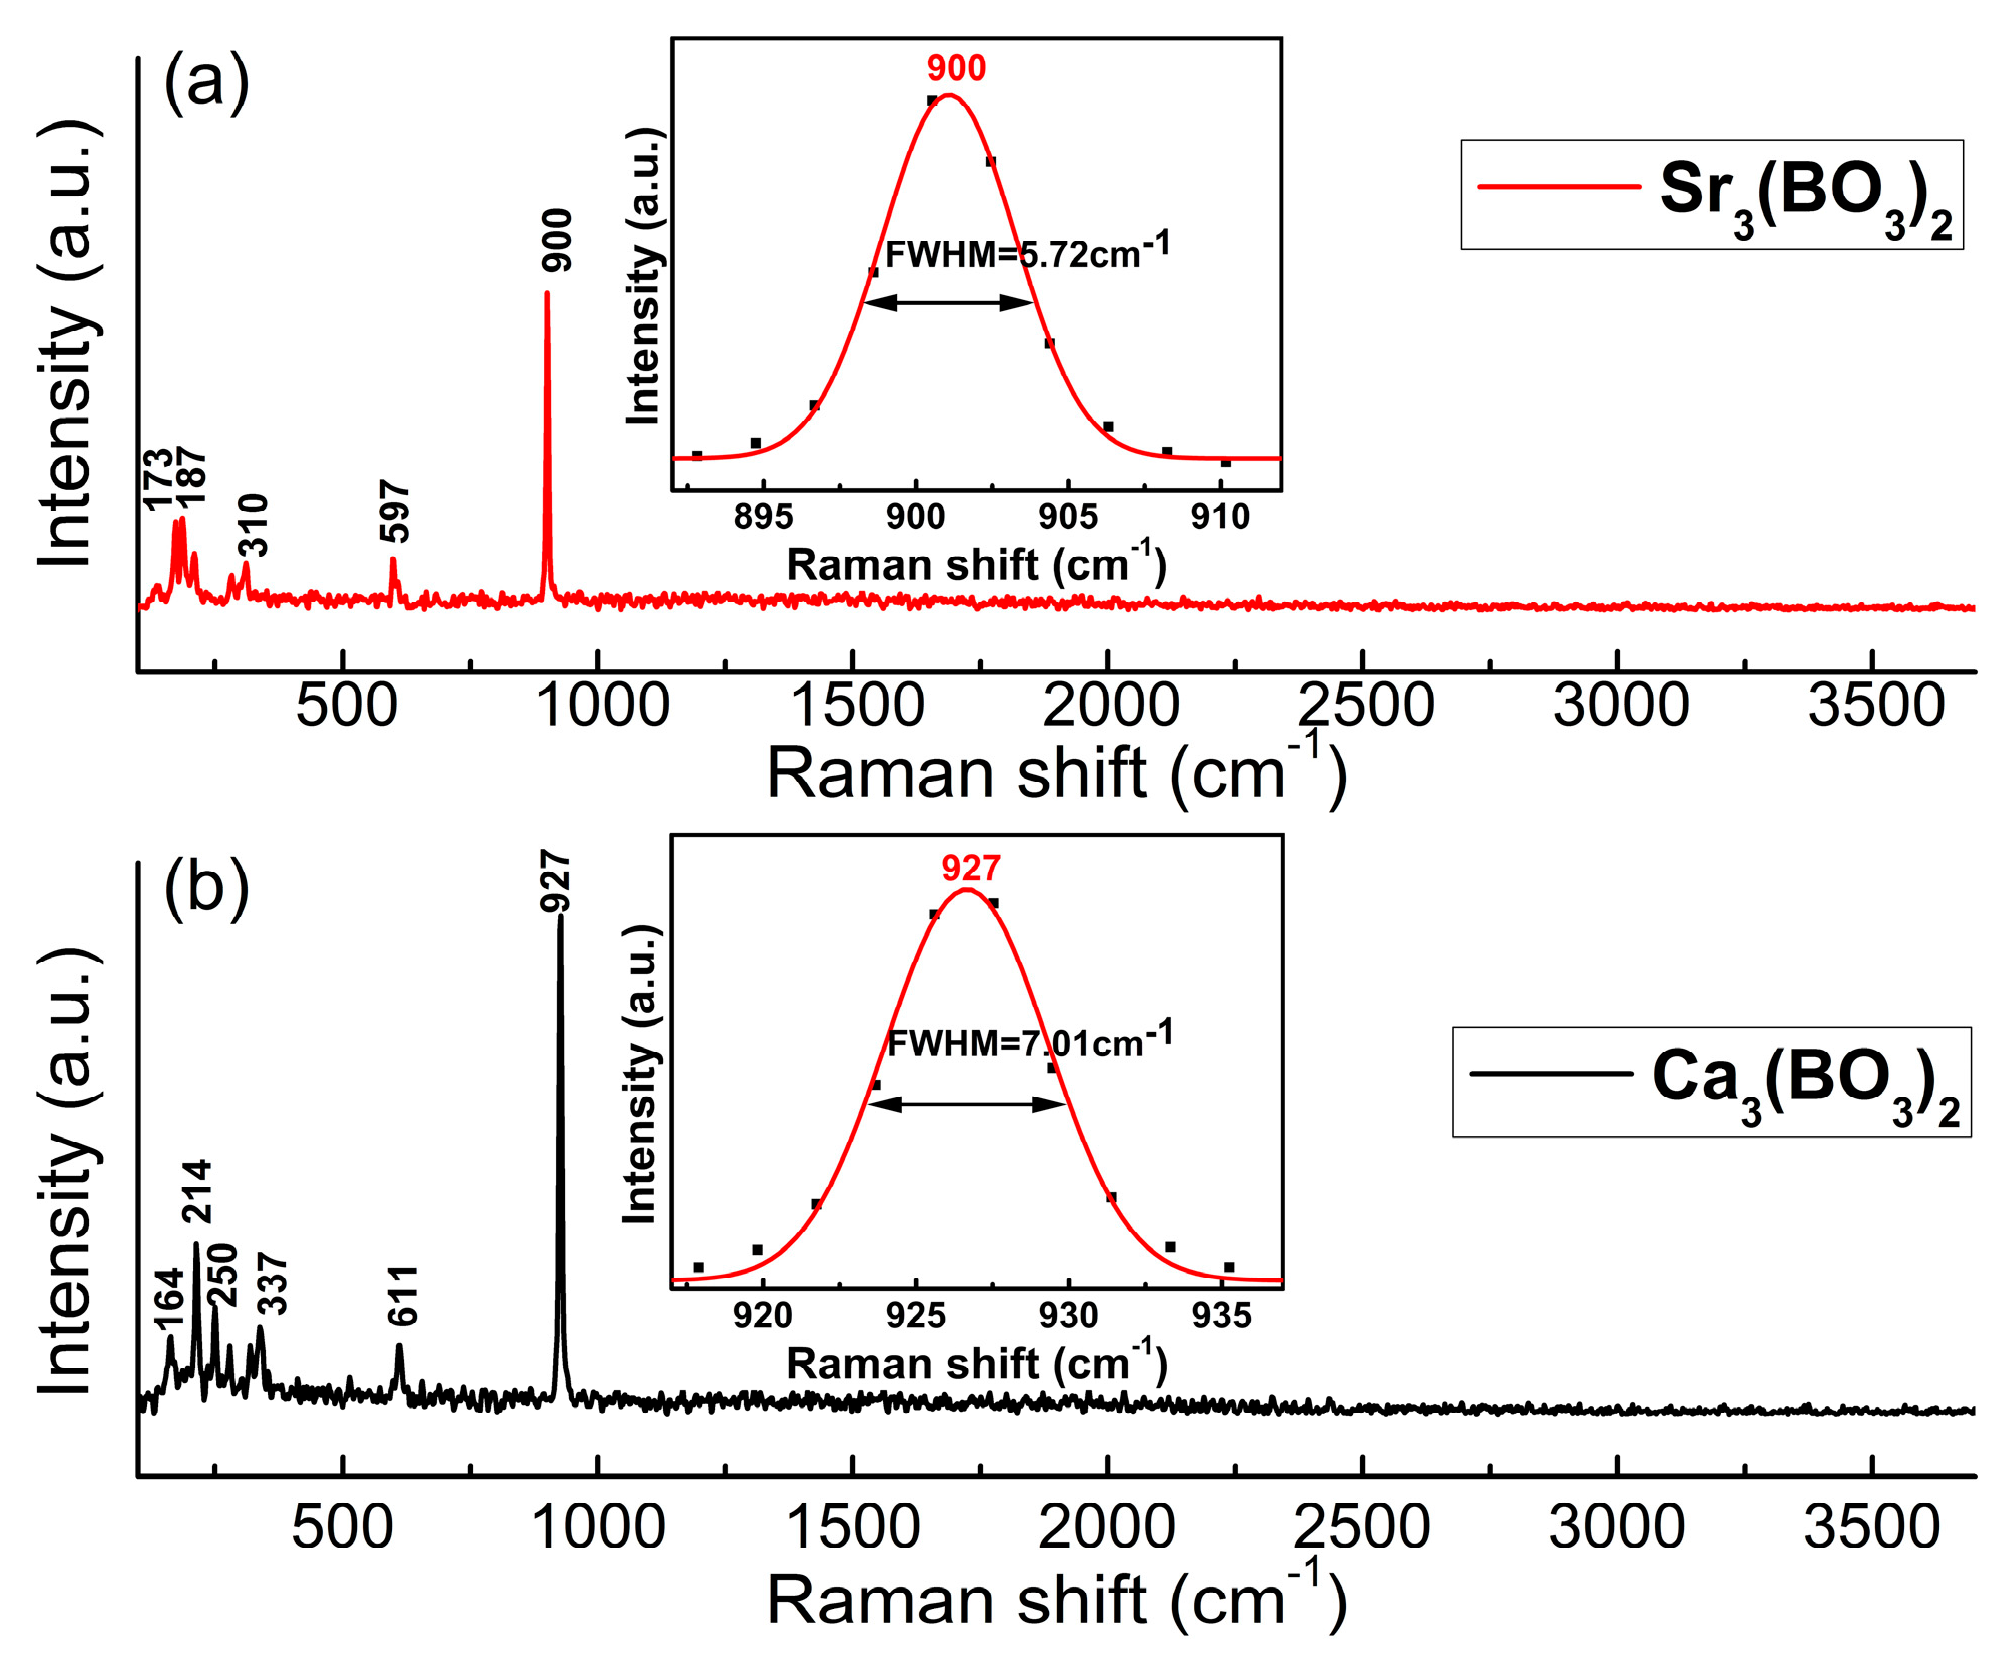
4.4. Raman Spectra Analysis

Figure 8 gives the powder Raman spectra of Sr3(BO3)2 crystal together with the results of Ca3(BO3)2 crystal for comparison. It was noted that the strongest Raman peak for Sr3(BO3)2 crystal (900 cm−1) was located at a similar position with that of Ca3(BO3)2 crystal (927 cm−1), corresponding to the symmetrical stretching vibration of [BO3]3−. The line widths of the strongest peak were obtained and found to be on the order of 5.72 cm−1 and 7.01 cm−1 for Sr3(BO3)2 and Ca3(BO3)2, respectively. On account of the Raman gain coefficient being inversely proportional to the line width [34,35], the Sr3(BO3)2 crystal might possess even larger Raman gain than Ca3(BO3)2 crystal.

5. Conclusions

A new kind of Raman crystal Sr3(BO3)2 was synthesized by solid state reaction method and Cz pulling method. The crystal structure of Sr3(BO3)2 crystal was analyzed by XRPD method and found to possess trigonal symmetry (space group R-3c) similar to Ca3(BO3)2. The structure stability was studied by means of TG/DTA and high temperature XRPD up to 1350 °C, where the Sr3(BO3)2 crystal was found to show a phase transition around 1250 °C, which induced cracking during crystal cooling. Raman properties were studied theoretically and experimentally, where the Sr3(BO3)2 crystal was found to show strong frequency shift at 900 cm−1, comparable to that of Ca3(BO3)2 (927 cm−1). In addition, the line width of the strongest Raman peak of Sr3(BO3)2 (5.72 cm−1) was lower than Ca3(BO3)2 (7.01 cm−1), indicating that Sr3(BO3)2 might possess a larger Raman gain coefficient, which is beneficial for the SRS process.

Acknowledgments

This work was supported by the National Natural Science Foundation of China (Grant Nos. 51202129, 51502158, 51372138, 51672160, and 61178060), and The Fundamental Research Funds of Shandong University (2015JC039).

Author Contributions

Xinle Wang and Hongwei Qi contributed to the crystal growth and property characterization work. Yanlu Li carried out the theoretical study on Raman shifts by first principle. Fapeng Yu and Zhengping Wang conceived the experiments. Hewei Wang, Feifei Chen, and Yanqing Liu took part in the single crystal growth. Xinguang Xu and Xian Zhao guided the measurements. All authors contributed in the discussion of experimental results.

Conflicts of Interest

The authors declare no conflict of interest.

References

  1. Li, Y.L.; Ye, Y.; Fan, Y.D.; Zhou, J.; Jia, L.; Tang, B.; Wang, X.G. Silver nanoprism-loaded eggshell membrane: a facile platform for in situ sers monitoring of catalytic reactions. Crystals 2017, 7, 45. [Google Scholar] [CrossRef]
  2. Saar, B.G.; Freudiger, C.W.; Reichman, J.; Stanley, C.M.; Holtom, G.R.; Xie, X.S. Video-rate molecular imaging in vivo with stimulated raman scattering. Science 2010, 330, 1368–1370. [Google Scholar] [CrossRef] [PubMed]
  3. Girlando, A.; Masino, M.; Brillante, A.; Toccoli, T.; Iannotta, S. Raman identification of polymorphs in pentacene films. Crystals 2016, 6, 41. [Google Scholar] [CrossRef]
  4. Du, Y.; Cai, Q.; Xue, J.D.; Zhang, Q. Raman and terahertz spectroscopic investigation of cocrystal formation involving antibiotic nitrofurantoin drug and coformer 4-aminobenzoic acid. Crystals 2016, 6, 164. [Google Scholar] [CrossRef]
  5. Lioe, D.X.; Mars, K.; Kawahito, S.; Yasutomi, K.; Kagawa, K.; Yamada, T.; Hashimoto, M. A stimulated raman scattering CMOS pixel using a high-speed charge modulator and lock-in amplifier. Sensors 2016, 16, 532. [Google Scholar] [CrossRef] [PubMed]
  6. Wang, W.J.; Guo, M.; Lu, D.L.; Wang, W.M.; Fu, Z.Y. Effect of HNO3 concentration on the morphologies and properties of Bi2WO6 photocatalyst synthesized by a hydrothermal method. Crystals 2016, 6, 75. [Google Scholar] [CrossRef]
  7. Wu, D.; Huang, H.; Zhu, X.P.; He, Y.W.; Xie, Q.L.; Chen, X.L.; Zheng, X.M.; Duan, H.G.; Gao, Y.L. E’’ Raman Mode in Thermal Strain-Fractured CVD-MoS2. Crystals 2016, 6, 151. [Google Scholar] [CrossRef]
  8. Wu, Z.X.; Wang, Z.P.; Zhang, F.; Liu, Y.Q.; Lu, J.R.; Xu, X.G. Optical frequency fork based on stimulated Raman scattering. J. Alloys Compd. 2016, 682, 537–542. [Google Scholar] [CrossRef]
  9. Bergmann, V.; Meier, W.; Wolff, D.; Stricker, W. Application of spontaneous Raman and Rayleigh scattering and 2D LIF for the characterization of a turbulent CH4/H2/N2 jet diffusion flame. Appl. Phys. B 1998, 66, 489–502. [Google Scholar] [CrossRef]
  10. Cavalcante, L.S.; Sczancoski, J.C.; Lima, L.F., Jr.; Espinosa, J.W.M.; Pizani, P.S.; Varela, J.A.; Longo, E. Synthesis, characterization, anisotropic growth and photoluminescence of BaWO4. Cryst. Growth Des. 2009, 9, 1002–1012. [Google Scholar] [CrossRef]
  11. Ivleva, L.I.; Voronina, I.S.; Lykov, P.A.; Berezovskaya, L.Y.; Osiko, V.V. Growth of optically homogeneous BaWO4 single crystals for Raman lasers. J. Cryst. Growth 2007, 304, 108–113. [Google Scholar] [CrossRef]
  12. Zvereva, P.G.; Basieva, T.T.; Osikoa, V.V.; Kulkovb, A.M.; Voitsekhovskiib, V.N.; Yakobsonb, V.E. Physical, chemical and optical properties of barium nitrate Raman crystal. Opt. Mater. 1999, 11, 315–334. [Google Scholar] [CrossRef]
  13. Li, X.L.; Lee, A.J.; Huo, Y.J.; Zhang, H.J.; Wang, J.Y.; Piper, J.A.; Pask, H.M.; Spence, D.J. Managing SRS competition in a miniature visible Nd:YVO4/BaWO4 Raman laser. Opt. Express 2012, 20, 19305–19312. [Google Scholar] [CrossRef]
  14. Kaminskii, A.A.; Ueda, K.; Eichler, H.J.; Kuwano, Y.; Kouta, H.; Bagaev, S.N.; Chyba, T.H.; Barnes, J.C.; Gad, G.M.A.; Murai, T.; et al. Tetragonal vanadates YVO4 and GdVO4—New efficient χ(3)—Materials for Raman lasers. Opt. Commun. 2001, 194, 201–206. [Google Scholar] [CrossRef]
  15. Chen, Y.F. Compact efficient all-solid-state eye-safe laser with self-frequency Raman conversion in a Nd:YVO4 crystal. Opt. Lett. 2004, 29, 2172–2174. [Google Scholar] [CrossRef] [PubMed]
  16. Hammond, R.B.; Orley, M.J.; Roberts, K.J.; Jackson, R.A.; Quayle, M.J. An examination of the influence of divalent cationic dopants on the bulk and surface properties of Ba(NO3)2 associated with crystallization. Cryst. Growth Des. 2009, 9, 2588–2594. [Google Scholar] [CrossRef]
  17. Yu, H.H.; Hu, D.W.; Zhang, H.J.; Wang, Z.P.; Ge, W.W.; Xu, X.G.; Wang, J.Y.; Shao, Z.S.; Jiang, M.H. Picosecond stimulated Raman scattering of BaWO4 crystal. Opt. Laser Technol. 2007, 39, 1239–1242. [Google Scholar] [CrossRef]
  18. Liu, Y.Q.; Zhang, F.; Wang, Z.P.; Yu, F.P.; Wei, L.; Xu, X.G.; Zhao, X. Ca3(BO3)2, a first wide waveband borate Raman laser crystal with strong Raman effects and outstanding anti-optical damage ability. J. Mater. Chem. C 2015, 3, 10687–10694. [Google Scholar] [CrossRef]
  19. Porto, S.P.S.; Scott, J.F. Raman spectra of CaWO4, SrWO4 CaMoO4 and SrMoO4. Phys. Rev. 1967, 157, 716–719. [Google Scholar] [CrossRef]
  20. Černýa, P.; Zverevb, P.G.; Jelı́nkováa, H.; Basievb, T.T. Efficient Raman shifting of picosecond pulses using BaWO4 crystal. Opt. Comm. 2000, 177, 397–404. [Google Scholar] [CrossRef]
  21. Basiev, T.T.; Sobol, A.A.; Voronko, Y.K.; Zverev, P.G. Spontaneous Raman spectroscopy of tungstate and molybdate crystals for Raman lasers. Opt. Mater. 2000, 15, 205–216. [Google Scholar] [CrossRef]
  22. Goldschmidt, V. M. Die Gesetze der Krystallochemie. Naturwissenschaften 1926, 14, 477–485. [Google Scholar] [CrossRef]
  23. Shannon, R.D. Revised effective ionic radii and systematic studies of interatomic distances in halides and chalcogenides. Acta. Cryst. 1976, A32, 751–767. [Google Scholar] [CrossRef]
  24. Wang, H.Y.; Jia, G.H.; Wang, Y.; You, Z.Y.; Li, J.F.; Zhu, Z.J.; Yang, F.G.; Wei, Y.P.; Tu, C.Y. Crystal growth and spectral properties of pure and Co2+-doped Mg3B2O6 crystal. Opt. Mater. 2007, 29, 1635–1639. [Google Scholar] [CrossRef]
  25. Richter, L.; Muller, F. Zur Struktur von Sr3B2O6. Z. Anorg. Allg. Chem. 1980, 467, 123–125. [Google Scholar] [CrossRef]
  26. International Centre of Diffraction Data (ICDD). PCPDF 31–1343. Available online: http://www.icdd.com (accessed on 10 March 2017).
  27. International Centre of Diffraction Data (ICDD). PCPDF 38–1475. Available online: http://www.icdd.com (accessed on 10 March 2017).
  28. Segall, M.; Lindan, P.; Probert, M.; Pickard, C.; Hasnip, P.; Clark, S.; Payne, M. First-principles simulation: ideas, illustrations and the CASTEP code. J. Phys. Condens. Matter 2002, 14, 2717–2744. [Google Scholar] [CrossRef]
  29. Perdew, J.P.; Burke, K.; Ernzerhof, M. Generalized gradient approximation made simple. Phys. Rev. Lett. 1996, 77, 3865–3868. [Google Scholar] [CrossRef] [PubMed]
  30. Vanderbilt, D. Soft self-consistent pseudopotentials in a generalized eigenvalue formalism. Phys. Rev. B 1990, 41, 7892–7895. [Google Scholar] [CrossRef]
  31. Fletcher, J.G.; Glasser, F.P. Phase relations in the system CaO-B2O3-SiO2. J. Mater. Sci. 1993, 28, 2677–2686. [Google Scholar] [CrossRef]
  32. Barseghyan, A.H.; Hovhannisyan, R.M.; Petrosyan, B.V.; Aleksanyan, H.A.; Toroyan, V.P. Glass formation and crystalline phases in the ternary systems CaO-Bi2O3-B2O3 and SrO-Bi2O3-B2O3. Phys. Chem. Glasses 2013, 54, 199–205. [Google Scholar]
  33. Liang, G.; Tang, Z.; Fang, H.; Katz, D.; Salama, K. Synthesis and X-ray diffraction pattern for MgCu2. J. Alloys Comp. 2006, 422, 73–77. [Google Scholar] [CrossRef]
  34. Piper, J.A.; Pask, H.M. Crystalline Raman Lasers. J. Sel. Top. Quant. 2007, 13, 692–704. [Google Scholar] [CrossRef]
  35. Pask, H.M. The design and operation of solid-state Raman lasers. Prog. Quant. Electron. 2003, 27, 3–56. [Google Scholar] [CrossRef]
Figure 1. Schematic of Sr3(BO3)2 crystal structure. (a) Main view; (b) c-axes view; (c) a-axes view; (d) b-axes view; (e) Sr-O octahedron and (f) [BO3]3− group.
Crystals 07 00125 g001
Figure 2. The theoretical Raman frequency shifts for Mg3(BO3)2, Ca3(BO3)2 and Sr3(BO3)2 crystals.
Crystals 07 00125 g002
Figure 3. The obtained Sr3(BO3)2 crystal pieces.
Crystals 07 00125 g003
Figure 4. TG-DTA curves of Sr3(BO3)2 crystal samples.
Crystals 07 00125 g004
Figure 5. XRPD patterns of Sr3(BO3)2 samples. (a) Polycrystalline sample and (b) single crystal sample.
Crystals 07 00125 g005
Figure 6. In situ high temperature XRPD results of Sr3(BO3)2 crystal (a) and the enlarged diffraction pattern ranged from 28° to 41° (b).
Crystals 07 00125 g006
Figure 7. Variation of cell parameters of Sr3(BO3)2 as a function of temperature.
Crystals 07 00125 g007
Figure 8. Powder Raman spectra of Sr3(BO3)2 crystals (a) and Ca3(BO3)2 crystals (b), the insets were the fitting curves of the strongest Raman peaks.
Crystals 07 00125 g008
Table 1. Part of cell parameters and interplanar spacing d values of Sr3(BO3)2 crystal under different temperatures.
T/°C11501200125013001350
a9.039889.045229.044699.03769.04985
b9.039889.045229.044699.03769.04985
c12.8774412.8770712.8244212.9377812.96449
V3911.35912.4908.56915.16919.54
d1133.362513.362413.348653.378273.38526
d3003.717393.717283.702073.734823.74254
d2203.942893.942793.926643.961373.96956

