
Modeling the Neutral-Ionic Transition with Correlated Electrons Coupled to Soft Lattices and Molecules


1
Institut Néel, CNRS and Grenoble Alpes University, F-38042 Grenoble, France
2
Department of Chemistry, Life Science and Environmental Sustainability, Università di Parma, 43100 Parma, Italy
3
Department of Chemistry, Princeton University, Princeton, NJ 08544, USA
*
Author to whom correspondence should be addressed.
Crystals 2017, 7(5), 144; https://doi.org/10.3390/cryst7050144
Submission received: 3 April 2017
/
Revised: 2 May 2017
/
Accepted: 7 May 2017
/
Published: 16 May 2017
(This article belongs to the Special Issue The Neutral–Ionic Phase Transition)
Abstract
:Neutral-ionic transitions (NITs) occur in organic charge-transfer (CT) crystals of planar -electron donors (D) and acceptors (A) that form mixed stacks ... D+ρA−ρD+ρA−ρD+ρA−ρ ... with variable ionicity and electron transfer t along the stack. The microscopic NIT model presented here combines a modified Hubbard model for strongly correlated electrons delocalized along the stack with Coulomb intermolecular interactions treated in mean field. It also accounts for linear coupling of electrons to a harmonic molecular vibration and to the Peierls phonon. This simple framework captures the observed complexity of NITs with continuous and discontinuous ρ on cooling or under pressure, together with the stack’s instability to dimerization. The interplay of charge, molecular and lattice degrees of freedom at NIT amplifies the nonlinearity of responses, accounts for the dielectric anomaly, and generates strongly anharmonic potential energy surfaces (PES). Dynamics on the ground state PES address vibrational spectra using time correlation functions. When extended to the excited state PES, the NIT model describes the early (<1 ps) dynamics of transient NIT induced by optical CT excitation with a fs pulse. Although phenomenological, the model parameters are broadly consistent with density functional calculations.
1. Foreword
The physics of strongly-correlated electron systems is characterized by a complex phenomenology that includes multiple competing phases, divergent responses, and anomalous metallic states [1]. In these materials the interplay between correlated electrons and phonons further enhances the complexity both in terms of the appearance of new phases and of amplification of materials responses. Mixed-stack charge-transfer (ms-CT) crystals offer an interesting opportunity to study strongly correlated electrons coupled to molecular vibrations and lattice modes. In these crystals, planar π-conjugated molecules with strong electron donor (D) and acceptor (A) character alternatively form face-to-face stacks. Electrons are delocalized along the stack, leading to fractional charge: ... D+ρA−ρD+ρA−ρD+ρA−ρ ... The most impressive demonstration of strong correlations in these systems is offered by the so-called neutral-ionic phase transition (NIT) [2], a transition from a valence insulator () to a Mott insulator (), that can be induced by temperature [3], pressure [4], or even light [5,6,7,8,9]. Both continuous and discontinuous NITs are known, and a precise control of chemical pressure drives the transition to very low temperatures, in the regime of quantum phase transitions [10,11,12].
NIT is always accompanied by lattice dimerization [2], eventually leading to ferroelectric behavior [13]. Large dielectric anomalies at NIT are due to the electronic charge fluxes induced by the dimerization mode [14,15]. Other evidence of the intimate entanglement of correlated electrons and phonons is found in several anomalies in infrared (IR) and Raman (R) spectra [2], and in an intense diffuse X-ray scattering signal [16].
Competing electronic ground states on a deformable lattice can result in the simultaneous stability of different phases. Multistability is a rare phenomenon in molecular materials that requires the precise balance between strong and competing interactions [17,18]. Multistability in the close proximity of the discontinuous pressure-induced NIT of TTF-CA has been experimentally observed [19] and extensively discussed in Ref. [20]. Light absorption in multistable systems can populate metastable states, that may be hidden to conventional investigation tools [21], in the so-called photoinduced NIT (PINIT) [5,6,7,8,9]. The possibility to switch a neutral crystal into an ionic ferroelectric metastable state by light absorption is intriguing both from a fundamental perspective and in view of innovative applications.
Ground state properties, including not just charge distribution and lattice structure [20,22], but also other specific and experimentally accessible quantities, like vibrational spectra [23], diffuse X-ray scattering data [16], the dielectric anomaly [14,15], have been satisfactorily described in recent years based on a modified Hubbard model accounting for the inequivalence of lattice sites, and introducing the coupling to a molecular vibration, modulating on-site energies, and to a lattice mode, modulating hopping integrals. The same model, extended to describe the first electronic excited state, captures the basic physics driving the early time dynamics following impulsive excitation at the PINIT [24].
This feature article has several objectives. One is to collect NIT results from papers over many years, and to present in a single, coherent picture our best current modeling of ms-CT stacks. We hope that this article will be a useful entry to newcomers to the field. The NIT literature is covered in depth in the companion articles of this issue. Specifically, the contribution from Masino et al. [25] discusses the vibrational spectroscopy and experimental characterization of NIT in ms-CT crystals. There is considerable interest nowadays in strongly correlated electronic systems, in low-dimensional systems, in frustrated interactions and quantum phases, in nonlinear responses and in electron-vibration coupling. The physics of NIT systems such as ms-CT crystals overlaps these topics and illustrates them.
2. Microscopic Models for NIT
2.1. An Introductory Model: The Mulliken dimer
The Mulliken dimer illustrates CT in a simple two-level system. The neutral state describes an electron donor D and acceptor A molecule, both with closed shells. When an electron is transferred from D to A, the open shell system can be in a singlet or triplet state. Only the singlet ionic state is mixed with the neutral state by , where t is the hopping integral between D and A. The energy difference between the ionic (I) and the neutral (N) states, is a model parameter accounting for the ionization potential of D (), the electron affinity of A () and the Coulomb interaction V between the ions D+ and A−. The ground state is:
Accordingly, the ground state may be described as with measuring the amount of CT. The ionicity is fully defined by the dimensionless parameter :
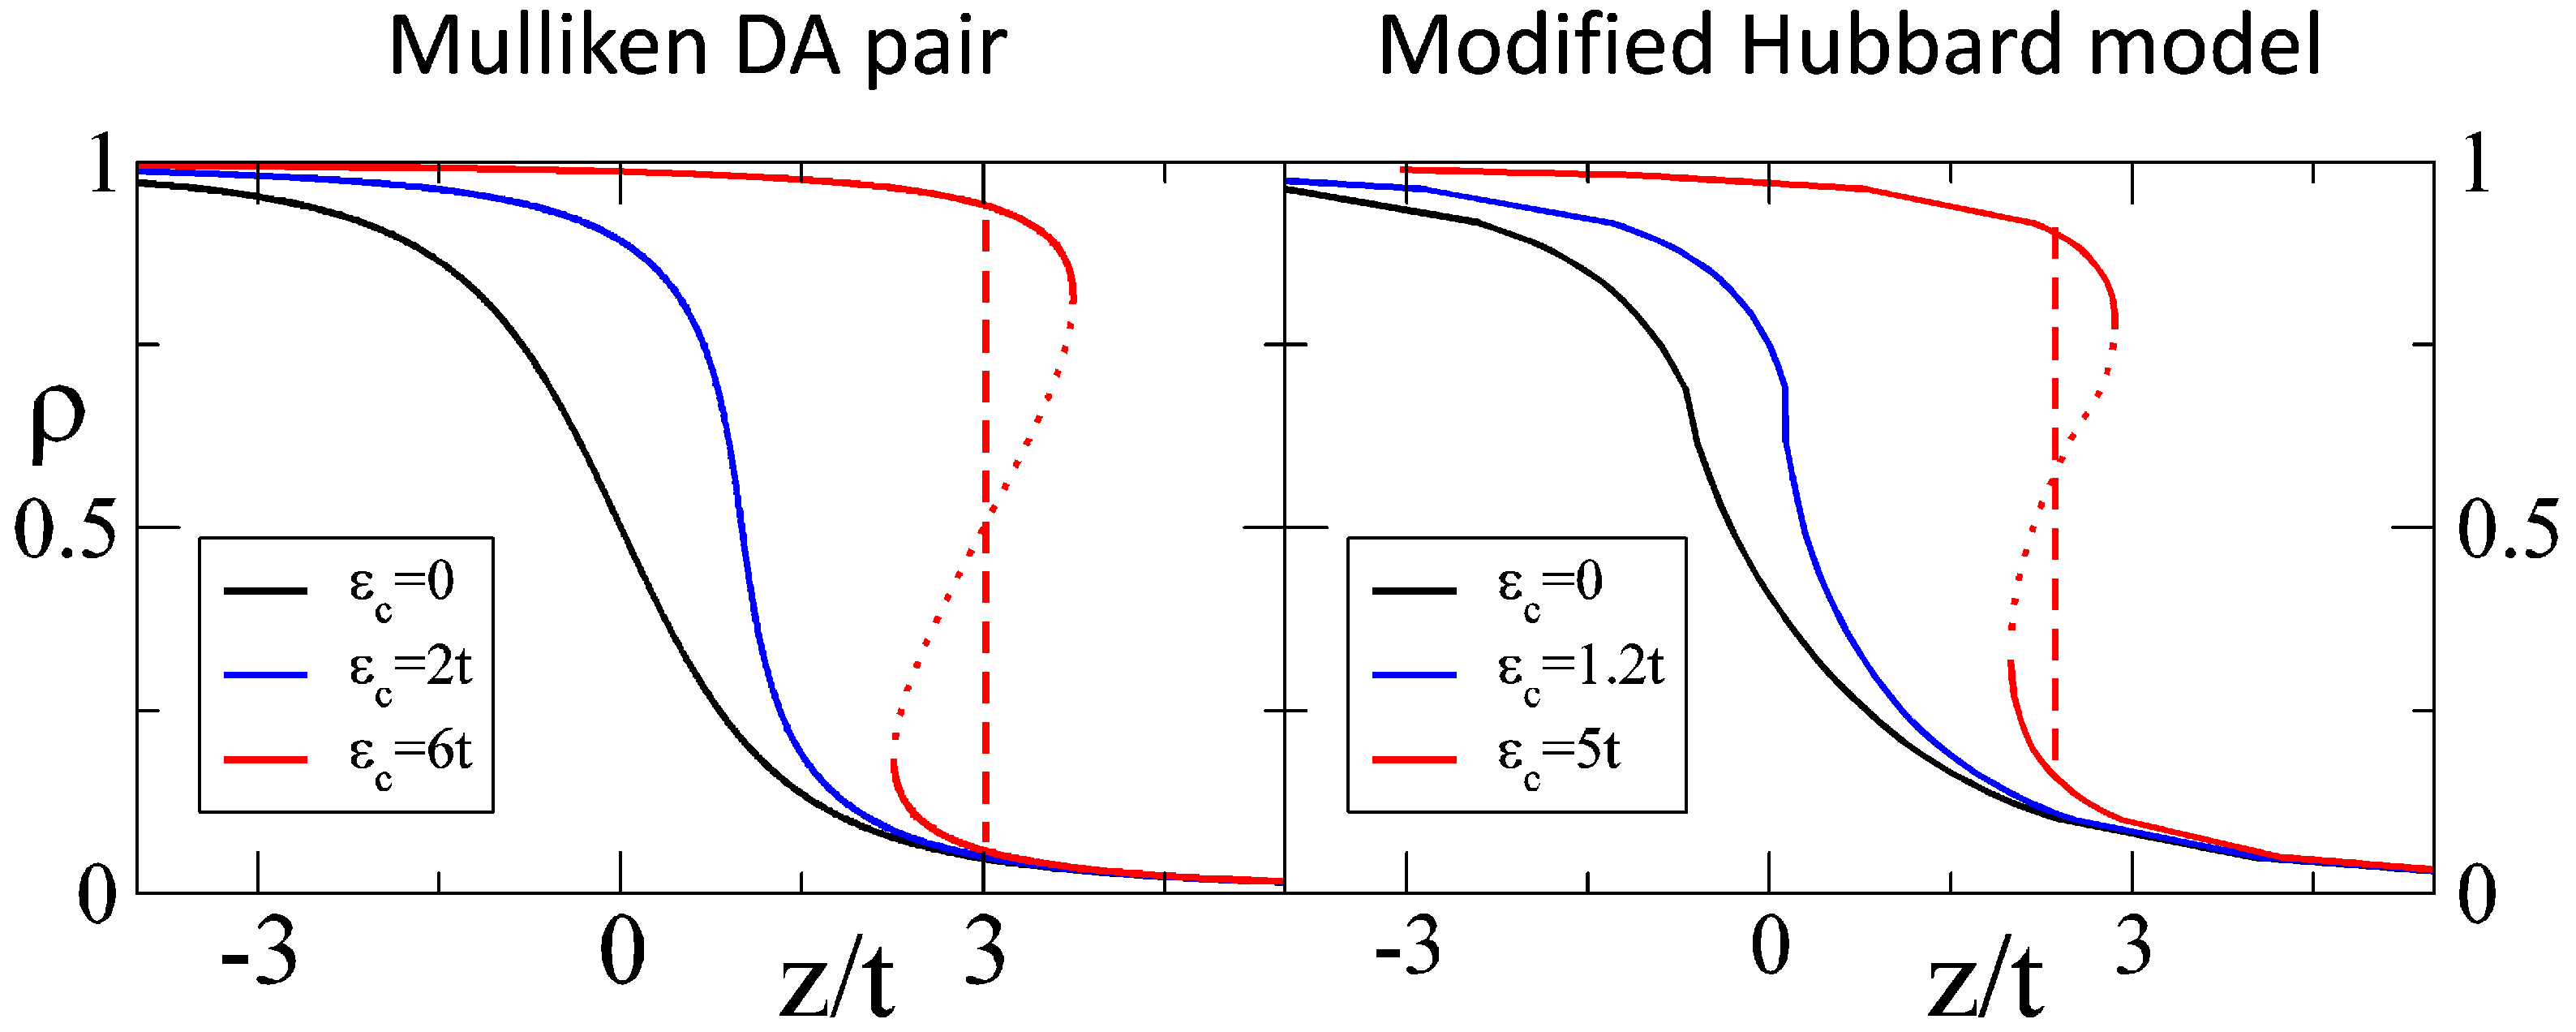
The left panel of Figure 1 shows : as expected, for . The ground state is neutral with for and becomes ionic, , for negative z.
As an instructive toy model of NIT, first introduced in Ref. [26], we consider a crystal with one DA dimer per unit cell and electrostatic (Coulomb) interactions between dimers. Delocalization (t) within the dimer favors 0.5 while attractive Coulomb interactions are maximized at 1. Competing interactions are a recurrent theme in the context of NIT. In a mean field approach we can reduce the problem of interacting dimers to that of an isolated dimer in the electrostatic potential of the surrounding dimers, each with the average ionicity . The mean field Hamiltonian for an embedded dimer is the same as for an isolated dimer. The parameter z for electron transfer in an isolated pair is simply renormalized to , where and is the Madelung (electrostatic) energy of the fully ionized lattice. Positive values of correspond to attractive interactions, favoring charge separation. The self-consistent problem can be easily solved extracting from the universal a new curve for each value, where , as shown in the left panel of Figure 1 for a few values.
For increasing attractive electrostatic interactions, the curves in Figure 1 become steeper and steeper until becomes a multivalued, S shaped curve for . Much as in the gas-liquid transition (van der Waals equation), the NIT of non-overlapping DA dimers becomes first order (discontinuous) beyond the critical point . In this case, the system presents two stable solutions up to the spinodals and the region of the curve with positive slope corresponds to unstable, thermodynamically forbidden solutions. The Maxwell construction excludes the unphysical region by drawing a vertical line crossing the curve at , discriminating between the thermodynamically stable phase and metastable solutions.
The mean field treatment of a crystal of Mulliken dimers captures a central feature of NIT, the possibility of continuous or discontinuous depending on . In this respect the electronic properties of ms-CT stacks mainly require a numerical analysis of the dependence of on model parameters. On the other hand, DA dimers or dimer approximations to ms-CT stacks do not have inversion symmetry at D and A sites, which is a crucial property for the dimerization instability and for the spectroscopy of ms-CT crystals.
2.2. The Modified Hubbard Model
The modified Hubbard Model (MHM) is a 1D generalization of the Mulliken dimer, although its actual origin was a limiting case of the Hubbard model with site energies at A and D sites, and two electrons per DA pair (half-filling) [27]. Hence we consider a linear chain of equally-spaced molecules (regular stack, as opposed to dimerized stacks that will be introduced in Section 2.4) with intermolecular hopping t and Hubbard on-site repulsion U. The Hamiltonian reads:
where H.c. is Hermitian conjugate, i runs on the N sites of the stack, and are the annihilation and creation operators for an electron with spin on site i, counts the electrons with spin on site i. The computational effort needed to attack the problem can be reduced by adopting the so-called reduced basis with three rather than four states per site on excluding high-energy doubly ionized sites, D2+ or A2− [28,29]. The reduced basis approximation corresponds to letting U and go to infinity while maintaining a finite difference between the ionization potential of D and the electron affinity of A. The modified Hubbard Hamiltonian in the reduced basis reads:
Two remarks are in order here: first, Hamiltonian 4 apparently contains only one-electron terms but it actually accounts exactly for strong correlations, according to the limit. In this limit, D sites (odd i) can only have = 1 or 2, the A sites (even i) have = 0 or 1. Second, the reduced-basis leads to fewer model parameters, allowing to explore the phase diagram of ms-CT salts as function of the ratio, while preserving the rich physics of electronic correlations.
The fully neutral state , obtained for , is a singlet state with a pair of electrons residing on the HOMO of D, the LUMO of A being empty. The fully ionic state () is vastly more complicated due to the twofold spin-degeneracy of radical ions. There are even more states containing both neutral molecules and radical ions. An analytical solution is of course not possible, but valence bond methods [30] can be used to get the numerically exact ground state for finite site systems up to ∼20 sites. Figure 2 illustrates finite size effects on the ionicity
where the operators measure the absolute value of the charge on D (, odd j) and A (, even j) sites. The curves in Figure 2 are calculated for linear chains with periodic boundary conditions and increasing number of sites from 6 to 16. Systems with and sites converge to the same limit from opposite directions [31], setting narrow uncertainties on the extrapolation of . Apart from a small region at intermediate ionicity, 14 and 16 sites results are superimposed in the scale of the figure. The black curve that represents our best estimate of the infinite chain is just the average of and 16 results.
We underline that chains have discontinuous at the point where the ground state wavefunction changes from symmetric to antisymmetric with respect to the inversion center at each molecular site of the regular chain. chains do not show any symmetry crossover nor discontinuity. Indeed the discontinuity is washed out in the thermodynamic limit. A remnant of the discontinuity remains in the slope variation of the curve, that points to a crossover that moves away from of the dimer towards at . At this critical point there is a vanishing gap between symmetric and antisymmetric states with respect to inversion symmetry and the gap stays closed in the I regime of the extended stack [31,32].
Additional important information on the nature of the ground state can be gained thanks to the modern theory of polarization of extended systems as proposed by Resta [33]. The complex quantity
is central to Resta’s approach, with representing the ground state wavefunction, i the imaginary unit and the dipole moment operator of the regular open-boundary chain. Equation (6) allows the definition of the electric polarization, which is proportional to the phase of Z and vanishes by symmetry in regular stacks. The polarizability in systems with periodic boundary conditions is discussed in Section 2.6. Figure 2b shows the polarizability calculated for systems of increasing size and periodic boundary condition. A very sharp peak in the polarizability is observed at the crossover point, marking the presence of delocalized charges. To better understand the nature of the very special crossover point, panel c in the same figure shows the absolute value of Z. As discussed by Resta and Sorella [34], the inverse of measures the wavefunction delocalization, so that a vanishing corresponds to a metallic state of the extended system. Data in Figure 2 clearly point to a metallic state at the critical point at .
The critical point is associated with the charge degrees of freedom of the MHM and has major consequences for NIT. The MHM also has a magnetic critical point due to spin degrees of freedom [35], a feature that was not recognized previously. The infinite chain is diamagnetic with a finite energy gap between the singlet ground state and the lowest triplet state for . The singlet-triplet gap is zero for , and the infinite chain is paramagnetic with finite magnetic susceptibility at 0 K. Quantum phase transitions related to the opening of a singlet-triplet gap have been extensively treated theoretically in spin-1/2 chains with frustrated exchange interactions [36,37,38] and in half-filled extended Hubbard models [39,40,41]. The magnetic critical point has no role so far in NIT models, mainly due to structural instabilities that are discussed below.
2.3. Electrostatic Interactions
Since NIT is induced by intermolecular interactions that change due to volume variations upon cooling or under pressure, several extensions of the MHM are called for. The first is to introduce intermolecular Coulomb interactions and supplement Hamiltonian (4) with:
where indices run on all sites of the 3D crystal and measures the electrostatic interaction between fully charged sites at . Attacking a problem of correlated electrons in 3D is a formidable task, so that simplified approaches are needed. As originally proposed by Soos and Mazumdar [29] and extensively validated by Painelli and Girlando [22], electrostatic intermolecular interactions can be dealt within the mean field approximation. As shown above for a crystal of Mulliken dimers, this reduces the 3D problem to an effective 1D problem. Indeed, as for intermolecular electrostatic interactions, we view the 1D stack as an array of DA dimers. For each dimer, measures the energy required to transfer an electron from D to A. All other intermolecular electrostatic interactions within the stack and all interstack interactions are treated in the mean field approximation, leading to the following Hamiltonian [20]:
where the effective on-site energy alternation self-consistently depends on the ionicity through a Coulomb correlation strength defined by , where measures the Madelung energy of a 3D lattice of D+ and A− ions.
We can now follow a similar strategy as described in Section 2.1 for the analytical DA dimer: the curve extrapolated for the infinite chain coincides with the universal curve relevant to the mean field Hamiltonian. From this curve, it is possible to extract, for each value, the relevant to get the . The curve shown in the right panel of Figure 1 becomes steeper and steeper with increasing , and for larger than a critical value, estimated as 1.8t, it becomes S-shaped, with a region of positive slope corresponding to unstable states. In other terms, electrostatic intermolecular interactions and, as we will see in the following, the on-site vibrational coupling cooperate towards bistability in ms-CT crystals, making states of intermediate ionicity unattainable, and opening a bistability window where both quasi-neutral and quasi-ionic states are accessible.
The optical CT transition is the lowest electronic excitation of ms-CT crystals in the N phase, experimentally located around eV and polarized along the stack axis. The Mulliken dimer has at , while the MHM has at . The optical gap opens up again in the I lattice leading to an almost symmetrical behavior across the critical [42]. The critical point, characterized by a vanishing charge gap, is however never attained experimentally, not even in case of a smooth behavior: as it will be discussed below, soft lattices always dimerize before reaching the critical point.
2.4. Dimerization Instability of the Soft Lattice
The Peierls instability of 1D systems has been extensively discussed in connection with polyacetylene, (CH)x [43], as has the spin-Peierls instability of chains with exchange interactions between sites with spins [44,45]. Most NIT systems, including the best characterized ones, have planar D and A molecules and molecular ions with high symmetry (typically ). Molecular inversion centers are retained in crystals with regular stacks, but are lost upon lattice dimerization. Since the ionic side has radical ions, a generalized Peierls transition is expected and found in ionic chains.
The Peierls mode , describing the relative shift of D and A sublattices, is the only lattice mode we consider. At variance with (CH)x, this optical mode is located at the Brillouin zone center in mixed stacks with two molecules, D and A, in the unit cell. This has important implications for vibrational spectroscopy. Following the Su-Schrieffer-Heeger model for (CH)x [46], we allow the molecular sites to displace around the equilibrium position of the regular stack and retain only the linear term in the Taylor expansion of t with intermolecular distance. Accordingly, a new term enters the Hamiltonian with
where the lattice relaxation energy measures the strength of the electron-phonon coupling and the last term accounts for a purely harmonic potential for lattice vibrations. We work in the adiabatic (Born-Oppenheimer) approximation to neglect the kinetic energy of the lattice mode.
The ground-state wavefunction of regular rings belongs to the antisymmetric subspace with respect to inversion, whereas rings have a symmetric ground state: this suggests that in the thermodynamic limit a vanishing gap has to be found between the two subspaces. As it was recognized in the early days of NIT, this leads to an unconditional instability of the ionic regular stack towards dimerization [31,47,48,49,50]. The resulting instability is often called a spin-Peierls instability, but a generalized Peierls instability is more appropriate. TTF-BA and M2P-TCNQF4 have highly ionic ( 0.9) regular ms-CT stacks at ambient temperature and dimerize at K [51,52] and 122 K, [53,54] respectively. The charge degrees of freedom participate to a small extent [55]. The magnetic susceptibility in either case indicates a substantial thermal population of excited states that drives the transition. Generalized Peierls transitions typically have variable intermediate in systems with large singlet-triplet gap and weak paramagnetism even at room temperature [55].
Mixed stack CT crystals show a rich physics governed by the interplay of the charge-instability, as driven by electrostatic interactions, and the generalized Peierls instability. Some considerations are in order about the nature of possible transitions in experimental systems. Starting from the neutral side and a regular stack at ambient conditions, decreasing temperature or increasing pressure leads to lattice compression and hence to an increased electrostatic energy and ionicity. Systems with t small with respect to will be driven towards a discontinuous phase transition with an abrupt ionicity increase. Since the I-phase is unconditionally unstable towards dimerization at 0 K, if the transition temperature is sufficiently low, we expect a discontinuous jump from a neutral regular phase to an I-dimerized phase, as observed in TTF-CA and TTF-BrCl3Q (see the companion paper [25]). A continuous NIT is expected in systems with a larger . Upon lattice compression, a soft regular stack with small ρ will dimerize in a continuous transition before reaching the metallic point. The ionicity may increase after the transition, possibly driving the system towards large ρ, but without any additional phase transition. This is the behavior observed for DMTTF-CA and DMeTTF-2,5Br2Cl2Q [25]. Below we will discuss in some detail TTF-CA and DMTTF-CA as prototypical examples of discontinuous and continuous NIT.
2.5. Soft Molecules and the Complete NIT Model
The molecular sites have internal degrees of freedom related to molecular vibrations. Totally-symmetric modes in the molecular point group modulate on-site energies, and then couple to delocalized electrons (e-mv or Holstein coupling). Again we account for a single vibration of either D or A, and introduce the corresponding Brillouin zone-center mode q that describes the in-phase oscillations of all D (or of all A) molecules. The coordinate q linearly modulates the difference of site energy between D and A sites and is the final ingredient of the microscopic NIT model. For the sake of clarity and for future reference we write here the full Hamiltonian:
The last term accounts for the harmonic elastic energy related to q, with measuring the small-polaron binding energy. In other contexts, this energy is also called the Franck-Condon relaxation energy, and, divided by the vibrational frequency, it corresponds to the Huang-Rhys factor.
As illustrated in the next sections, the above Hamiltonian represents the most general model that we will discuss. It can be numerically diagonalized for finite systems with different and q values to obtain the potential energy surface, as discussed in Section 3. However the problem is numerically tractable only for 1D chains, while intermolecular electrostatic interactions, the last term in the first line of Equation (10), lead to a 3D problem. In this respect, the mean field approximation, discussed above, is very useful, as it reduces the 3D problem to an effective 1D problem with renormalized on-site energies (cf Equation (8)).
Before closing this section, we illustrate a simple approach to e-mv coupling to elucidate its role on the nature of NIT. In line with the adiabatic approximation, we may write the electronic Hamiltonian substituting q in the above expression with its equilibrium value: . If we consider a regular chain, , the electronic Hamiltonian in the mean field approximation can be written exactly as in Equation (8) but with . Apart from a rigid shift of the effective z parameter by , the most important result here is that e-mv coupling adds to electrostatic interactions in favoring discontinuous NIT.
2.6. Polarization and Polarizability of the Modified Hubbard Model
Polarization and polarizability play a central role in the phenomenology of ms-CT crystals as these are key quantities for the dielectric anomaly at NIT, vibrational spectra and the ferroelectric polarization in dimerized phases. We recall here some general results on the dielectric properties of the MHM that will be useful in the following.
The modern theory of polarization in solids [33,56,57,58] provides a rigorous definition of the electrical polarization in terms of a Berry phase, overcoming the very fundamental issues arising from the ill-defined dipole moment operator in a system with periodic boundary conditions. The electronic polarization of a many-body quantum system is defined as [59]
where the quantity Z and the dipole operator of an open-boundary 1D chain have been introduced in Equation (6). is expressed in units of per site, being e the elementary charge and a the lattice constant. It is worth noticing that , being related to the phase of the wavefunction and not to its amplitude, is defined modulo one in current units, the so-called polarization quantum. Indeed only the variations of are physically meaningful, and in the following we will be concerned with its derivatives with respect to vibrational coordinates, related to IR absorption intensity of molecular and lattice modes. We will also discuss derivatives with respect to an applied electric field, i.e., the polarizability, as well as the difference, corresponding to the spontaneous polarization of a dimerized stack.
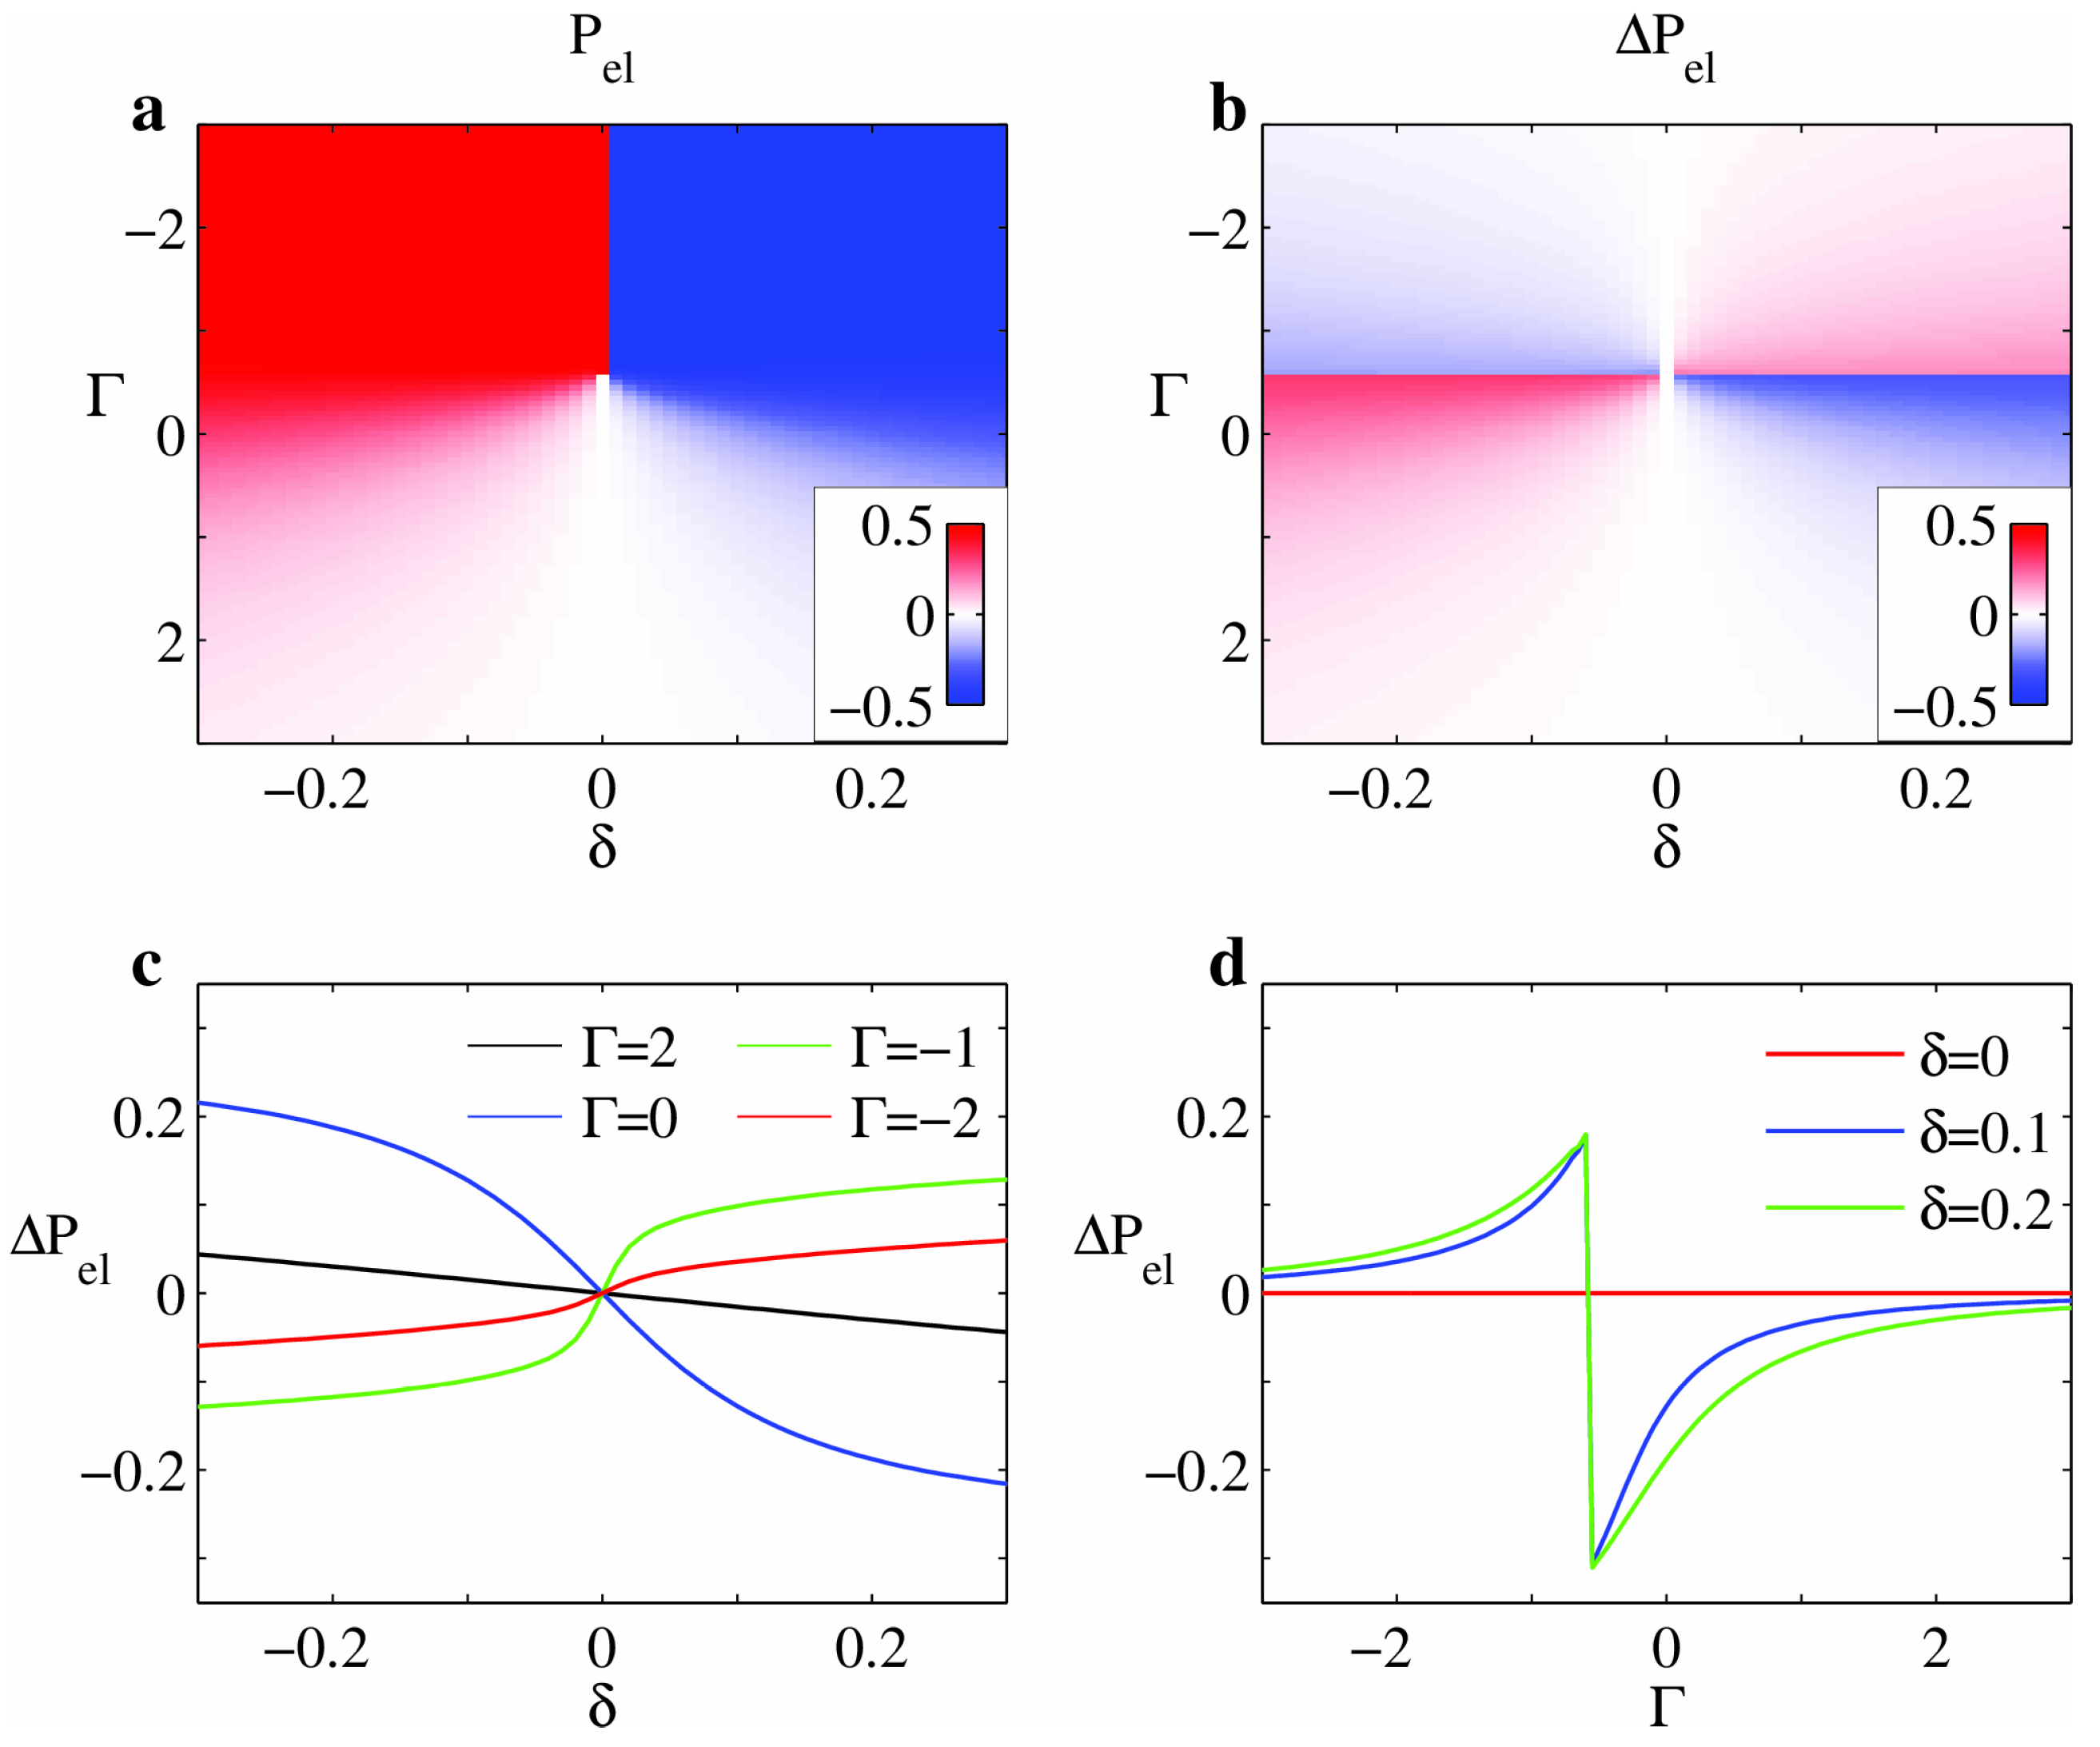
To illustrate the dielectric properties of the MHM we step back to a minimal NIT Hamiltonian (see Equations (4) and (9)) that only depends on the two parameters and , with setting the energy scale. can implicitly accounts for the effect of electrostatic interactions and intramolecular vibrations, as discussed in Section 2.3 and Section 2.5. Figure 3 shows , calculated with Equation (11), and the difference, computed for every fixed value of , in panels a and b, respectively. In the regular stack has a discontinuity from 0 (N phase) to 0.5 (I phase) at . and are therefore equivalent only in the N system, while the discontinuity in across for is only apparent as it exactly amounts to one quantum of polarization.
, the physically meaningful quantity, is an odd function of the dimerization that vanishes in the regular chain, as expected on the basis of elementary symmetry arguments.The magnitude of increases upon approaching the metallic N-I boundary (located at for the regular chain, see Figure 2). changes its sign around with a smooth and almost linear behavior far from NIT, while the variation becomes sharp with a marked sigmoid character close to the transition (see Figure 3c). The derivatives diverge at the NIT of the rigid chain conferring giant IR intensity to the Peierls mode [14,15]. Charge fluxes induced by the lattice distortion are amplified at the N-I crossover as a result of the enhanced electron delocalization and of the instability towards the formation of a bond charge density wave.
It is worth remarking that derivatives diverge with opposite sign on the N and I side, and undergoes a discontinuous change of sign at finite (see Figure 3d). These are the signatures of the different nature of the two insulating phases and the sign reversal of dynamical charges (electronic charge flow) has been discussed as a general consequence of strong electronic correlations in the Mott-insulator phase in systems of partial covalent-ionic character [34].
The definition of in Equation (11) does not take into account the physical dimerization of the lattice, i.e., the unequal molecular spacing. The definition of the open-chain dipole operator can be generalized to account for this effect, allowing the quantification of the total polarization that includes also a contribution from frozen charges at molecular ions in a dimerized lattice . It has been shown that this term is much smaller in magnitude than that of dynamical electron charges [15] and that and have opposite sign in the strongly-correlated I phase [34]. These theoretical results found an elegant confirmation in the experiment by Kobayashi et al., who showed the spontaneous polarization of the I-dimerized phase of TTF-CA points in the opposite direction and is ∼23 times larger in magnitude than what expected for frozen charge at the molecular sites of the dimerized stack [60]. TTF-CA represents a notable example of a colossal Born atomic charges of opposite sign with respect to the respective molecular valence.
Data in Figure 3 can be compared to the spontaneous polarization measured in the ferroelectric phases of TTF-CA [60] and TTF-BA [52]. The polar phase of TTF-CA is located in Figure 3b at and , which correspond to the experimental ionicity in the I phase, , and to the dimerization amplitude obtained from density functional theory calculations performed on the 40 K crystal structure (see Section 6) [61]. For these values, we obtain C/cm2 which compares well with the experimental value at 59 K of 6.3 μC/cm2 [60]. TTF-BA is an almost fully-I system with at all temperatures that dimerizes below K. For the crystal structure at 20 K we estimate , leading to C/cm2, a value that is in line with the experimental 0.2 μC/cm2 [52]. The relative magnitude of the polarization in TTF-CA and TTF-BA testify to the greater electron delocalization in the system undergoing NIT, where the lattice dimerization drives large charge flows.
The electronic polarizability is the first derivative of the polarization with respect to a uniform external electric field. Although a static electric field F is not compatible with periodic boundary conditions, Nunes and Gonze [62] showed how to combine P and F by introducing the energy of a polarized system as the functional
where is the Hamiltonian at and is the polarized wavefunction at finite field. The minimization of through a self consistent iterative scheme allows the calculation of that can be then used to compute the induced polarization via Equation (11) [15,58,62]. For the calculation of the linear susceptibility , it is sufficient to correct at the first order, obtained on iterating Equation (12) only once [15].
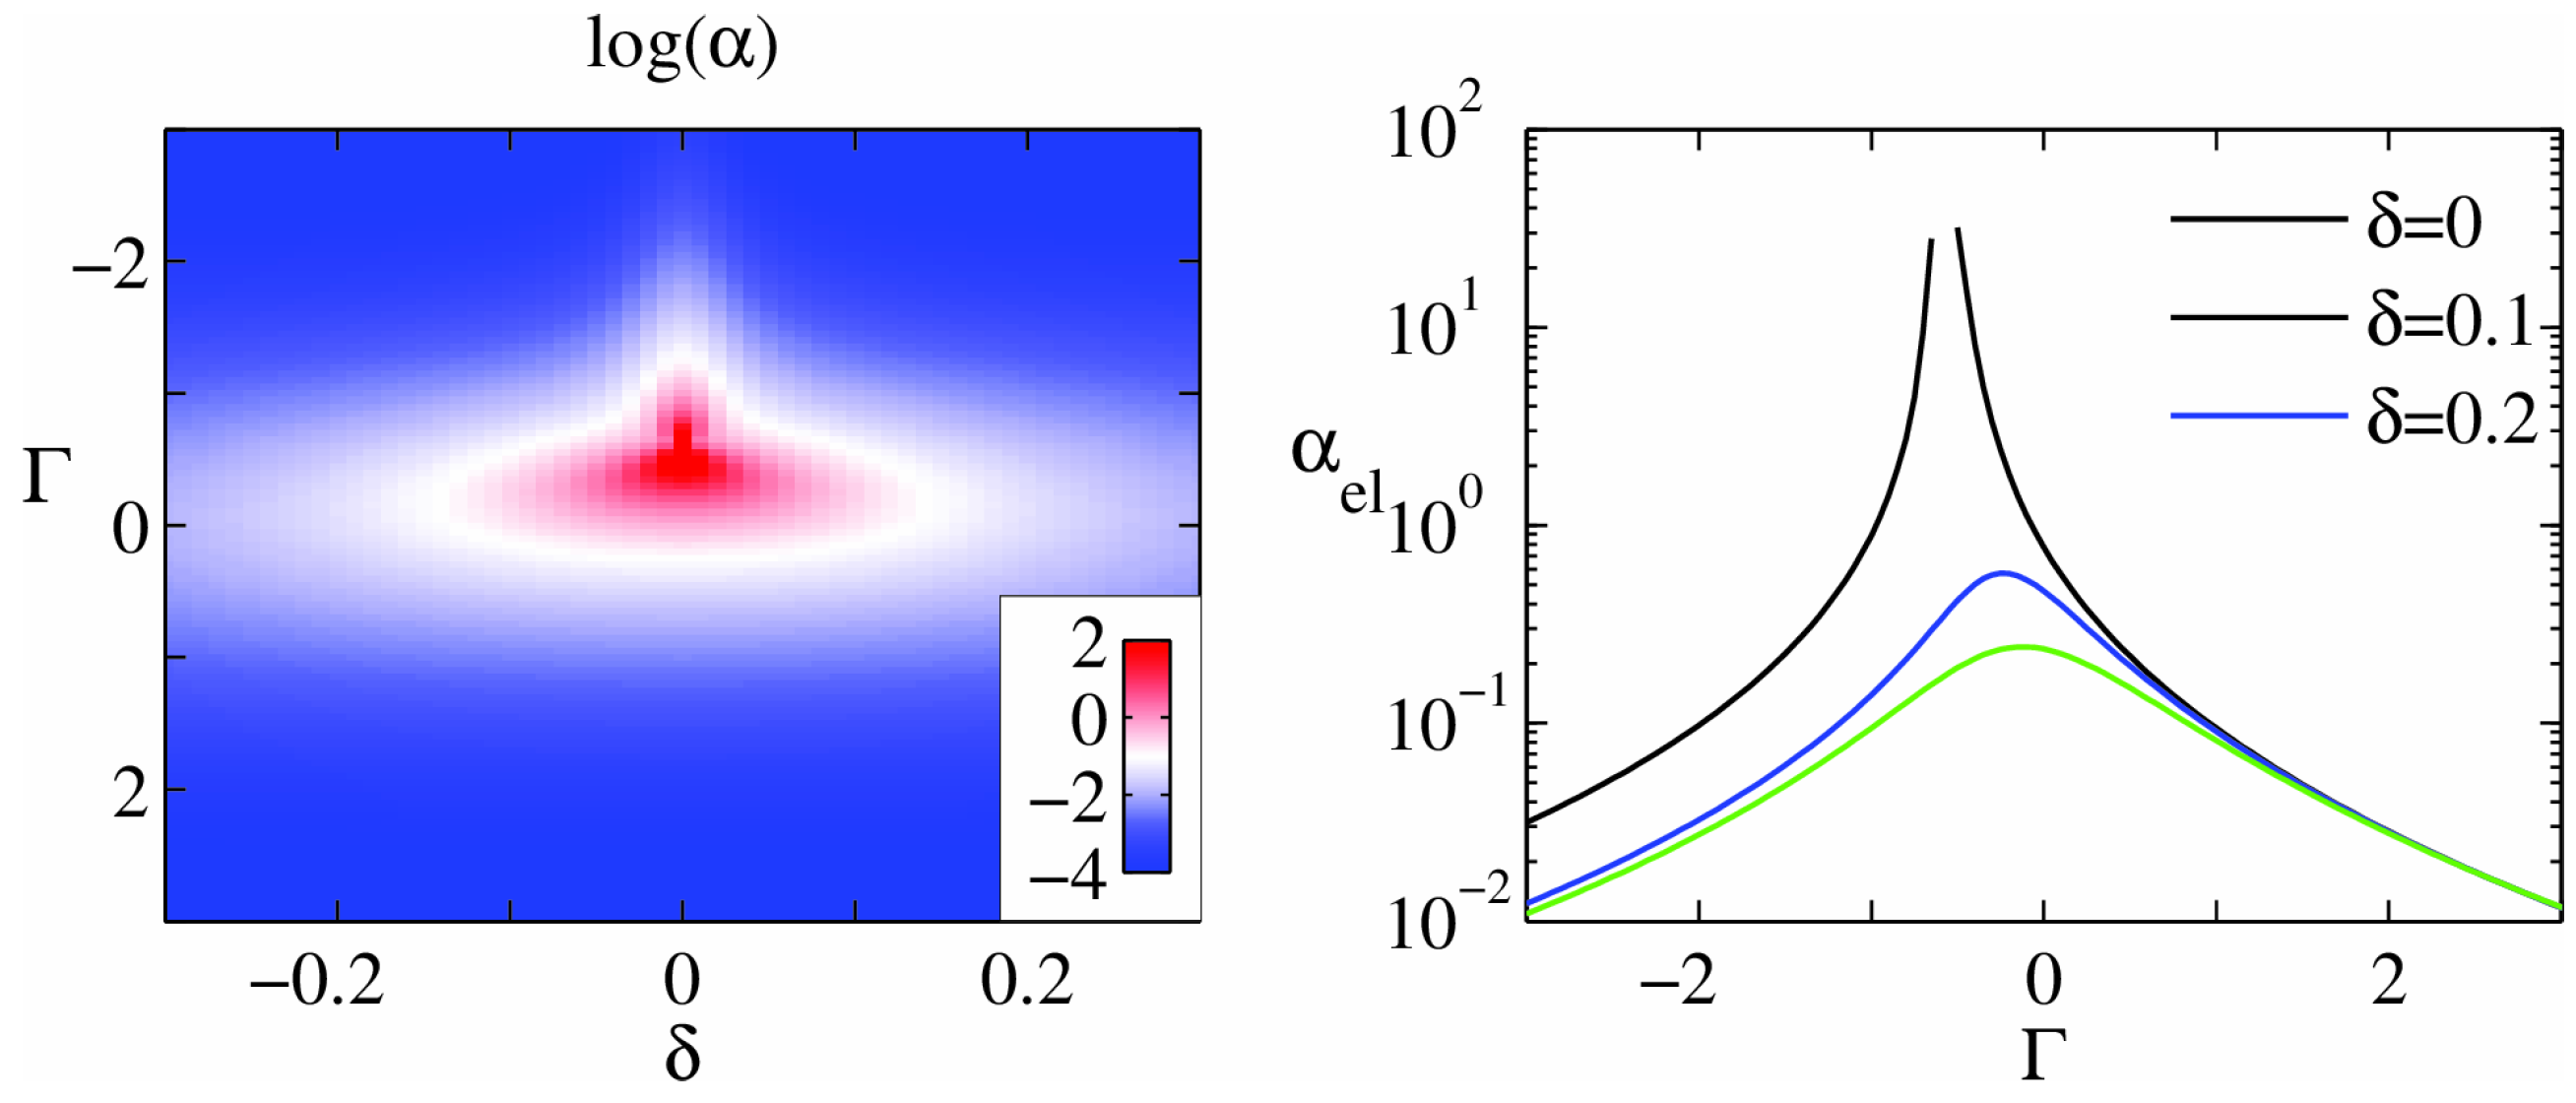
The electronic polarizability of the MHM, shown in Figure 4, diverges at the metallic N-I boundary of the infinite regular chain (notice the logarithmic scale; see also Figure 2b), signaling the vanishing charge gap and the enhanced electronic delocalization. The derivatives of over the vibrational coordinates give the cross section of non-resonant Raman scattering. Vibrational dynamics exploring this singularity are therefore expected to show nonlinear amplification of the Raman signal, as experimentally observed in DMTTF-CA [23] (see Section 4). The electronic polarizability also contributes to the large peak observed in the dielectric constant in close proximity of either continuous or discontinuous NIT [13,63]. However this contribution has been shown to be a marginal one in both continuous and discontinuous transitions, where dimerization shifts the system away from the unstable metallic point, largely suppressing (see Figure 4) [14,15]. To rationalize the dielectric anomaly observed at either continuous or discontinuous NIT, it is actually crucial to include the vibrational contribution, that is related to the IR intensity of the Peierls mode and to the electronic charge flux induced by the lattice distortion [14,15].
3. Potential Energy Surfaces
3.1. Discontinuous NITs
Now that the elements for the modeling of ms-CT crystals have been summarized, we are in the position to discuss the NIT on the basis of the complete model Hamiltonian in Equation (10), accounting for inter-site electrostatic interactions at the mean field level, and for the coupling to one effective intramolecular mode q and the Peierls lattice phonon . The following discussion will be centered around the adiabatic potential energy surface (PES) of the ground state . PESs bring important information on the competing valence and structural instabilities at NIT that result in either continuous or discontinuous transitions. We recall that molecular and lattice vibrations enter the Hamiltonian as strictly harmonic modes, and anticipate that coupling to electrons leads to strongly anharmonic PES, especially for model parameters close to NIT [20].
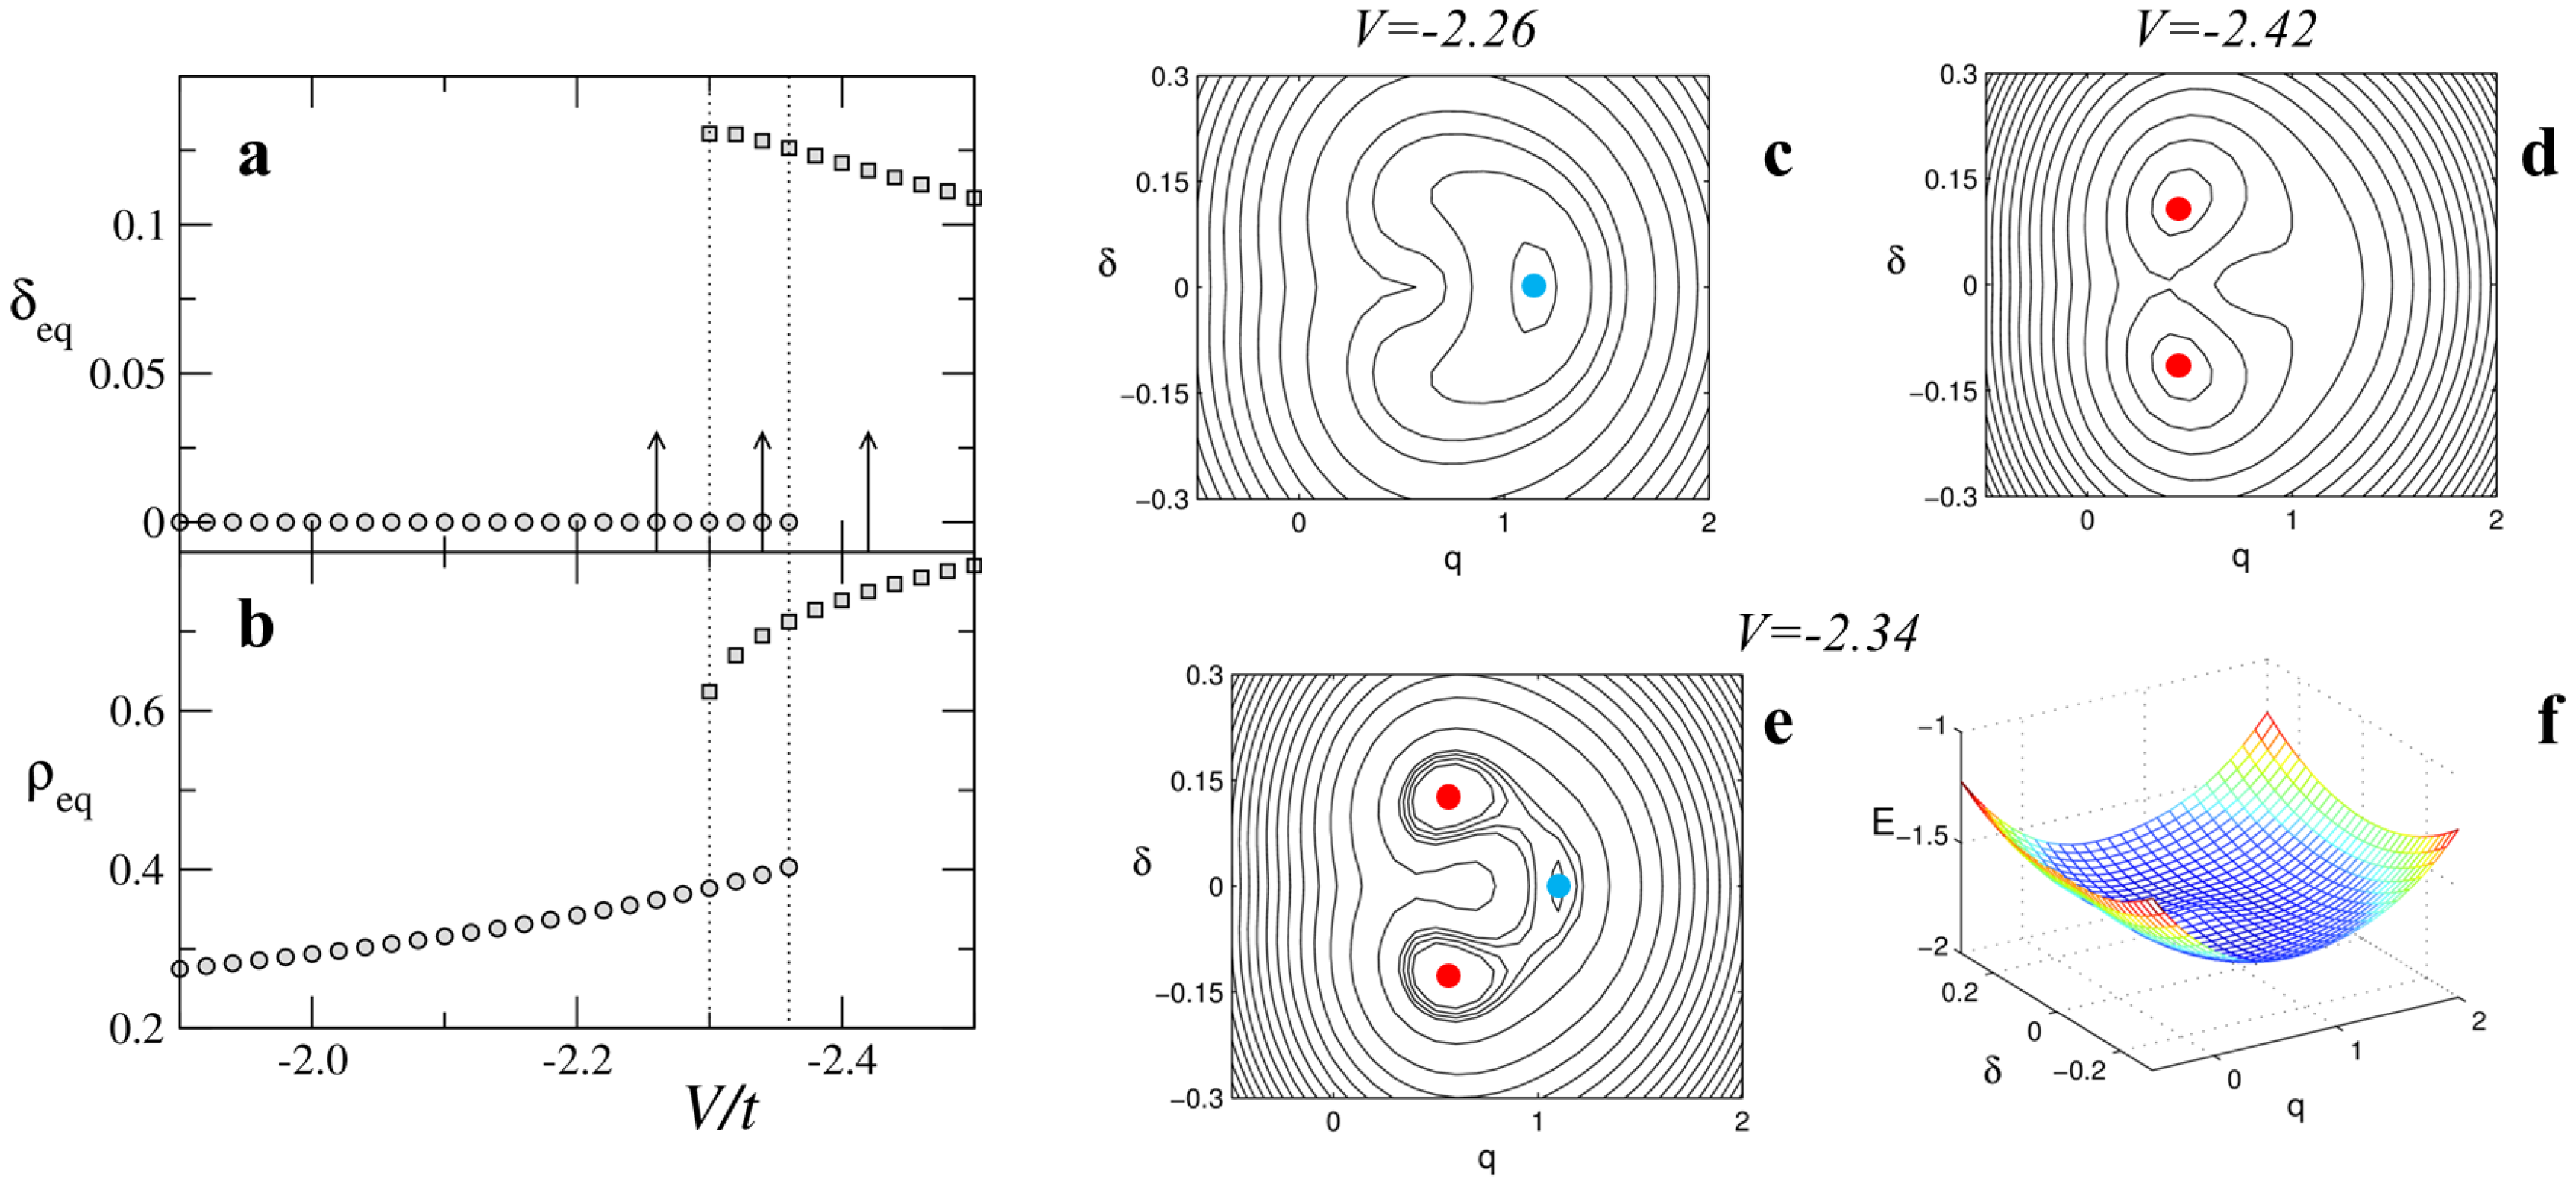
We begin with the discontinuous NIT, similar to that occurring with temperature in TTF-CA, that we induce by acting on electrostatic interactions by increasing V, mimicking the effect of lattice contraction. Reliable estimates of model parameters are known from previous studies [22,42,64]. The left panels of Figure 5 report the dimerization and ionicity , calculated at the equilibrium geometry of the system. The transition is clearly discontinuous: smoothly increases from ∼0.25 to ∼0.4 with increasing V and then abruptly jumps toward I values (). The stack remains regular () on the N side and dimerizes in the I regime ( 0.12). The dotted lines in Figure 5a,b mark the region of bistability close to the transition where two non-equivalent minima are found. Bistability is a typical feature of discontinuous transitions.
Left panels of Figure 5 show the ground state PESs calculated for three different V values marked by arrows in Figure 5a. Figure 5c (), corresponds to a N regular system, whose equilibrium is found at (blue circle). The PES in panel d () is instead characteristic of an I dimerized stack, which, unconditionally unstable to dimerization, presents two equivalent minima at finite (red circles), corresponding to I dimerized phases with opposite polarization. The PES of a system within the bistability region (), shown in Figure 5e,f, is instead characterized by three minima, corresponding to coexisting N-regular (blue circle) and I-dimerized (red circles) phases.
3.2. Continuous NIT
The features of NIT are strongly affected by slight changes in model parameters [20]. Figure 6 shows the results for a continuous transition, obtained for the same parameters as used in Figure 5, except for . Panels a and b of Figure 6 show that now dimerization occurs on the N side at , where a steep but continuous increase of the ionicity occurs. This behavior is similar to that of DMTTF-CA with temperature, where however the ionicity remains always lower than ∼0.45, while we calculate 0.7 at . This disagreement is not too surprising considering the simplicity of the model.
Figure 6c–f show the PESs across the continuous NIT, calculated for the V values marked by arrows in panel a. The PES in Figure 6c () corresponds to a N-regular system, with a single minimum at , while that in panel d () describes an I dimerized stack with . At variance with the discontinuous transition discussed above, in this case the PES smoothly evolves from a single minimum in the N phase to a double minimum in the I phase. The PES in Figure 6e,f, calculated for , represents a system just at the continuous N-I interface.
Continuous NITs such as that of DMTTF-CA are driven by the Peierls dimerization instability that develops through the softening of the Peierls mode, whose harmonic frequency goes to to zero at the critical point. The corresponding PES is flat along (at the equilibrium q) and is characterized by banana-shaped isolines (see Figure 6e) as a result of the mutual coupling between the lattice and the molecular mode mediated by electrons. The softening of the Peierls mode is only incipient in discontinuous NITs driven by the valence instability, as for instance in TTF-CA. In these cases a full softening is prevented by the sudden ionicity jump bringing the system to an I phase of finite dimerization (see Figure 5) [15,20].
4. Vibrational Spectra at the Continuous NIT of DMTTF-CA
Correlated and mobile electrons in soft lattices manifest in large anharmonicity and electronic charge flows driven by vibrational motion in ms-CT crystals undergoing NIT. It is, therefore, not surprising that the interpretation of vibrational spectra is rather complex but also that it offers detailed information about the entanglement of electronic and vibrational degrees of freedom. The theoretical modeling of vibrational spectra can follow different approaches. In the most common harmonic approximation, vibrational spectra are calculated from the electronic properties at the PES equilibrium positions. The harmonic frequency is indeed related to the PES curvature, while IR and Raman intensities are proportional to the square of the first derivatives with respect to relevant coordinates of the polarization and polarizability, respectively. While results based on the harmonic approximation provided key insight on the vibrational properties at NIT (e.g., the softening of the Peierls mode and its huge IR intensity [14,15]), the strongly anharmonic PESs in Figure 5 and Figure 6 suggest relaxing the harmonic approximation. In the following, we will rely on a time-correlation function (TCF) approach that makes use of the anharmonic PESs, the explicit dependence of and on vibrational coordinates (see Figure 3 and Figure 4), and finite temperature [23].
To this aim, we exploit the fluctuation-dissipation theorem of linear response theory to express optical spectra in terms of the Fourier transform of relevant time-correlation functions (TCFs). For IR absorption spectroscopy the imaginary (dissipative) part of the dielectric constant of the material is obtained from the Fourier transform of the TCF of the dielectric polarization [65]:
where ℏ is the reduced Planck constant, is the Boltzmann constant, is the vacuum permittivity, V is the volume. Similarly, the TCF of the polarizability is related to the intensity of the non-resonant Raman scattering [65]:
While Equations (13) and (14) are exact, resulting from a quantum mechanical treatment of the interaction between light and matter in the weak coupling regime, approximations are introduced in the calculation of TCFs. We adopt a semiclassical approach to TCFs, with the vibrational motion governed by classical equations of motion in the quantum mechanical potential obtained from the model Hamiltonian. The two effective vibrational coordinates q and , defined in Section 2.4 and Section 2.5, are considered and polarization and polarizability are evaluated along many classical trajectories to compute the respective correlation functions [23]. Since our electronic model is strictly 1D, the components of the electronic polarization and polarizability that are probed correspond to those along the stack axis (see Section 2.6). Equation (13) therefore targets the IR absorption for incident light polarized along , while Raman spectra calculated via Equation (14) correspond to those with both incident and scattered light along the same direction. Raman spectra in the molecular vibrations region are usually taken with incident and scattered light polarized perpendicular to the stack axis, probing instead the molecular polarizability. To simulate these spectra we approximate the molecular polarizability by a linear expansion on q.
We explicitly focus on the vibrational spectra across the continuous NIT of DMTTF-CA. To allow for a direct comparison with experimental spectra, the unperturbed harmonic frequencies of the Peierls and molecular modes are set to and , respectively, with coupling constants and . The small value of is due to the fact here we focus on a specific mode, namely the one responsible for the band observed at about 1450 in the room temperature Raman spectra of DMTTF-CA [66]. The contribution from other modes to the charge instability can be accounted for by increasing the strength of electrostatic interactions. The continuous NIT of DMTTF-CA is induced by increasing the electrostatic interaction V according to an empirical relationship derived by reproducing the evolution of vibrational spectra in the molecular vibrations region (see inset of Figure 7 and discussion below). Other details of the calculation can be found in the original paper [23].
Figure 7 shows the calculated IR (polarized parallel to the stack axis) and Raman (perpendicular polarization) spectra in the spectral region of molecular vibrations. The Raman spectra (black lines) are characterized by the softening of approximately 100 cm−1 of the totally symmetric molecular vibration band upon approaching NIT at K. In the N phase (see , K), the IR spectra (red lines) are characterized by the presence of the combination bands . Combination bands of appreciable intensity naturally result from the strong anharmonicity of the PES, which in turn arises from the coupling between vibrations and delocalized electron (see Section 3). Upon approaching the transition (see , K) combination bands broaden and, because of the softening of the Peierls mode, their spacing from the central Raman band at cm−1 is reduced. We observe that the hot band () is generally broader and more intense than the cold band (). For the PES is locally flat, and while the harmonic frequency of the Peierls mode vanishes, our finite temperature simulation ( K) yields cm−1, measured as half the difference of the position of the two bands. The PESs for present the double minima characteristic of dimerized system, causing the progressive disappearance of the side bands and the observation of the intramolecular mode at cm−1 in both IR and Raman spectra. For instance, for and K the IR spectrum shows the coexistence of the peak of the molecular mode, signaling stack dimerization, with combination bands, that are instead characteristic of regular stacks. This results from our ensemble average of classical dynamics that includes both trajectories crossing the barrier separating the two minima at finite δ and trajectories that are instead trapped in one of the two potential wells.
The comparison of calculations in Figure 7 with experimental spectra of DMTTF-CA [23,66] in the region of molecular vibrations is very good. While this result holds for any reasonable parameterization of a continuous NIT, a truly quantitative agreement on the softening of the Raman active molecular vibration as well as the evolution of the related IR combination bands upon approaching NIT is obtained by fine tuning the V as shown in the inset of Figure 7). In effect, is optimized for Raman and IR spectra at temperature T.
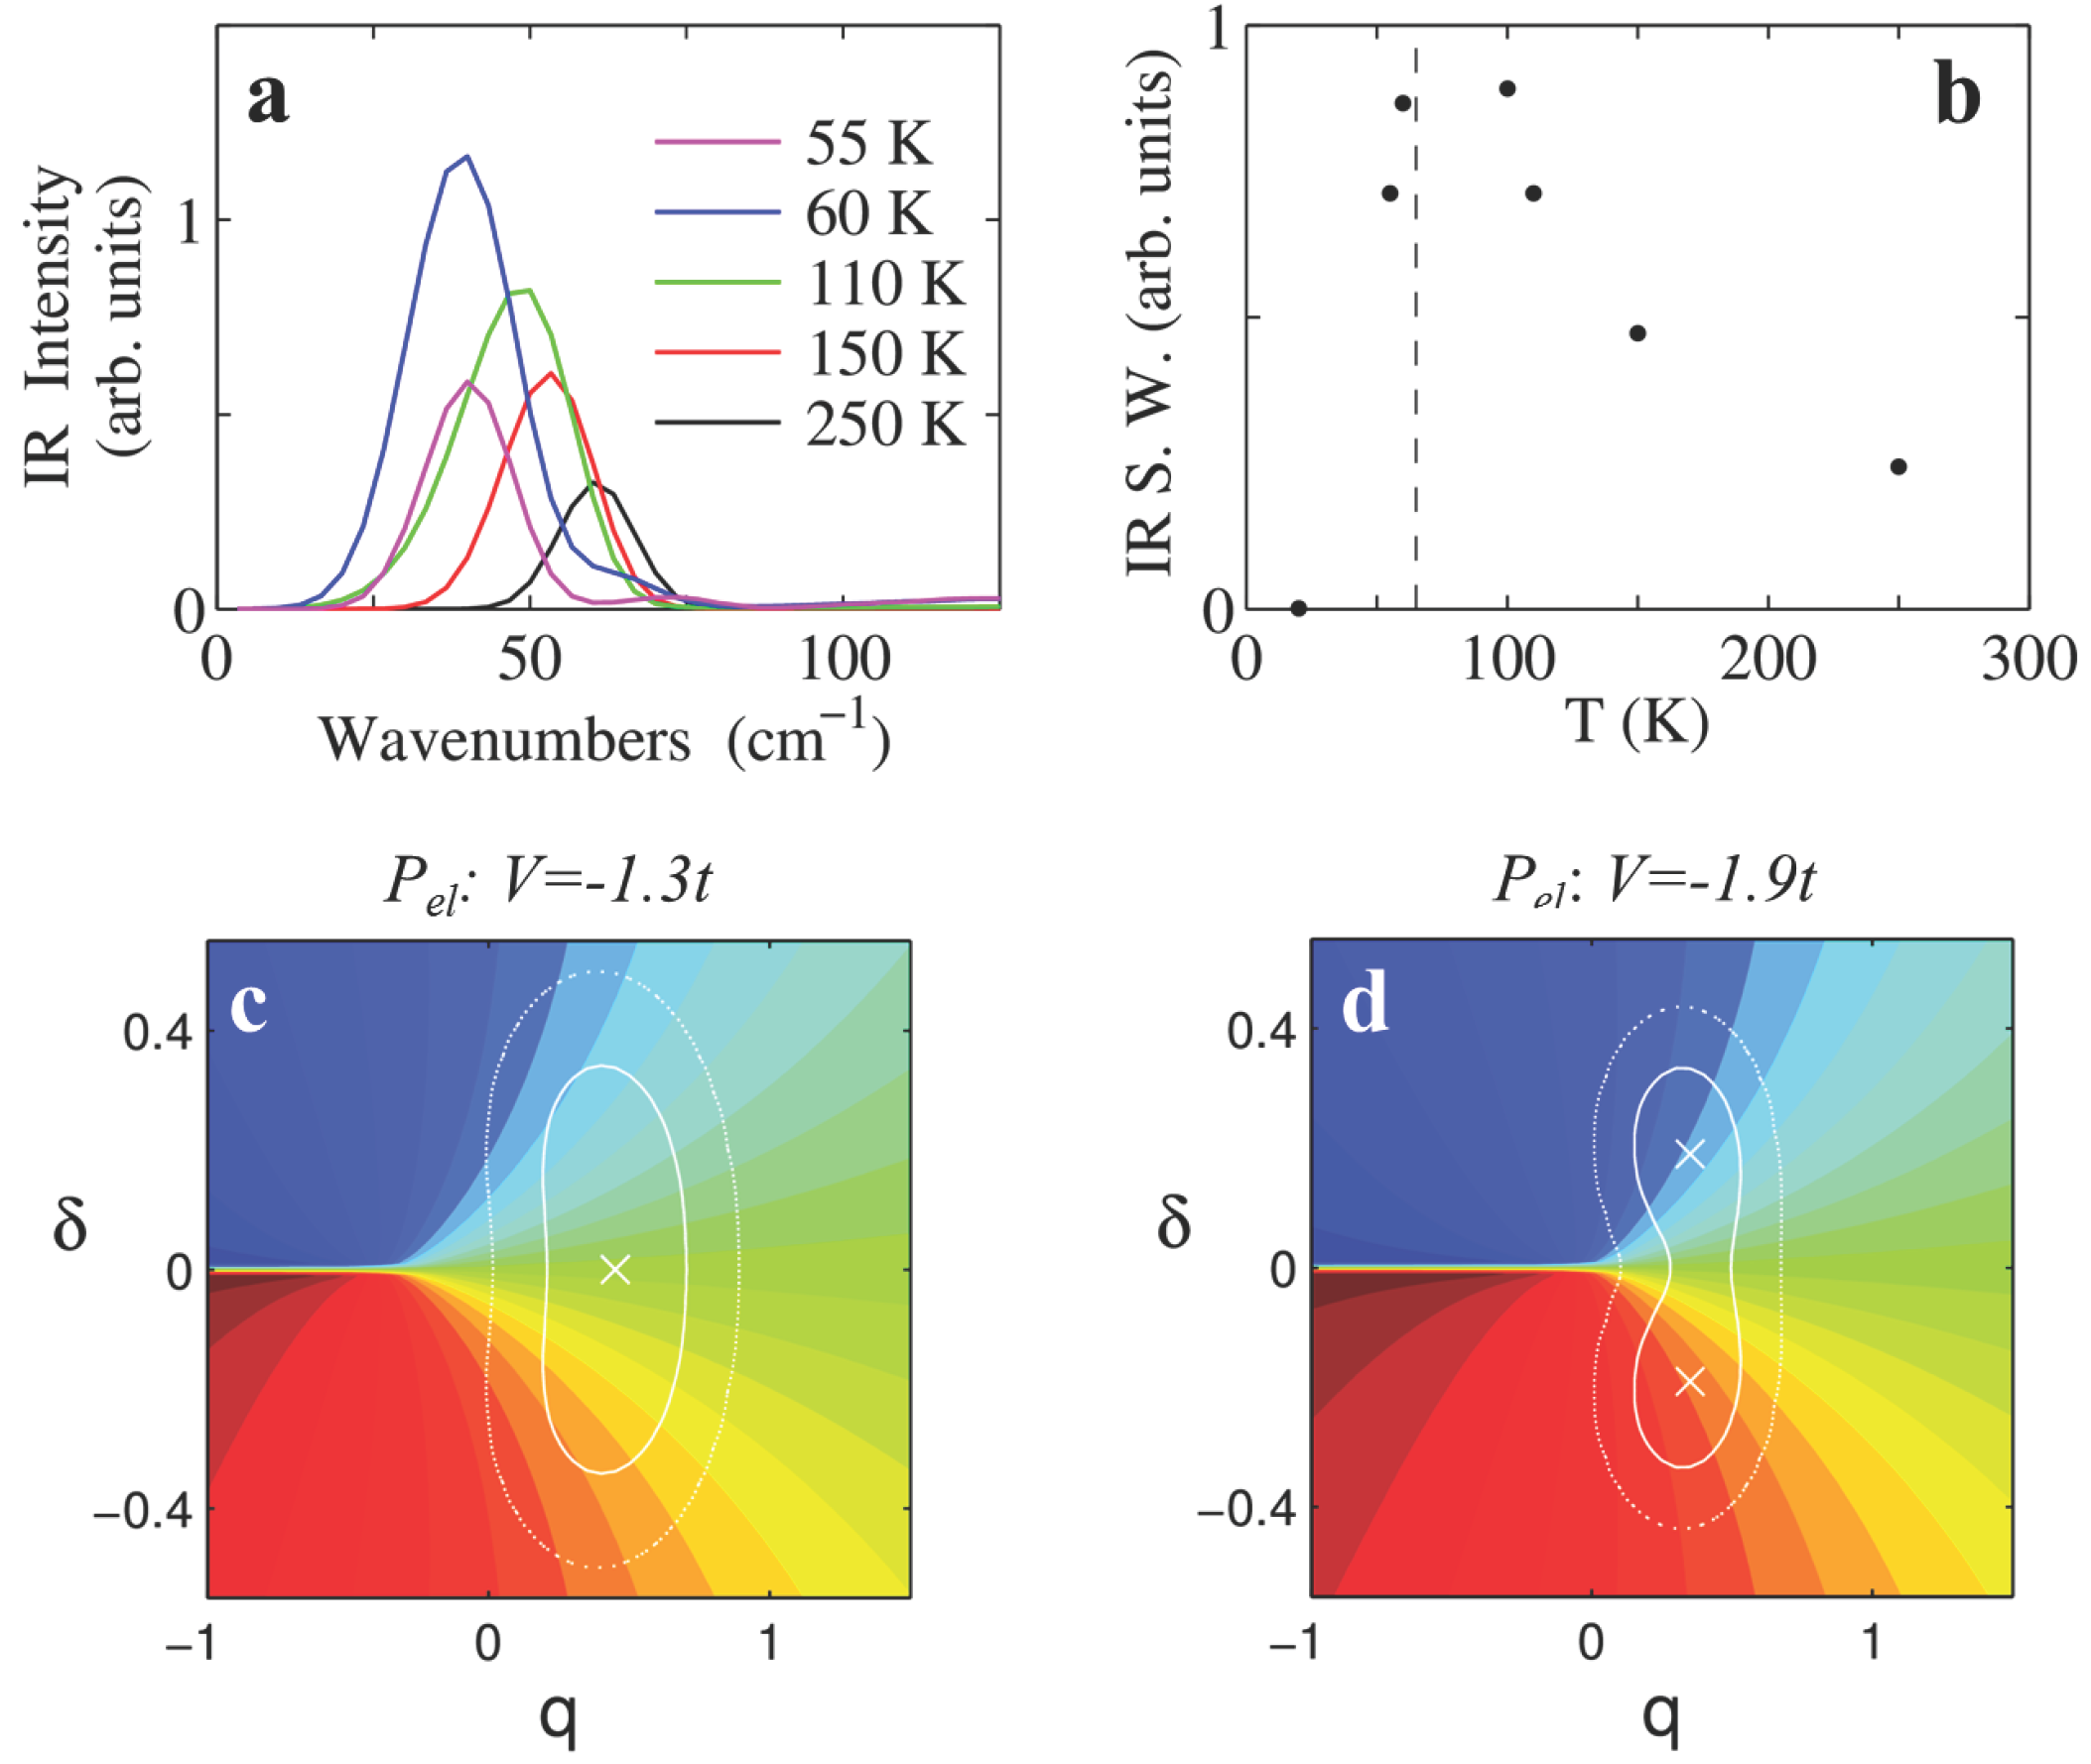
We now turn our attention to the region of lattice phonons. Panel a of Figure 8 shows the IR spectra, largely dominated by the absorption band of the Peierls mode. The Peierls mode softens upon approaching NIT from about 60 cm−1 (, K) to 40 cm−1 (, K). This softening is consistent with the half difference between combination bands in Figure 7. The intensity of the Peierls mode grows upon approaching NIT as can be better appreciated by the integrated intensity in the 0–100 cm−1 interval shown in Figure 8b. The spectral weight grows by approximately a factor 4 upon approaching the transition at K (dashed line) and decreases in the I phase.
These results were recently experimentally confirmed for TTF-CA [67]. Although the model is optimized to describe the continuous transition of DMTTF-CA, it is interesting to note that the relative increase of the intensity of the Peierls mode is consistent with the measurements on TTF-CA, where the 0–100 cm−1 spectral weight grows from 600 ω−1cm−2 at 300 K to 2000 ω−1cm−2 at the transition temperature of 81 K (approximate values, from Figure 7 of Ref. [67]).
The growing intensity of the Peierls mode at NIT can be understood from a joint inspection the PES and of the surface (i.e., the dependence of on the vibrational coordinates q and δ) and their evolution as a function of V. In fact, while the PES governs the classical dynamics of the systems, the IR absorption intensity depends on the amplitude of fluctuations of the correlation function, according to Equation (13). Panel c of Figure 8 superimposes the surface (color map) and the PES (isolines) for a N system (). We notice that the surface closely resembles in Figure 3a, as expected considering that q enters Hamiltonian (10) as an additive term to Γ. Since DMTTF-CA does not undergo a true NIT (ρ is always smaller than 0.5 [66]) it is equivalent to consider or (see Section 2.6)). For this system with a largely N ground state, the single minimum of the PES (cross) lies in the region where the surface is smooth. In this case thermal vibrational motion cannot induce large fluctuations and the IR intensity remains modest. As the system approaches NIT, the PES minimum shifts towards the region of large variations along δ, and thermal lattice fluctuations induce larger and larger electronic charge flows along the stack that maximize at the dimerization transition. Large IR intensities still persist in a dimerized system such as that in Figure 8d (). In this case the PES presents two shallow minima separated by a small energy barrier that can be overcome at K, causing large variations. Further decrease of V and/or T traps the system in one of the two minima, suppressing the IR intensity. The anharmonic simulation provided here confirms the results of the harmonic calculation [14,15]. Indeed the harmonic approximation catches the main physics of the phenomenon, simply relating the IR intensity to the squared δ derivative of the polarization at equilibrium .
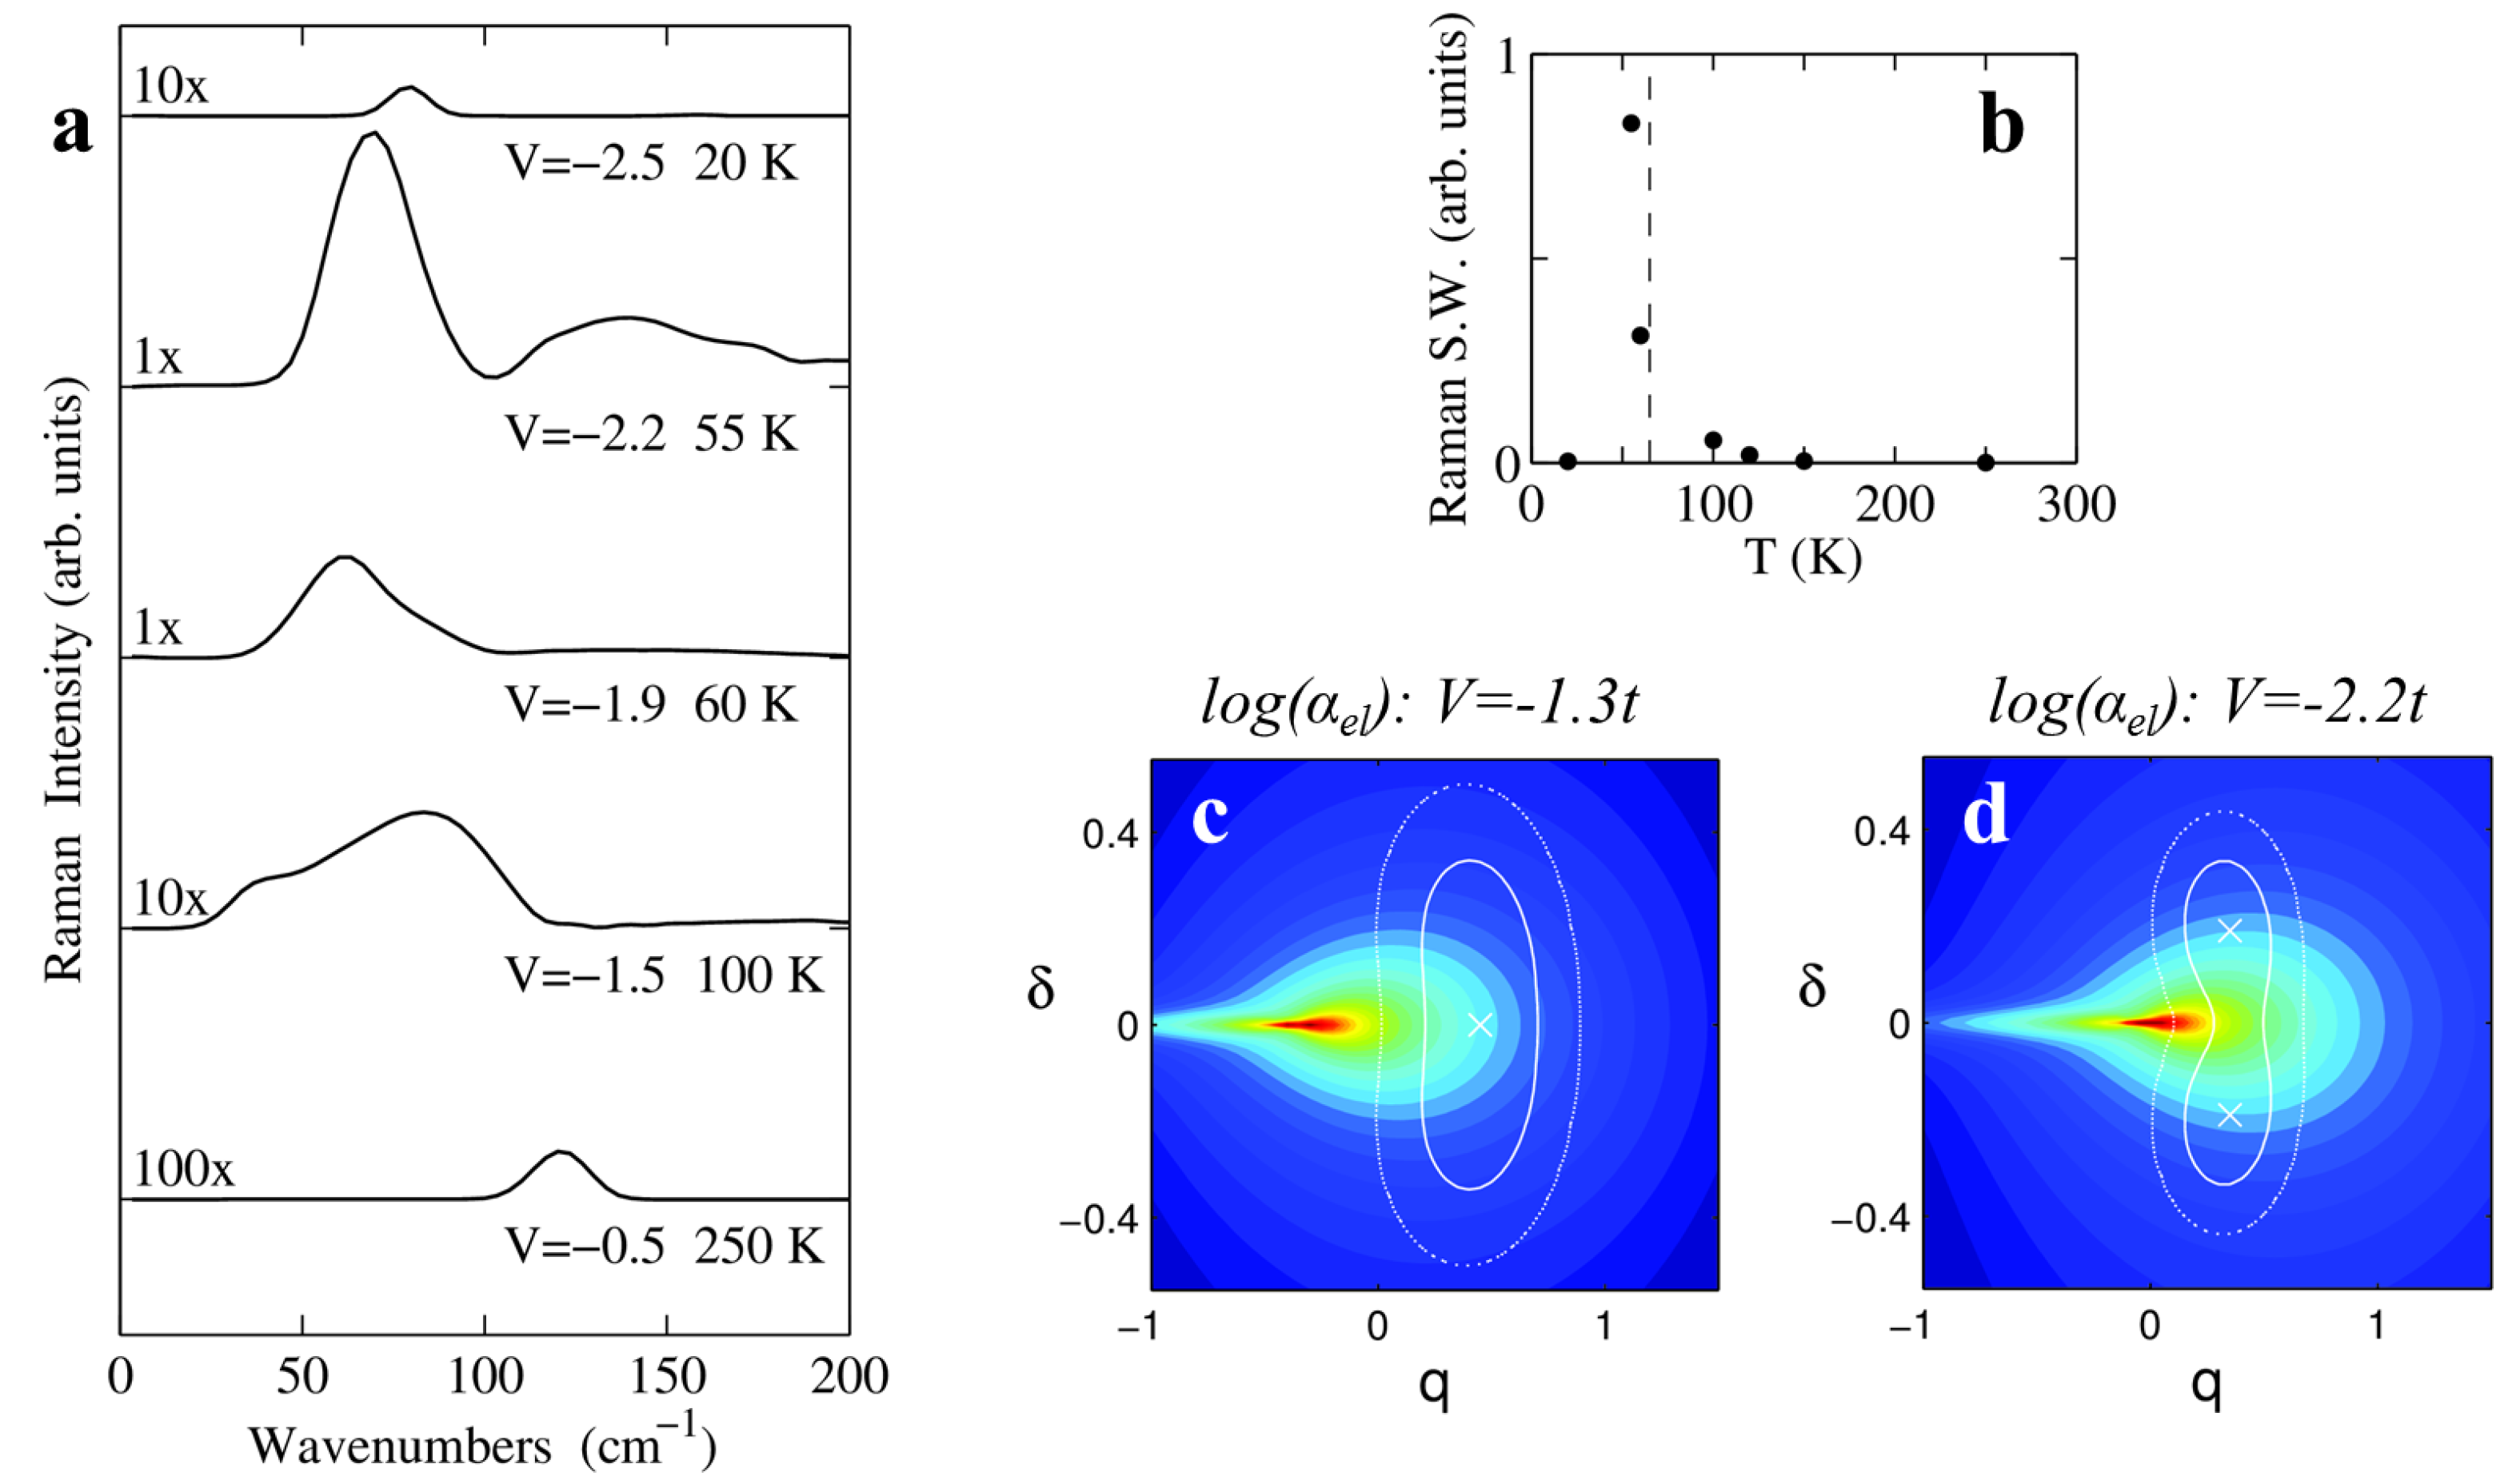
IR spectra in the lattice phonon region can be understood to a first approximation, in the harmonic limit. However, in the same spectral region Raman spectra are largely dominated by anharmonicity effects. Panel a in Figure 9 shows Raman spectra calculated for light polarized along the stack axis, hence probing the polarizability due to delocalized electrons. In the high-T N phase, the Peierls mode is silent in Raman spectra by symmetry, hence in the harmonic approximation no signal is expected in the region of lattice phonons. At K (, black line) the spectrum is characterized by the presence of a single band around 120 . The comparison with IR spectra in the region of lattice phonons (see Figure 8a) and of molecular vibrations (see Figure 7) allows identifying the Raman band as the overtone of the Peierls mode . The overtone band is symmetry-allowed in the regular stack and its presence is a manifestation of the PES anharmonicity. This band softens upon approaching NIT and acquires an asymmetric shape that can be also ascribed to the anharmonicity of the potential. Most importantly, the intensity of the Raman peak greatly increases approaching the transition and maximizes at K (blue line), where the appearance of the higher overtone is predicted by the calculations. As can be seen by the integrated intensity plot in Figure 9b, the maximum Raman signal occurs just below K. In the dimerized phase at K, the Peierls mode is directly observable both in Raman and IR (not shown) spectra at cm−1 [23].
These theoretical results are confirmed by the experimental observation of a broad and intense Raman signal appearing below 100 cm−1 in proximity of the T-induced transition of DMTTF-CA [23] and of the similar compound DMTTF-QBr2Cl2 [68]. More interestingly, simulations provide a key to understand the anomalous Raman signal that is generated by vibrations and electronic polarization at finite dimerization (see Figure 4). Figure 9c,d show the surface (log-scale color map) with PES isolines superimposed. As the system evolves from a N regular phase (Figure 9c, ) towards the transition, the PES minimum approaches the singularity of and the system dynamics explores more and more regions that greatly contribute to the correlation function in Equation (14). In the just-dimerized phase at (Figure 9d), the PES minima are located just across the singularity that is however accessible by thermal fluctuations at K, conferring huge Raman signal to the overtones of the Peierls mode.
More generally, this careful theoretical analysis sheds light on the entanglement of charge and vibrational degrees of freedom that confers a strongly anharmonic character to systems close to the NIT. The effect is twofold: on one hand there is the so-called mechanical anharmonicity, i.e., the PES dependence on vibrational coordinate largely deviates from quadratic behavior, leading to the appearence of combinations and overtone bands in vibrational spectra. On the other hand, the dependence of the electronic polarization and polarizability is strikingly different from lowest-order approximations. This electrical anharmonicity is responsible for the large intensity of anharmonic features that are prominent in the vibrational spectra of ms-CT crystals [23,66,69]. Finally, the observation of an anomalous Raman scattering in the lattice phonon region at NIT [23] provided an indirect experimental evidence for the divergent electronic polarizability of the regular lattice.
5. Multistability and Photoinduced NIT
Multistability is the characteristic feature of discontinuous phase transitions, opening the way to metastable states, coexisting phases and photoinduced phase transitions. The energy of metastable domains depends on the domain length and on the boundaries, as discussed in [20]. The T-induced NIT of TTF-CA occurs at too low temperature to allow for the population of metastable domains, but the pressure-induced NIT at room temperature shows a sizable population of metastable domains, leading to coexisting N and I features in vibrational spectra as shown in Figure 20 of Masino et al. [25]. While the thermal population of metastable domains is an interesting feature, the possibility to populate metastable states via photoexcitation in the so-called photoinduced NIT is even more interesting.
Light induced transitions have been observed in TTF-CA crystals at temperature close to the discontinuous NIT. Starting from the I phase a TTF-CA crystal is driven by light absorption to a metastable state similar to the N high-temperature phase [5,6]; and vice versa for a N crystal to a I-like state [8]. Due to the long lifetime of metastable states, usually in the range of nanoseconds, this process is referred to as a photoinduced NIT (PINIT). PINIT has been demonstrated in TTF-CA through spectroscopic measurements (time resolved pump-probe experiments) [5,6,8] . Moreover, in time resolved X-ray experiments it was possible to observe the PINIT through the evolution of specific Bragg reflections after photo excitation [9], confirming the bulk nature of the observed phenomenon.
Theoretical modeling of PINIT is fairly recent and requires the addition of a pump pulse to systems of correlated electrons coupled to soft lattice and molecules. The Peierls-Holstein-Hubbard model for photoinduced transitions reviewed by Yonemitsu [70,71] is broadly similar to the full Hamiltonian in Equation (10) with linear coupling to harmonic molecular and lattice modes. The model is applied to TTF-CA as well as to charge ordering transitions and Mott insulator to metal transitions in BEDT-TTF2 salts that correspond to 3/4 filled 2D Hubbard models of D = TTF. Yonemitsu keeps the full Hubbard basis, explicitly treats the pump pulse of finite duration using the vector potential, and finds the time evolution of lattice and molecular vibrations in finite systems during and following an excitation pulse. We start instead with an impulsive, delta-function pulse at and follow the time evolution of the system on anharmonic PES derived from other TTF-CA spectra. Accordingly, we explicitly and quite naturally address phenomena that results from the large anharmonicity of PES close to NIT and specifically the large coupling between the dimerization and the molecular-vibration motions, as discussed below.
In spectroscopic pump-probe experiments the crystal reflectivity in the visible region is measured after photoexcitation, to give information on the molecular properties [6,8]. This experiment will be discussed in the following. A threshold effect on the incident light intensity was observed for the PINIT along with a large non-linearity. Through a single photon absorption, multiple ionized DA pairs are created; the reported numbers vary from ten [72] to a few hundred [6] pairs. This behavior is very atypical, since, according to the standard exciton theory, transitions involving CT between more then one DA pair would be forbidden [73,74,75].
PINIT in TTF-CA occurs in two steps. In the first few picoseconds (ps) after photoexcitation the CT mechanism is triggered and the first ionized chains are created; then from ∼10 ps to the first nanosecond (ns) the ionized chains reorganize and long-range ferroelectric order is created. This comparatively slow dynamics can be conveniently followed by time-resolved X-rays experiments [9]. Optical pump-probe experiments, instead, offer a very detailed description of the early time dynamics of the system (0–10 ps) that we aim at modelling.
In particular we address very interesting experiments by Okamoto et al. [72,76], where the variation of reflectivity () of TTF-CA is measured in the visible region following an ultrafast (15 fs) laser pump pulse. The data were collected at different temperatures, different excitation photon density and at different probe wavelength. The pump beam is polarized parallel to the stacking axis of TTF-CA with an energy interval of eV that matches the broad CT band seen in the polarized absorption spectra of TTF-CA. The probe beam is polarized perpendicularly to with an energy of 2.2 eV in the region of localized electronic excitations that are sensitive to the ionicity of the crystal. spectra collected at different time delays between the pump and the probe are compared with the difference between spectra collected at 4 K (I phase) and at 90 K (N phase): the strong similarity between the shape of the pump-probe and the steady state spectra suggests that an I-like state is generated by the pump signal. Accordingly, the variations were interpreted [72,76] as ionicity variations.
Since the pump photon irradiation density per DA pair was measured during the experiment, Okamoto et al. [72,76] estimated the number of ionized pairs created by a single photon absorption as from the jump at . A detailed analysis of the temporal evolution of shows an oscillatory component with frequencies related to molecular or lattice vibrations. In particular the component was interpreted as related to the Peierls dimerization mode. Additionally, a wavelet analysis was performed on the oscillating signal to study the temporal evolution of the frequency components: some of them showed a significant shift in time. For example, the ∼957 cm− component, which was assigned to an e-mv coupled vibration of CA (), oscillates in time at almost the same frequency as the Peierls mode. We will demonstrate that this interesting result is again a consequence of the strong anharmonicity of PES close to the phase transition.
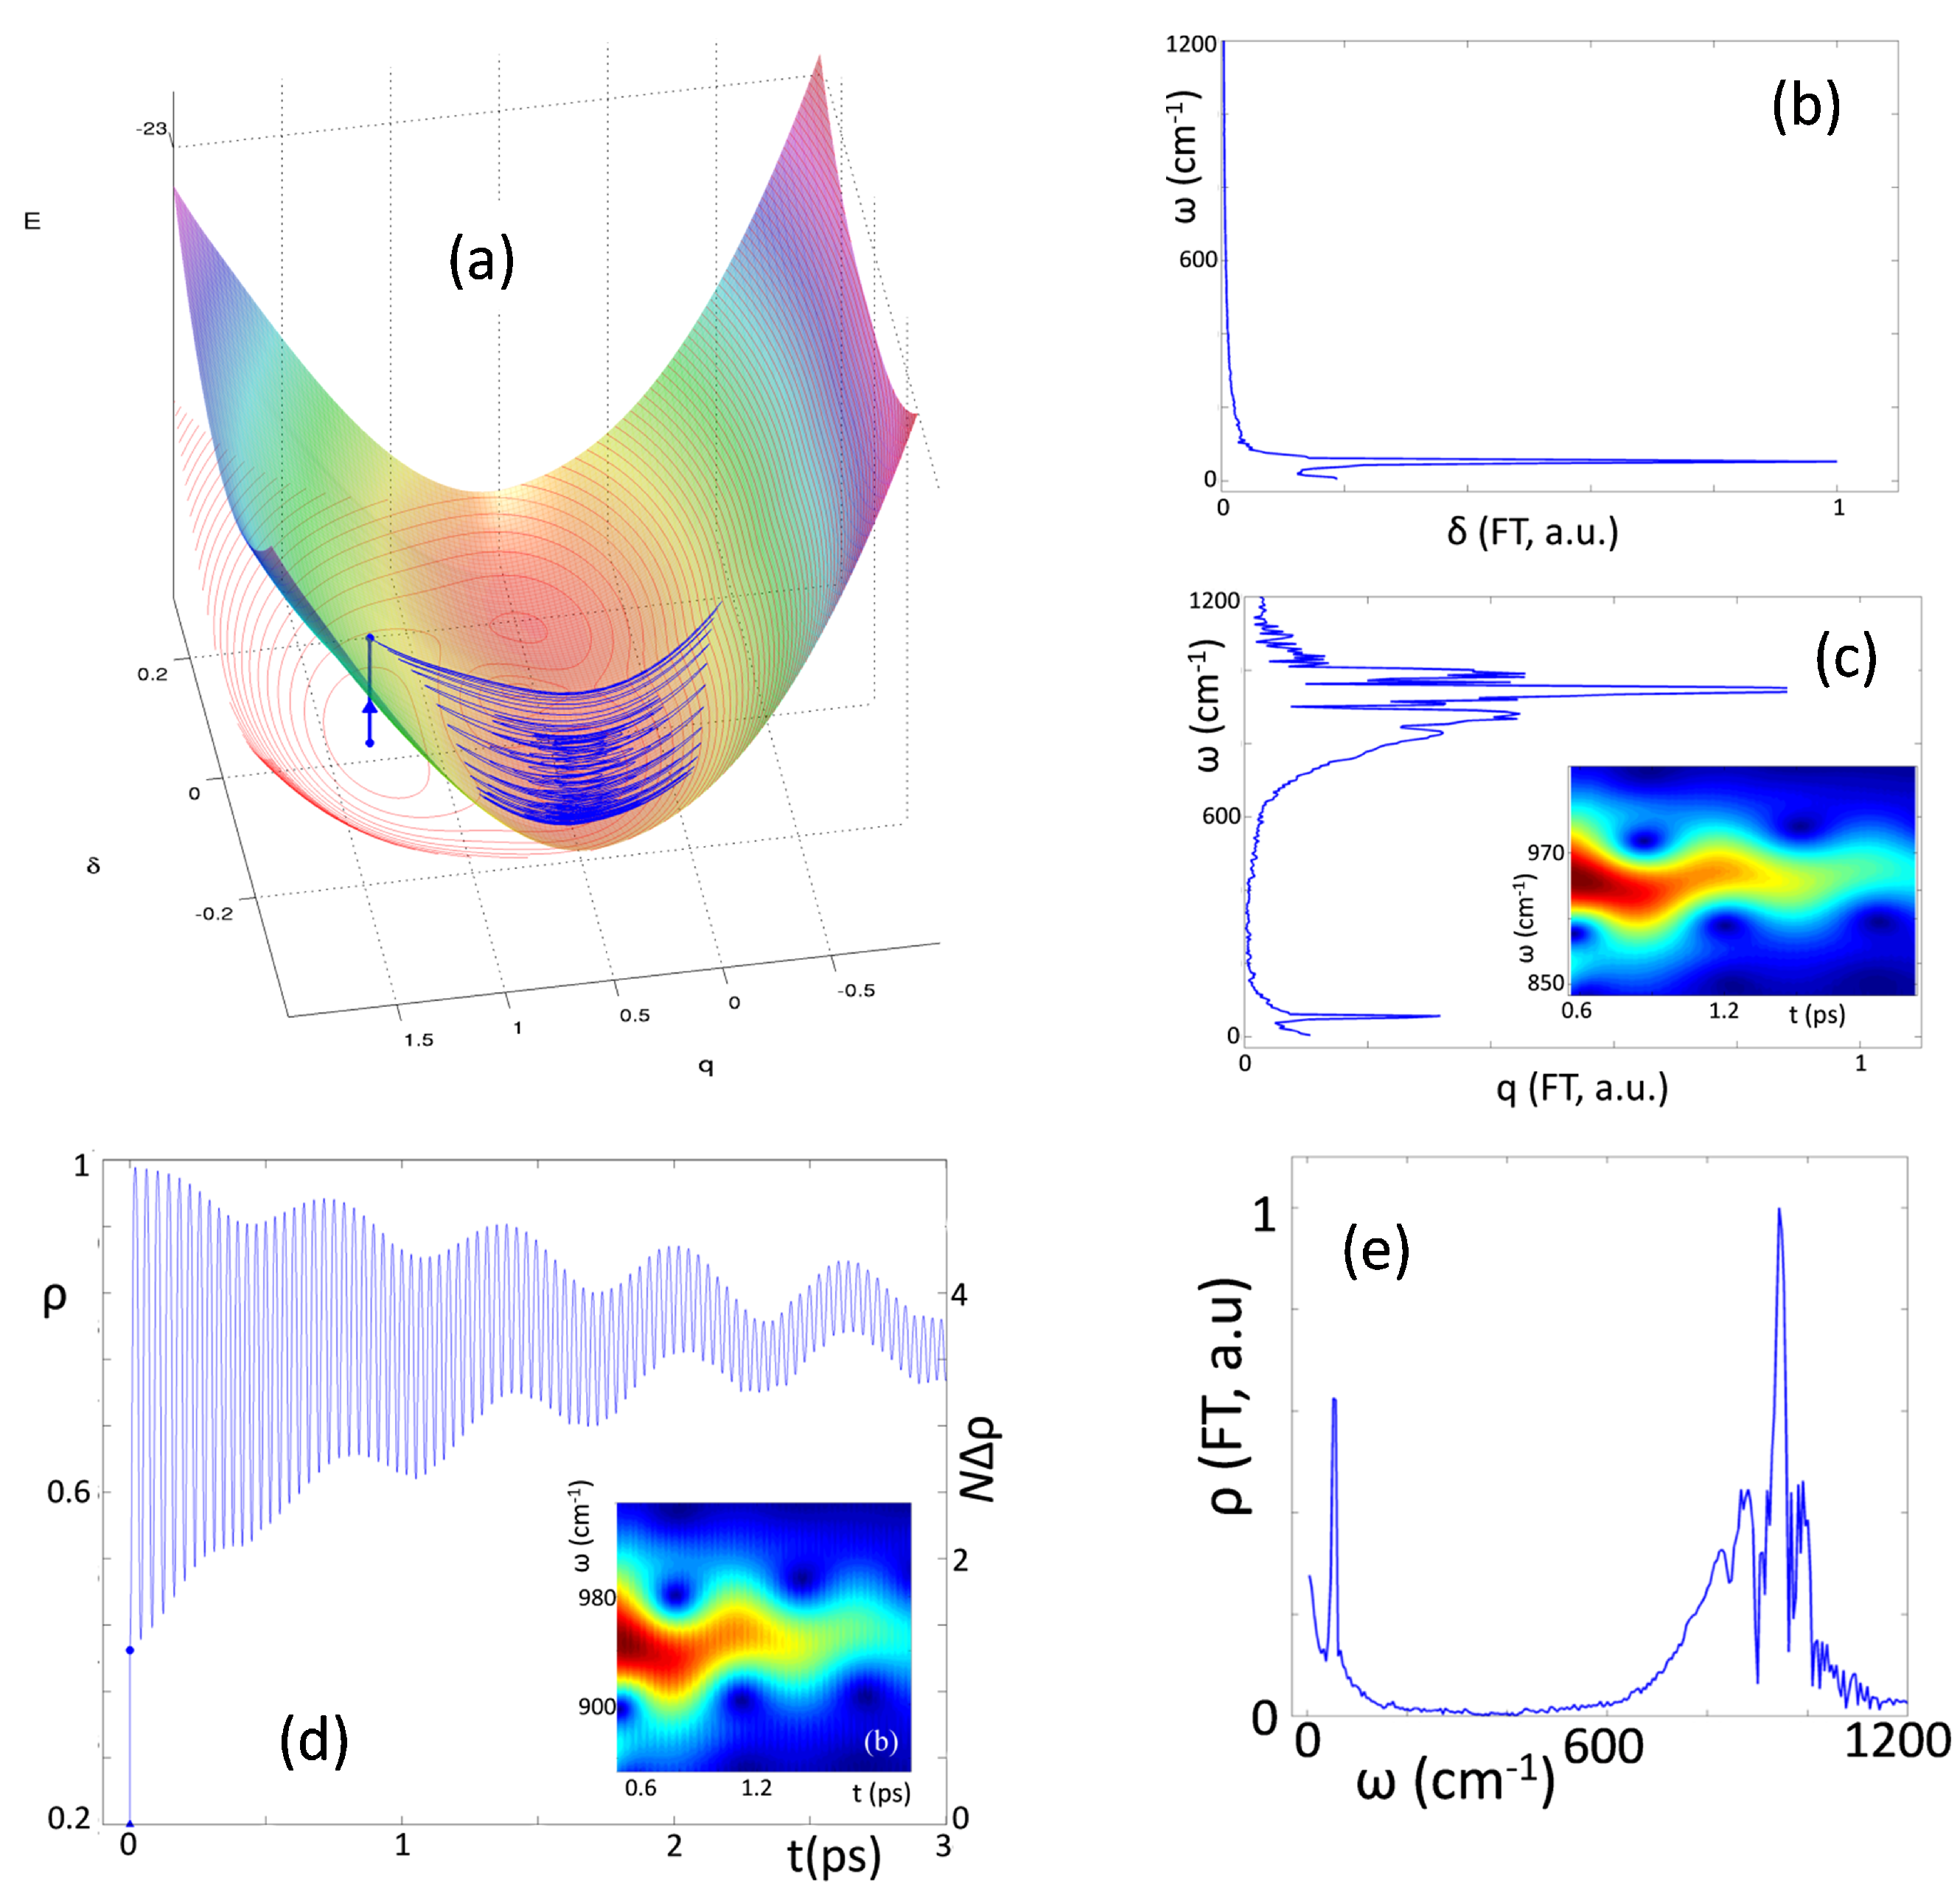
To model PINIT we need not only the ground state PES (G-PES) that has been used to discuss vibrational spectra, but the excited state PES (E-PES) as well. We report results obtained for standard TTF-CA model parameters, as discussed in Section 3.1, but relax the mean field approximation, and explicitly account for nearest neighbor interactions. Figure 10, left panel, shows the adiabatic G-PES and E-PES calculated for . The G-PES shows a stable neutral regular phase and two metastable dimerized minima at . The two surfaces touch at a conical intersection, the red dot in the middle panel, that corresponds to the critical point of the MHM discussed in Section 2. The vertical arrow in the left panel marks the strong, optically allowed absorption polarized along the stack that initiates PINIT by generating a lattice-unrelaxed exciton of multielectron transfer character.
After a fs pump pulse, the photoexcited system evolves on the E-PES. The conical intersection makes it possible to tunnel towards one of the metastable minima. To model this complex dynamics we take advantage of the nature of the G-PES close to a discontinuous phase transition, where multistability indicates nearby surfaces. More specifically, the diabatic PES relevant to the neutral regular state and to the ionic dimerized state cross and generate the G-PES and E-PES when they are adiabatically mixed. Therefore, starting from the adiabatic PES for the ground and first excited state in Figure 10 we construct the diabatic PES relevant to the ionic dimerized (metastable) state, as shown in Figure 10, middle and left panels. This PES practically coincides with the E-PES in the region of the vertical excitation and with the G-PES in the dimerized metastable region. The middle panel shows the PES with minimum gap between E-PES and G-PES. The right panel is the diabatic PES obtained by smoothing out the gap. While the smoothing procedure is somewhat arbitrary, we emphasize that the dynamics is marginally affected by the details of the smoothing. In fact this critical region is only crossed once at the beginning of the photoexcited dynamics.
A detailed analysis of the early-time dynamics of the photoexcited system is reported in Ref. [24]. Here in Figure 11 we show the trajectory of the system after instantaneous excitation and the Fourier transforms of the and signals that show oscillating components at 55 and 945 cm−1, respectively. The wavelet analysis of the same signal, shown as a color map on panel b in Figure 11, clearly shows that the molecular vibration oscillates at a frequency that is not constant in time, but that in turn oscillates about a mean values (∼945 cm−1) at a frequency that corresponds to that of the dimerization mode (∼55 cm−1). In the equilibrium state, before photoexcitation, the system is in a neutral regular state. After vertical photoexcitation q is wildly out of equilibrium and a very fast initial dynamics brings it towards the equilibrium position relevant to the photoexcited ionic states. This fast initial dynamics accounts for the observed initial rise of the reflectance variation. After the initial increase, oscillates about the new equilibrium position with an amplitude that progressively decreases due to friction. Indeed, due to anharmonicity, the motion along the two coordinates is mixed and while δ oscillates, different regions of the PES are explored, characterized by a different curvature along the q coordinate, then explaining the modulation of the observed frequency for the q mode by the δ frequency, as shown in the inset of Figure 11c, and in line with experimental observation.
Figure 11d shows the temporal evolution of the system ionicity, that closely resembles . The variation of ionicity of the system is proportional to the number of D+A− pairs created upon photoexcitation, as shown on the right axis of Figure 11d. Results in the figure tell us that upon vertical excitation (the dot located at ) almost 1.5 electrons are transferred from D to A sites, a result that calls for sizable correlation of the motion along the chain. However, ultrafast lattice relaxation, and more specifically the relaxation along the q coordinate, further increases the number of transferred electrons, that oscillates with q around an average value of about 4. This intriguing result is in line with the experimental observation that photoexcitation generates a domain (D+A−)n with within 20 fs.
Vertical excitation at 260 K, far from NIT for TTF-CA parameters, also generates ionic domains [76]. In the simplest approximation, coherent oscillations of coupled molecular vibrations are again modeled by q, but there are no δ-oscillations since δ = 0 is the minimum on both surfaces. Now the thermal population of the Peierls mode with 50 cm−1 must be taken into account. We do so along the same lines discussed in the previous Section and in Ref. [23]. We choose a symmetric δ-distribution in , the G-PES, follow the coherent dynamics after a vertical excitation, and weight the results of many runs by a Boltzmann factor in . Coherent δ-oscillations are generated with greatly reduced amplitude, as found experimentally [76]. The most interesting feature is the doubled frequency 100 cm−1 in the Fourier transform of ρ that corresponds to Figure 11e at 90 K. The frequency of the oscillations around is doubled since ρ is symmetric on δ. For completeness, we note that the 90 K results near the NIT in Figure 11 hardly change upon accounting for thermal population of the PES along δ.
6. First Principles Model Parameters
The MHM provides a robust framework to understand the valence and structural instabilities in ms-CT crystals. Input parameters are required for MHM, as is typical in a semiempirical model. Parameters have traditionally been obtained and progressively refined for prototypical systems such as TTF-CA or DMTTF-CA on the basis of optical, vibrational and other experimental data. In this section we cover a recent alternative approach that instead relies on DFT electronic structure calculations [61,77]. This has the advantage that the crystal structure is the only experimental input needed, possibly at different temperature or pressure.
The most refined model for ms-CT crystals accounts for several interactions and hence several parameters enter , Equation (10). The parameter set includes those describing the electronic structure (t, z), the coupling to molecular and lattice vibrations ( and ), as well as intermolecular electrostatic interactions (V, or the derived ). Reliable estimates of these quantities can be obtained from atomistic calculations, with the notable exception of .
As discussed in Section 2, the MHM can be considered a 1D extension of the Mulliken dimer model, whose mean-field electronic properties are fully determined by t and . To fix these model parameters, we extract DA dimers from the experimental crystal structure of specific ms-CT crystals and run DFT calculations to map relevant states into the Mulliken two-state model. The mapping proceeds through the identification of two properties of choice that can be accessed by both approaches. In our case, we opt for quantities obtained from ground-state calculations in the singlet and in the triplet subspace, namely the ionicity and the singlet-triplet gap , leading to the following closed expressions:
The choice of ground-state properties is considered to be safer with respect to excited state calculations, which are known to be troublesome in CT systems within the framework of time-dependent DFT. Range-separated hybrid functionals, such as CAM-B3LYP or ωB97XD provide reliable estimates for the sought quantities, in line with earlier empirical estimates [61,77]. The favorable comparison with experimental data for the ionicity ρ in the crystal validates this choice a posteriori.
In the adiabatic approximations underlying Hamiltonian (10), the strength of the coupling to effective vibrational modes is measured by the relaxation energies and . is defined as the energy gained upon intramolecular structural relaxation associated with the electron transfer from D to A and includes the contribution from several vibrational modes of the molecule, yet q in Equation (10) is an effective coordinate that accounts for their combined effect. It is, therefore, preferable to compute intramolecular reorganization through DFT calculations performed at the geometries optimized for isolated neutral and charged molecules as , where () is the hole (electron) relaxation energies for the D (A) defined in standard electron transfer theories.
On the other hand, a first principles estimate of is computationally challenging as it would require the calculation of the energy for the formation of a bond-order charge density wave in the crystal (excluding dispersion and steric interactions that are modeled by an elastic term in the harmonic approximation, see Equation (10)) along an effective dimerization coordinate that enforces rigid molecules. Given these practical difficulties, in this case a different approach with respect to that of Section 3 has been proposed, and calculations are performed at the dimerization obtained from experimental crystal structure () and not at the optimal lattice geometry for a given , or scanning the PES near equilibrium. This is straightforward in the case of regular stacks where by definition. In dimerized systems, two independent DFT calculations are required for nonequivalent dimers in symmetry-broken stack, obtaining .
The evaluation of long range intermolecular electrostatic interactions goes beyond the reach of first principles calculations, calling for multiscale approaches that can be parametrized ab initio. Electrostatic models of atomistic resolution represent here an ideal compromise between accuracy and computational cost [78]. In these approaches point atomic charges approximating the charge density of neutral or charged molecules and experimental atomic positions are employed to compute intermolecular interactions via direct electrostatic summations, possibly accounting also for the screening provided by molecular polarizabilities [61]. Since V is readily computed for a dimer and for a crystal, we obtain the quantity that enters the mean field approximation to (10).
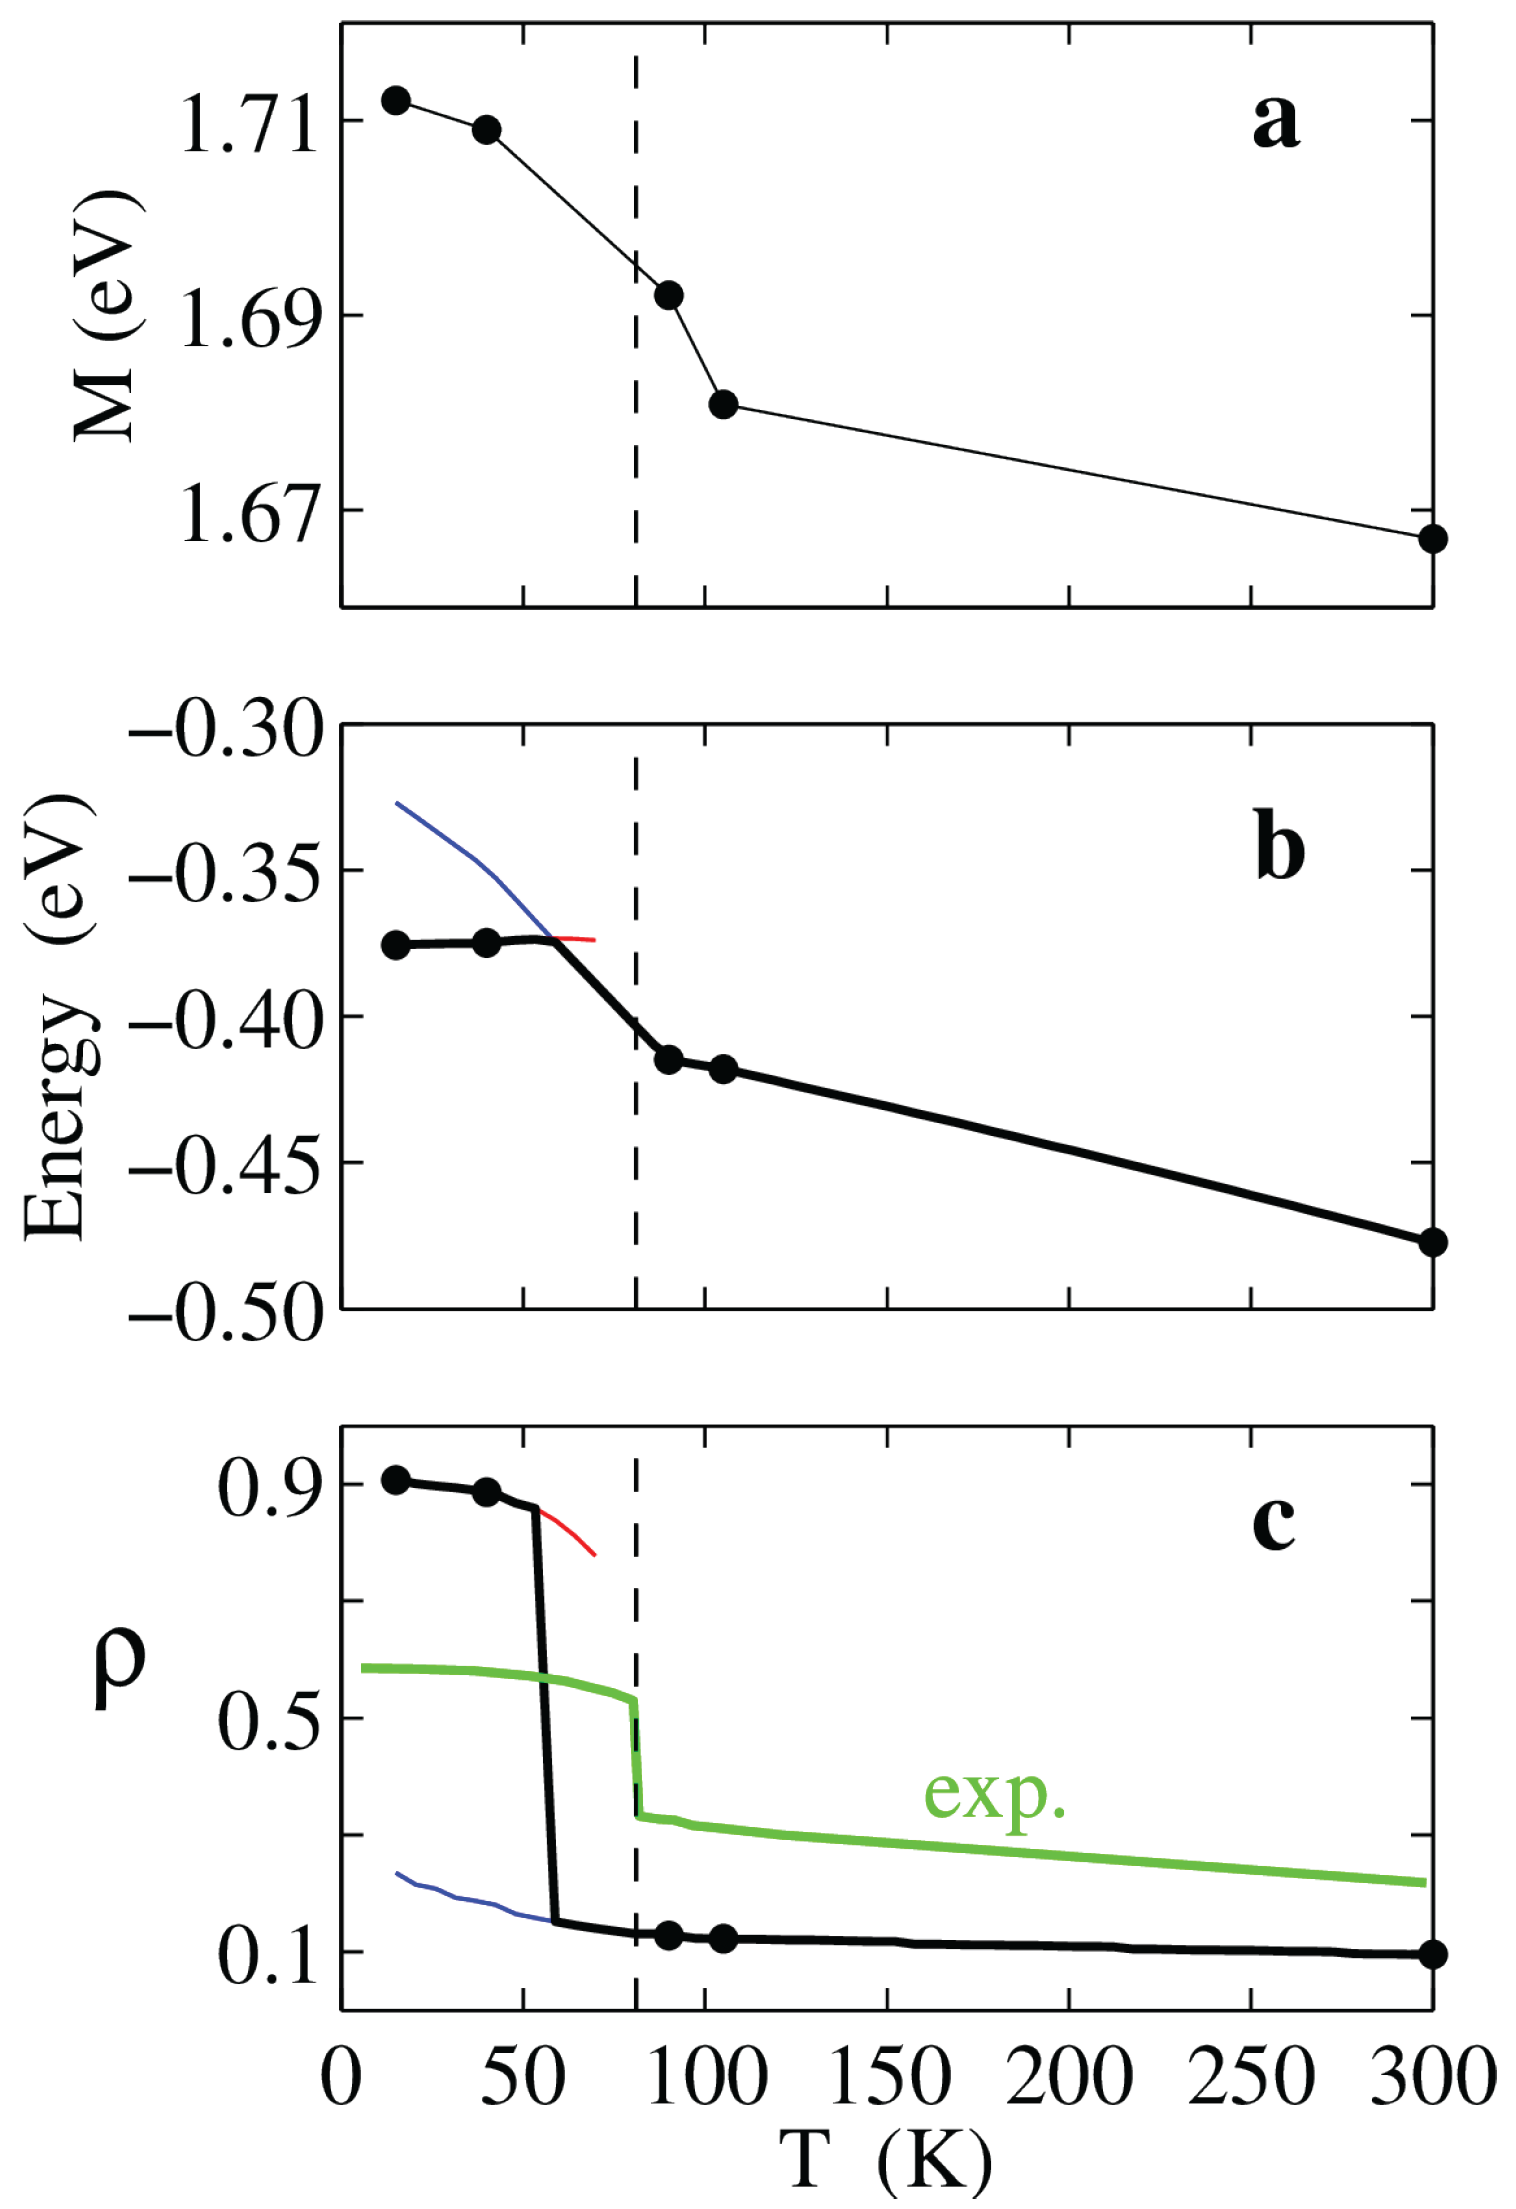
TTF-CA is by far the most studied ms-CT crystal and its crystal structure has been experimentally determined at temperatures ranging from 15 to 300 K, i.e., in a large interval around K. In Ref. [61] the parametrization described above has been performed for the different crystal structures, allowing the theoretical description of the NIT as a quantum phase transition where temperature only enters through the structural change. Apart from the dimerization occurring below Tc, the most remarkable variation with T of the parameters is the 45 meV increase of the Madelung energy shown in Figure 12a. The effect of the increasing strength of electrostatic interactions on the MHM ground state energy and ionicity are shown in Figure 12b,c, respectively. At room T TTF-CA is largely neutral and its ground state is progressively destabilized by the increasing due to the thermal contraction of the lattice. Upon decreasing temperature, the system enters a bistable region with coexisting N and I phases, the latter stabilized by the increase. This bistability window is a characteristic of discontinuous transitions and relevant energies (free energies at finite T) discriminate between the thermodynamically stable and the metastable phase (see also Section 2.3 and Section 3). The calculated evolution with temperature of the ionicity , shown in Figure 12c, favorably compares to experiment, although quantitative deviations are evident. In fact, TTF-CA turned out to be always too neutral or too ionic in the calculation, a flaw that can be attributed to the mean field treatment of electrostatics, which may suppress intermediate states, or by finite temperature effects such as thermal population or disorder. Nevertheless, capturing the discontinuous NIT of TTF-CA in the correct temperature range and without introducing adjustable parameters is a remarkable result that validates the MHM parametrization through comparison with experiment. This result further confirms the nature of the NIT as a quantum phase transition driven by the increase of the Madelung energy with the lattice contraction.
In a more recent study [77], some of us extended this approach to eleven ms-CT crystals, demonstrating the wide applicability of the first principles parametrization. With the only exception of just one among the 11 investigated systems, TMPD-TCNQ [79] for which the method was inapplicable, in all other cases it has been possible to find good correlations between the experimental and the calculated ionicity [77]. Moreover, the different ms-CT crystals have been classified in terms of their bistable character and their propensity towards a discontinuous transition. The key parameter for the classification was identified as the ratio (see Section 2.3 and Section 2.5), which returns a good correlation between parameters obtained from atomistic calculations for each system and their experimental behavior.
Theoretical calculations on specific experimental systems, explicitly accounting for the strong correlations characterizing ms-CT crystals, have been recently proven to be possible and reliable. The approach discussed here collapses the complexity of several systems into a few physically meaningful parameters, allowing to draw insightful connections between molecular chemistry, supramolecular organization in the solid state and the electronic properties of materials. All this can be then rationalized within the framework of the universal picture of NIT in ms-CT crystals provided by the MHM accounting for electron-phonon coupling.
7. Summary
The general situation discussed here with respect to modeling NIT is typical of the evolution of understanding of condensed phase systems. The initial focus on ionicity was soon expanded to the structural instability to dimerization and the -dependence of molecular vibration frequencies. Mixed stack CT crystals are a subgroup of the larger family of quasi-1D CT crystals that also include segregated stacks. The optical, magnetic, electrical, vibrational and structural properties of crystals with quasi-1D stacks have posed interesting experimental and theoretical challenges for decades. The present consensus is in terms of correlated electrons in extended Hubbard-like models, coupled to the Peierls phonon and molecular vibrations, and 2 or 3D considerations as suggested by experiment. We have not gone beyond 1D modeling of a single stack, but ferroelectricity in ms-CT crystals clearly requires that all stacks dimerize in the same sense.
The microscopic NIT model presented here is minimally required to account for the electronic properties of ms-CT stacks. The model has one lattice mode (), one molecular mode (q) and usually a mean field approximation for Coulomb interactions. The experimental situation is far more nuanced and complex. The IR and Raman spectra of TTF-CA or of DMTTF-CA presented in the companion work by Masino et al. [25] require additional lattice phonons and more sophisticated vibrational analysis. Depending on one’s perspective, more quantitative treatment either underlines the approximate nature of the microscopic model or merely the need to introduce additional parameters. Although we have taken as few parameters as possible, there is a handful: t and , the basic parameters of the modified Hubbard model in the reduced basis, measuring the strength of electrostatic intermolecular interactions in the ionic lattice, V the electrostatic interaction between adjacent D+ and A− sites and and , the strength of the coupling of electrons to molecular and lattice modes, respectively. The model may be minimal but it is not simple and a consistent set of parameters is based on many experiments. While , V, and perhaps are in the eV scale and can be evaluated with a reasonable accuracy, NIT inherently features competition (differences) between large energies. The state of the system depends sensitively on energies (t, and ) that are an order of magnitude smaller, and still quite challenging to evaluate reliably to 10% accuracy. Nevertheless, progress with parameter evaluation is an important aspect of modeling organic solids in general that makes credible small additional adjustments for comparison with experiment.
The MHM focuses on the HOMO of D and LUMO of A in extended correlated-electron stacks. The optical CT excitation around 1 eV is polarized along the stack and is the lowest electronic excitation, but not by much; excitations polarized in the molecular plane may start around 1.5 eV. Modern treatments of systems with a few D or A moieties sometimes distinguish among electronic excitations but often do not. A more general approach to the electronic structure of an extended stack and eventually to many stacks may well be possible and even required in the future.
The NIT model that we have discussed is spectroscopic in nature. The ground state energy is a PES with a lattice and molecular coordinate, both strongly coupled to correlated electrons. The PES has a single minimum on the neutral side, two minima on the ionic side, and metastable states for very special parameter values in systems with discontinuous NIT. The PES accounts semi-quantitatively for vibrational spectra discussed in Section 4 and by Masino et al. [25]. The emergence of highly anharmonic surfaces from a purely harmonic lattice and molecular vibration is an interesting consequence of coupling to correlated electrons that are delocalized along the stack. As emphasized throughout, the model provides a unified treatment of continuous and discontinuous NIT with small changes of parameters. That is our principal result. We have invoked the excited-state PES to model the early dynamics of photoinduced NIT in TTF-CA, which speaks to the model’s robustness.
Acknowledgments
The authors thank Alberto Girlando and Matteo Masino for interesting discussions and for sharing data. Anna Painelli and Gabriele D’Avino thank Francesco Di Maiolo for useful discussions. Gabriele D’Avino thanks Matthieu J. Verstraete for fruitful collaboration on the first principles parametrization of the MHM. Work in Parma supported by the Italian Ministry of Research and Education (MIUR) through PRIN-2012T9XHH7 and by CINECA through ISCRAC-HP10CAUAMP.
Author Contributions
All authors contributed equally to this work.
Conflicts of Interest
The authors declare no conflict of interest.
References
- Dagotto, E. Complexity in Strongly Correlated Electronic Systems. Science 2005, 309, 257–262. [Google Scholar] [CrossRef] [PubMed]
- Girlando, A.; Painelli, A.; Bewick, S.A.; Soos, Z.G. Charge fluctuations and electron–phonon coupling in organic charge-transfer salts with neutral–ionic and Peierls transitions. Synth. Met. 2004, 141, 129–138. [Google Scholar] [CrossRef]
- Torrance, J.B.; Girlando, A.; Mayerle, J.J.; Crowley, J.I.; Lee, V.Y.; Batail, P.; LaPlaca, S.J. Anomalous Nature of Neutral-to-Ionic Phase Transition in Tetrathiafulvalene-Chloranil. Phys. Rev. Lett. 1981, 47, 1747–1750. [Google Scholar] [CrossRef]
- Torrance, J.B.; Vazquez, J.E.; Mayerle, J.J.; Lee, V.Y. Discovery of a Neutral-to-Ionic Phase Transition in Organic Materials. Phys. Rev. Lett. 1981, 46, 253–257. [Google Scholar] [CrossRef]
- Koshihara, S.; Tokura, Y.; Mitani, T.; Saito, G.; Koda, T. Photoinduced valence instability in the organic molecular compound tetrathiafulvalene-p-chloranil (TTF-CA). Phys. Rev. B 1990, 42, 6853–6856. [Google Scholar] [CrossRef]
- Suzuki, T.; Sakamaki, T.; Tanimura, K.; Koshihara, S.; Tokura, Y. Ionic-to-neutral phase transformation induced by photoexcitation of the charge-transfer band in tetrathiafulvalene-p-chloranil crystals. Phys. Rev. B 1999, 60, 6191–6193. [Google Scholar] [CrossRef]
- Iwai, S.; Ishige, Y.; Tanaka, S.; Okimoto, Y.; Tokura, Y.; Okamoto, H. Coherent Control of Charge and Lattice Dynamics in a Photoinduced Neutral-to-Ionic Transition of a Charge-Transfer Compound. Phys. Rev. Lett. 2006, 96, 057403. [Google Scholar] [CrossRef] [PubMed]
- Okamoto, H.; Ishige, Y.; Tanaka, S.; Kishida, H.; Iwai, S.; Tokura, Y. Photoinduced phase transition in tetrathiafulvalene-p-chloranil observed in femtosecond reflection spectroscopy. Phys. Rev. B 2004, 70, 165202. [Google Scholar] [CrossRef]
- Collet, E.; Lemée-Cailleau, M.H.; Buron-Le Cointe, M.; Cailleau, H.; Wulff, M.; Luty, T.; Koshihara, S.Y.; Meyer, M.; Toupet, L.; Rabiller, P.; et al. Laser-Induced Ferroelectric Structural Order in an Organic Charge-Transfer Crystal. Science 2003, 300, 612–615. [Google Scholar] [CrossRef] [PubMed]
- Horiuchi, S.; Okimoto, Y.; Tokura, R.K. Quantum Phase Transition in Organic Charge-Transfer Complexes. Science 2003, 299, 229–232. [Google Scholar] [CrossRef] [PubMed]
- Horiuchi, S.; Kobayashi, K.; Kumai, R.; Minami, N.; Kagawa, F.; Tokura, Y. Quantum ferroelectricity in charge-transfer complex crystals. Nat. Commun. 2015, 6, 7469. [Google Scholar] [CrossRef] [PubMed]
- Kagawa, F.; Horiuchi, S.; Tokura, Y. Quantum Phenomena Emerging Near a Ferroelectric Critical Point in a Donor–Acceptor Organic Charge-Transfer Complex. Crystals 2017, 7, 106. [Google Scholar] [CrossRef]
- Horiuchi, S.; Tokura, Y. Organic ferroelectrics. Nat. Mater. 2008, 7, 357–366. [Google Scholar] [CrossRef] [PubMed]
- DelFreo, L.; Painelli, A.; Soos, Z.G. Giant Infrared Intensity of the Peierls Mode at the Neutral-Ionic Phase Transition. Phys. Rev. Lett. 2002, 89, 027402. [Google Scholar] [CrossRef] [PubMed]
- Soos, Z.G.; Bewick, S.A.; Peri, A.; Painelli, A. Dielectric response of modified Hubbard models with neutral-ionic and Peierls transitions. J. Chem. Phys. 2004, 120, 6712–6720. [Google Scholar] [CrossRef] [PubMed]
- D’Avino, G.; Girlando, A.; Painelli, A.; Lemée-Cailleau, M.H.; Soos, Z.G. Anomalous Dispersion of Optical Phonons at the Neutral-Ionic Transition: Evidence from Diffuse X-Ray Scattering. Phys. Rev. Lett. 2007, 99, 156407. [Google Scholar] [CrossRef] [PubMed]
- D’Avino, G.; Grisanti, L.; Guasch, J.; Ratera, I.; Veciana, J.; Painelli, A. Bistability in Fc-PTM Crystals: The Role of Intermolecular Electrostatic Interactions. J. Am. Chem. Soc. 2008, 130, 12064–12072. [Google Scholar] [CrossRef] [PubMed]
- Guasch, J.; Grisanti, L.; Jung, S.; Morales, D.; D’Avino, G.; Souto, M.; Fontrodona, X.; Painelli, A.; Renz, F.; Ratera, I.; et al. Bistability of Fc-PTM-Based Dyads: The Role of the Donor Strength. Chem. Mater. 2013, 25, 808–814. [Google Scholar] [CrossRef]
- Masino, M.; Girlando, A.; Brillante, A.; Valle, R.G.D.; Venuti, E. High-pressure Optical Study of the Neutral-Ionic Phase Transition in TTF-CA. Mater. Sci. Pol. 2004, 22, 333–337. [Google Scholar]
- Soos, Z.G.; Painelli, A. Metastable domains and potential energy surfaces in organic charge-transfer salts with neutral-ionic phase transitions. Phys. Rev. B 2007, 75, 155119. [Google Scholar] [CrossRef]
- Tokura, Y. Photoinduced Phase Transition: A Tool for Generating a Hidden State of Matter. J. Phys. Soc. Jpn. 2006, 75, 011001. [Google Scholar] [CrossRef]
- Painelli, A.; Girlando, A. Zero-temperature phase diagram of mixed-stack charge-transfer crystals. Phys. Rev. B 1988, 37, 5748–5760. [Google Scholar] [CrossRef]
- D’Avino, G.; Masino, M.; Girlando, A.; Painelli, A. Correlated electrons in soft lattices: Raman scattering evidence of the nonequilibrium dielectric divergence at the neutral-ionic phase transition. Phys. Rev. B 2011, 83, 161105. [Google Scholar] [CrossRef]
- Cavatorta, L.; Painelli, A.; Soos, Z.G. Coherent excitations at the neutral-ionic transition: Femtosecond dynamics on diabatic potential energy surfaces. Phys. Rev. B 2015, 91, 17430. [Google Scholar] [CrossRef]
- Masino, M.; Castagnetti, N.; Girlando, A. Phenomenology of the Neutral-Ionic Valence Instability in Mixed Stack Charge-Transfer Crystals. Crystals 2017, 7, 108. [Google Scholar] [CrossRef]
- Soos, Z.G.; Keller, H.J.; Moroni, W.; Nöthe, D. Phenazine Cation Radical Salts: Charge Transfer Complexes with TCNQ. N. Y. Acad. Sci. 1978, 313, 442–457. [Google Scholar] [CrossRef]
- Strebel, P.J.; Soos, Z.G. Theory of Charge Transfer in Aromatic Donor–Acceptor Crystals. J. Chem. Phys. 1970, 53, 4077–4090. [Google Scholar] [CrossRef]
- Soos, Z.G.; Harding, R.H.; Ramasesha, S. Charge-Transfer Excitations In Partly-Ionic Complexes. Mol. Cryst. Liq. Cryst. 1985, 125, 59–70. [Google Scholar] [CrossRef]
- Soos, Z.G.; Mazumdar, S. Neutral-ionic interface in organic charge-transfer salts. Phys. Rev. B 1978, 18, 1991–2003. [Google Scholar] [CrossRef]
- Soos, Z.G.; Ramasesha, S. Diagrammatic valence bond theory. In Valence Bond Theory and Chemical Structure; Klein, D.J., Trinajstic, N., Eds.; Elsevier: New York, NY, USA, 1990; pp. 81–109. [Google Scholar]
- Girlando, A.; Painelli, A. Regular-dimerized stack and neutral-ionic interfaces in mixed-stack organic charge-transfer crystals. Phys. Rev. B 1986, 34, 2131–2139. [Google Scholar] [CrossRef]
- Anusooya-Pati, Y.; Soos, Z.G.; Painelli, A. Symmetry crossover and excitation thresholds at the neutral-ionic transition of the modified Hubbard model. Phys. Rev. B 2001, 63, 205118. [Google Scholar] [CrossRef]
- Resta, R. Macroscopic polarization in crystalline dielectrics: the geometric phase approach. Rev. Mod. Phys. 1994, 66, 899–915. [Google Scholar] [CrossRef]
- Resta, R.; Sorella, S. Electron Localization in the Insulating State. Phys. Rev. Lett. 1999, 82, 370–373. [Google Scholar] [CrossRef]
- Kumar, M.; Ramasesha, S.; Soos, Z.G. Quantum phase diagram of one-dimensional spin and Hubbard models with transitions to bond order wave phases. Croat. Chem. Acta 2013, 86, 407–417. [Google Scholar] [CrossRef]
- Okamoto, K.; Nomura, K. Fluid-dimer critical point in S = 1/2 antiferromagnetic Heisenberg chain with next nearest neighbor interactions. Phys. Lett. A 1992, 169, 433–437. [Google Scholar] [CrossRef]
- Affleck, I.; Kennedy, T.; Lieb, E.H.; Tasaki, H. Valence bond ground states in isotropic quantum antiferromagnets. Comm. Math. Phys. 1988, 115, 477–528. [Google Scholar] [CrossRef]
- Soos, Z.G.; Parvej, A.; Kumar, M. Numerical study of incommensurate and decoupled phases of spin-1/2 chains with isotropic exchange J1, J2 between first and second neighbors. J. Phys. Condens. Matter 2016, 28, 175603. [Google Scholar] [CrossRef] [PubMed]
- Nakamura, M. Tricritical behavior in the extended Hubbard chains. Phys. Rev. B 2000, 61, 16377–16392. [Google Scholar] [CrossRef]
- Sengupta, P.; Sandvik, A.W.; Campbell, D.K. Bond-order-wave phase and quantum phase transitions in the one-dimensional extended Hubbard model. Phys. Rev. B 2002, 65, 155113. [Google Scholar] [CrossRef]
- Kumar, M.; Soos, Z.G. Bond-order wave phase of the extended Hubbard model: Electronic solitons, paramagnetism, and coupling to Peierls and Holstein phonons. Phys. Rev. B 2010, 82, 155144. [Google Scholar] [CrossRef]
- Painelli, A.; Girlando, A. Mixed regular stack charge–transfer crystals: Fundamental microscopic parameters from optical spectra. J. Chem. Phys. 1987, 87, 1705–1711. [Google Scholar] [CrossRef]
- Heeger, A.J.; Kivelson, S.; Schrieffer, J.R.; Su, W.P. Solitons in conducting polymers. Rev. Mod. Phys. 1988, 60, 781–850. [Google Scholar] [CrossRef]
- Bray, J.; Interrante, L.; Jacobs, I.; Bonner, J. The spin-Peierls transition. In Extended Linear Chain Compounds; Miller, J., Ed.; Plenum Press: New York, NY, USA, 1983; Volume 3, pp. 353–416. [Google Scholar]
- Soos, Z.; Bewick, S. Real-space treatment of spin-Peierls transitions: Gap equation and magnetic crossover of the linear Heisenberg antiferromagnet. Chem. Phys. Lett. 2006, 421, 210–214. [Google Scholar] [CrossRef]
- Su, W.P.; Schrieffer, J.R.; Heeger, A.J. Solitons in Polyacetylene. Phys. Rev. Lett. 1979, 42, 1698–1701. [Google Scholar] [CrossRef]
- Nagaosa, N.; Takimoto, J.I. Theory of Neutral-Ionic Transition in Organic Crystals. I. Monte Carlo Simulation of Modified Hubbard Model. J. Phys. Soc. Jpn. 1986, 55, 2735–2744. [Google Scholar] [CrossRef]
- Nagaosa, N.; Takimoto, J.I. Theory of Neutral-Ionic Transition in Organic Crystals. II. Effect of intersite Coulomb interactions. J. Phys. Soc. Jpn. 1986, 55, 2745–2753. [Google Scholar] [CrossRef]
- Nagaosa, N. Theory of Neutral-Ionic Transition in Organic Crystals. III. Effect of the electron-lattice interaction. J. Phys. Soc. Jpn. 1986, 55, 2754–2764. [Google Scholar] [CrossRef]
- Avignon, M.; Balseiro, C.A.; Proetto, C.R.; Alascio, B. Neutral-ionic transition and dimerization in organic mixed-stack compounds. Phys. Rev. B 1986, 33, 205–209. [Google Scholar] [CrossRef]
- Girlando, A.; Pecile, C.; Torrance, J. A key to understanding ionic mixed stacked organic solids: Tetrathiafulvalene-bromanil (TTF-BA). Solid State Commun. 1985, 54, 753–759. [Google Scholar] [CrossRef]
- Kagawa, F.; Horiuchi, S.; Tokunaga, M.; Fujioka, J.; Tokura, Y. Ferroelectricity in a one-dimensional organic quantum magnet. Nat. Phys. 2010, 6, 169–172. [Google Scholar] [CrossRef]
- Soos, Z.G.; Keller, H.J.; Ludolf, K.; Queckbörner, J.; Wehe, D.; Flandrois, S. Ionicity and paramagnetism of strong organic charge-transfer complexes. J. Chem. Phys. 1981, 74, 5287–5294. [Google Scholar] [CrossRef]
- Meneghetti, M.; Girlando, A.; Pecile, C. Ionicity and electron molecular vibration interaction in mixed stack CT systems: M2P–TCNQ and M2P–TCNQF4. J. Chem. Phys. 1985, 83, 3134–3145. [Google Scholar] [CrossRef]
- Bewick, S.A.; Soos, Z.G. Spin solitons in organic charge-transfer salts. Chem. Phys. 2006, 325, 60–70. [Google Scholar] [CrossRef]
- Resta, R. Theory of the electric polarization in crystals. Ferroelectrics 1992, 136, 51–55. [Google Scholar] [CrossRef]
- King-Smith, R.D.; Vanderbilt, D. Theory of polarization of crystalline solids. Phys. Rev. B 1993, 47, 1651–1654. [Google Scholar] [CrossRef]
- Painelli, A.; Soos, Z.G. Polarization and Polarizability in Extended One-dimensional Organic Materials. Chem. Phys. 2006, 325, 48–59. [Google Scholar] [CrossRef]
- Resta, R. Quantum-Mechanical Position Operator in Extended Systems. Phys. Rev. Lett. 1998, 80, 1800–1803. [Google Scholar] [CrossRef]
- Kobayashi, K.; Horiuchi, S.; Kumai, R.; Kagawa, F.; Murakami, Y.; Tokura, Y. Electronic Ferroelectricity in a Molecular Crystal with Large Polarization Directing Antiparallel to Ionic Displacement. Phys. Rev. Lett. 2012, 108, 237601. [Google Scholar] [CrossRef] [PubMed]
- D’Avino, G.; Verstraete, M.J. Are Hydrogen-Bonded Charge Transfer Crystals Room Temperature Ferroelectrics? Phys. Rev. Lett. 2014, 113, 237602. [Google Scholar] [CrossRef] [PubMed]
- Nunes, R.W.; Gonze, X. Berry-phase treatment of the homogeneous electric field perturbation in insulators. Phys. Rev. B 2001, 63, 155107. [Google Scholar] [CrossRef]
- Horiuchi, S.; Okimoto, Y.; Kumai, R.; Tokura, Y. Ferroelectric Valence Transition and Phase Diagram of a Series of Charge-Transfer Complexes of 4,4’-Dimethyltetrathiafulvalene and Tetrahalo-p-benzoquinones. J. Am. Chem. Soc. 2001, 123, 665–670. [Google Scholar] [CrossRef] [PubMed]
- Girlando, A.; Painelli, A.; Pecile, C.; Calestani, G.; Rizzoli, C.; Metzger, R.M. Ground state optical properties of charge transfer crystals close to the neutral-ionic interface: Tetrathiafulvalene-2,5dichloro-p-benzoquinone. J. Chem. Phys. 1993, 98, 7692–7698. [Google Scholar] [CrossRef]
- Gordon, R.G. Correlation Functions for Molecular Motion. Adv. Magn. Reson. 1968, 3, 1–42. [Google Scholar]
- Ranzieri, P.; Masino, M.; Girlando, A.; Lemée-Cailleau, M.H. Temperature-induced valence and structural instability in DMTTF-CA: Single-crystal Raman and infrared measurements. Phys. Rev. B 2007, 76, 134115. [Google Scholar] [CrossRef]
- Girlando, A.; Masino, M.; Painelli, A.; Drichko, N.; Dressel, M.; Brillante, A.; Della Valle, R.G.; Venuti, E. Direct evidence of overdamped Peierls-coupled modes in the temperature-induced phase transition in tetrathiafulvalene-chloranil. Phys. Rev. B 2008, 78, 045103. [Google Scholar] [CrossRef]
- Miyamoto, T.; Kimura, K.; Hamamoto, T.; Uemura, H.; Yada, H.; Matsuzaki, H.; Horiuchi, S.; Okamoto, H. Measurement of a Photoinduced Transition from a Nonordered Phase to a Transient Ordered Phase in the Organic Quantum-Paraelectric Compound dimethyltetrathiafulvalene-dibromodichloro-p-benzoquinone Using Femtosecond Laser Irradiation. Phys. Rev. Lett. 2013, 111, 187801. [Google Scholar] [CrossRef] [PubMed]
- Masino, M.; Girlando, A.; Soos, Z.G. Evidence for a soft mode in the temperature induced neutral-ionic transition of TTF-CA. Chem. Phys. Lett. 2003, 369, 428–433. [Google Scholar] [CrossRef]
- Yonemitsu, K. Effects of Lattice and Molecular Phonons on Photoinduced Neutral-to-Ionic Transition Dynamics in Tetrathiafulvalene-p-chloranil. J. Phys. Soc. Jpn. 2011, 80, 084707. [Google Scholar] [CrossRef]
- Yonemitsu, K. Theory of Photoinduced Phase Transitions in Molecular Conductors: Interplay Between Correlated Electrons, Lattice Phonons and Molecular Vibrations. Crystals 2012, 2, 56–77. [Google Scholar] [CrossRef]
- Uemura, H.; Okamoto, H. Direct Detection of the Ultrafast Response of Charges and Molecules in the Photoinduced Neutral-to-Ionic Transition of the Organic Tetrathiafulvalene-p-Chloranil Solid. Phys. Rev. Lett. 2010, 105, 258302. [Google Scholar] [CrossRef] [PubMed]
- Painelli, A.; Terenziani, F. Multielectron Transfer in Clusters of Polar-Polarizable Chromophores. J. Am. Chem. Soc. 2003, 125, 5624–5625. [Google Scholar] [CrossRef] [PubMed]
- Terenziani, F.; Painelli, A. Supramolecular interactions in clusters of polar and polarizable molecules. Phys. Rev. B 2003, 68, 165405. [Google Scholar] [CrossRef]
- Painelli, A.; Terenziani, F.; Soos, Z.G. Electron-transfer in molecular functional materials. Theor. Chem. Acc. 2007, 117, 915. [Google Scholar] [CrossRef]
- Miyamoto, T.; Uemura, H.; Okamoto, H. Role of Coulomb Interactions and Spin-Peierls Dimerizations in Neutral-to-Ionic Phase Transition Investigated by Femtosecond Reflection Spectroscopy. J. Phys. Soc. Jpn. 2012, 81, 073703. [Google Scholar] [CrossRef]
- Delchiaro, F.; Girlando, A.; Painelli, A.; Bandyopadhyay, A.; Pati, S.K.; D’Avino, G. Towards first-principles prediction of valence instabilities in mixed stack charge-transfer crystals. Phys. Rev. B 2017, 95, 155125. [Google Scholar] [CrossRef]
- D’Avino, G.; Muccioli, L.; Castet, F.; Poelking, C.; Andrienko, D.; Soos, Z.G.; Cornil, J.; Beljonne, D. Electrostatic phenomena in organic semiconductors: fundamentals and implications for photovoltaics. J. Phys. Condens. Matter 2016, 28, 433002. [Google Scholar] [CrossRef] [PubMed]
- Girlando, A.; Painelli, A.; Pecile, C. TMPD–CA revisited: Ionicity, stack dimerization, and phase transition of a key mixed stack charge transfer crystal. Mol. Cryst. Liq. Cryst. 1984, 112, 325. [Google Scholar] [CrossRef]
Figure 1.
Left panel: the dimer model. The black line shows the curve for an isolated DA dimer (). Blue and red lines refer to dimers embedded in a mean field lattice with = 2 and 6, respectively. The dotted portion of the red line marks the region of positive slope, corresponding to unstable states. Right panel: the MHM (see Section 2.2 and Section 2.3). The black curve shows the curve for the infinite chain (, the same as the black curve in panel a of Figure 2). Blue and red lines refer to mean field results obtained accounting for electrostatic intermolecular interaction with 1.2 and 5, respectively. The dotted portion of the red curve marks the region of positive slope, corresponding to unstable states. In both panels the dotted vertical line is the Maxwell construction.

Figure 2.
The NIT of the MHM with rigid lattice. (a) the ionicity calculated as a function of for 1D stacks with periodic boundary conditions. Blue lines refer to (dotted, dashed and continuous lines refer to , 12 and 16, respectively); red lines correspond to results (dotted, dashed and continuous lines refer to , 10 and 14, respectively). The black line is the infinite chain result taken as the 14 and 16 sites average. (b) The polarizability and (c) the absolute value of (see Equation (6)). The vertical dashed lines drawn across the panels marks the crossover at .
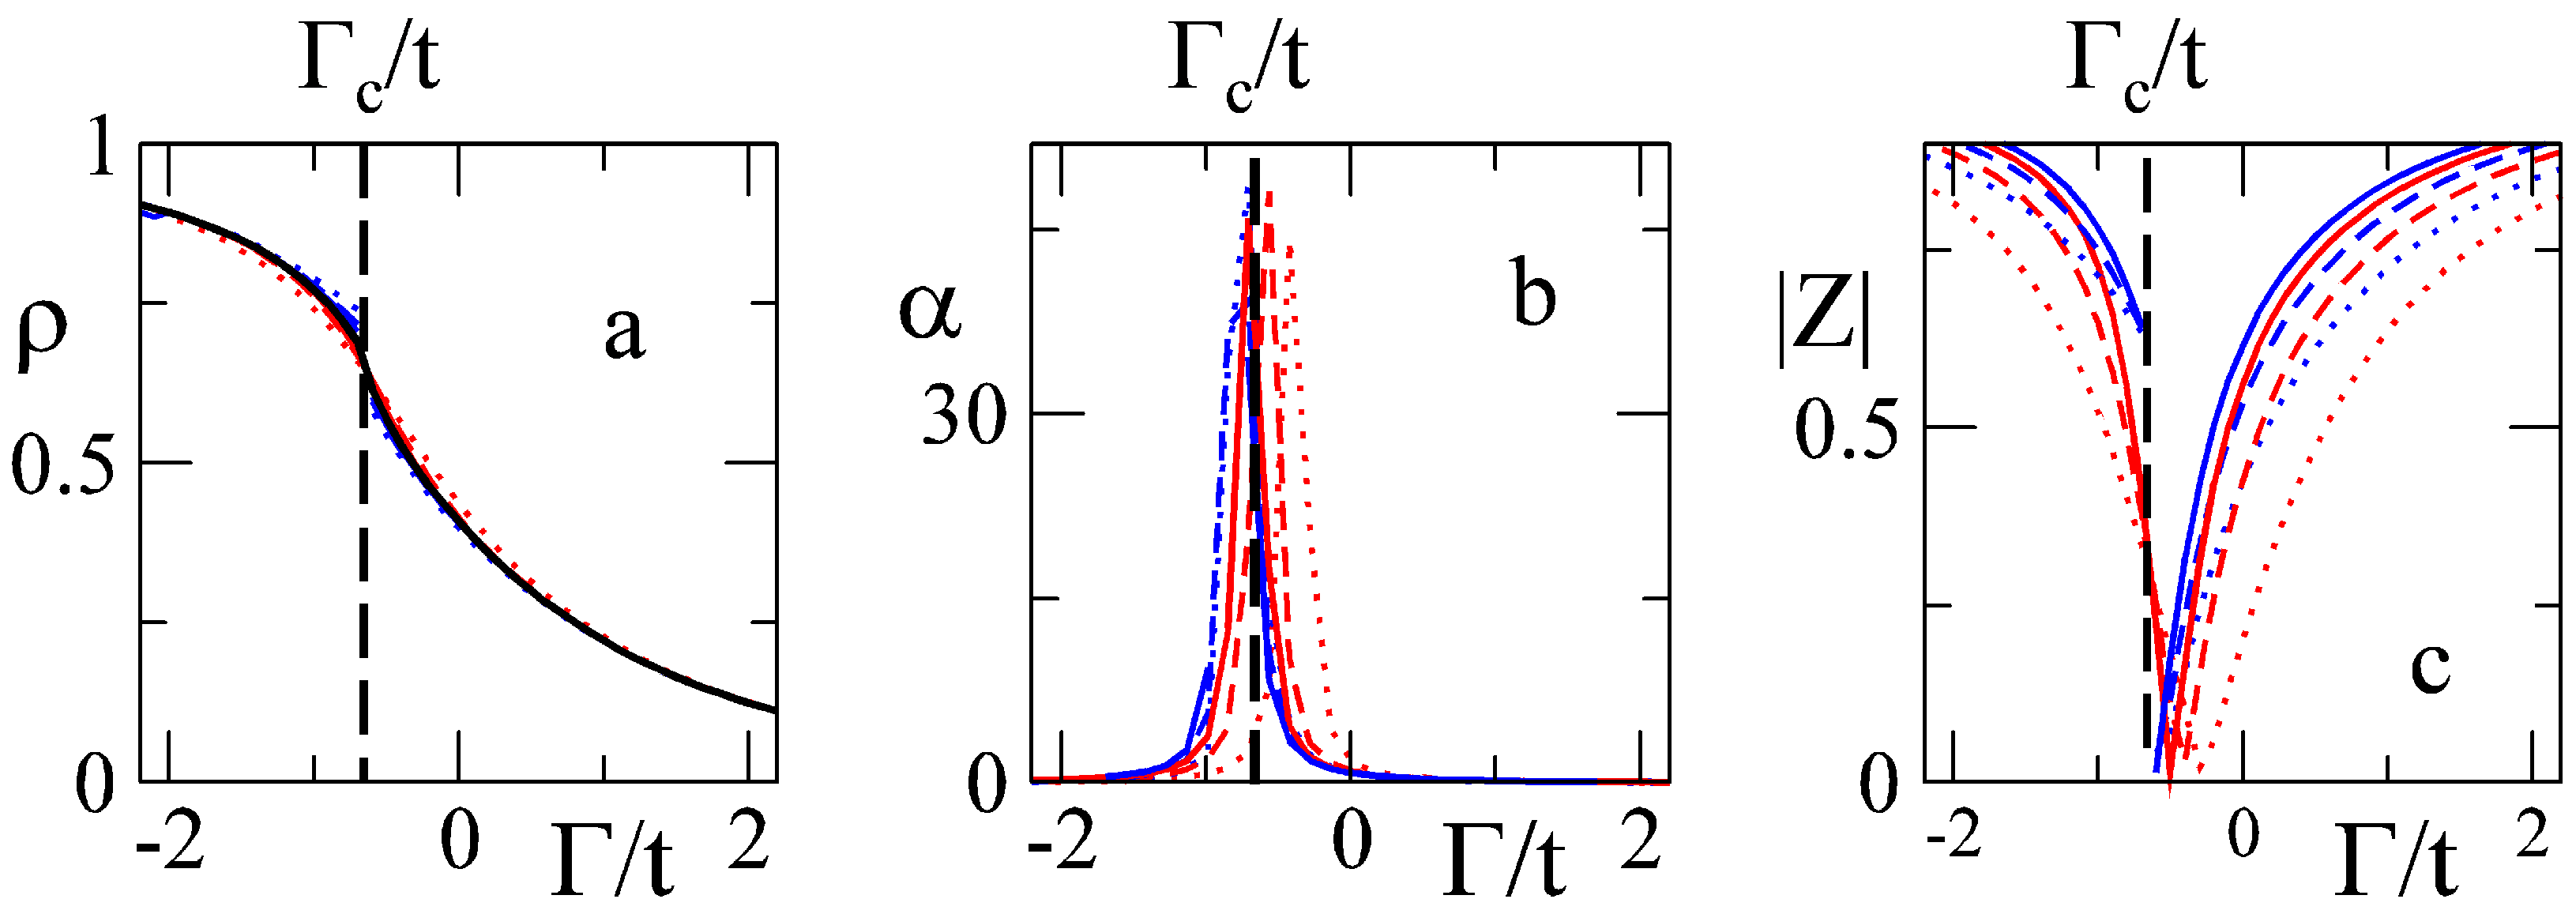
Figure 3.
(a) Ground state electronic polarization of the MHM calculated with Equation (11) as a function of the parameters and . The discontinuity across for equals the polarization quantum and is not physically meaningful. (b) Differential polarization calculated for each value of , corresponding to the physically meaningful polarization. (c,d) scans for fixed value of one of the two parameters. The polarization is expressed in units per lattice site.

Figure 4.
Electronic polarizability of the MHM as a function of the parameters and . The polarizability diverges at in the regular chain () and this singularity is lifted at finite . is expressed in units per lattice site.
Figure 4.
Electronic polarizability of the MHM as a function of the parameters and . The polarizability diverges at in the regular chain () and this singularity is lifted at finite . is expressed in units per lattice site.

Figure 5.
Discontinuous NIT as described by the mean field approximation to , Equation (10), with t = 0.21 eV, and , , [22,42,64]. (a,b) show the equilibrium dimerization and ionicity as a function of , respectively. The two phases are shown with different symbols for clarity. Dotted lines mark the limits of the bistability region. Arrows in panel a mark the values corresponding to the PESs shown as isolines (c–e) or surface plot (f). Minima corresponding N-regular and I-dimerized phases are shown as blue and red circles, respectively. Results from Ref. [20].

Figure 6.
Continuous NIT as described by the mean field approximation to , Equation (10), with parameters of Figure 5, except . (a,b) show the equilibrium dimerization and ionicity as a function of , respectively. Arrows in panel a mark the values corresponding to the PESs shown as isolines (c–e) or surface plot (f). Minima corresponding N-regular and I-dimerized phases are shown as blue and red circles, respectively. The PES in panel e and f is flat around equilibrium and has no single minimum. Results from Ref. [20].
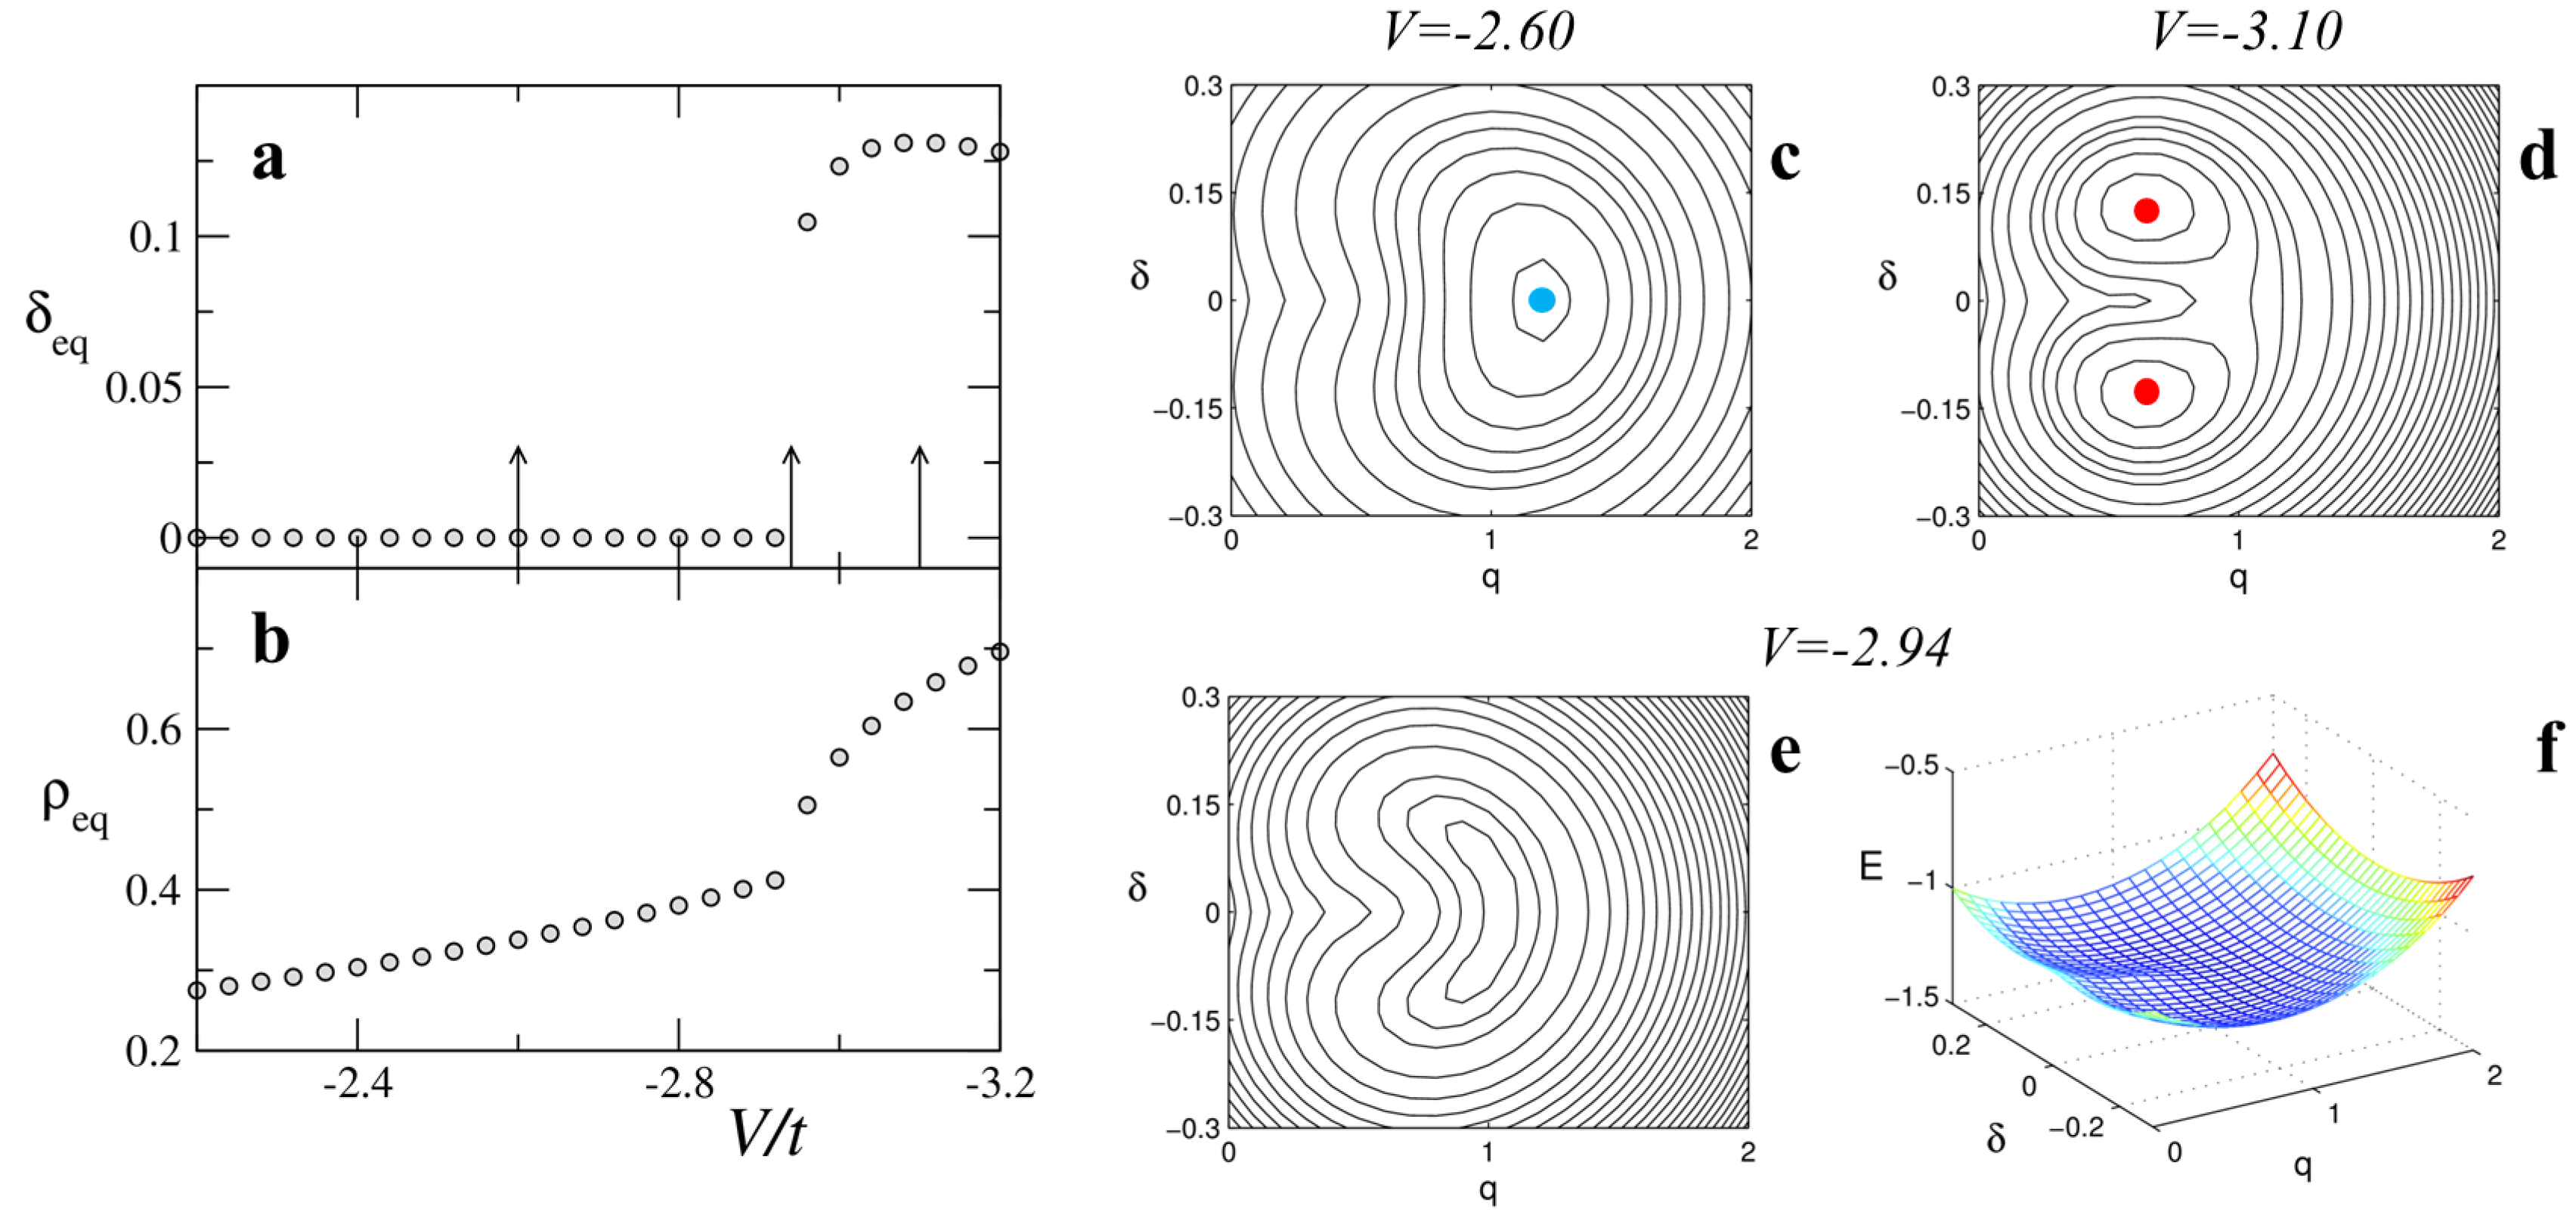
Figure 7.
Calculated Raman spectra polarized perpendicular to the stack axis (black curves) and IR spectra polarized parallel to the stack axis (red curves) for the continuous NIT of DMTTF-CA [23]. The inset shows the empirical relationship. The simulated temperature evolution of the calculated spectra [23] compare very well with experimental data in Ref. [66].
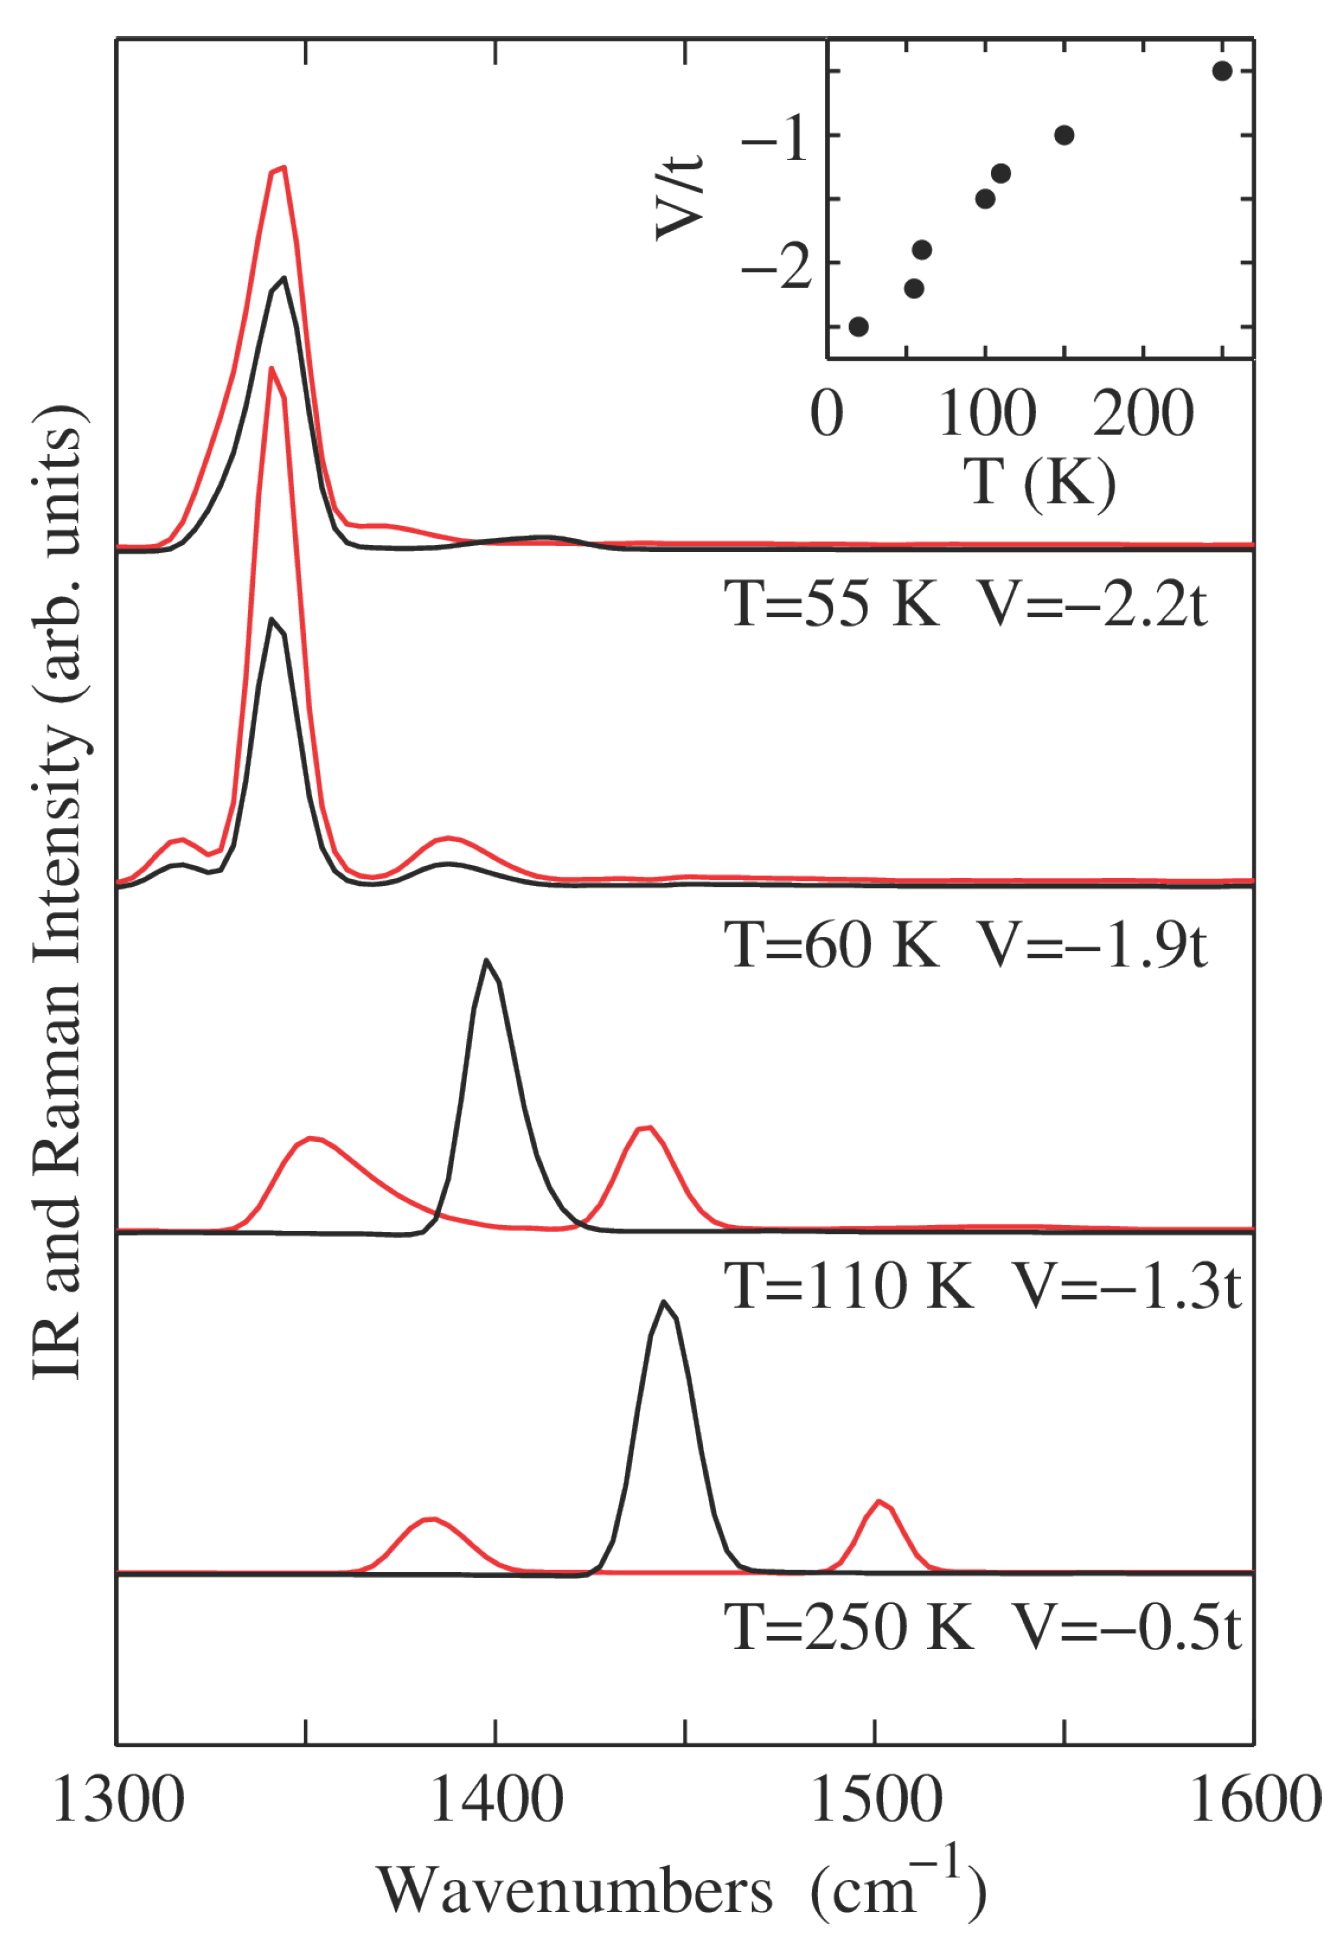
Figure 8.
(a) Temperature evolution of calculated IR spectra polarized parallel to the stack axis in the lattice phonon region. (b) Integrated intensity of IR spectra over the 0–100 cm interval (spectral weight, S.W.). The dashed line marks K. (c) surface (color map) with PES isolines drawn at energy values of and from the PES minimum (cross), calculated for and K. (d) Same as (c) for and K.

Figure 9.
(a) Calculated Raman spectra polarized parallel to the stack axis as a function of V and T. Each spectrum has been rescaled by the value annotated for graphical reasons. (b) Integrated intensity of Raman spectra over the 0–150 cm interval (spectral weight, S.W.). The dashed line marks K. (c) surface (log-scale color map) with PES isolines drawn at energy values of and from the PES minimum (cross), calculated for and K. (d) Same as (c) for and K.

Figure 10.
Left panel: Adiabatic ground and first excited state PES in the tristability region. The G-PES is shown as contour lines, the E-PES as a semi-transparent surface. The vertical arrow marks the CT absorption induced by an ultrafast pump pulse. Middle panel: Portions of the G-PES and E-PES cut along the minimum energy gap that vanishes at the conical intersection (red dot). Right panel: diabatic PES relevant to the I dimerized phase, obtained on smoothing the cut in the middle panel.
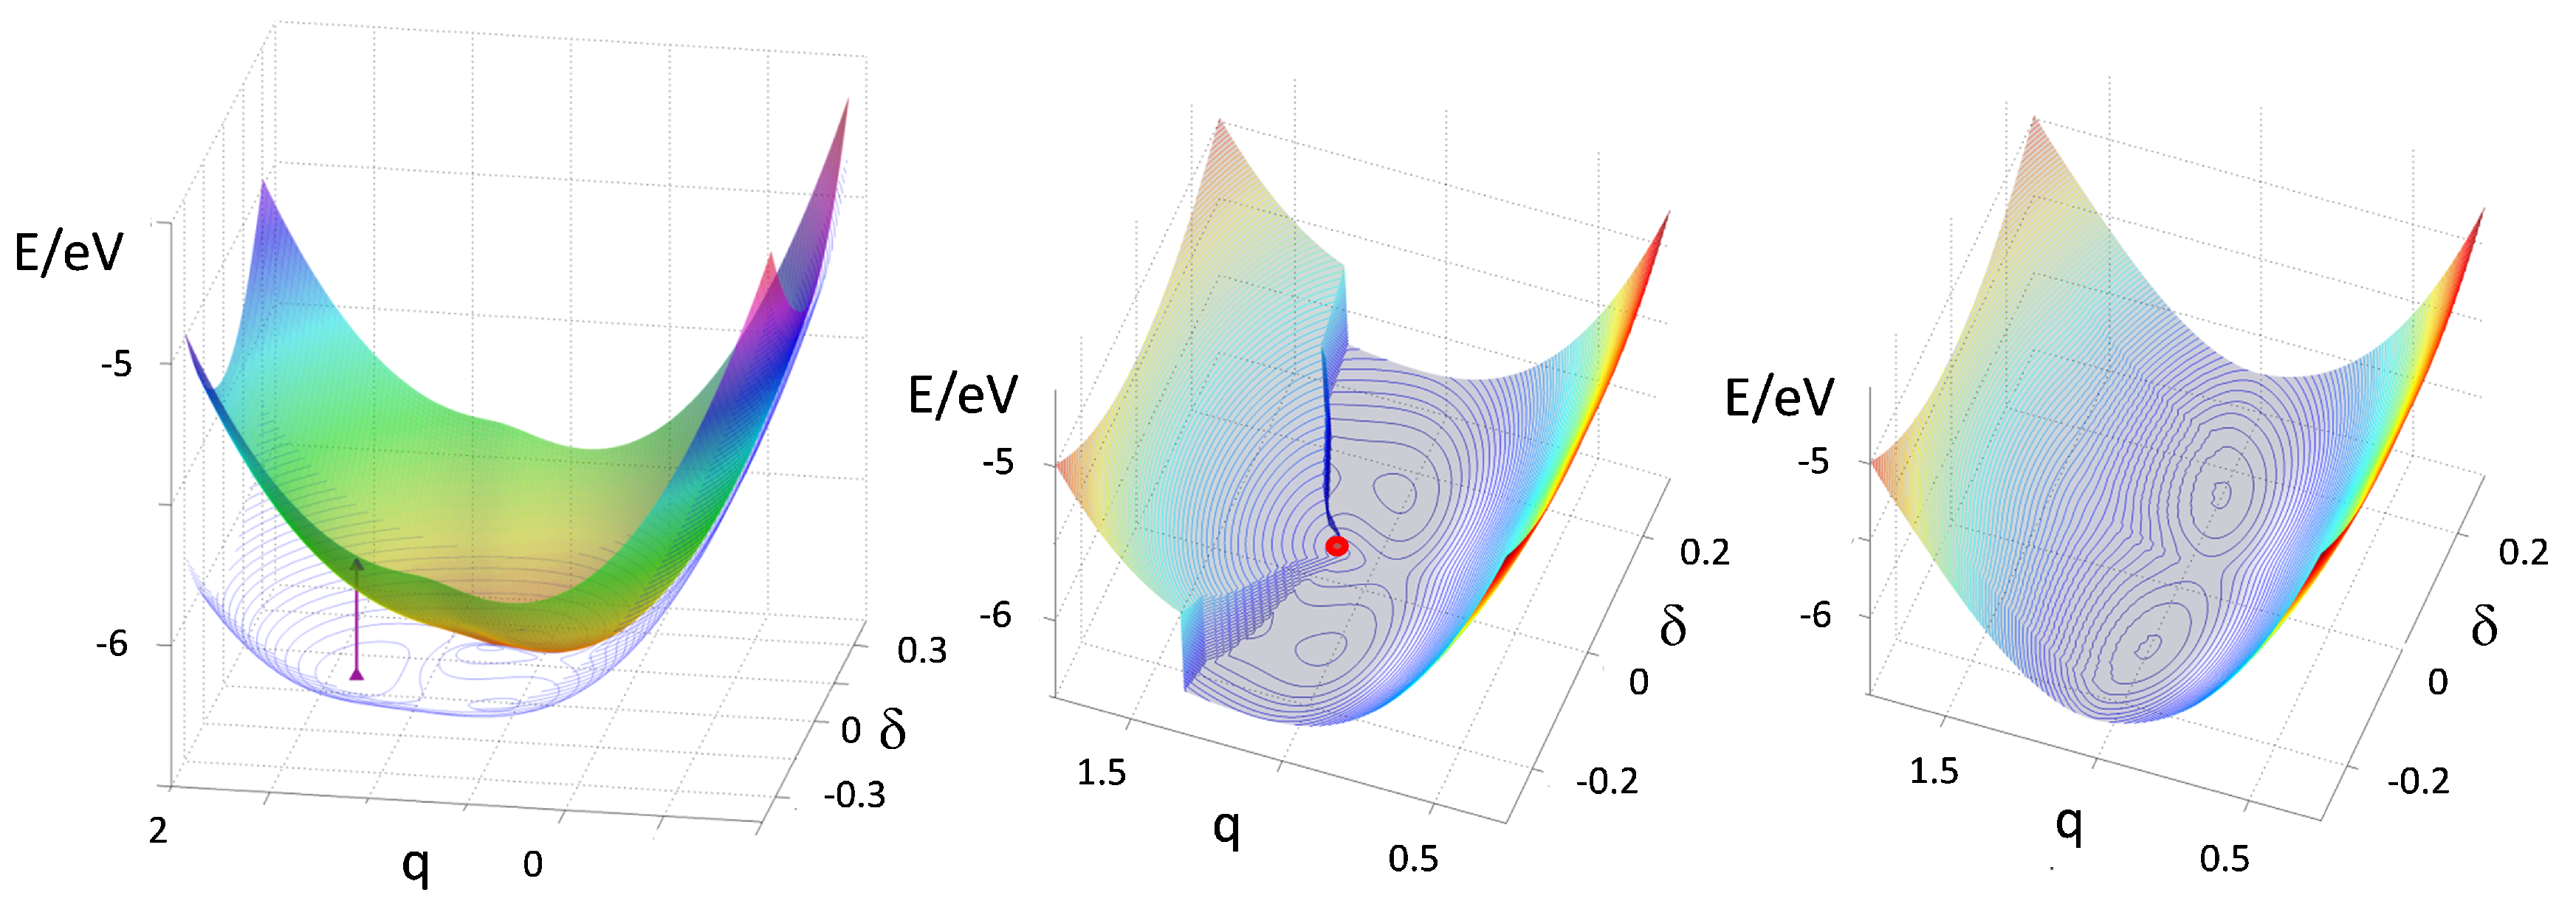
Figure 11.
The early time dynamics of the metastable I phase reached upon photoexcitation from the N ground state. (a) Sketch of the dynamics following impulsive excitation; (b) Fourier transform of ; (c) Fourier transform of , the inset shows the corresponding spectrogram; (d) the temporal evolution of the ionicity, the inset shows the spectrogram associated with the Fourier transform of shown in panel (e). Fourier transforms are shown as power spectra.

Figure 12.
Temperature-induced NIT of TTF-CA as described by the first principles-parametrized MHM. The different panels show the evolution with T of (a) the Madelung energy, (b) the MHM ground state energy per molecule and (c) the ionicity. Black circles correspond to MHM ground state data for parameters evaluated at the experimental crystal structures, black lines are diagonalization results for interpolated values of the parameters. Red and blue lines refer to the metastable neutral and ionic state, respectively. The green line is the experimental ionicity from carbonyl stretching, the vertical dashed lines mark the experimental transition temperature. Data from Ref. [61].

© 2017 by the authors. Licensee MDPI, Basel, Switzerland. This article is an open access article distributed under the terms and conditions of the Creative Commons Attribution (CC BY) license (http://creativecommons.org/licenses/by/4.0/).
Share and Cite
MDPI and ACS Style
D’Avino, G.; Painelli, A.; Soos, Z.G. Modeling the Neutral-Ionic Transition with Correlated Electrons Coupled to Soft Lattices and Molecules. Crystals 2017, 7, 144. https://doi.org/10.3390/cryst7050144
AMA Style
D’Avino G, Painelli A, Soos ZG. Modeling the Neutral-Ionic Transition with Correlated Electrons Coupled to Soft Lattices and Molecules. Crystals. 2017; 7(5):144. https://doi.org/10.3390/cryst7050144
Chicago/Turabian StyleD’Avino, Gabriele, Anna Painelli, and Zoltán G. Soos. 2017. "Modeling the Neutral-Ionic Transition with Correlated Electrons Coupled to Soft Lattices and Molecules" Crystals 7, no. 5: 144. https://doi.org/10.3390/cryst7050144
Note that from the first issue of 2016, this journal uses article numbers instead of page numbers. See further details here.