
Spark Plasma Sintering of Tungsten Oxides WOx (2.50 ≤ x ≤ 3): Phase Analysis and Thermoelectric Properties
by

Felix Kaiser
1,*, 
Paul Simon
1,
Ulrich Burkhardt
1,
Bernd Kieback
2,
Yuri Grin
1 and
Igor Veremchuk
1,* 1
Max-Planck-Institut für Chemische Physik fester Stoffe, 01187 Dresden, Germany
2
Fraunhofer Institut für Fertigungstechnik und Angewandte Materialforschung, 01277 Dresden, Germany
*
Authors to whom correspondence should be addressed.
Crystals 2017, 7(9), 271; https://doi.org/10.3390/cryst7090271
Submission received: 26 July 2017
/
Revised: 21 August 2017
/
Accepted: 23 August 2017
/
Published: 5 September 2017
(This article belongs to the Special Issue Materials Processing and Crystal Growth for Thermoelectrics)
Abstract
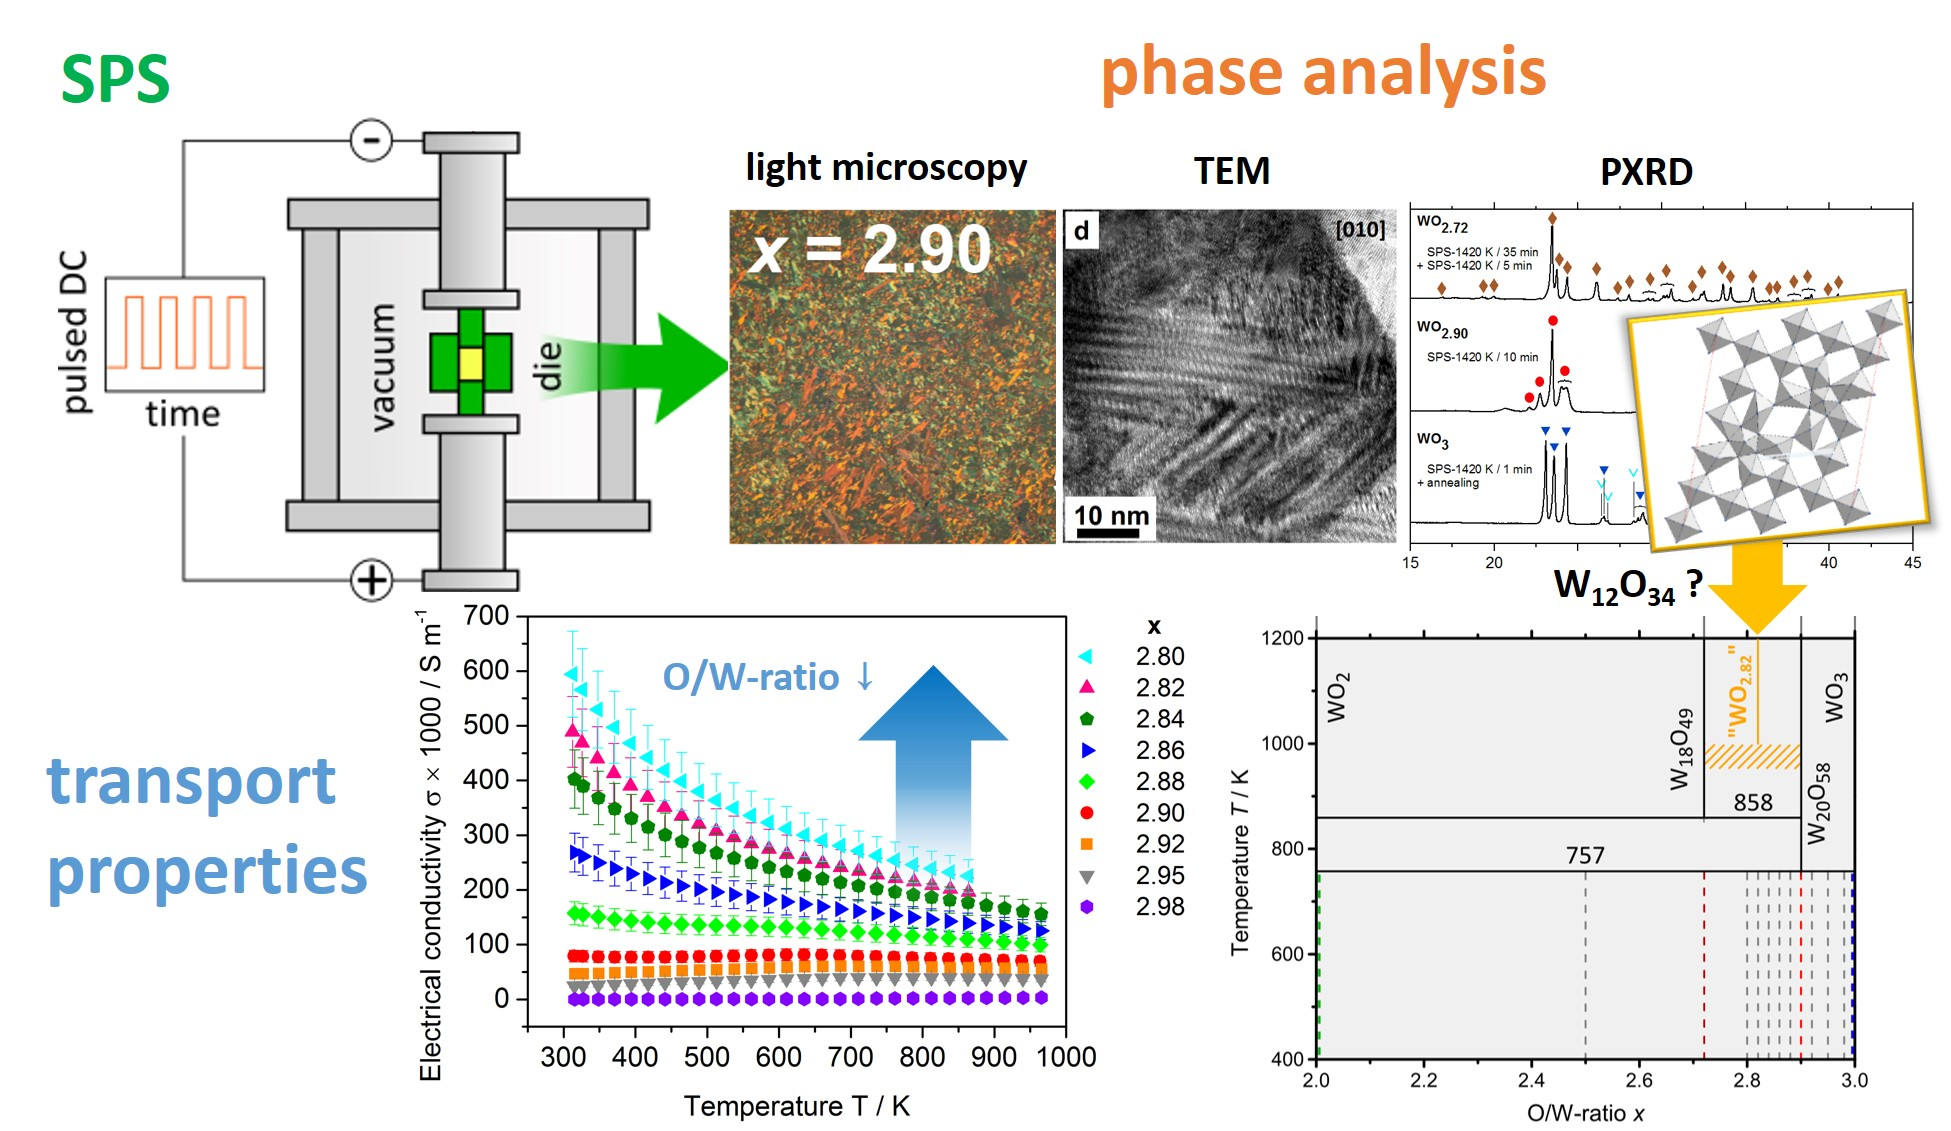
:The solid-state reaction of WO3 with W was studied in order to clarify the phase formation in the binary system W-O around the composition WOx (2.50 ≤ x ≤ 3) during spark plasma sintering (SPS). A new phase “WO2.82” is observed in the range 2.72 ≤ x ≤ 2.90 which might have the composition W12O34. The influence of the composition on the thermoelectric properties was investigated for 2.72 ≤ x ≤ 3. The Seebeck coefficient, electrical conductivity and electronic thermal conductivity are continuously tunable with the oxygen-to-tungsten ratio. The phase formation mainly affects the lattice thermal conductivity κlat which is significantly reduced until 700 K for the sample with the composition x = 2.84, which contains the phases W18O49 and “WO2.82”. In single-phase WO2.90 and multi-phase WOx materials (2.90 ≤ x ≤ 3), which contain crystallographic shear plane phases, a similar reduced κlat is observed only below 560 K and 550 K, respectively. Therefore, the composition range x < 2.90 in which the pentagonal column structural motif is formed might be more suitable for decreasing the lattice thermal conductivity at high temperatures.

1. Introduction
Transition metal oxides (TMOs) are under debate for high-temperature thermoelectric (TE) applications since NaCo2O4 was found to be a p-type material with a thermopower α as high as 100 µV·K−1 at 300 K [1]. By now, TMOs are subject of in-depth investigations [2,3,4] in particular because there is still a lack of appropriate n-type counterparts, although lanthanum-doped SrTiO3 [5], ZnO [6] or doped TiO2−x [7,8,9] show promising results.
The enhancement of a TE material’s figure-of-merit ZT (Equation (6)) might be obtained by either increasing the power factor α2σ or decreasing the total thermal conductivity κtot = κel + κlat (Equations (3) and (4)). An interesting approach is the exploitation of crystallographic shear (CS) for the reduction of the lattice thermal conductivity κlat due to increased phonon scattering [4,10,11]. CS plane structures occur when a transition metal is partially reduced and oxygen layers are removed from the structure, e.g., of TiO2, VO2, MoO3 and WO3. In the tungsten-oxygen system (Figure 1a) with decreasing O/W-ratio x the observed phases are the insulating ReO3-type WO3, the semiconducting phase W20O58 with CS planes, the metallic phase W18O49 with pentagonal columns (PC) and the metallic rutile-type WO2, with varying coupling of the [WO6] octahedra (Figure 1b–e). Such structure modifications result in an increasing charge carrier concentration [12]. A further five observed phases in the range 2 < x < 3 are predicted to be bad metals with charge carrier densities of the order 1021–1022 cm−1 according to band structure calculations [13]. Yet, these phases occur only in small domains of single crystals [14,15] or under high pressure conditions [16,17,18]. The fact that they are not observed as bulk materials might be attributed to a microstrain-driven ordering mechanism of the CS planes [19], which should be sensitive to the synthesis conditions.
The vapor-transport preparation route to obtain these phases comprises a high-temperature heating of WOx powder mixtures over several days and weeks [14,15,21,22,23]. Recently WO2.72 (W18O49) and WO2.90 (W20O58) were successfully prepared by spark plasma sintering (SPS) being promising bulk TE materials [11,12,24]. SPS combines the solid-state reaction of powdered precursor mixtures with simultaneous shaping, and provides an effective manufacturing route for TE materials due to low temperatures and short reaction times [8]. The samples around the composition WO2.90 still showed the formation of a further phase which was interpreted as WO2.96 [25].
The knowledge on phase formation in the tungsten-oxide system under SPS conditions still appears fragmentary which complicates the evaluation of the system’s potential as a TE material. Thus, we studied the products of the SPS redox reaction dependent on both, the composition x in the range 2.50 ≤ x ≤ 3 (Figure 1a, dashed lines) and the synthesis temperature Tmax with powder X-ray diffraction (PXRD). Subsequently, the TE properties of the SPS-prepared WOx materials with x ≥ 2.72 were investigated.
In this work we use the notation “WOx” for sample compositions, and “WaOb” for phases and their crystal structures.
2. Results & Discussion
2.1. Spark Plasma Preparation
The solid-state reaction
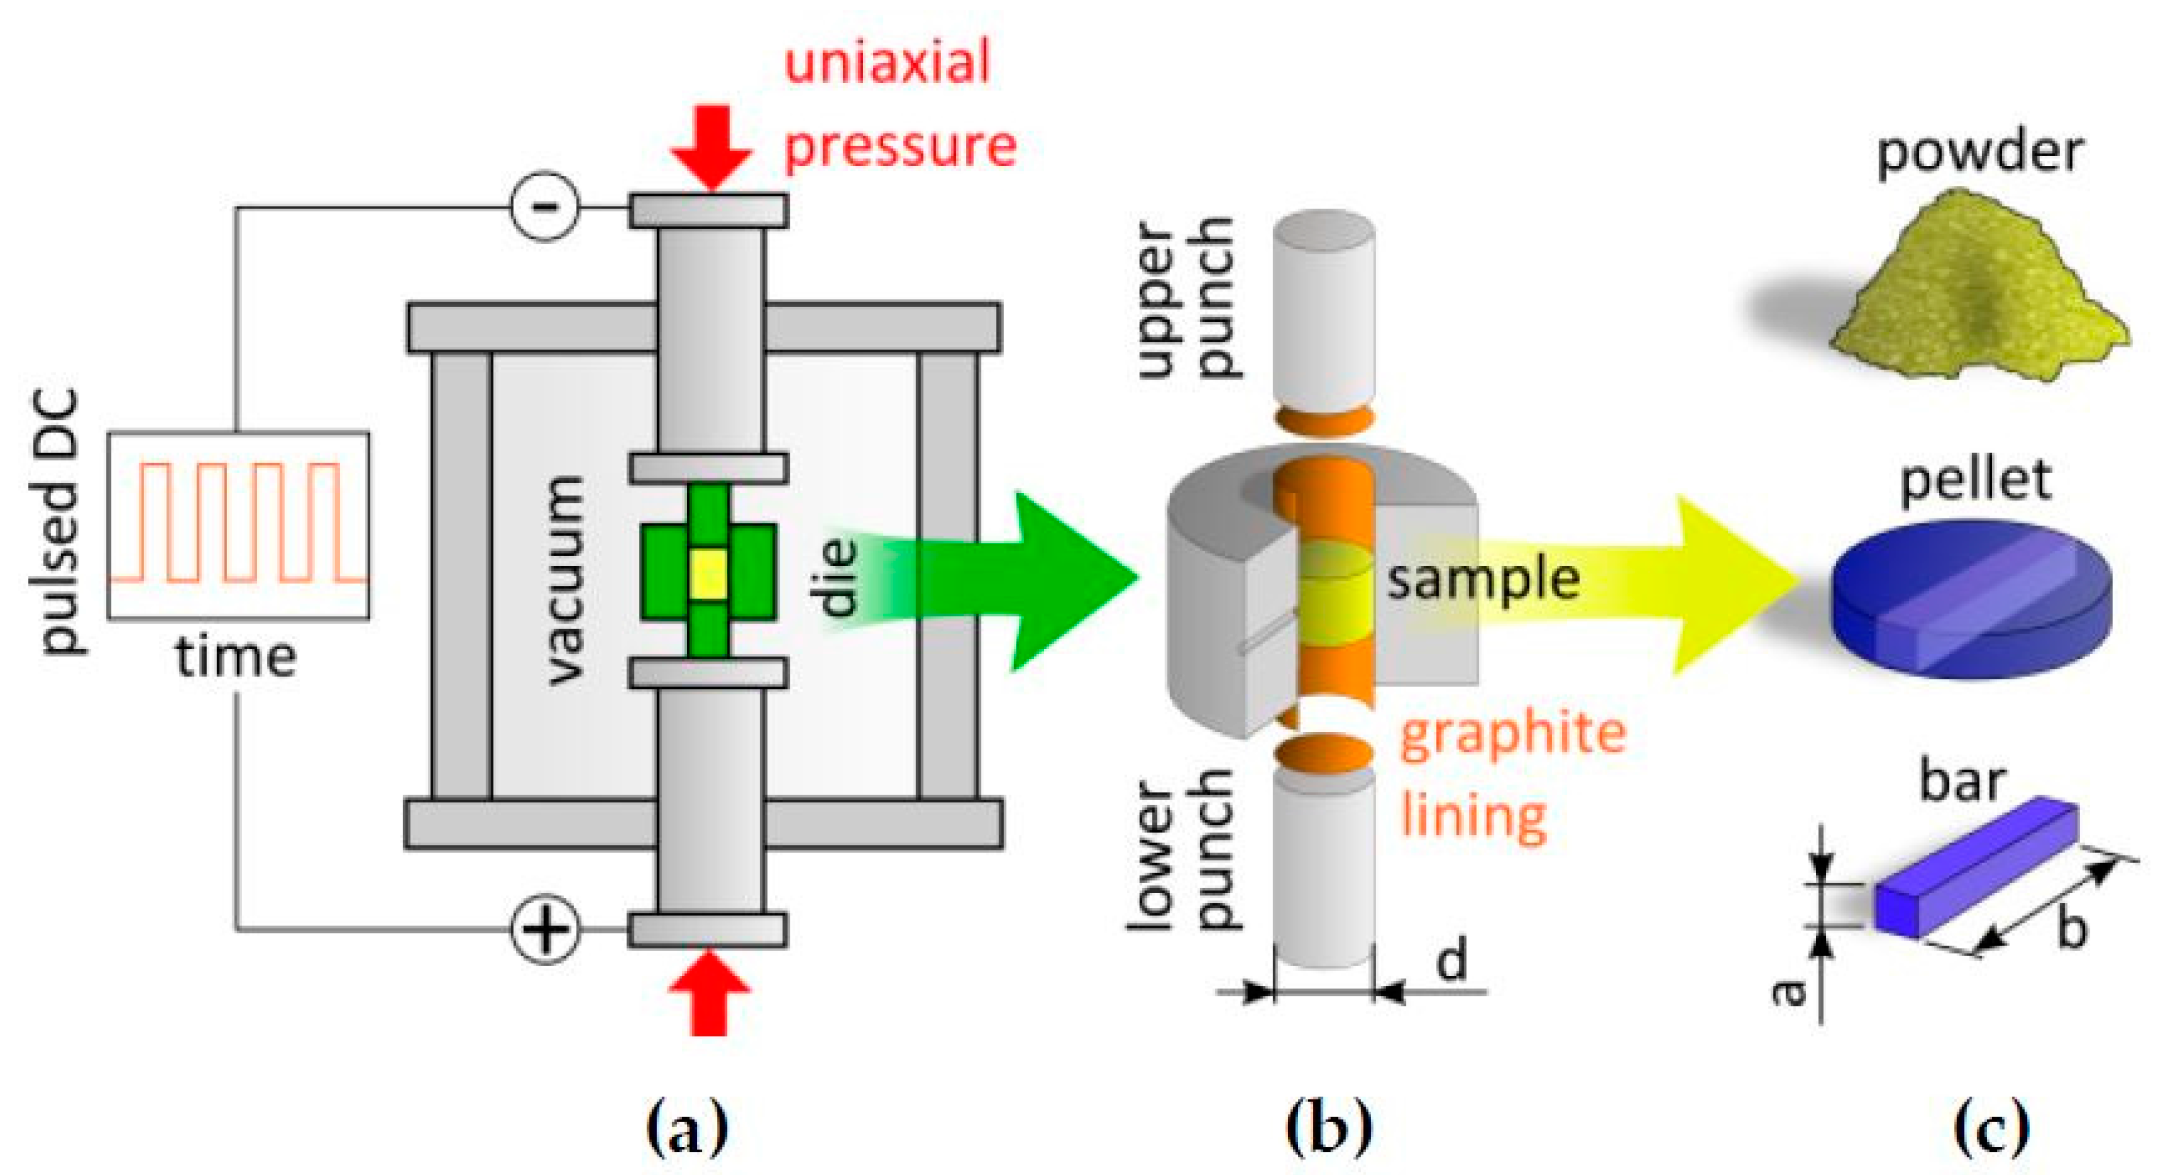
was performed for different x by spark plasma sintering (SPS) in vacuum (<10 Pa) under an uniaxial pressure of 80 MPa (Figure 2a). Temperature programs included a linear heating with 50 K·min−1, an isothermal dwell time tdwell at the temperature Tmax, and free cooling. Specific experiments in this work are notated by “SPS-Tmax/tdwell”.
x/3 WO3 + (1 − x/3) W → WOx
For the reference material WO2.90, the SPS treatment was optimized regarding the phase purity. Systematic variations of the temperature and dwell time in the ranges 1320 K ≤ Tmax ≤ 1570 K and 10 min ≤ tdwell ≤ 4 h, respectively, yielded the optimum regime SPS-1420 K/10 min (Figure 3b). Samples WOx with x = {2.50, 2.72, 2.80, 2.82, 2.84, 2.86, 2.88, 2.92, 2.95, 2.98} were prepared with the same conditions.
Phase-pure reference material WO2.72 was obtained via SPS-1420 K/35 min followed by SPS-1420 K/5 min with cleaning of the surface and grinding of the sample between both steps (Figure 2a).
A WO2 reference sample was directly compacted from the as-purchased material with SPS-1470 K/10 min (green curve in Figure 4).
The compaction of the yellowish as-purchased material WO3 with SPS-1420 K/10 min resulted in a bluish-violet and multiple-phase product according to PXRD (blue curve in Figure 4). Subsequent annealing performed at 1170 K for 68 h in the open air was supposed to yield the monoclinic γ-WO3 [26] and resulted in a greyish-yellow specimen (Figure 3c).
2.2. Single-Phase Materials WO2, WO2.72, WO2.90 and WO3
According to PXRD, phase-pure material WO2.72 is obtained from the two-step treatment (Figure 3a).
Phase-pure material WO2.90 is yielded from the routine SPS-1420 K/10 min as seen from the PXRD pattern (Figure 3b), which shows only reflections of W20O58 (x = 2.90). However, all reflections except (0 k 0) show large FWHM values indicating good ordering only in the [010] direction (Figure 1d). Starting from this optimized regime for x = 2.90, the increase of both Tmax and tdwell promotes the formation of W18O49 (x = 2.72), WO2 and an additional phase. We ascribe the composition x ≈ 2.82 for this phase as seen in the following. Thus, the schematic secondary reaction
represents a further tungsten reduction below x = 2.90 and is probably a similar SPS-specific reduction effect which is observed for pure WO3. However, in the case of W20O58 a further decomposition can be kinetically inhibited with a short SPS treatment time tdwell = 10 min.
W20O58 → W18O49 + WO2 + “WO2.82”
The WO2 does not undergo changes during the SPS treatment. A minor amount of elemental tungsten is observed in both, the as-purchased and SPS-processed material (green curve in Figure 4).
The as-purchased WO3 sample is confirmed to adopt monoclinic structure (γ-WO3). In contrast, the PXRD pattern after SPS treatment (SPS-1420 K/10 min, blue curve in Figure 4) shows a mixture of γ-WO3 (blue triangles), triclinic δ-WO3 (cyan arrows), W20O58 (x = 2.90, red dots), and an additional phase (green stars) whose reflections resemble those of W25O73 (x = 2.92) [14]. The δ-WO3 is the stable modification below 290 K [27]. Conventional preparation of WO3 via high-temperature oxidation usually yields γ-WO3 [28] whereas the conditions during the free cooling in the SPS processing could promote the further transition γ → δ. After annealing in open air (1170 K, 68 h), only γ- and δ-WO3 is found in the reference sample (Figure 3c). Most possibly, the annealing time was not sufficient to complete the δ → γ transformation, or the cooling rate afterwards was not sufficient to suppress the γ → δ transition completely. No clear evidence is found for the existence of W25O73 due to strong reflection overlapping. Yet, a reducing influence of the SPS graphite die and lining on the WO3 starting material is clearly seen from the formation of W20O58. It is supposed to appear at ≈ 1020 K [29] and occurs despite the short tdwell = 10 min and even 1 min. This SPS specific reduction should be considered additionally to the reaction with W, and will result in WOx samples with compositions slightly deviating from the nominal O/W-ratio x.
The refined lattice parameters of the as-purchased materials and obtained single-phase products are given in Table 1 together with the respective literature data.
2.2.1. Crystal Structure on Atomic Resolution
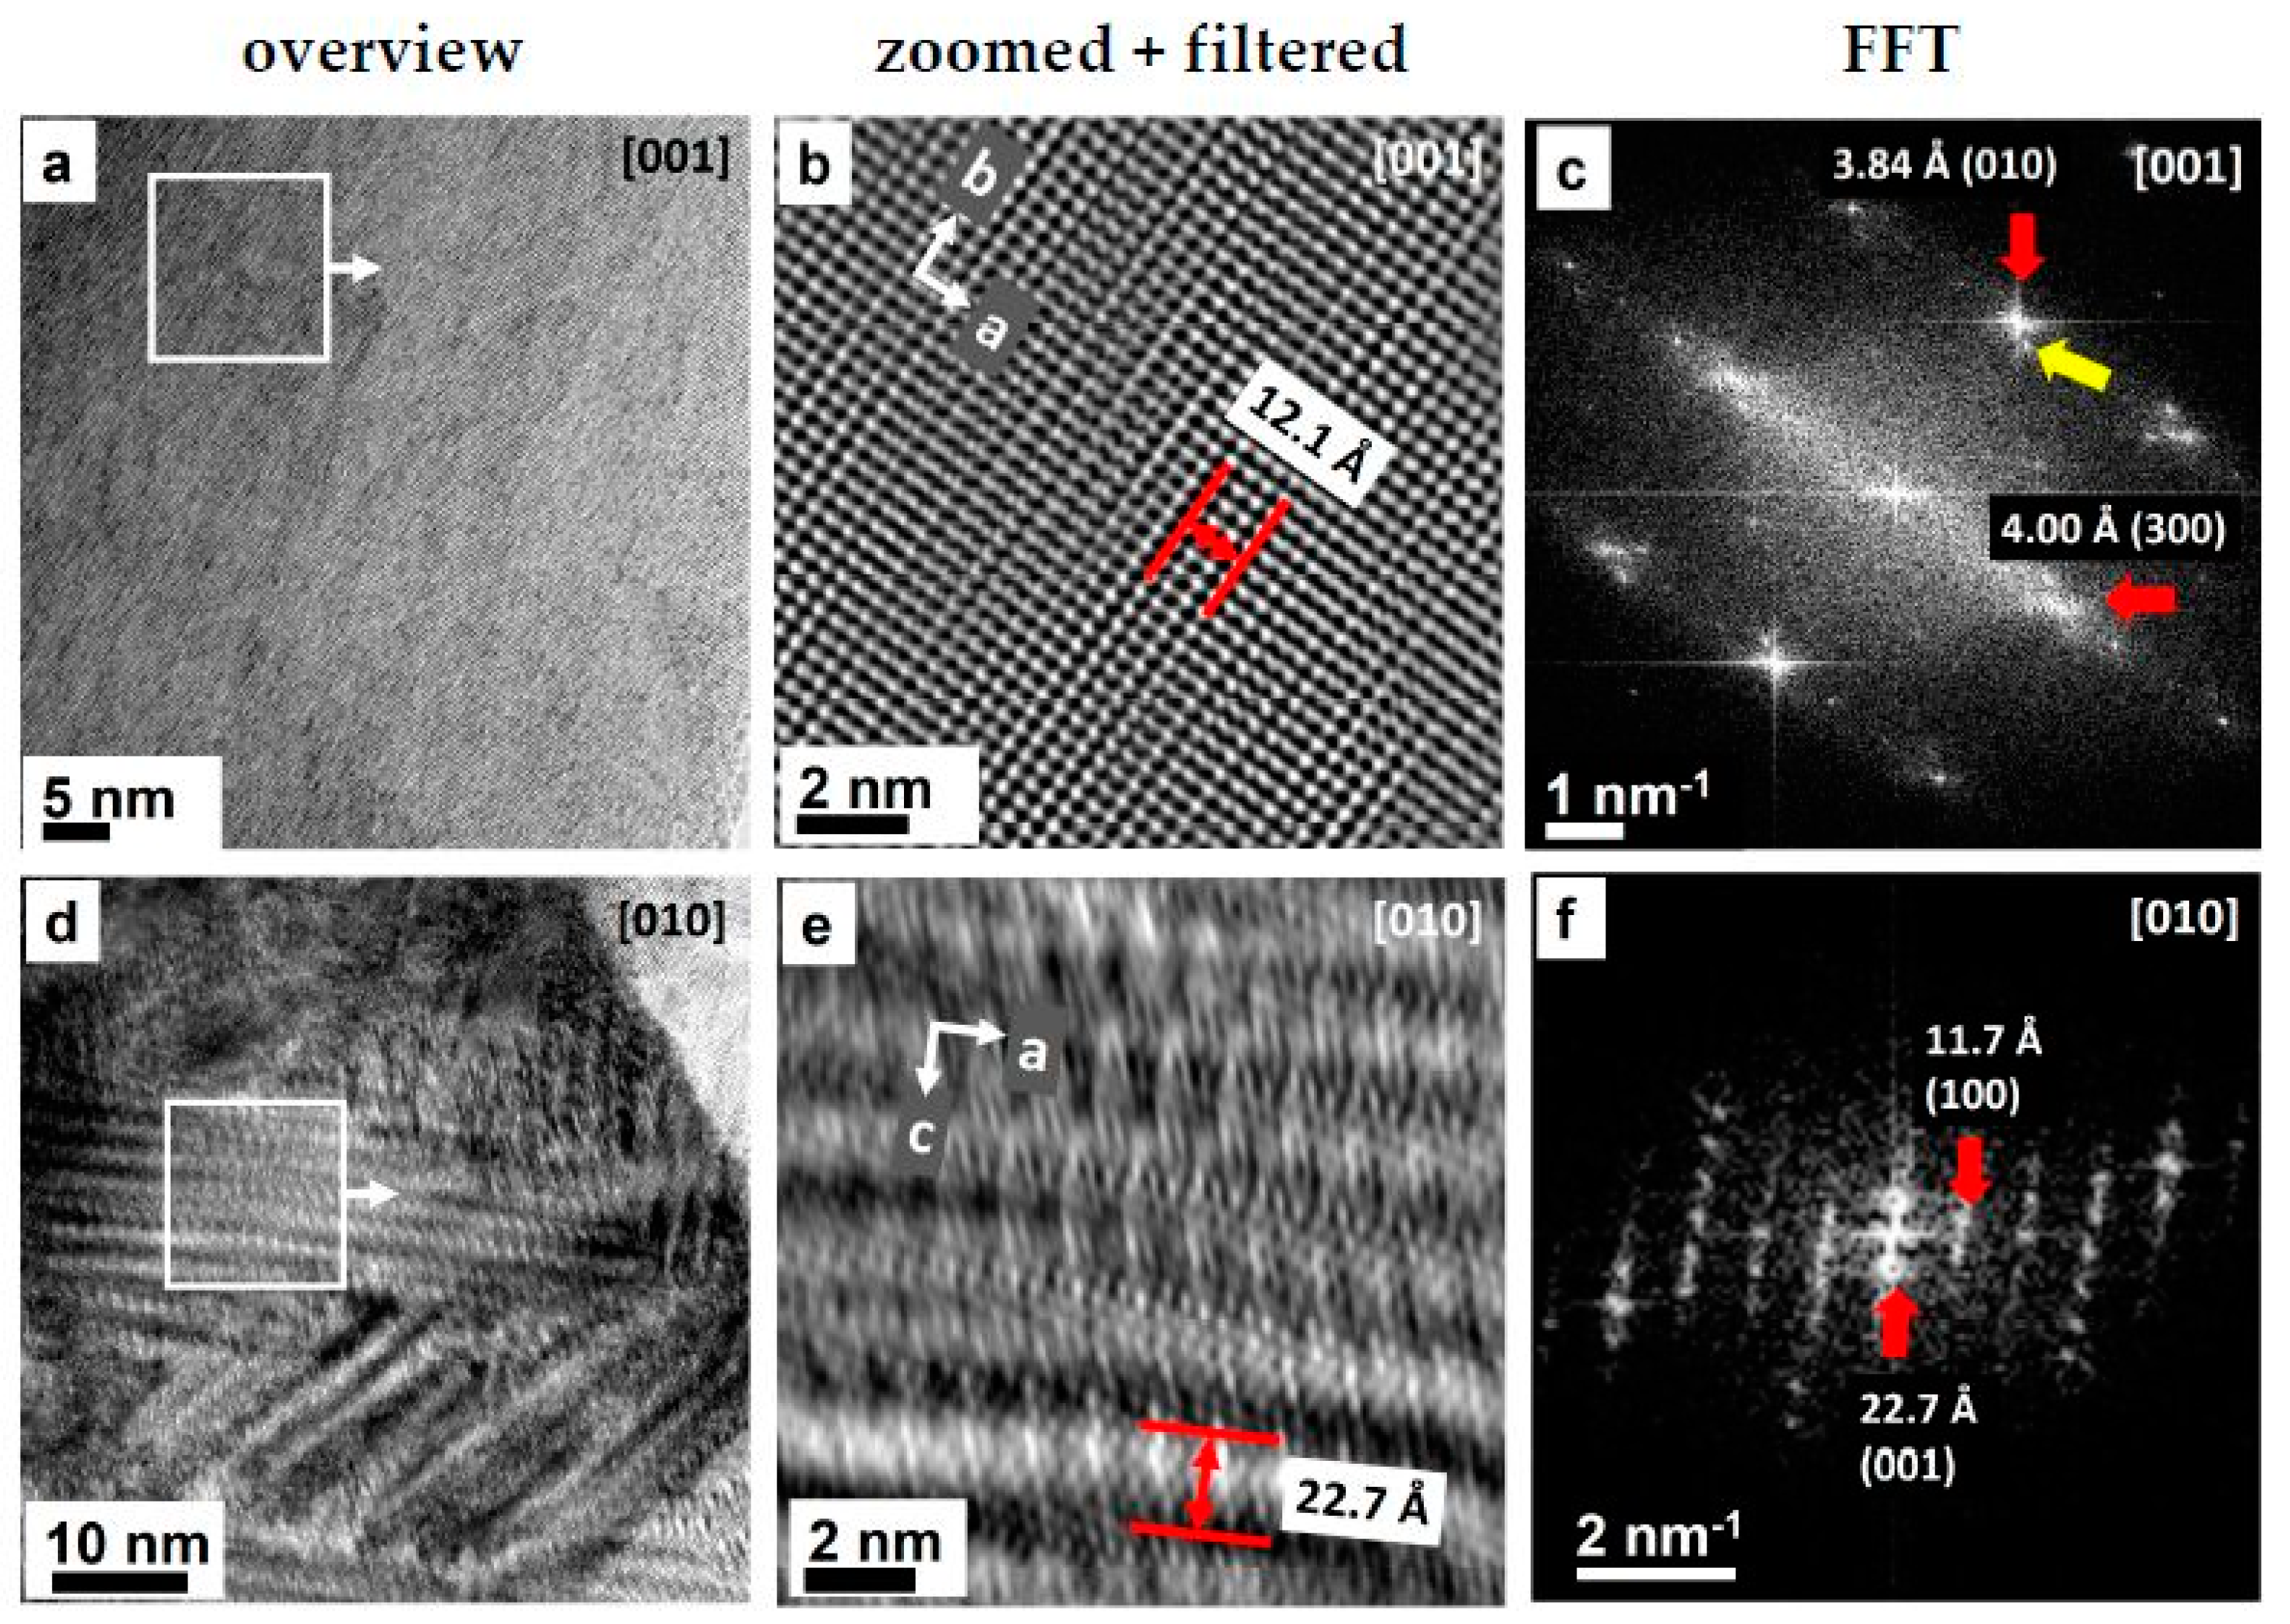
From high-resolution transmission electron microscopy (HR-TEM) along [001] of the single-phase WO2.90, large ordering areas are observed (Figure 5a). The zoomed and Fourier-filtered image from the top-left area (Figure 5b), and the corresponding fast Fourier transform (FFT) reveal the expected values of the lattice parameters a and b, but also some superstructure reflections indicating the doubling of the lattice parameter c (Figure 5c). In [010] direction, CS planes are visible but massively disordered with varying alignments and spacing (Figure 5d) which are consistent with the large FWHM values in the PXRD pattern (Figure 4a). The zoomed and filtered image (Figure 5e) shows low ordering along [001], where only the (001) reflection is present, whereas along [100], reflections of the fifth- and even higher order are observed in the FFT image (Figure 5f).
2.2.2. Thermoelectric Properties
Among the known phases, the lowest electrical conductivity σ(T) values are measured for WO2.90 with 77(3) × 103 S·m−1 over the whole temperature range, which is on the level of a heavily doped semiconductor (Figure S1a). A local maximum at 635 K is in good accordance with previous records [11,12,24]. The electrical conductivity of WO2 and WO2.72 indicates typical metallic behaviour with σ(T) ∝ 1/T dependency (Figure S1b). No electrical transport measurement was possible for the compacted and annealed WO3 sample due to its insulating behaviour. This indicates the absence of oxygen vacancies after SPS and annealing, which would promote the electrical conductivity [37].
Both metallic samples (WO2 and WO2.72) reveal a relative high thermal conductivity κtot(T) > 10 W·m−1·K−1 (Figure 6a). However, in the dense WO2 structure (Figure 1b), where strong tungsten–tungsten interactions are expected, this arises mainly from the lattice contribution κlat, whereas in WO2.72 κel and κlat contribute equally (Figure 6b). For the electrically insulating WO3 sample (κlat = κtot), the temperature dependence κlat(T) appears similar to that of WO2.72. However, for WO2.72 the approximation of κlat shows uncertainty of maximum 45% and a significant difference regarding WO3 cannot be determined.
WO2.90 shows κtot ≈ 3.5–4.5 W·m−1·K−1 over the whole temperature range (Figure 6a), which is close to previously published values [11,24]. With respect to errors its lattice contribution κlat equals that of WO3 for T > 560 K (Figure 6b). Thus, the effect of CS planes in the W20O58 structure on the lattice thermal conductivity appears insignificant at high temperatures. The pentagonal column (PC) structural motif of the W18O49 phase (Figure 1c) in WO2.72 might be an alternative phonon scattering center but proof requires a determination method for κlat which is more precise than our approximation from the Wiedemann-Franz law.
A direct property comparison of WO2, WO2.72, WO2.90 and WO3 can be conducted up to the maximum temperature T = 863 K at which WO2.72 was investigated. Here WO2.90 exhibits the highest Seebeck coefficient with α = −55 µV·K−1 in contrast to WO2.72 and WO2 with −24 µV·K−1 and −22 µV·K−1 respectively (Figure S2a).
The figures of merit ZT at T = 860 K are low (0.006, 0.017 and 0.045 for WO2, WO2.72 and WO2.90, respectively, Figure S2b). Maximum ZT = 0.061 is found for WO2.90 at 963 K. The low Seebeck coefficient is a drawback for WO2.72 and WO2, together with the high κlat of WO2. However, in the measured temperature range none of the materials shows a ZT maximum as of yet.
2.3. Compositions WOx
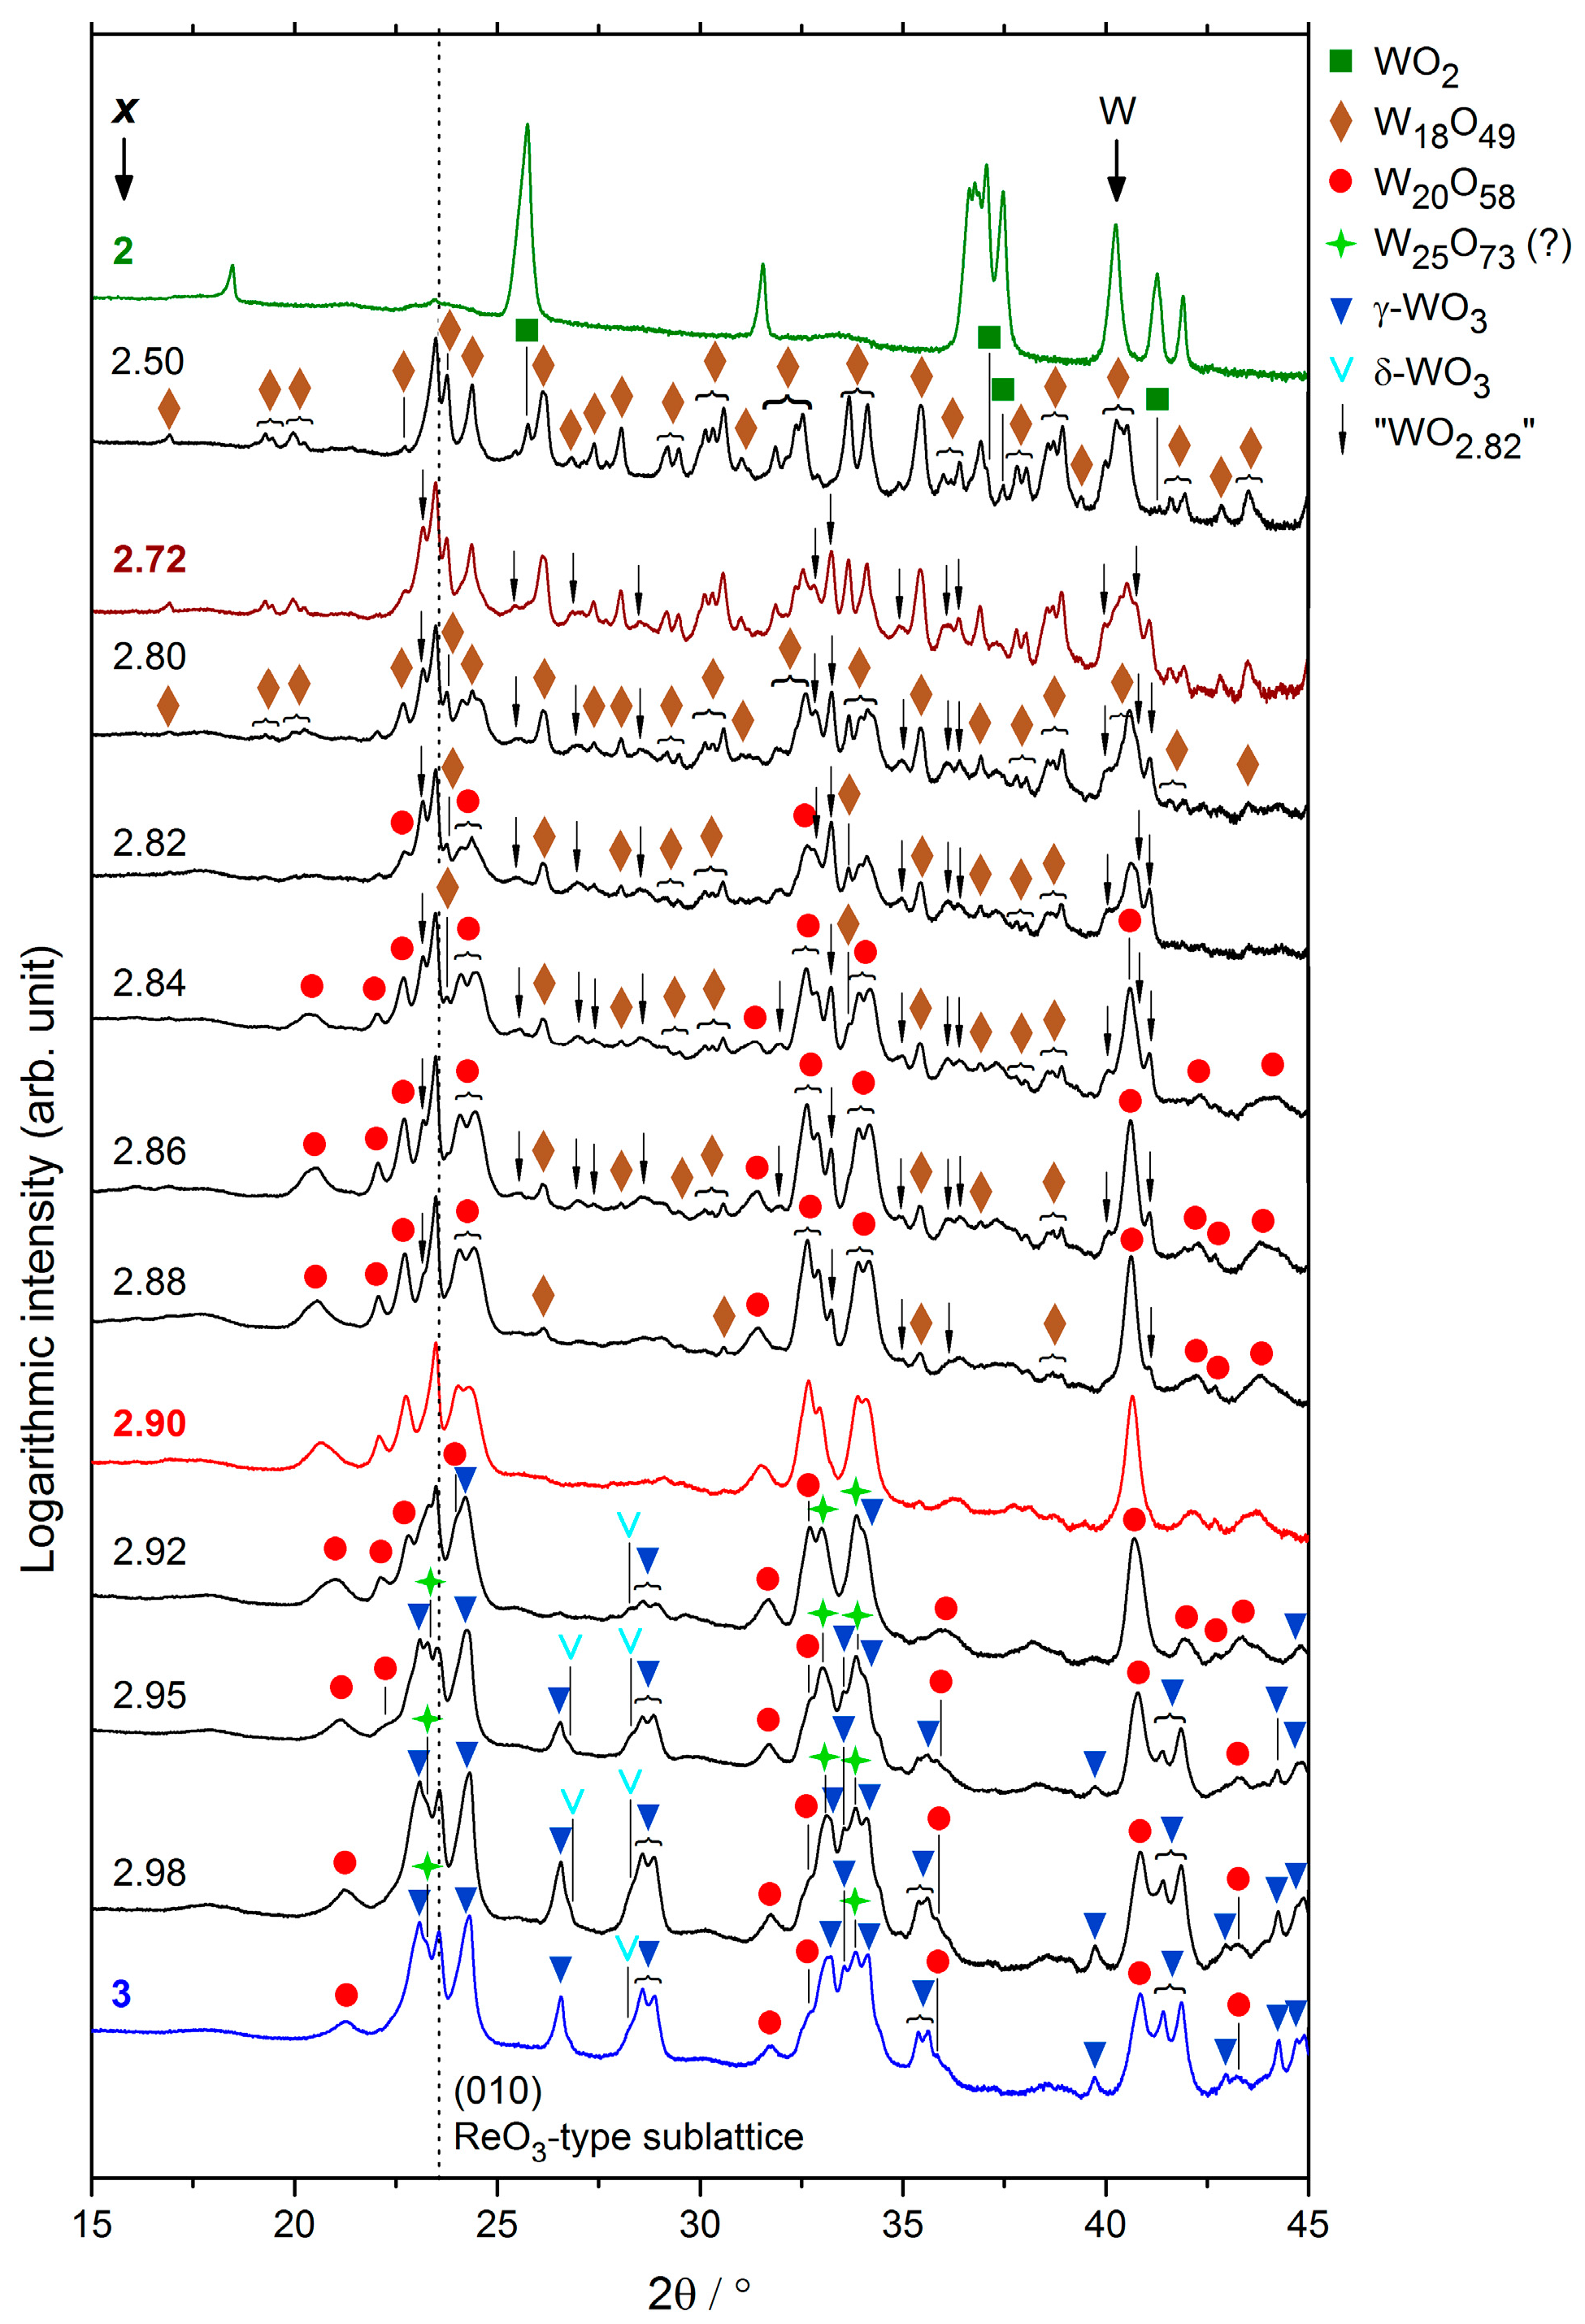
The phase formation in WOx samples with varying x is established from the PXRD patterns after the SPS-1420 K/10 min treatment (Figure 4). Semi-logarithmic plotting emphasizes reflections with low intensity. In Table 2 the observed phases are listed.
For x = 2.50 (Figure 4) only WO2 (green squares) and W18O49 (x = 2.72, brown rhombs) phases are observed as predicted from the phase diagram (Figure 1a).
In the range 2.72 ≤ x ≤ 2.90, only W18O49 (x = 2.72) and W20O58 (x = 2.90) are expected according to the phase diagram. For 2.72 ≤ x ≤ 2.80, W18O49 and an additional phase (black arrows) are observed. With increasing O/W-ratio (2.82 ≤ x ≤ 2.88) the expected reflections of W20O58 (x = 2.90, red dots) appear. The unindexed reflections are most intense for x = 2.82. From diffraction data of this sample containing only W18O49 and the additional phase, we find many reflection positions fitting to the pentagonal column phase W12O34 (x = 2.83) [34]. In our case, the parameters of the monoclinic unit cell are slightly changed to a = 17.229(1) Å, b = 3.782(1) Å, c = 19.496(1) Å and β = 105.77(1) (Table 1). This is just a rough suggestion; a structure refinement was not successful yet. Distinct reflections of this phase are found also after a comparative synthesis in evacuated silica tubes, which rules out the SPS as cause for its formation (Figure S3). Attempts on synthesis of this phase as single-phase bulk material and further investigations on the structure are pending.
For 2.92 ≤ x ≤ 2.98, the PXRD patterns resemble that of pure WO3 processed in the SPS: reflections of γ-WO3, δ-WO3, W20O58 (x = 2.90) and possibly W25O73 (x = 2.92) occur. A bluish-violet color of all samples with 2.92 ≤ x ≤ 2.98 supports the existence of the latter since W20O58 and W25O73 are colored deeply blue and violet respectively [14,21]. However, samples with the nominal composition (x = 2.92) do not yield single-phase materials. Under SPS conditions, W25O73 might not be stable.
2.3.1. Microstructure
From polarized light microscopy (PLM), the grain size of all synthesized WOx samples is found to be of the order 10–30 µm (Figure 7). A color variation from yellow to red to blue with increasing O/W-ratio x is caused by the different optical reflectivity of the occurring phases. According to SEM images with backscattered electron (BSE) contrast, the samples are homogeneous. Distinct porosity is found only for x = 2 and 2.98. Energy dispersive X-ray spectroscopy (EDX) reveals tungsten and oxygen only, but differences of the oxygen content are below the detection limit.
2.3.2. Thermoelectric Properties
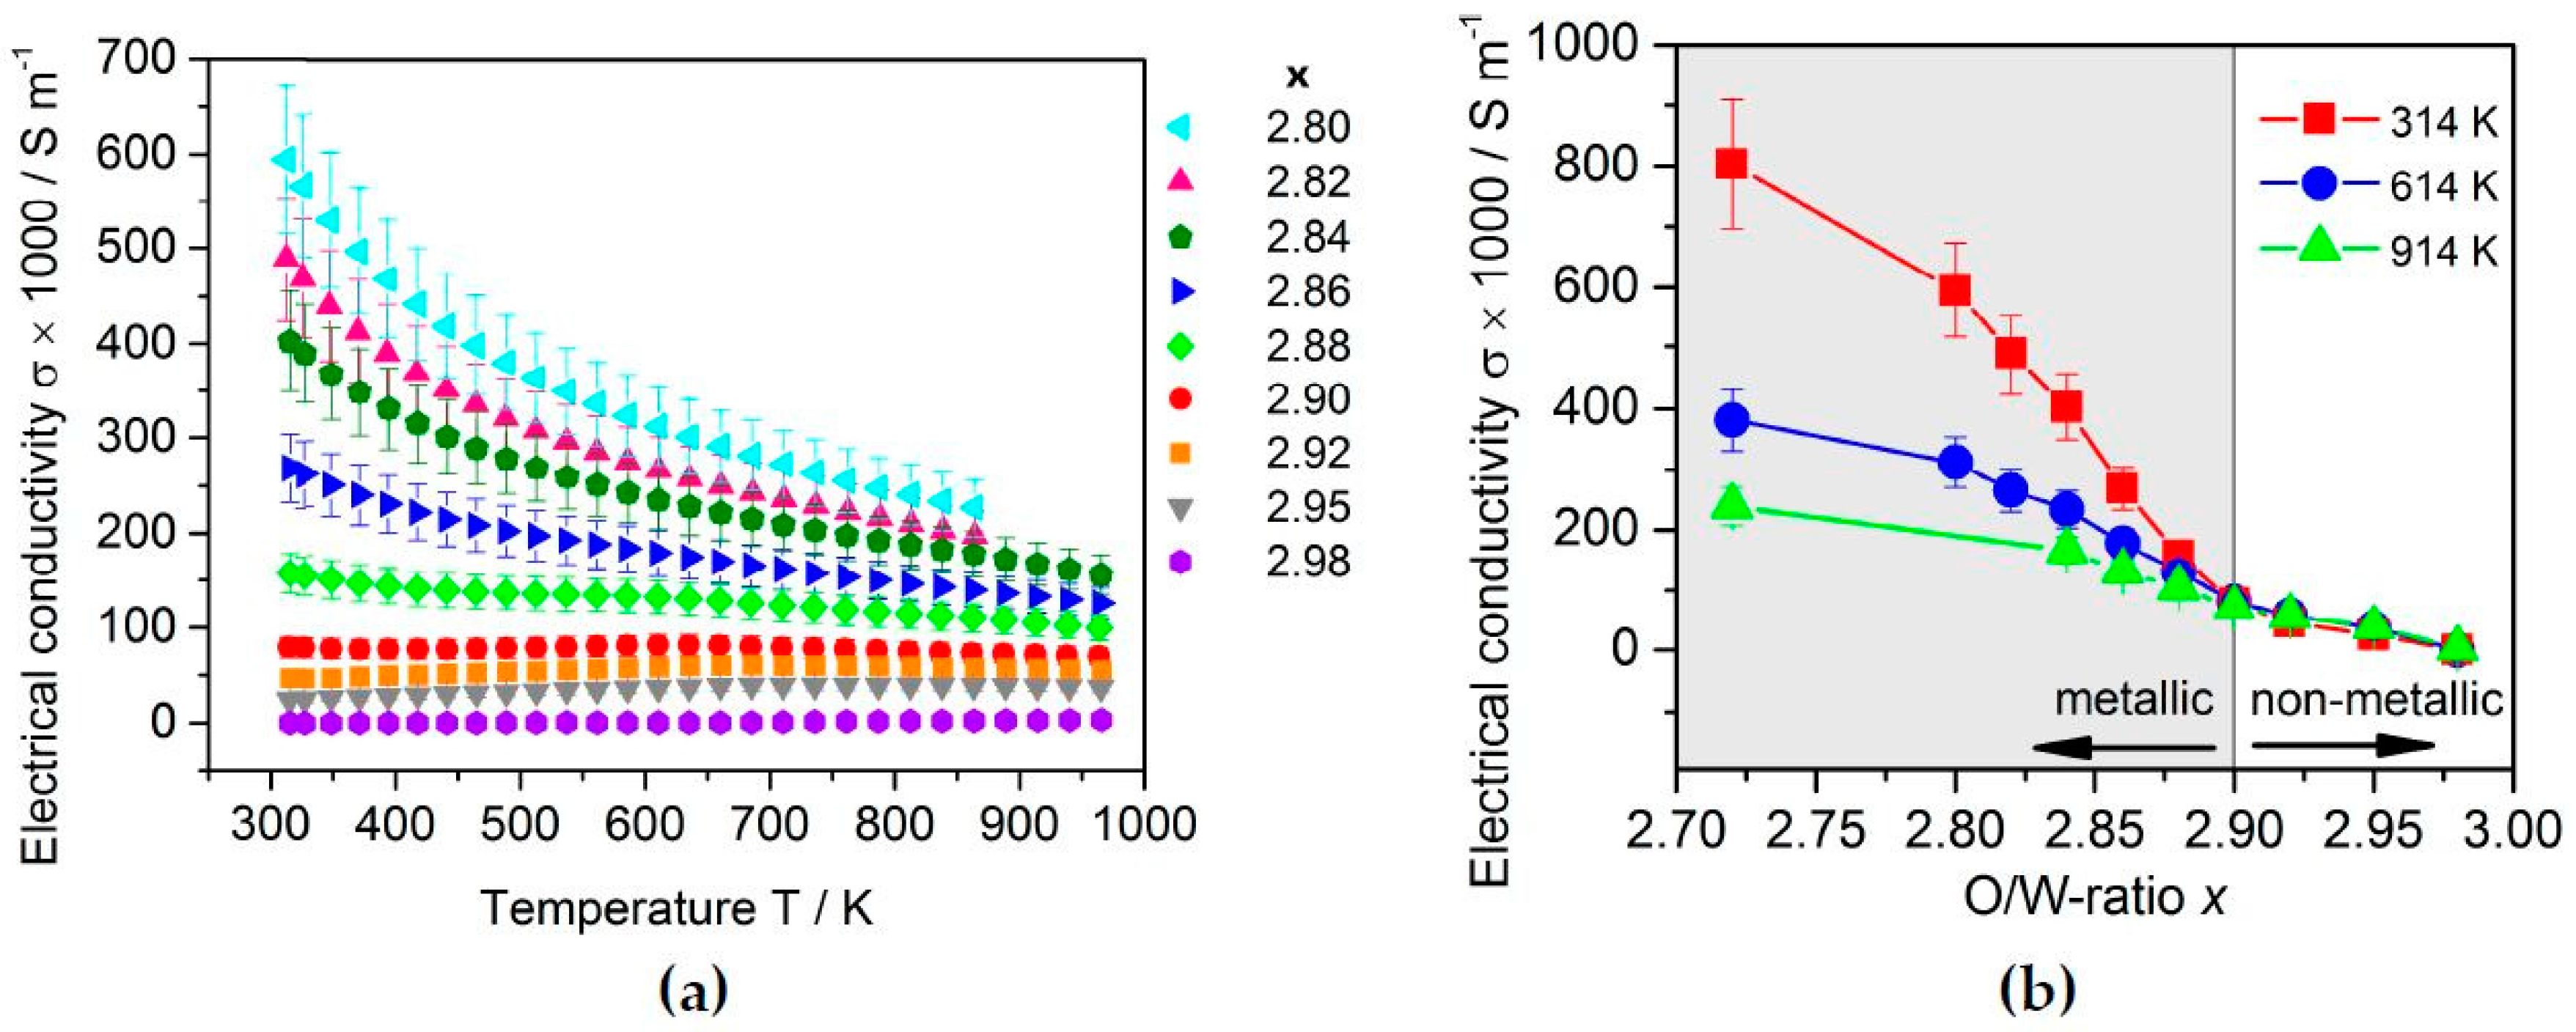
The electrical conductivity of the WOx samples strongly correlates with the O/W-ratio x. When the oxygen concentration is increased to x ≥ 2.90, there is a continuous decrease of σ(T) with minor temperature dependence similar to that of WO2.90 (Figure 8a). According to PXRD (Figure 4), next to W20O58 the nearly insulating phases δ- and γ-WO3 occur in this composition range. Thus, the charge carrier concentration and σ(T) mainly depend on the W20O58 content, which decreases with increasing x. The influence of one further phase, possibly W20O73 (x = 2.92), is not known as of yet.
For decreasing O/W-ratio x < 2.90, a metallic behaviour is promoted continuously (Figure 8a). The σ(T) approaches that of x = 2.72 with the increasing W18O49 (x = 2.72) phase content (Figure 4). No discontinuity of σ(T) is found for x = 2.82 where the highest amount of “WO2.82” is observed. Thus, this phase is electrically conducting. Altogether, the composition x = 2.90 is the limit between metallic and nonmetallic behaviour (Figure 8b).
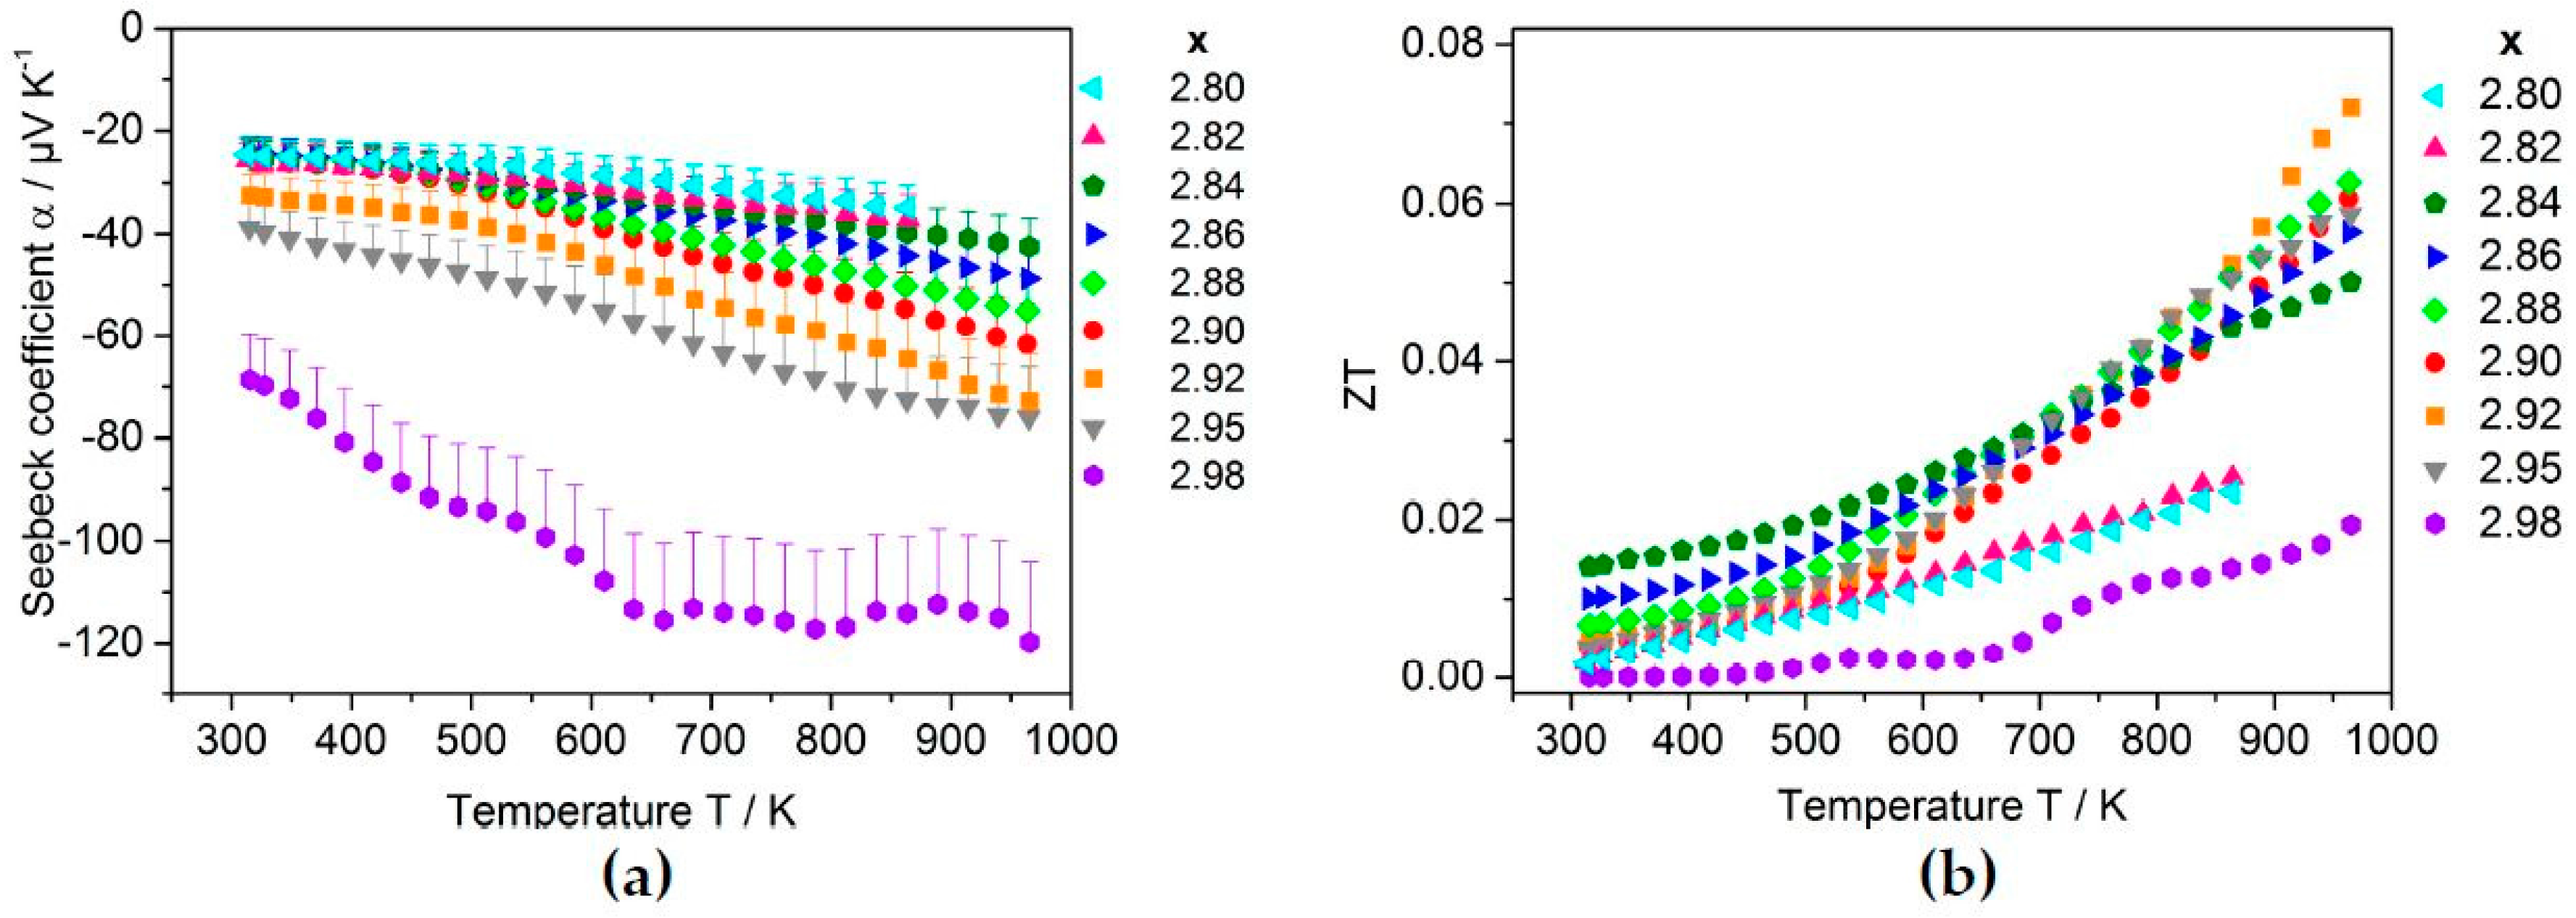
A similar trend is observed for the Seebeck coefficient (Figure 9a). Strong non-monotonic behaviour for the composition x = 2.98 results from the large amounts of WO3 in the material (Figure 4) and its therefore near-insulating character during the TE property measurements. The specific influence of the “WO2.82”and W25O73 (x = 2.92) phases cannot be considered yet due the lack of the TE properties of the phase-pure material.
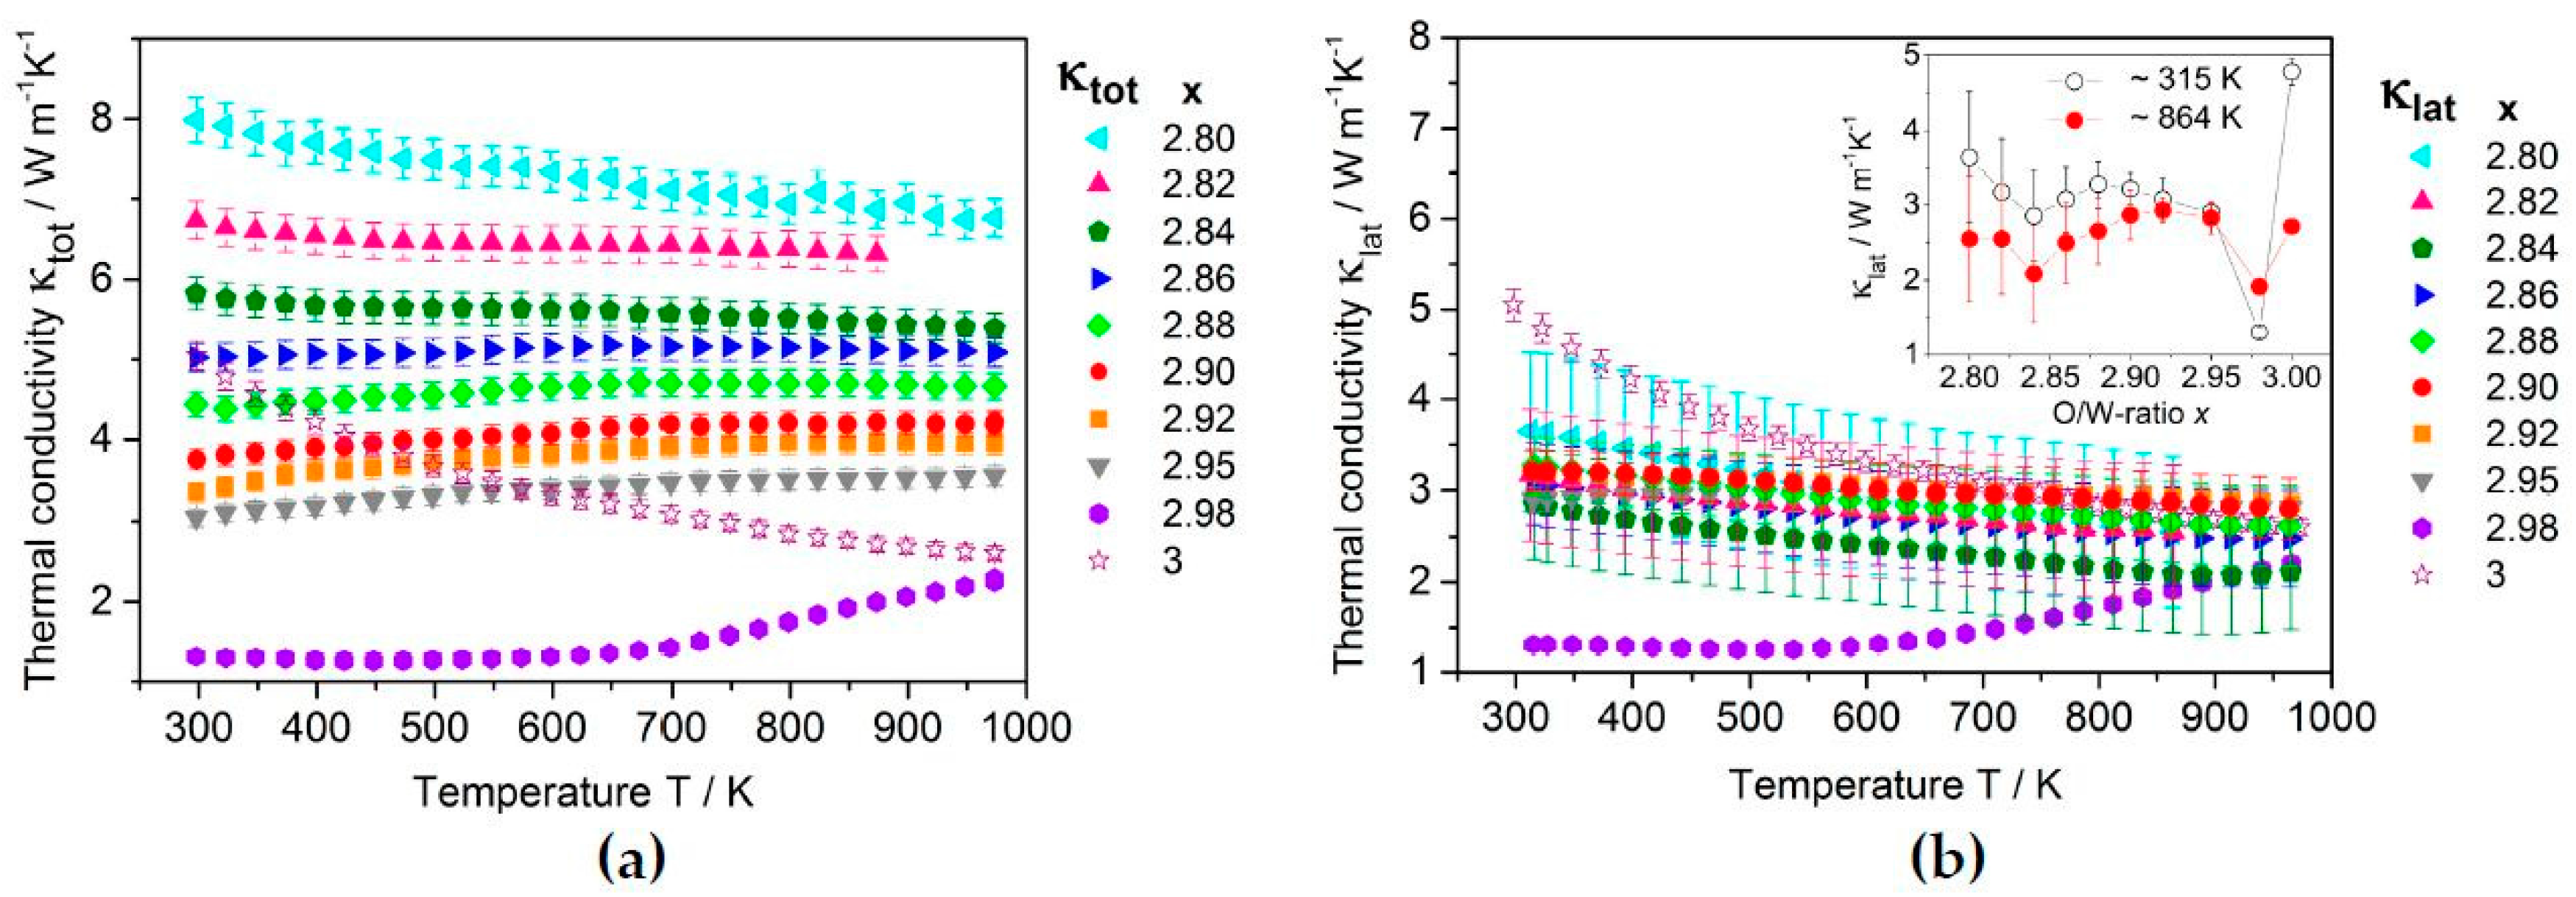
The continuous property change of WOx materials for 2.80 ≤ x ≤ 3 also appears in the thermal conductivity κtot (Figure 10a). With respect to the uncertainty of the Wiedemann–Franz approximation of κel (Equations (4) and (5)), κlat is very similar for all samples x < 2.98 (Figure 10b). In the composition range 2.90 ≤ x ≤ 2.95 where CS plane phases are found (Table 2), the lattice contribution κlat appears almost temperature-independent. For T > 550 K these samples show no significant reduction of κlat regarding the WO3 reference sample with respect to the occuring errors. The exceptionally low value for x = 2.98 might be the result of porosity also found by microstructure analysis. However, in the three-phase region (2.82 ≤ x ≤ 2.88) of the system (Table 2), a significantly reduced κlat is found for x = 2.84 up to T ≤ 700 K. This tendency is also noticable from a plot of κlat vs. the O/W-ratio x (Figure 10b inset). It indicates that at high temperatures, the lowest κlat is achieved for WOx materials with multiple phases due to enhanced phonon scattering at the interfaces.
The resulting ZT for the WOx compositions are very similar to that of WO2.90 (Figure 9b). For x = 2.92, the highest ZT = 0.072 is reached at 963 K. An exceptional low ZT is reached for x = 2.82 and x = 2.98 due to the high and low σ(T) respectively. However, none of the compositions shows a ZT maximum in the measured temperature range as of yet.
3. Materials and Methods
3.1. Materials
The purchased powders of starting materials WO3 (Alfa Aesar, 99.998 wt %, 10–20 µm), WO2 (Sigma-Aldrich, 99.99 wt %, <150 μm) and elemental W (Chempur, 99.9 wt %, 8–9 µm) were analyzed regarding crystalline contaminations with PXRD. For the preparation of WOx samples (2.50 ≤ x ≤ 2.98), WO3 was manually mixed for 15 min under argon atmosphere with appropriate amounts of W.
3.2. Spark Plasma Sintering
For spark plasma sintering (SPS), graphite dies with diameters of 8 mm or 10 mm (Figure 2b) and a graphite lining were filled with ca. 1 g of starting mixture under argon atmosphere, and processed with a SPS-515 ET Sinter Lab apparatus (Fuji Electronic Industrial Co. Ltd., Tsurugashima, Japan).
3.3. Powder X-ray Diffraction
The starting materials and SPS-processed samples were examined with powder X-ray diffraction (PXRD) on the Guinier camera G670 (HUBER Diffraktionstechnik GmbH & Co., KG, Rimsting, Germany) with Cu-Kα1 radiation (λ = 1.540598 Å, graphite monochromator, 5° ≤ 2θ ≤ 100°, ∆2θ = 0.005°). All PXRD data was compared to the theoretical patterns of known phases (Table 1). A LaB6 standard was added to single-phase materials for a subsequent cell parameter determination using the least-square method in the WinCSD software package [38].
3.4. High-Resolution Transmission Electron Microscopy
For high-resolution transmission electron microscopy (HR-TEM), a sample was ground to fine powder and dispersed in methanol. The suspension was loaded on a 100-mesh hexagonal copper grid Quantifoil S7/2 (Quantifoil Micro Tools GmbH, Jena, Germany), which was covered beforehand with a carbon film (2 nm). After a complete drying, HR-TEM imaging was performed on a Tecnai F30 (FEI Technologies Inc., Hillsboro, OR, USA) with a field-emission gun at an acceleration voltage of 300 kV. The point resolution amounted to 1.9 Å, and the information limit amounted to ca. 1.2 Å. The microscope was equipped with a wide-angle slow-scan CCD camera (MultiScan, 2 k × 2 k pixels; Gatan Inc., Pleasanton, CA, USA). TEM images were analyzed with the DigitalMicrograph software (Gatan Inc., Pleasanton, CA, USA).
3.5. Thermoelectric Properties
TE properties were measured for the reference samples x = {2, 2.72, 2.90, 3} and the WOx samples in the range 2.82 ≤ x ≤ 2.98. Samples previously powdered for PXRD were compacted with SPS-1320 K/10 min and a heating rate of 75 K·min−1. Subsequently, the mass density ρ was determined with Archimedean method (Table S1).
The thermal diffusivity D(T) was measured by laser flash analysis (LFA) on a LFA 457 MicroFlash (NETZSCH GmbH & Co. Holding KG, Selb, Germany) in vacuum between room temperature and 963 K in steps of 25 K. Subsequent polishing removed a subtle yellow stain from the pellet surface which occurred during the LFA. Differential scanning calorimetry (DSC) measurements of the specific heat capacity cp (T) yielded values that for all WOx samples were identical to WO3 with respect to the measurement error (Figure S4). Thus, for the calculation of the total thermal conductivity
(T—absolute temperature) of WOx and WO2 there were used theoretic curves for WO3 and WO2, respectively [39,40]. After an Archimedian density determination, the microstructure was analyzed with polarized light microscopy (LM), scanning electron microscopy (SEM) and energy dispersive X-ray spectroscopy (EDX). Tetragonal bars with the dimensions a ≈ 1.5 mm and b ≈ 6–8 mm were cut from the pellets using a wire saw (Figure 2c). The measurements of the electrical conductivity σ(T) and Seebeck coefficient α(T) were performed perpendicular to the SPS pressure direction along the b-edge on a ZEM-3 (ULVAC-RIKO, Munich, Germany) under low pressure helium from RT to 863 K or 963 K in steps of 25 K. The samples were polished before every measurement. The electronic contribution to the total thermal conductivity and consequently the lattice contribution κlat = κtot − κel were calculated with the Wiedemann–Franz equation
Since for semiconductors the Lorenz number L(T) can strongly deviate from the constant value L = 2.4453 × 10⁻⁸ WΩ·K−2 the approximation
was used, which is based on the single parabolic band model with acoustic phonon scattering [41]. Comparative results obtained with constant L show only minor deviations and all trends remain the same.
For a comparison with other TE materials, the figure-of-merit ZT was calculated according to
κtot(T) = ρcp(T)D(T)
κel(T) = L(T)σ(T)T
L(T) = 1.5 + exp [−|α(T)|/116]
ZT = [α2(T)σ(T)T]/κtot(T).
4. Conclusions
According to powder X-ray diffraction (PXRD), a new phase termed as “WO2.82” is observed in the composition range 2.72 ≤ x ≤ 2.90 in addition to the expected pentagonal column (PC) phase W18O49 (x = 2.72) and crystallographic shear (CS) plane phase W20O58 (x = 2.90). The reflection positions of “WO2.82” in the synchrotron pattern of a two-phase W18O49/“WO2.82” sample somewhat fit the PC phase W12O34 (x = 2.83) with slightly changed lattice parameters. The synthesis as single-phase material and structure refinement still failed, which indicates that the phase is metastable and its structure needs to be further analyzed.
Single-phase WO2.90 material is directly obtained from SPS-1420 K/10 min. Both powder X-ray diffraction (PXRD) and high-resolution transmission electron microscopy (HR-TEM) show disorder of the CS planes. Single-phase WO2.70 material is obtained from SPS-1420 K/35 min followed by grinding and SPS-1420 K/5 min.
Electronic transport properties of WOx materials (2.80 ≤ x ≤ 2.98) from the routine SPS-1420 K/10 min reveal a continuous tunability, practically independent from the phases present in the samples. Both the electrical conductivity σ(T) and the thermal conductivity κtot(T) indicate an increase of the charge carrier concentration with increasing oxygen deficiency. Here, the composition WO2.90 is the limit between metallic (x < 2.90) and nonmetallic behaviour (x ≥ 2.90).
The multi-phase character of these samples found by PXRD is crucial for the thermal conductivity. Significant reduction of κlat regarding WO3 is found up to 700 K for the three-phase material WO2.84. Thus, for x < 2.90 the introduction of multiple phases is a way for reducing the thermal conductivity due to increased phonon scattering at the phase interfaces. The formation of the PC phases in this composition range might have additional influence. In contrast, for 2.90 ≤ x ≤ 3, which is the typical range for the formation of CS plane phases, a reduction of κlat is observed only below 550 K. For high-temperature applications, CS planes might be less appropriate phonon scattering centers.
Supplementary Materials
The following are available online at www.mdpi.com/2073-4352/7/9/271/s1. Figure S1: Electrical conductivity σ(T) of the reference materials compositions WO2, WO2.72 and WO2.90; Figure S2: Seebeck coefficient α(T) and resulting figures of merit ZT of the reference materials WO2, WO2.72 and WO2.90; Figure S3: PXRD patterns of WO2.90 obtained from heating in an evacuated silica tube at 1370 K for 72 h and from SPS synthesis at similar temperature for 3 h; Figure S4: Specific heat capacity cp(T) of WOx materials; Table S1: Mass density ρtheo of tungsten oxide phases calculated from the molar mass M and unit cell volume V. References [42,43,44] are cited in the supplementary materials.
Acknowledgments
This research was funded by the Deutsche Forschungsgemeinschaft (DFG) through the priority program SPP1959 ‘‘Manipulation of Matter Controlled by Electric and Magnetic Fields: Towards Novel Synthesis and Processing Routes of Inorganic Materials”. We acknowledge Yurii Prots for performing the PXRD experiments. Thanks also to Markus Schmidt and Vicky Süß for measurements of the specific heat capacity.
Author Contributions
The project was developed by Igor Veremchuk. Felix Kaiser performed the syntheses, and evaluated the data. Measurements of the transport were performed by Igor Veremchuk. Ulrich Burkhardt analyzed the microstructure. TEM studies were performed by Paul Simon. Important discussions regarding the data interpretation were contributed by Yuri Grin, and Bernd Kieback, who acted as mentor commissioned by the TU Dresden.
Conflicts of Interest
The authors declare no conflicts of interest.
References
- Terasaki, I.; Sasago, Y.; Uchinokura, K. Large thermoelectric power in NaCo2O4 single crystals. Phys. Rev. B 1997, 56, R12685–R12687. [Google Scholar] [CrossRef]
- Snyder, G.J.; Toberer, E.S. Complex thermoelectric materials. Nat. Mater. 2008, 7, 105–114. [Google Scholar] [CrossRef] [PubMed]
- Walia, S.; Balendhran, S.; Nili, H.; Zhuiykov, S.; Rosengarten, G. Transition metal oxides—Thermoelectric properties. Prog. Mater. Sci. 2013, 58, 1443–1489. [Google Scholar] [CrossRef]
- Kieslich, G.; Cerretti, G.; Veremchuk, I.; Hermann, R.P.; Panthöfer, M.; Grin, Y.; Tremel, W. A chemists view: Metal oxides with adaptive structures for thermoelectric applications. Phys. Status Solidi A 2016, 213, 1–16. [Google Scholar] [CrossRef]
- Lu, Z.; Zhang, H.; Lei, W.; Sinclair, D.C.; Reaney, I.M. High-Figure-of-Merit Thermoelectric La-Doped A-Site-Deficient SrTiO3 Ceramics. Chem. Mater. 2016, 28, 925–935. [Google Scholar] [CrossRef]
- Liang, X. Structure and Thermoelectric Properties of Zinc Based Materials. Doctoral Dissertation, Harvard University, Cambridge, MA, USA, 29 August 2013. [Google Scholar]
- Mikami, M.; Ozaki, K. Thermoelectric properties of nitrogen-doped TiO2−x compounds. J. Phys. Conf. Ser. 2012, 379, 012006. [Google Scholar] [CrossRef]
- Feng, B.; Martin, H.-P.; Börner, F.-D.; Lippmann, W.; Schreier, M.; Vogel, K.; Lenk, A.; Veremchuk, I.; Dannowski, M.; Richter, C.; et al. Manufacture and Testing of Thermoelectric Modules Consisting of BxC and TiOx Elements. Adv. Eng. Mater. 2014, 16, 1252–1263. [Google Scholar] [CrossRef]
- Martin, H.-P.; Pönicke, A.; Kluge, M.; Rost, A.; Conze, S.; Wätzig, K.; Schilm, J.; Michaelis, A. TiOx-Based Thermoelectric Modules: Manufacturing, Properties, and Operational Behavior. J. Electron. Mater. 2016, 45, 1570–1575. [Google Scholar] [CrossRef]
- Harada, S.; Tanaka, K.; Inui, H. Thermoelectric properties and crystallographic shear structures in titanium oxides of the Magnèli phases. J. Appl. Phys. 2010, 108, 083703. [Google Scholar] [CrossRef] [Green Version]
- Kieslich, G.; Veremchuk, I.; Antonyshyn, I.; Zeier, W.G.; Birkel, C.S.; Weldert, K.; Heinrich, C.P.; Visnow, E.; Panthöfer, M.; Burkhardt, U.; et al. Using crystallographic shear to reduce lattice thermal conductivity: High temperature thermoelectric characterization of the spark plasma sintered Magnéli phases WO2.90 and WO2.722. Phys. Chem. Chem. Phys. 2013, 15, 15399. [Google Scholar] [CrossRef] [PubMed]
- Kieslich, G.; Tremel, W. Magnéli oxides as promising n-type thermoelectrics. AIMS Mater. Sci. 2014, 1, 184–190. [Google Scholar] [CrossRef]
- Migas, D.; Shaposhnikov, V.; Borisenko, V. Tungsten oxides. II. The metallic nature of Magnéli phases. J. Appl. Phys. 2010, 108, 093714. [Google Scholar] [CrossRef]
- Sundberg, M. The crystal and defect structures of W25O73, a member of the homologous series WnO3n-2. Acta Cryst. B 1976, 32, 2144–2149. [Google Scholar] [CrossRef]
- Sundberg, M. Structure and “oxidation behavior” of W24O70, a new member of the {103} CS series of tungsten oxides. Solid State Chem. 1980, 35, 120–127. [Google Scholar] [CrossRef]
- Sundberg, M.; Zakharov, N.D.; Zibrov, I.P.; Barabanenkov, Y.A.; Filonenko, V.P.; Werner, P. Two high-pressure tungsten oxide structures of W3O8 stoichiometry deduced from high-resolution electron microscopy images. Acta Cryst. B 1993, 49, 951–958. [Google Scholar] [CrossRef]
- Barabanenkov, Y.A.; Zakharov, N.D.; Zibrov, I.P.; Filonenko, V.P.; Werner, P. High-pressure phases in the system W-O.I. Structure of WO1.09 by HRTEM. Acta Cryst. B 1992, 48, 572–577. [Google Scholar] [CrossRef]
- McColm, I.J.; Steadman, R.; Wilsoni, S.J. Iron-promoted phases in the tungsten-oxygen system. J. Solid State Chem. 1978, 23, 33–42. [Google Scholar] [CrossRef]
- Stoneham, A.M.; Durham, P.J. The ordering of crystallographic shear planes: Theory of regular arrays. Phys. Chem. Solids 1973, 34, 2127–2135. [Google Scholar] [CrossRef]
- Wriedt, H.A. O-W (Oxygen-Tungsten). In Binary Alloy Phase Diagrams, 2nd ed.; Massalski, T.B., Ed.; ASM International: Materials Park, OH, USA, 1990; Volume 3, pp. 2933–2935. [Google Scholar]
- Magneli, A. Structure of β-Tungsten Oxide. Nature 1950, 165, 356–357. [Google Scholar] [CrossRef]
- Gebert, E.; Ackermann, R.J. Substoichiometry of Tungsten Trioxide; the Crystal Systems of WO3.00, WO2.98, and WO2.96. Inorg. Chem. 1966, 5, 136–142. [Google Scholar] [CrossRef]
- Berak, J.M.; Sienko, M.J. Effect of oxygen-deficiency on electrical transport properties of tungsten trioxide crystals. J. Solid State Chem. 1970, 2, 109–133. [Google Scholar] [CrossRef]
- Kieslich, G.; Birkel, C.; Douglas, J.E.; Gaultois, M.; Veremchuk, I.; Seshadri, R.; Stucky, G.D.; Grin, Y.; Tremel, W. SPS-assisted preparation of the Magnéli phase WO2.90 for thermoelectric applications. J. Mater. Chem. A 2013, 1, 13050–13054. [Google Scholar] [CrossRef]
- Kieslich, G.; Burkhardt, U.; Birkel, C.; Veremchuk, I.; Douglas, J.E.; Gaultois, M.; Lieberwirth, I.; Seshadri, R.; Stucky, G.D.; Grin, Y.; et al. Enhanced thermoelectric properties of the n-type Magnéli phase WO2.90: Reduced thermal conductivity through microstructure engineering. J. Mater. Chem. A 2014, 2, 13492–13497. [Google Scholar] [CrossRef]
- Venables, D.; Brown, M. Reduction of tungsten oxides with carbon. Part 1: Thermal analyses. Thermochim. Acta 1996, 282, 251–264. [Google Scholar] [CrossRef]
- Woodward, P.M.; Sleight, A.W.; Vogt, T. Ferroelectric Tungsten Trioxide. J. Solid State Chem. 1997, 131, 9–17. [Google Scholar] [CrossRef]
- Gulbransen, E.A.; Andrew, K.F. Kinetics of the Oxidation of Pure Tungsten from 500 to 1300 C. J. Electrochem. Soc. 1960, 107, 619–628. [Google Scholar] [CrossRef]
- Bamwenda, G.R.; Arakawa, H. The Visible Light Induced Photocatalytic Activity of Tungsten Trioxide Powders. Appl. Catal. A Gen. 2001, 210, 181–191. [Google Scholar] [CrossRef]
- Bolzan, H.; Kennedy, B.; Howard, C. Neutron Powder Diffraction Study of Molybdenum and Tungsten Dioxides. Aust. J. Chem. 1995, 48, 1473–1477. [Google Scholar] [CrossRef]
- Magneli, A. Crystal structure studies on β–tungsten oxide. Ark. Kemi 1949, 1, 223–230. [Google Scholar]
- Viswanathan, K.; Brandt, K.; Salje, E. Crystal structure and charge carrier concentration of W18O49. J. Solid State Chem. 1981, 36, 45–51. [Google Scholar] [CrossRef]
- Lamire, M.; Labbe, P.; Goreaud, M.; Raveau, B. Refining and new analysis of W18O49 structure. Rev. Chim. Miner. 1987, 24, 369–381. [Google Scholar]
- Sundberg, M. Structure determination from HREM images: Application to a new binary tungsten oxide. Chem. Scr. 1979, 14, 161–166. [Google Scholar]
- Magnéli, A. Structures of the ReO3-type with recurrent dislocations of atoms: ‘homologous series’ of molybdenum and tungsten oxides. Acta Cryst. 1953, 6, 495–500. [Google Scholar] [CrossRef]
- Vogt, T.; Woodward, P.M.; Hunter, B.A. The High-Temperature Phases of WO3. J. Solid State Chem. 1999, 144, 209–215. [Google Scholar] [CrossRef]
- Molenda, J.; Kubik, A. Transport properties and reactivity of tungsten trioxide. Solid State Ion. 1999, 117, 57–64. [Google Scholar] [CrossRef]
- Akselrud, L.; Grin, Y. WinCSD: Software package for crystallographic calculations (Version 4). J. Appl. Cryst. 2014, 47, 803–805. [Google Scholar] [CrossRef]
- NIST Chemical Kinetics Database: Tungsten Oxide (WO3). Available online: http://kinetics.nist.gov/janaf/html/O-065.html (accessed on 20 April 2017).
- NIST Chemical Kinetics Database: Tungsten Oxide (WO3). Available online: http://kinetics.nist.gov/janaf/html/O-047.html (accessed on 20 April 2017).
- Hyun-Sik, K.; Gibbs, Z.M.; Tang, Y.; Wang, H.; Snyder, G.J. Characterization of Lorenz number with Seebeck coefficient measurement. APL Mater. 2015, 3, 041506. [Google Scholar] [CrossRef]
- Wadsley, H.D. Nonstoichiometric Metal Oxides—Order and Disorder. In Nonstoichiometric Compounds; Gould, R.D., Ed.; American Chemical Society: Washington, DC, USA, 1963; pp. 23–36. [Google Scholar] [CrossRef]
- Salje, E.K.; Rehmann, S.; Pobell, F.; Morris, D.; Knight, K.S.; Herrmannsdörfer, T.; Dovey, M.T. Crystal structure and paramagnetic behaviour of ε-WO3−x. J. Phys. Condens. Matter 1997, 9, 6563–6577. [Google Scholar] [CrossRef]
- Woodward, P.M.; Sleight, A.W.; Vogt, T. Structure refinement of triclinic tungsten trioxide. J. Phys. Chem. Solids 1995, 56, 1305–1315. [Google Scholar] [CrossRef]
Figure 1.
(a) Phase diagram of the binary system W-O in the range of the O/W-ratio 2 ≤ x ≤ 3 [20]. Dashed lines mark the sample compositions prepared and characterized in this work. A metastable phase “WO2.82” (orange) is found; (b–e) Crystal structures and respective colors of the known tungsten oxide phases. Characteristic features are the [WO6] octahedra (grey), pentagonal columns (PC) and crystallographic shear (CS) planes (green). For clarity, only the monoclinic γ-WO3 is shown among the WO3 modifications.
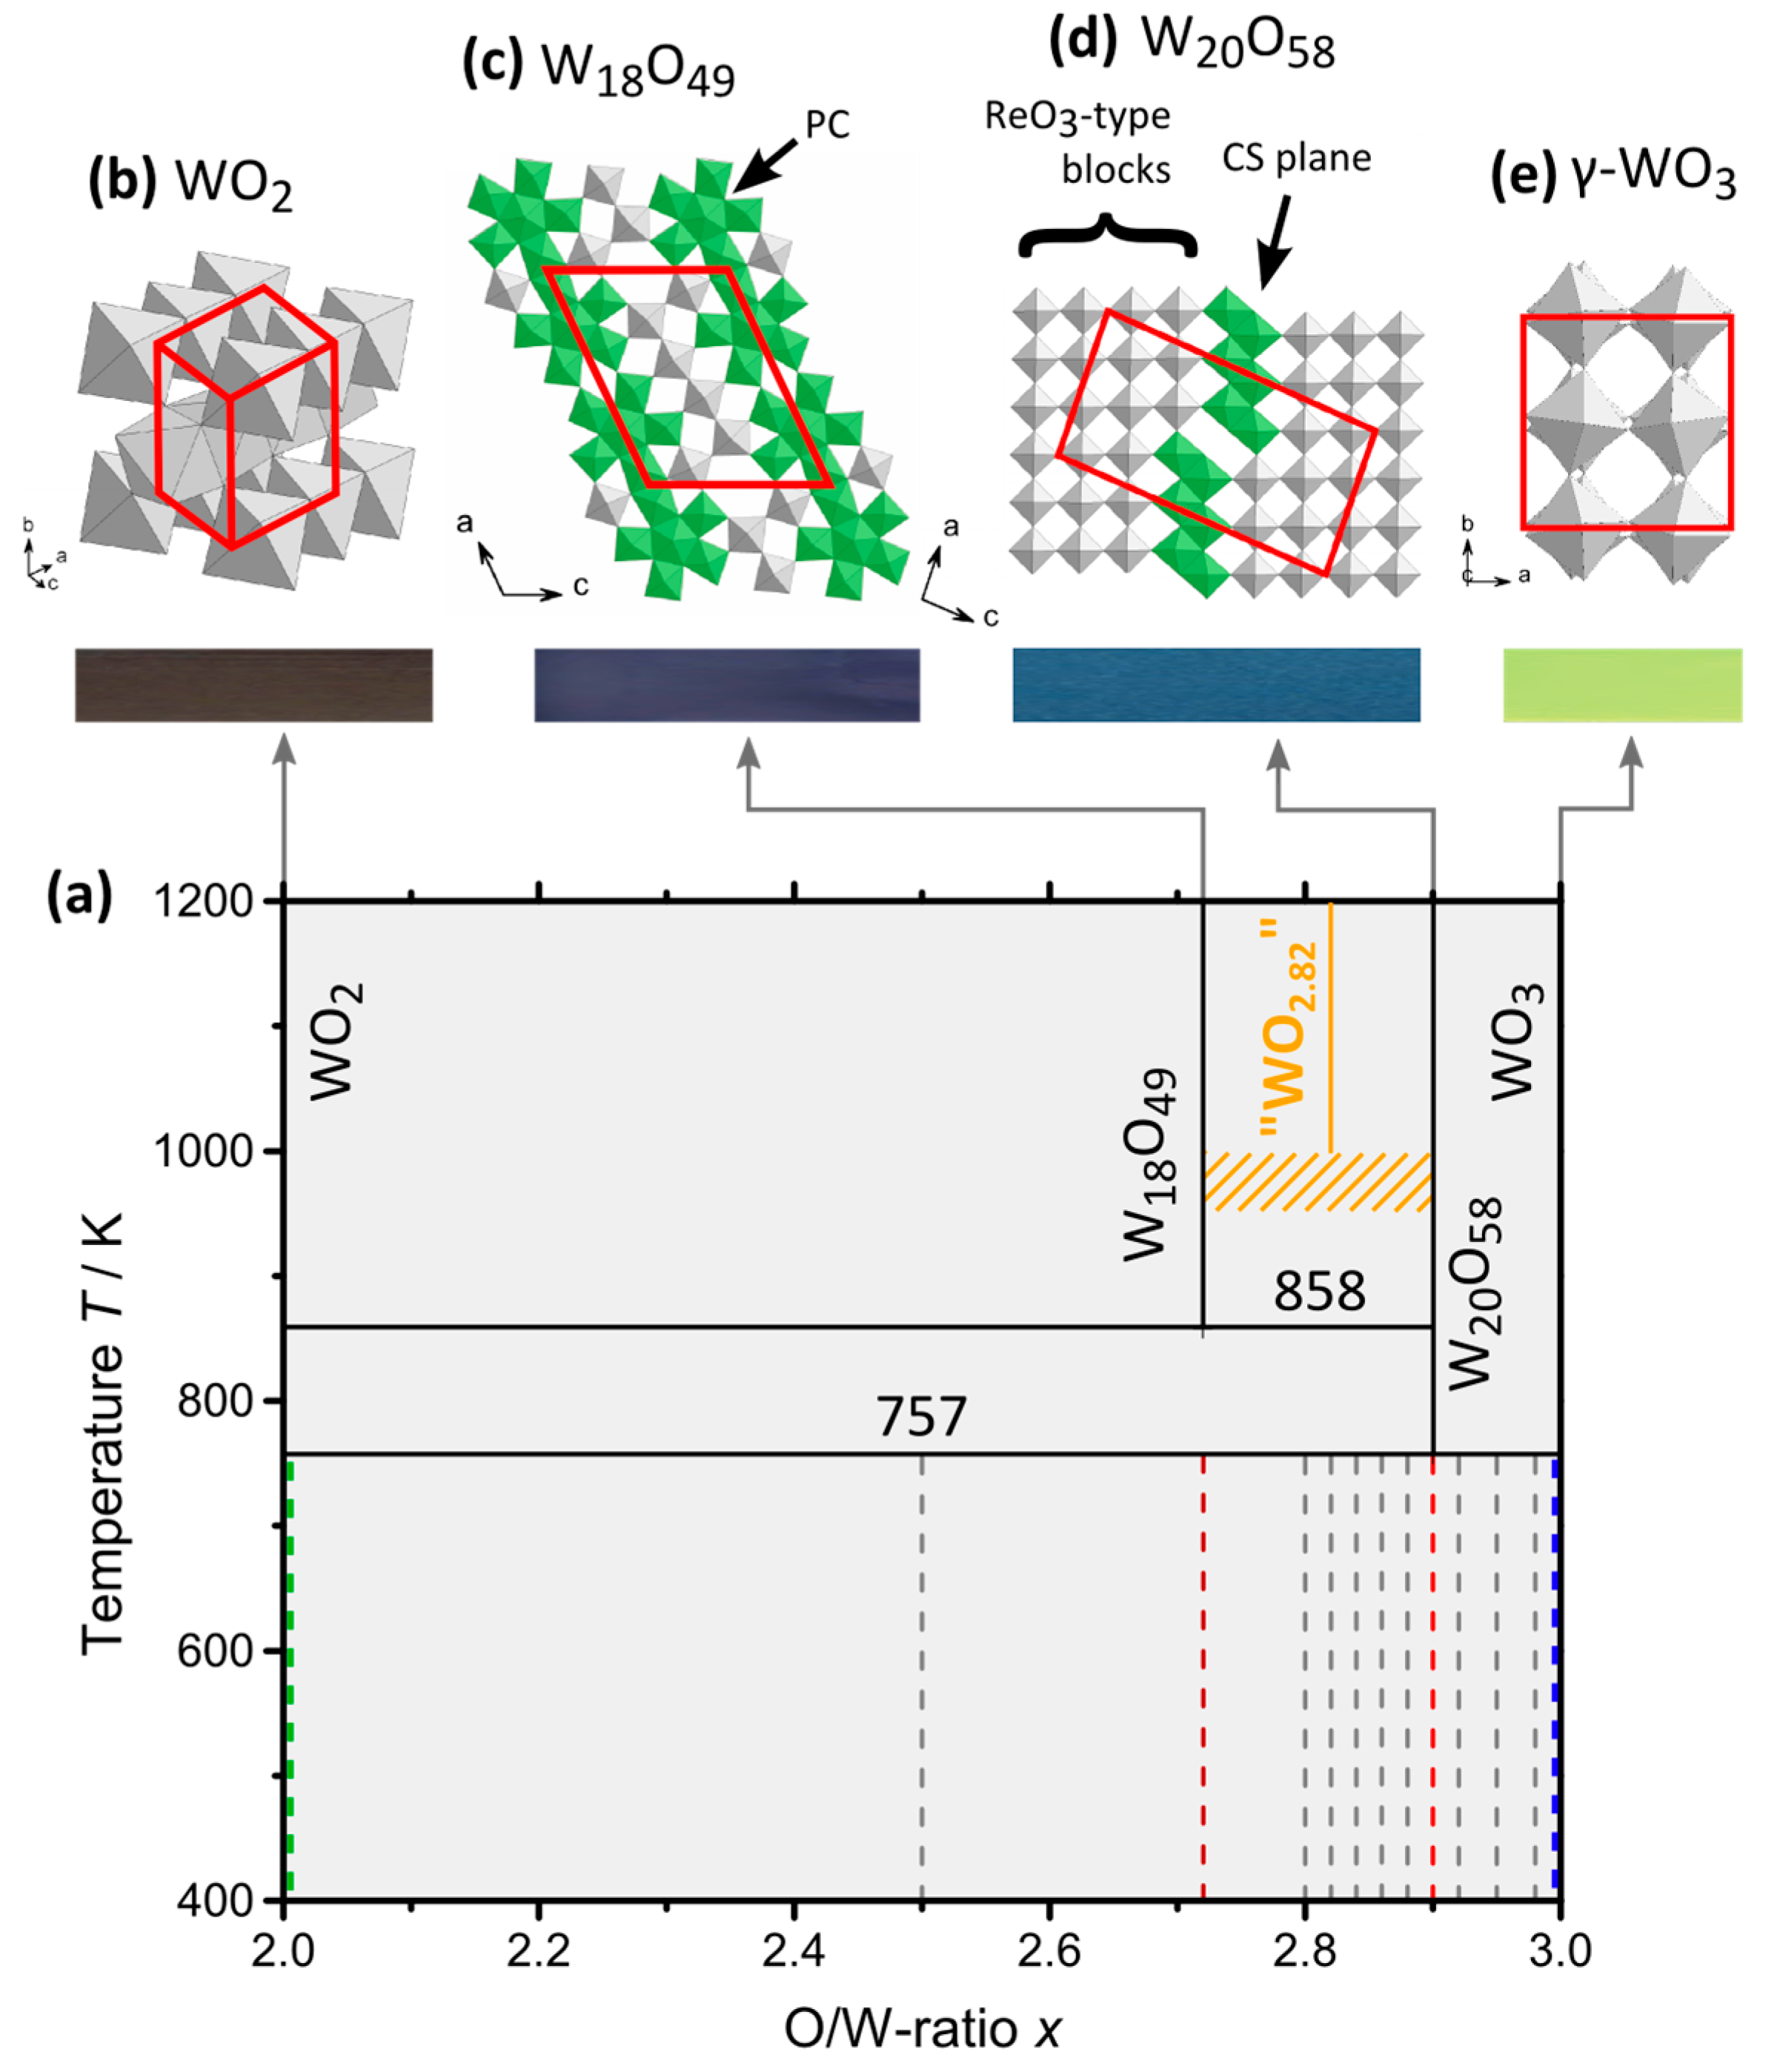
Figure 2.
(a) Setup of the spark plasma sintering (SPS) machine; (b) Scheme of the filled SPS die; (c) Sample powder reacted in the SPS and compacted to pellets. For measurements tetragonal bars with a ≈ 1.5 mm and b ≈ 6–8 mm were cut.
Figure 2.
(a) Setup of the spark plasma sintering (SPS) machine; (b) Scheme of the filled SPS die; (c) Sample powder reacted in the SPS and compacted to pellets. For measurements tetragonal bars with a ≈ 1.5 mm and b ≈ 6–8 mm were cut.

Figure 3.
PXRD patterns (Cu-Kα1 radiation) of the reference materials obtained by SPS: (a) Single-phase WO2.72 after two-step treatment with surface cleaning and grinding in between; (b) Single-phase WO2.90 after one-step treatment; (c) WO3 sample contains two modification γ- and δ-WO3 after SPS and subsequent annealing in open air (1170 K, 68 h).
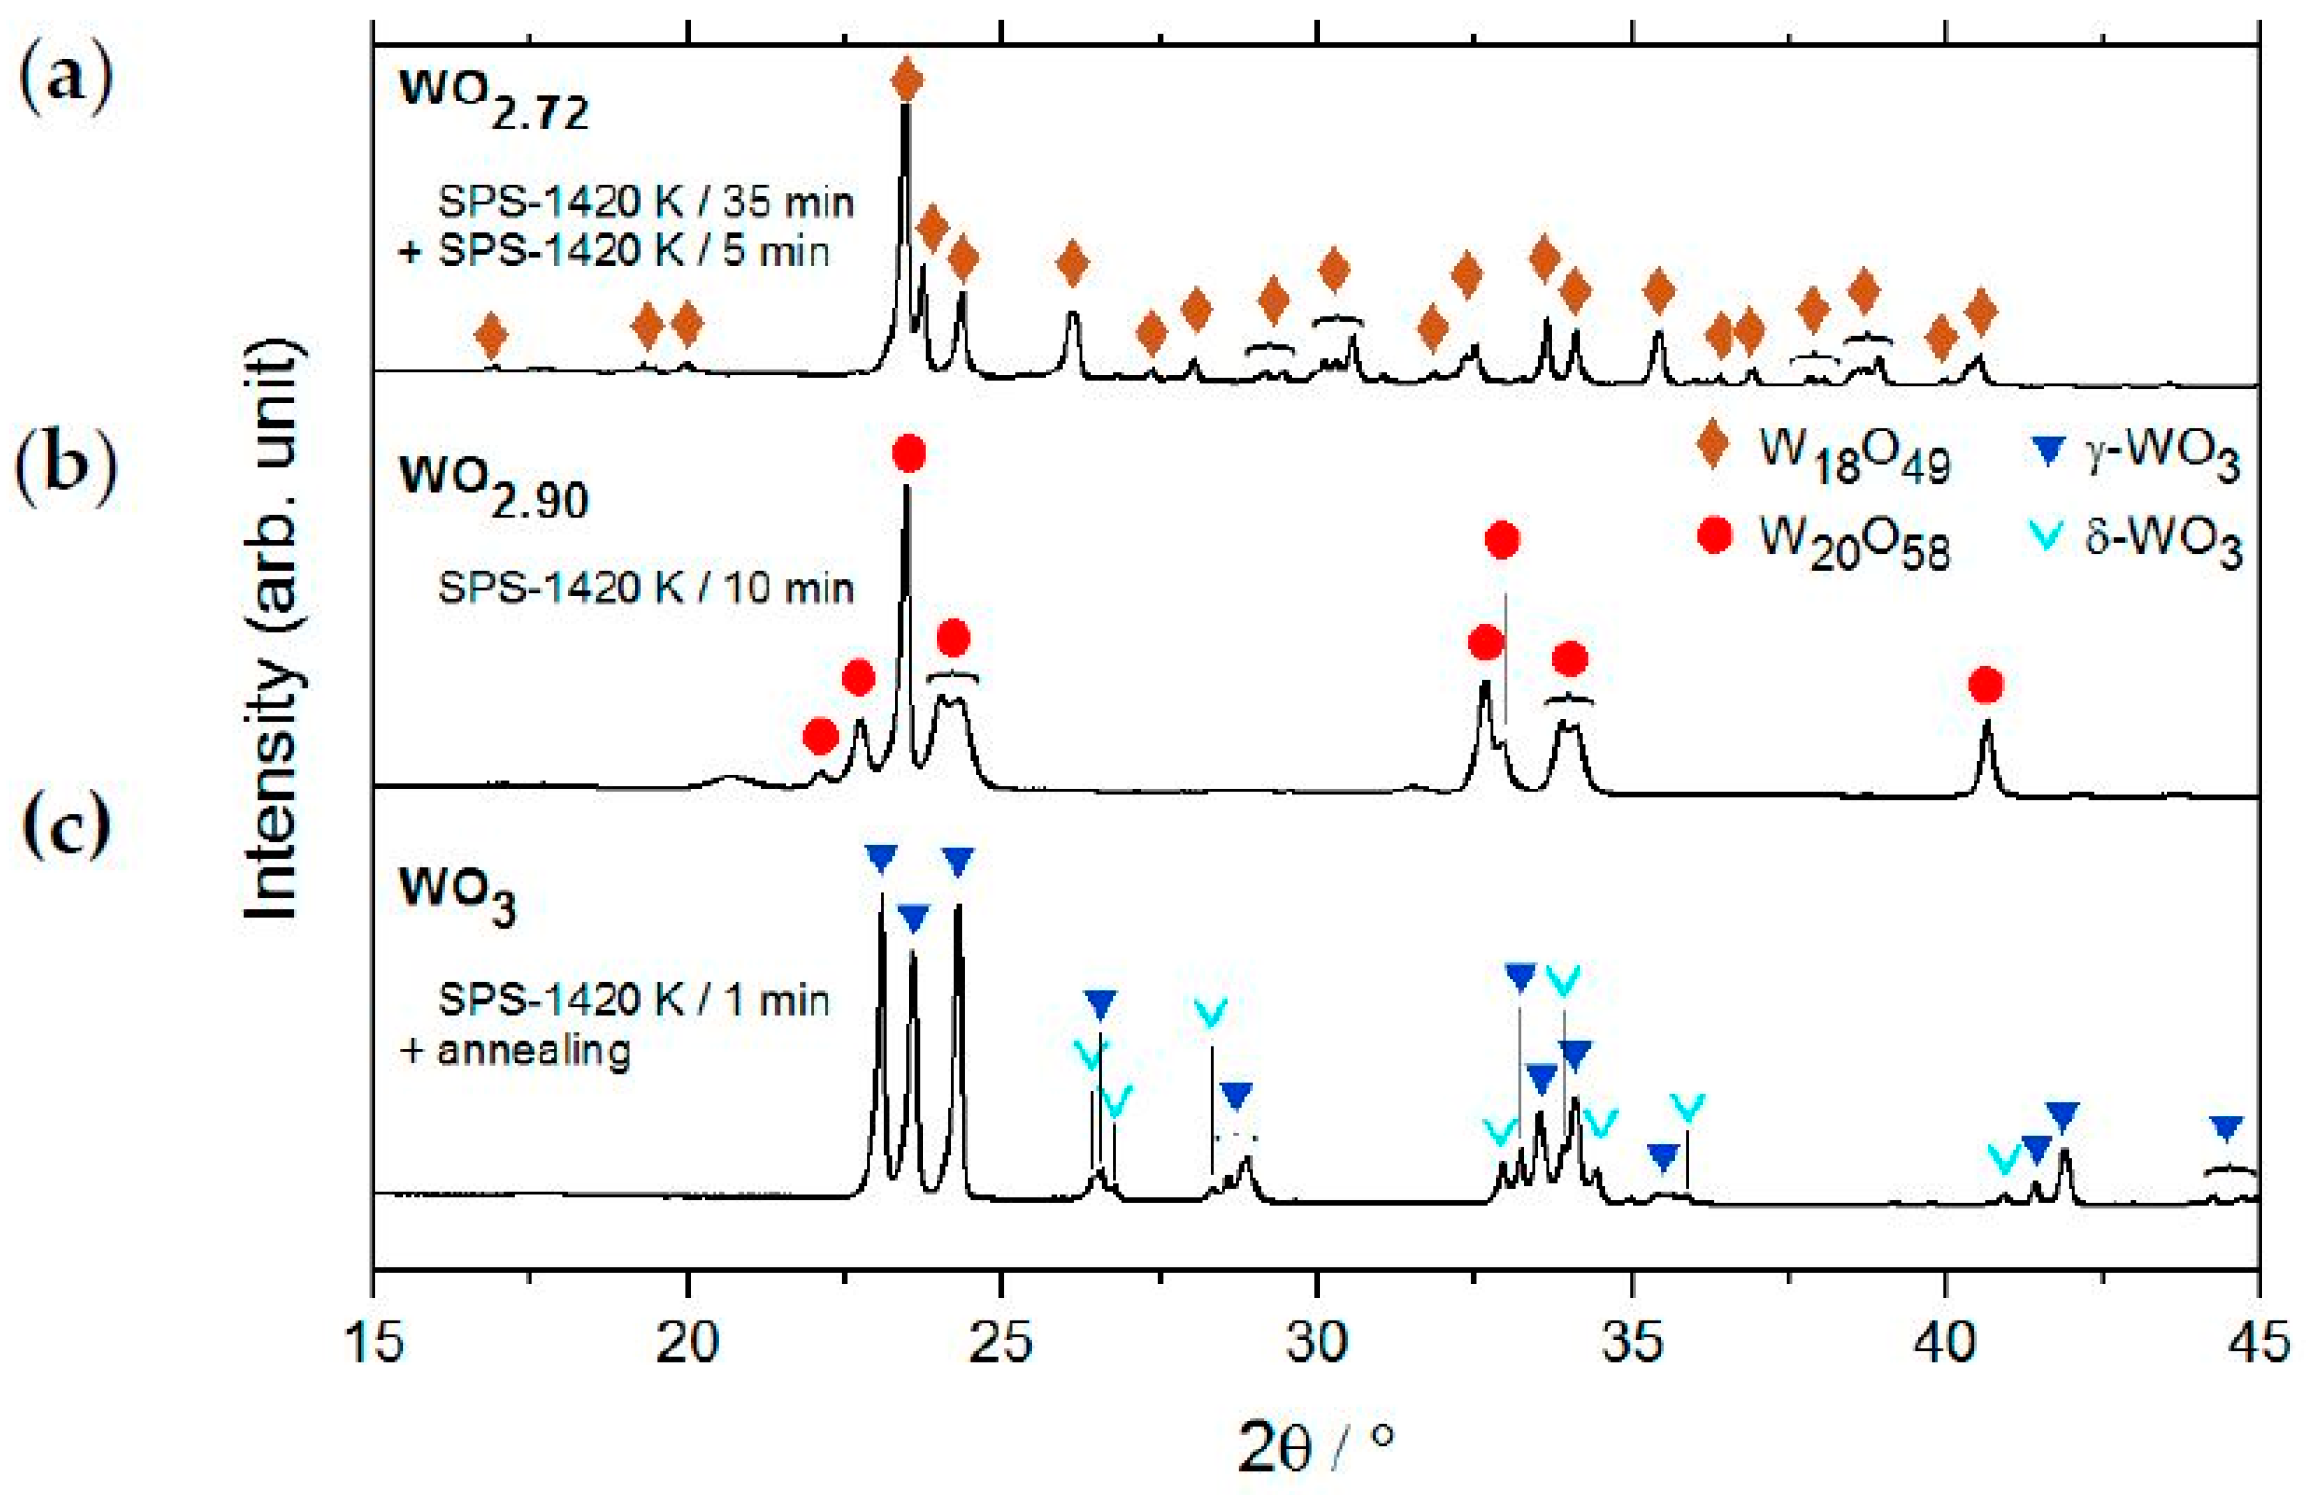
Figure 4.
PXRD patterns (Cu-Kα1 radiation) of the WOx samples processed with SPS-1420/10 min. Only the WO2 reference sample was compacted with SPS-1470 K/10 min (green line).
Figure 4.
PXRD patterns (Cu-Kα1 radiation) of the WOx samples processed with SPS-1420/10 min. Only the WO2 reference sample was compacted with SPS-1470 K/10 min (green line).

Figure 5.
HR-TEM images of SPS-prepared WO2.90 material along (a–c) [001] and (d–f) [010]. (a) Good ordering is found for the zone [001]; (b) The Fourier-filtered micrograph reveals a lattice with long-range variations; (c) Yellow-marked reflections in the corresponding FFT image indicate a superstructure; (d) CS planes are found for the [010] zone, however massive disorder is observed with deviations of CS plane orientations of about 44°; (e) Zooming and filtering reveals short-range order along [001]; (f) FFT with broadened and diffuse (001) reflection confirms disturbance of the atomic arrangement along [001].

Figure 6.
Thermal conductivity of the oxides WO2, WO2.72, WO2.90 and WO3: (a) Total thermal conductivity κtot; (b) Lattice contribution κlat = κtot − κel with κel from the Wiedemann-Franz law. Mind the different scales of the broken axis.
Figure 6.
Thermal conductivity of the oxides WO2, WO2.72, WO2.90 and WO3: (a) Total thermal conductivity κtot; (b) Lattice contribution κlat = κtot − κel with κel from the Wiedemann-Franz law. Mind the different scales of the broken axis.
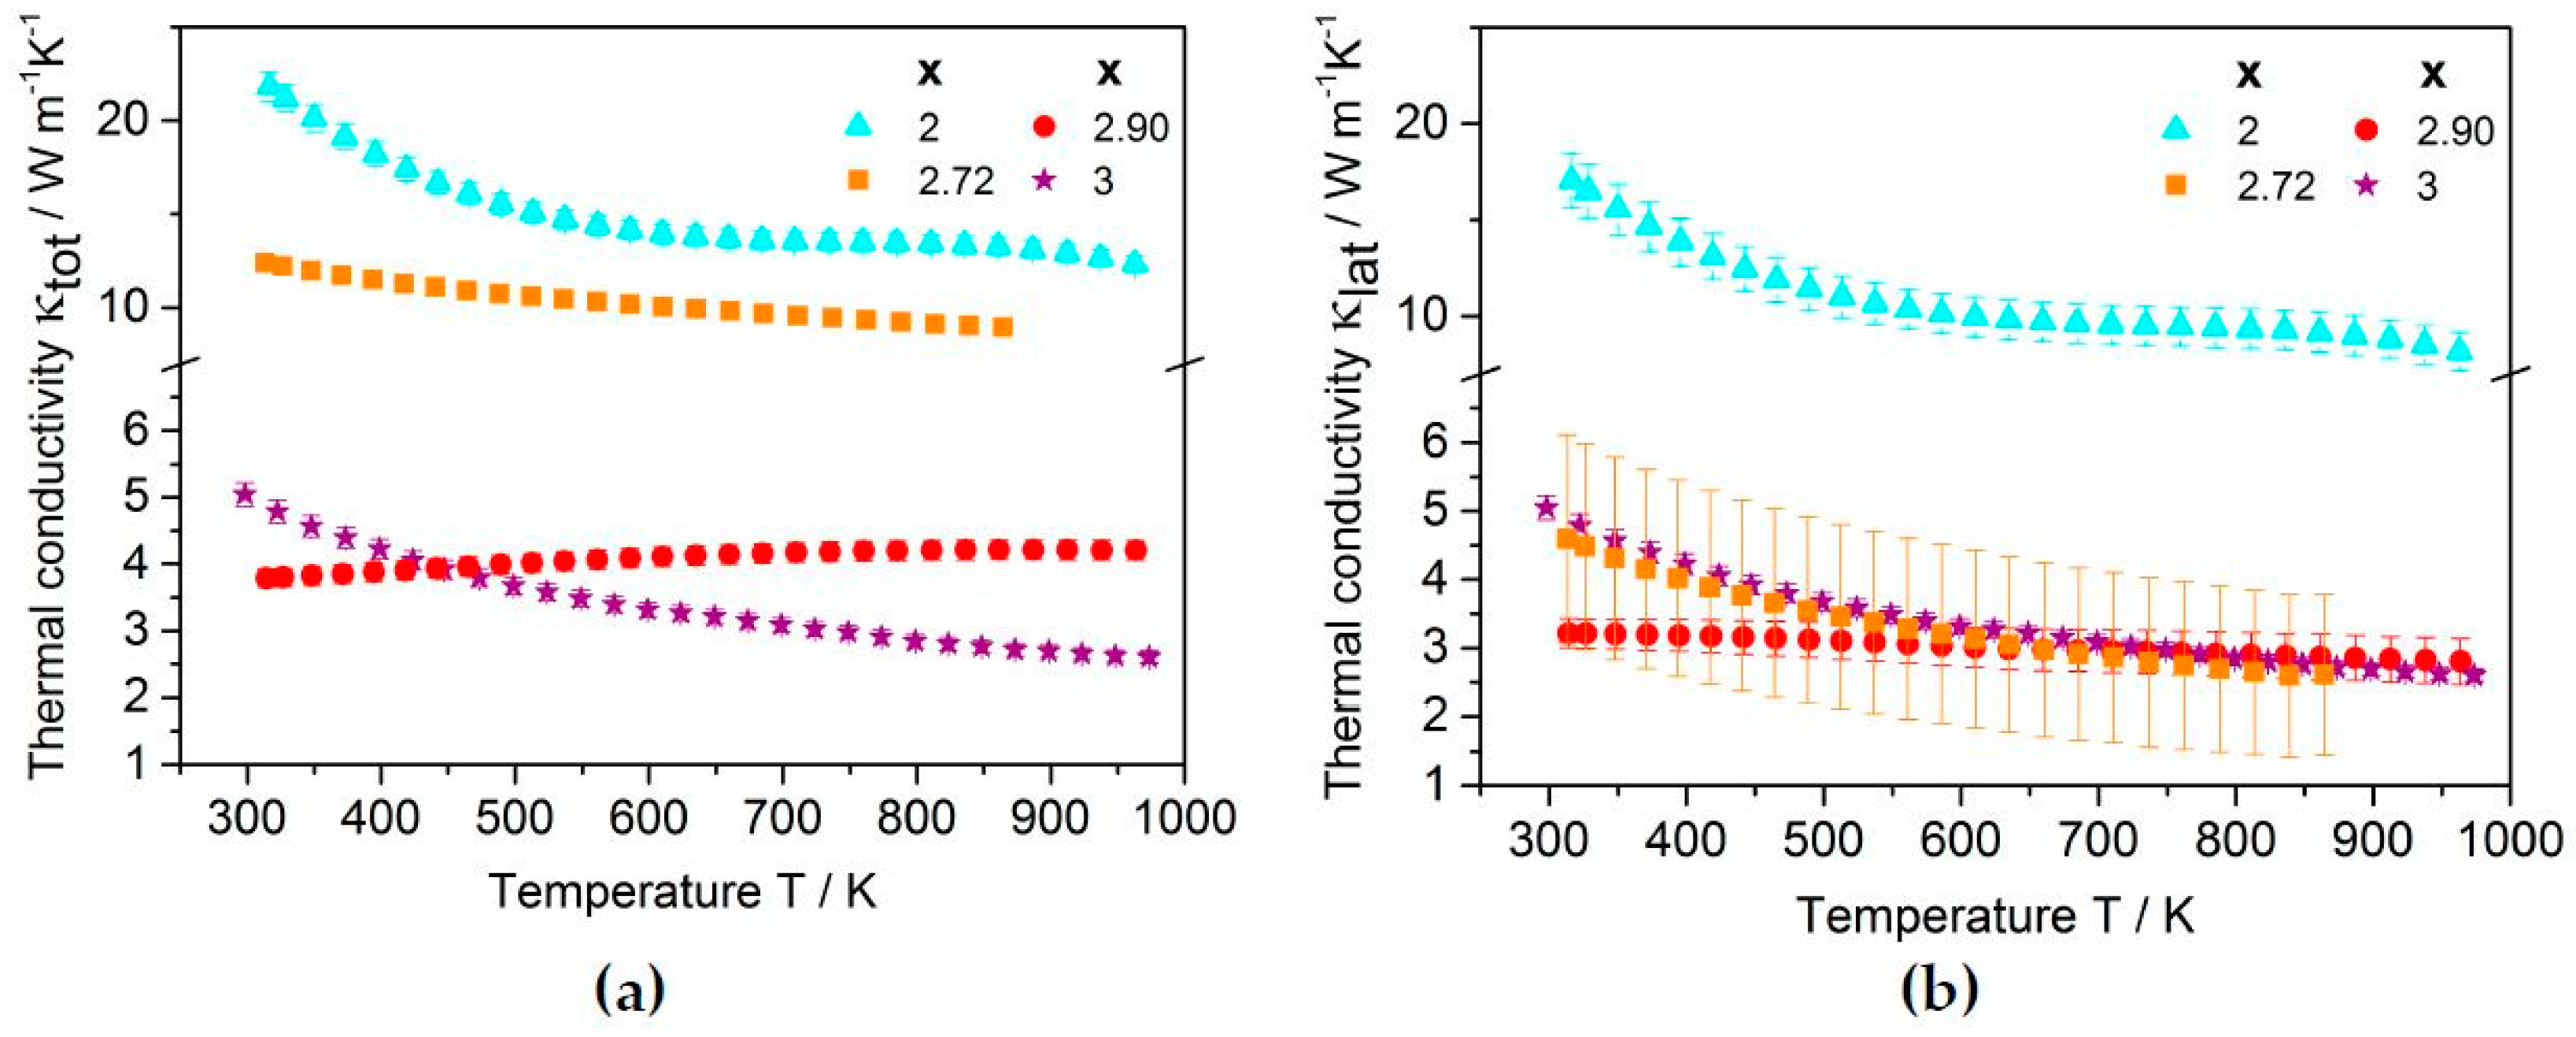
Figure 7.
Polarized light microscopy (PLM) of WOx materials. A yellowish-to-red-to-bluish color variation with increasing O/W-ratio x is observed due to the different optical reflectivity of the occurring phases.
Figure 7.
Polarized light microscopy (PLM) of WOx materials. A yellowish-to-red-to-bluish color variation with increasing O/W-ratio x is observed due to the different optical reflectivity of the occurring phases.
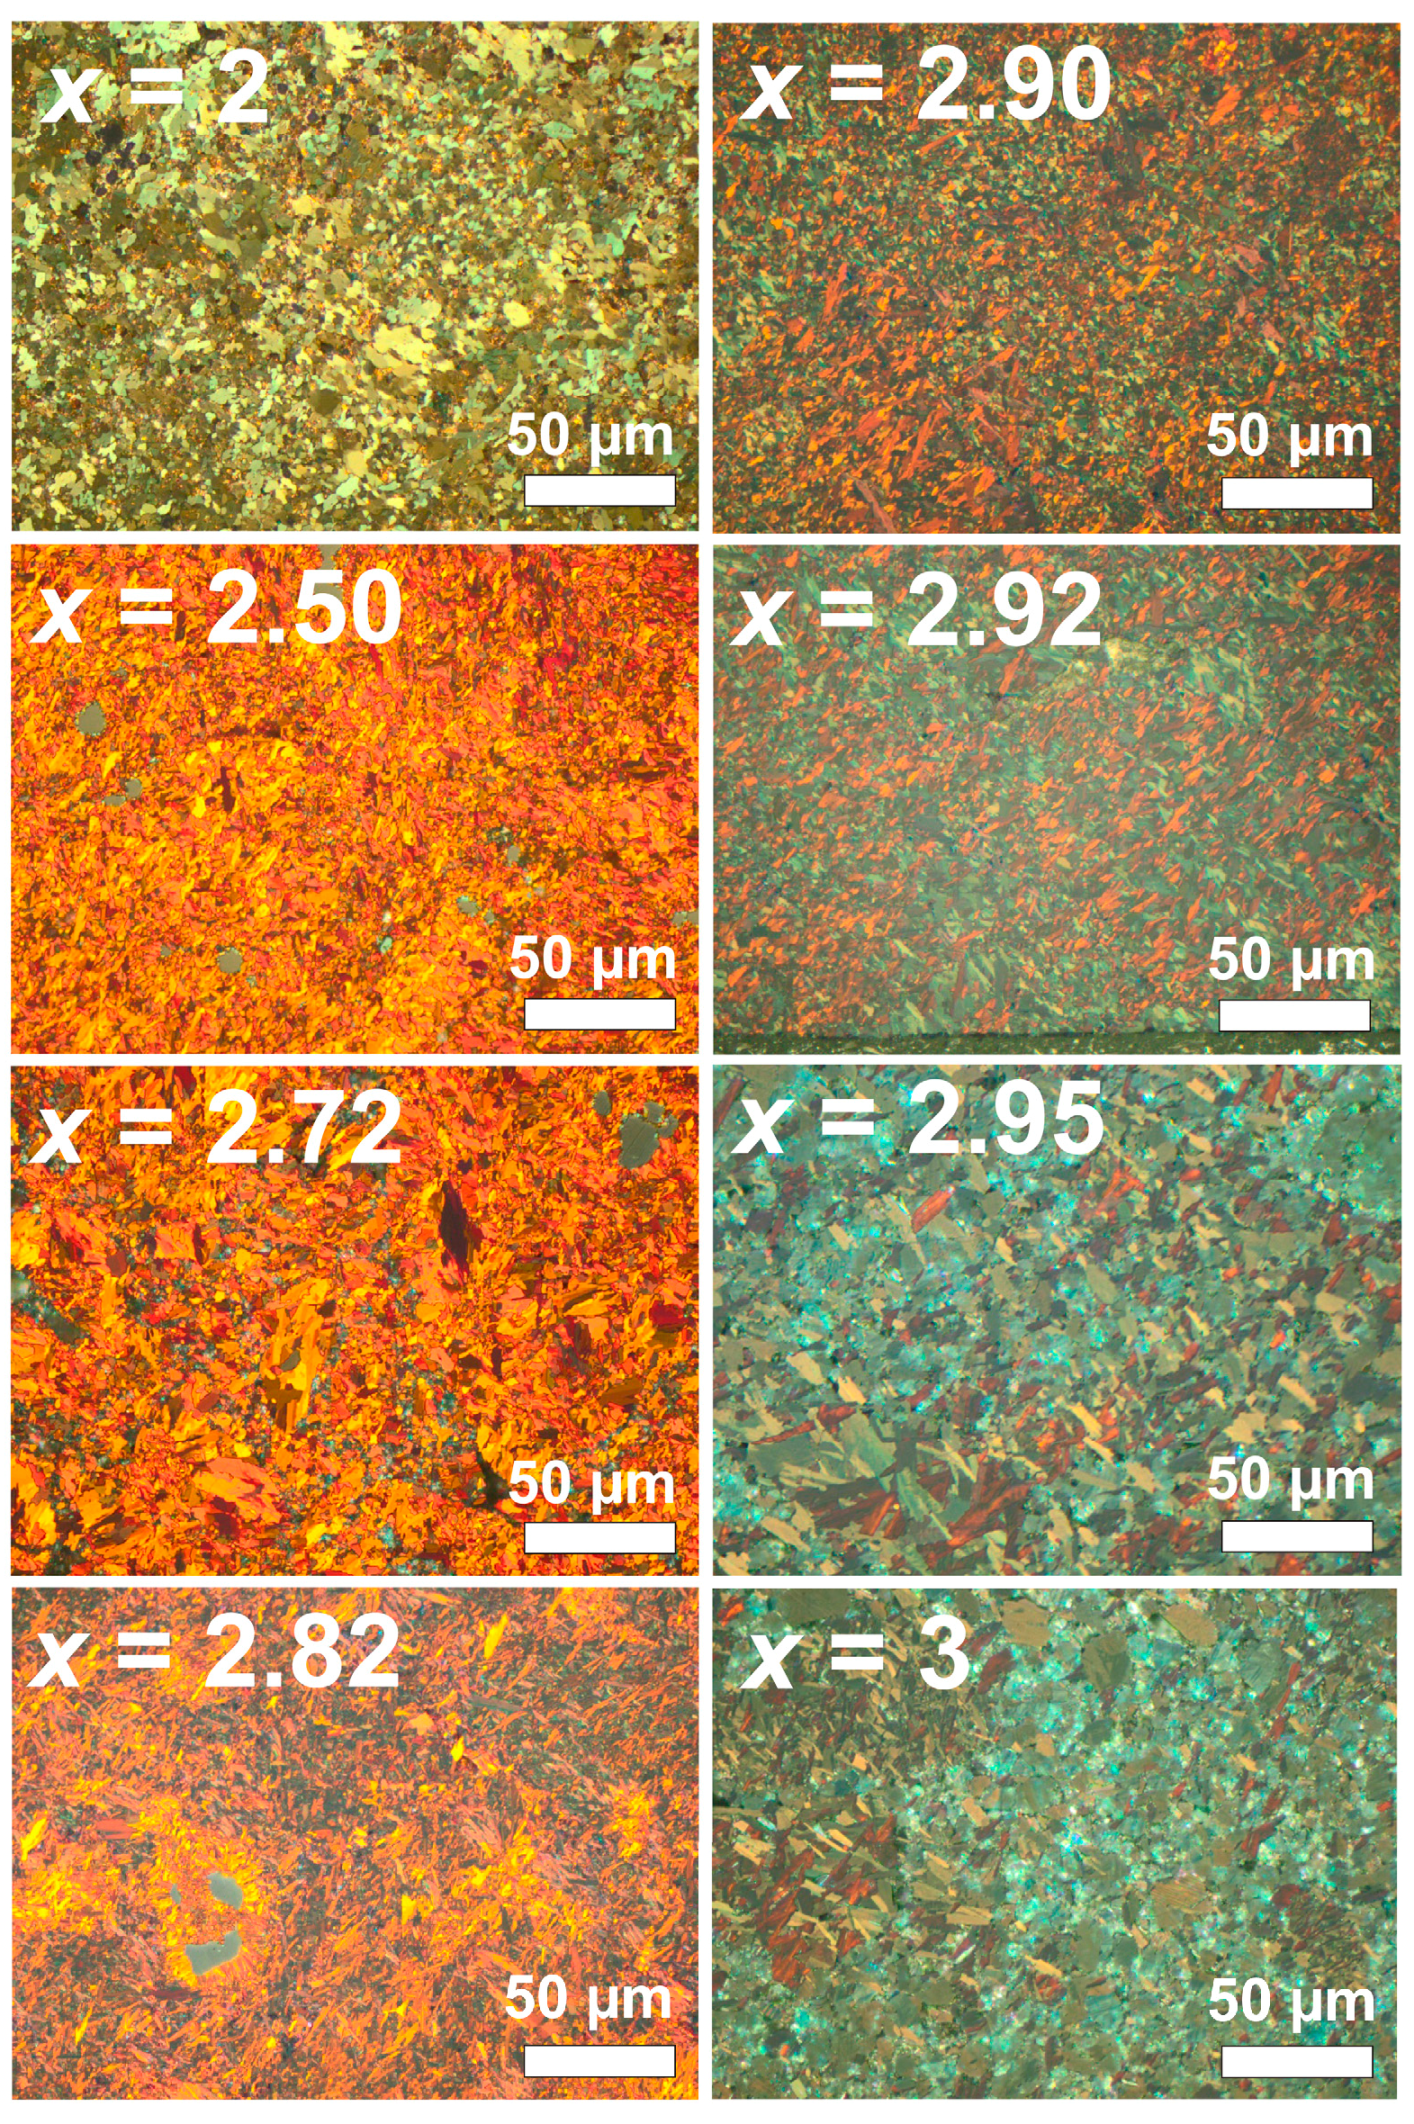
Figure 8.
(a) Electrical conductivity σ(T) of the WOx samples (2.80 ≤ x ≤ 2.98); (b) The temperature dependence of σ(T) clearly changes from nonmetallic to metallic at x ≈ 2.90.
Figure 8.
(a) Electrical conductivity σ(T) of the WOx samples (2.80 ≤ x ≤ 2.98); (b) The temperature dependence of σ(T) clearly changes from nonmetallic to metallic at x ≈ 2.90.

Figure 9.
Thermoelectric properties of the WOx samples (2.80 ≤ x ≤ 2.98): (a) Seebeck coefficient α(T) and (b) resulting figures of merit ZT. Error of α(T) is asymmetric.
Figure 9.
Thermoelectric properties of the WOx samples (2.80 ≤ x ≤ 2.98): (a) Seebeck coefficient α(T) and (b) resulting figures of merit ZT. Error of α(T) is asymmetric.

Figure 10.
Thermal conductivity of the WOx samples (2.80 ≤ x ≤ 3): (a) Total thermal conductivity κtot(T); (b) Lattice contribution κlat = κtot − κel with κel from the Wiedemann-Franz law. The inset shows the dependency κlat (x) for 315 K and 864 K.
Figure 10.
Thermal conductivity of the WOx samples (2.80 ≤ x ≤ 3): (a) Total thermal conductivity κtot(T); (b) Lattice contribution κlat = κtot − κel with κel from the Wiedemann-Franz law. The inset shows the dependency κlat (x) for 315 K and 864 K.

Table 1.
Lattice parameters of phases in the tungsten–oxygen binary system refined from PXRD patterns in this work in comparison to literature data (iv—long-term heating in vacuo, SPS—spark plasma sintering, n.a.—not specified in the reference).
Table 1.
Lattice parameters of phases in the tungsten–oxygen binary system refined from PXRD patterns in this work in comparison to literature data (iv—long-term heating in vacuo, SPS—spark plasma sintering, n.a.—not specified in the reference).
| x | Phase | Source | Space Group | Lattice Parameters | Ref. | ||||
|---|---|---|---|---|---|---|---|---|---|
| a | b | c | β | V | |||||
| Å | Å | Å | deg | Å3 | |||||
| 2 | WO2 | n.a. | P21/c | 5.58 | 4.90 | 5.664 | 120.7 | 133.1 | [30] |
| commercial | 5.574(1) | 4.898(1) | 5.662(1) | 120.69(1) | 132.9(2) | this work | |||
| SPS | 5.575(1) | 4.900(1) | 5.663(1) | 120.70(1) | 133.0(1) | this work | |||
| 2.72 | W18O49 | n.a. | P2/m | 18.32 | 3.79 | 14.04 | 115.0 | 883.3 | [31] |
| iv | 18.33 | 3.79 | 14.04 | 115.2 | 882.1 | [32] | |||
| n.a. | 18.32 | 3.78 | 14.03 | 115.2 | 879.5 | [33] | |||
| SPS | 18.32 | 3.79 | 14.04 | n/a | --- | [11] | |||
| SPS | 18.329(1) | 3.784(1) | 14.037(1) | 115.20(1) | 880.9(4) | this work | |||
| 2.83 | W12O34 | n.a. | P2/m | 17.0 | 3.8 | 19.4 | 105.3 | [34] | |
| SPS a | 17.229(1) | 3.782(1) | 19.496(1) | 105.77(1) | 1223(3) | this work | |||
| 2.90 | W20O58 | iv | P2/m | 12.1 | 3.78 | 23.4 | 85 | 1066.2 | [21] |
| calculated | 12.05 | 3.77 | 23.59 | 85.3 | 1067.2 | [35] | |||
| SPS | 12.08 | 3.78 | 23.59 | n/a | --- | [11] | |||
| SPS | 12.00 | 3.78 | 23.51 | 84.8 | 1062.0 | [24] | |||
| SPS | 12.080(3) | 3.782(1) | 23.62(1) | 85.36(1) | 1075.6(7) | this work | |||
| 2.92 | W25O73 | iv | P2/c | 11.93 | 3.82 | 59.72 | 98.3 | 2693.1 | [14] |
| 3 | γ-WO3 | commercial | P21/n | 7.33 | 7.56 | 7.73 | 90.5 | 428.3 | [36] |
| commercial | 7.299(1) | 7.537(1) | 7.689(1) | 90.88(1) | 422.9(1) | this work | |||
a Parameters determined from only 10 main reflections.
Table 2.
Phases observed from PXRD in WOx samples prepared with SPS-1420 K/10 min (●—observed, □—not observed).
Table 2.
Phases observed from PXRD in WOx samples prepared with SPS-1420 K/10 min (●—observed, □—not observed).
| x | Phases | |||||
|---|---|---|---|---|---|---|
| WO2 | W18O49 | “WO2.82” a | W20O58 | W25O73 b | γ/δ-WO3 | |
| 2 | ● | □ | □ | □ | □ | □ |
| 2.50 | ● | ● | □ | □ | □ | □ |
| 2.72–2.80 | □ | ● | ● | □ | □ | □ |
| 2.82–2.88 | □ | ● | ● | ● | □ | □ |
| 2.90 | □ | □ | □ | ● | □ | □ |
| 2.92–3 | □ | □ | □ | ● | ● | ● |
a Presumed composition of the new phase. Synchrotron data suggests this to be W12O34. b Phase hard to detect due to strong reflection overlapping.
© 2017 by the authors. Licensee MDPI, Basel, Switzerland. This article is an open access article distributed under the terms and conditions of the Creative Commons Attribution (CC BY) license (http://creativecommons.org/licenses/by/4.0/).
Share and Cite
MDPI and ACS Style
Kaiser, F.; Simon, P.; Burkhardt, U.; Kieback, B.; Grin, Y.; Veremchuk, I. Spark Plasma Sintering of Tungsten Oxides WOx (2.50 ≤ x ≤ 3): Phase Analysis and Thermoelectric Properties. Crystals 2017, 7, 271. https://doi.org/10.3390/cryst7090271
AMA Style
Kaiser F, Simon P, Burkhardt U, Kieback B, Grin Y, Veremchuk I. Spark Plasma Sintering of Tungsten Oxides WOx (2.50 ≤ x ≤ 3): Phase Analysis and Thermoelectric Properties. Crystals. 2017; 7(9):271. https://doi.org/10.3390/cryst7090271
Chicago/Turabian StyleKaiser, Felix, Paul Simon, Ulrich Burkhardt, Bernd Kieback, Yuri Grin, and Igor Veremchuk. 2017. "Spark Plasma Sintering of Tungsten Oxides WOx (2.50 ≤ x ≤ 3): Phase Analysis and Thermoelectric Properties" Crystals 7, no. 9: 271. https://doi.org/10.3390/cryst7090271
Note that from the first issue of 2016, this journal uses article numbers instead of page numbers. See further details here.