Article

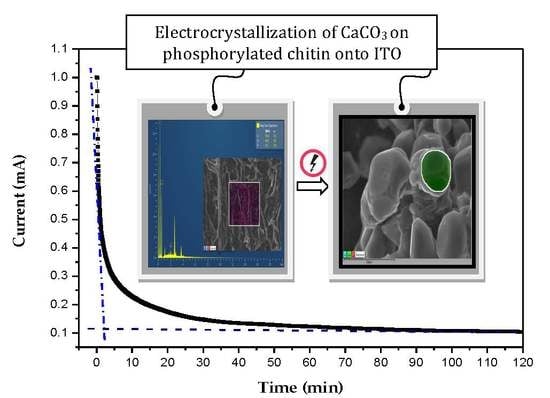
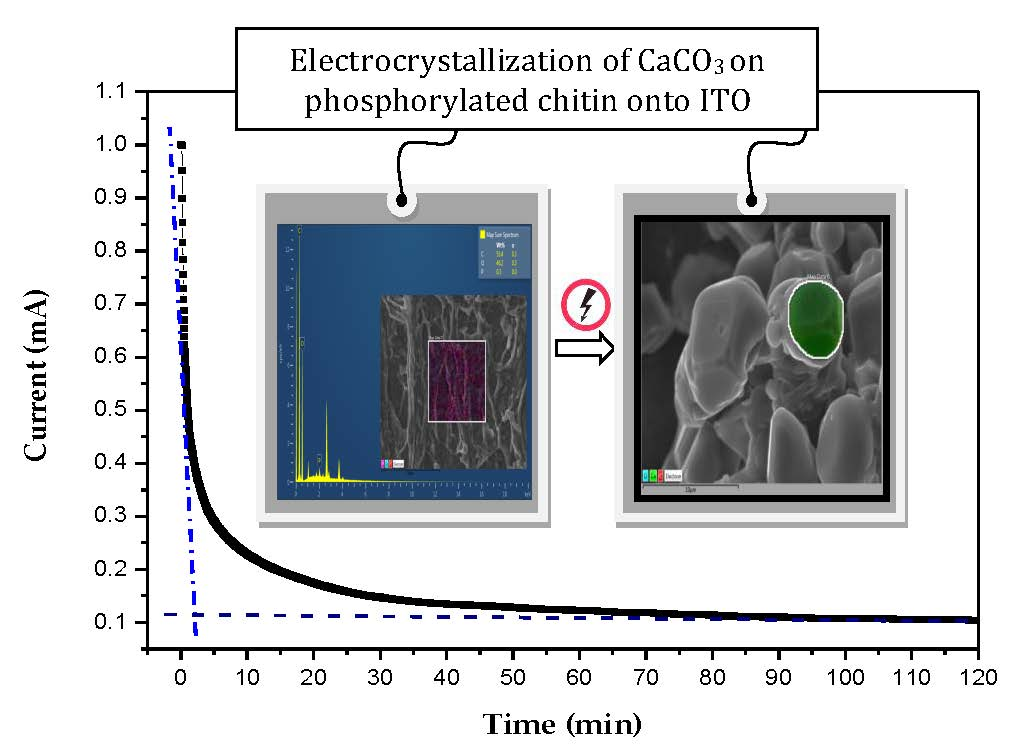
Electrocrystallization of CaCO3 Crystals Obtained through Phosphorylated Chitin

by
Nicole Butto
1,
Gustavo Cabrera-Barjas
2,* and
Andrónico Neira-Carrillo
1,*
1
Department of Biological and Animal Sciences, Faculty of Veterinary and Animal Sciences, University of Chile, P.O. Box 2-15, 832000 Santiago, Chile
2
Unit for Technology Development (UDT), University of Concepción, Av. Cordillera 2634, Parque Industrial Coronel, P.O. Box 4051 mail 3, Concepción, Chile
*
Authors to whom correspondence should be addressed.
Crystals 2018, 8(2), 82; https://doi.org/10.3390/cryst8020082
Submission received: 22 December 2017 / Revised: 31 January 2018 / Accepted: 2 February 2018 / Published: 3 February 2018
(This article belongs to the Special Issue Carbonates)

Abstract

:
A phosphorylated chitin (Chi-P) derivative was synthesized and its chemical structure was verified with Fourier-transform infrared spectroscopy (FTIR), elemental analysis, and thermogravimetric techniques (TGA). The influence of Chi-P used as a solid template through in vitro electrocrystallization (EC) supported on an indium zinc oxide (ITO) surface on the growth of calcium carbonate (CaCO3) was studied. CaCO3 crystals through EC essays were also compared with crystals obtained with the gas diffusion (GD) method. Scanning electron microscopy (SEM), energy dispersive X-ray spectrometry (EDS), chronopotentiometry, Raman, and powder X-ray diffractometry (XRD) characterized all resultant inorganic particles. Our findings revealed that the EC method selectively controlled the coexistence of truncate calcite and the metastable phase of vaterite. The crystals’ morphology reflects the electrostatic interaction of phosphate moieties from Chi-P onto CaCO3 crystals through both EC and GD crystallization methods. We believe that the EC method represents a viable electrochemical approach for studying different inorganic minerals and could be useful as an in vitro classical crystallization method for the design of advanced inorganic materials with desirable shapes and properties.

Graphical Abstract

1. Introduction

Biological crystallization is the process by which living organisms produce hybrid biogenic composites and exert accurate control over the minerals they deposit, creating advanced materials with uniform particle size, novel morphology, and myriad shapes or sizes that often exhibit high strength and remarkable properties [1,2,3,4]. It is known that the inorganic crystallization mechanism is altered by specific interactions between chemical groups, such as –CO2H, –PO3H, –SO3H containing insoluble additives or functionalized networks as solid templates [5,6,7,8,9,10]. In this sense, calcium carbonate (CaCO3) represents the most abundant biomineral in nature and it has considerable industrial interest. It nucleates in three known crystalline polymorphs: calcite, aragonite and vaterite [11,12,13]. For understanding the biological control of CaCO3 crystallization many studies regarding the effect of natural and synthetic polymers, copolymers, functionalized biopolymers, and adsorption surface phenomena involved in this process have been reported [14,15,16,17,18,19,20]. In order to achieve control over this biomineral it is important to understand the mechanisms of how crystals interacts between organic and inorganic components using different classical crystallization setup in a similar manner that they occur in nature. Such selective control is governed by different functionalized biomolecules, including proteins, polysaccharides, glycosaminoglycan, etc. Therefore, control of polymorphs of CaCO3 is strongly affected by additives chemical groups (e.g., carboxylic, phosphate), crystallization method, and precipitation conditions (e.g., pH, concentration, temperature, etc.) [21,22,23,24,25]. Sulfate groups in biopolymers and phosphate groups of proteins have been known as active groups on biomineralization of hard bioceramic exoskeletons and eggshell calcified layer [8,26]. We expected that functionalized biopolymers like phosphorylated chitin (Chi-P) used as a solid template could be an efficient crystallization modifier acting by adsorption onto the active growth sites of the CaCO3 surface under the biopolymer-controlled crystallization concept. It is well known that chitinous and collagenous components represent the main structural skeletal system, which support the cellular structure of abundant animal tissues with active roles on biological mineralization [27,28]. Moreover, non-functionalized chitin (Chi) in the structural and shell formation at in vitro level has been described as a non-mineralized laminar substrate or framework, which compartmentalizes a microenvironment where mineralization take place [29].
On the other hand, gas diffusion (GD) crystallization has been widely employed to study the effect of a number of ionic macromolecules (proteins, polysaccharides, surfactants) and biological organic support (egg-shell matrix, gastrolith) on CaCO3 crystallization [30,31,32,33,34,35,36,37]. Meanwhile, the electrocrystallization (EC) method, as an electrochemical concept approach, represents a novel crystallization technique of inorganic materials, such as calcium salts (carbonate, sulfate, oxalate, etc.). It is important to note that the EC method has some technical advantages, e.g., control of applied voltage and current, concentration of additives, times that are precisely controlled inducing selective control of the type of crystals grown onto the indium zinc oxide (ITO) substrate [38,39,40,41], etc. In this regard, our group has recently extracted and purified alginate from Chilean algae (Lessonia nigrescens), and tested the plant extract from Dendroligotrichum dendroide polytrichaceae (Chilean family) as an additive on CaCO3 and calcium oxalate (CaOx) through EC on electrospun polycaprolactone fibers [42].
The aim of this work was to study the influence of phosphorylated chitin (Chi-P) on CaCO3 particles through EC method supported onto a conductive ITO glass surface, and the obtained crystals were compared to those obtained with the gas diffusion (GD) method. This study was supported and performed in the context of the active anionic groups on biomineralization, low solubility of Chi-P in acid form, and the scarce knowing effect of Chi derivatives on in vitro CaCO3 crystallization.

2. Materials and Methods

2.1. Reactants

Calcium chloride dihydrate (CaCl2·2H2O), sodium bicarbonate (NaHCO3), sodium hydroxide (NaOH), sodium chloride (NaCl) and potassium nitrate (KNO3), methanesulfonic acid and phosphorous pentoxide were obtained from Merck (Kenilworth, NJ, USA). All solvents and other reagents were of the highest available purity. Indium zinc oxide (ITO) conductive glass electrodes were used as the conductive material for electrocrystallization of CaCO3 and were purchased from Delta Technologies (Dallas, TX, USA). ITO working electrodes were purchased from Corning® and aluminosilicate glass, 25 × 25 × 1.1 mm, coated with one surface of RS = 5–15 Ω was used. The chitin sample was obtained in the laboratory by standard demineralization and deproteinization processes of Chilean red prawn (Pleuroncodes monodon) exoskeletons [43]. The synthesis of P-Chi is described as is shown in Appendix A (please see Appendix A.1).

2.2. Gas Diffusion (GD) Method

GD crystallization of CaCO3 particles was carried out in the presence of Chi-P as polymeric solid template and compared in the absence of Chi-P as negative control at room temperature for 24 h. GD method was performed as we described in our previous works [37,44,45,46,47,48].

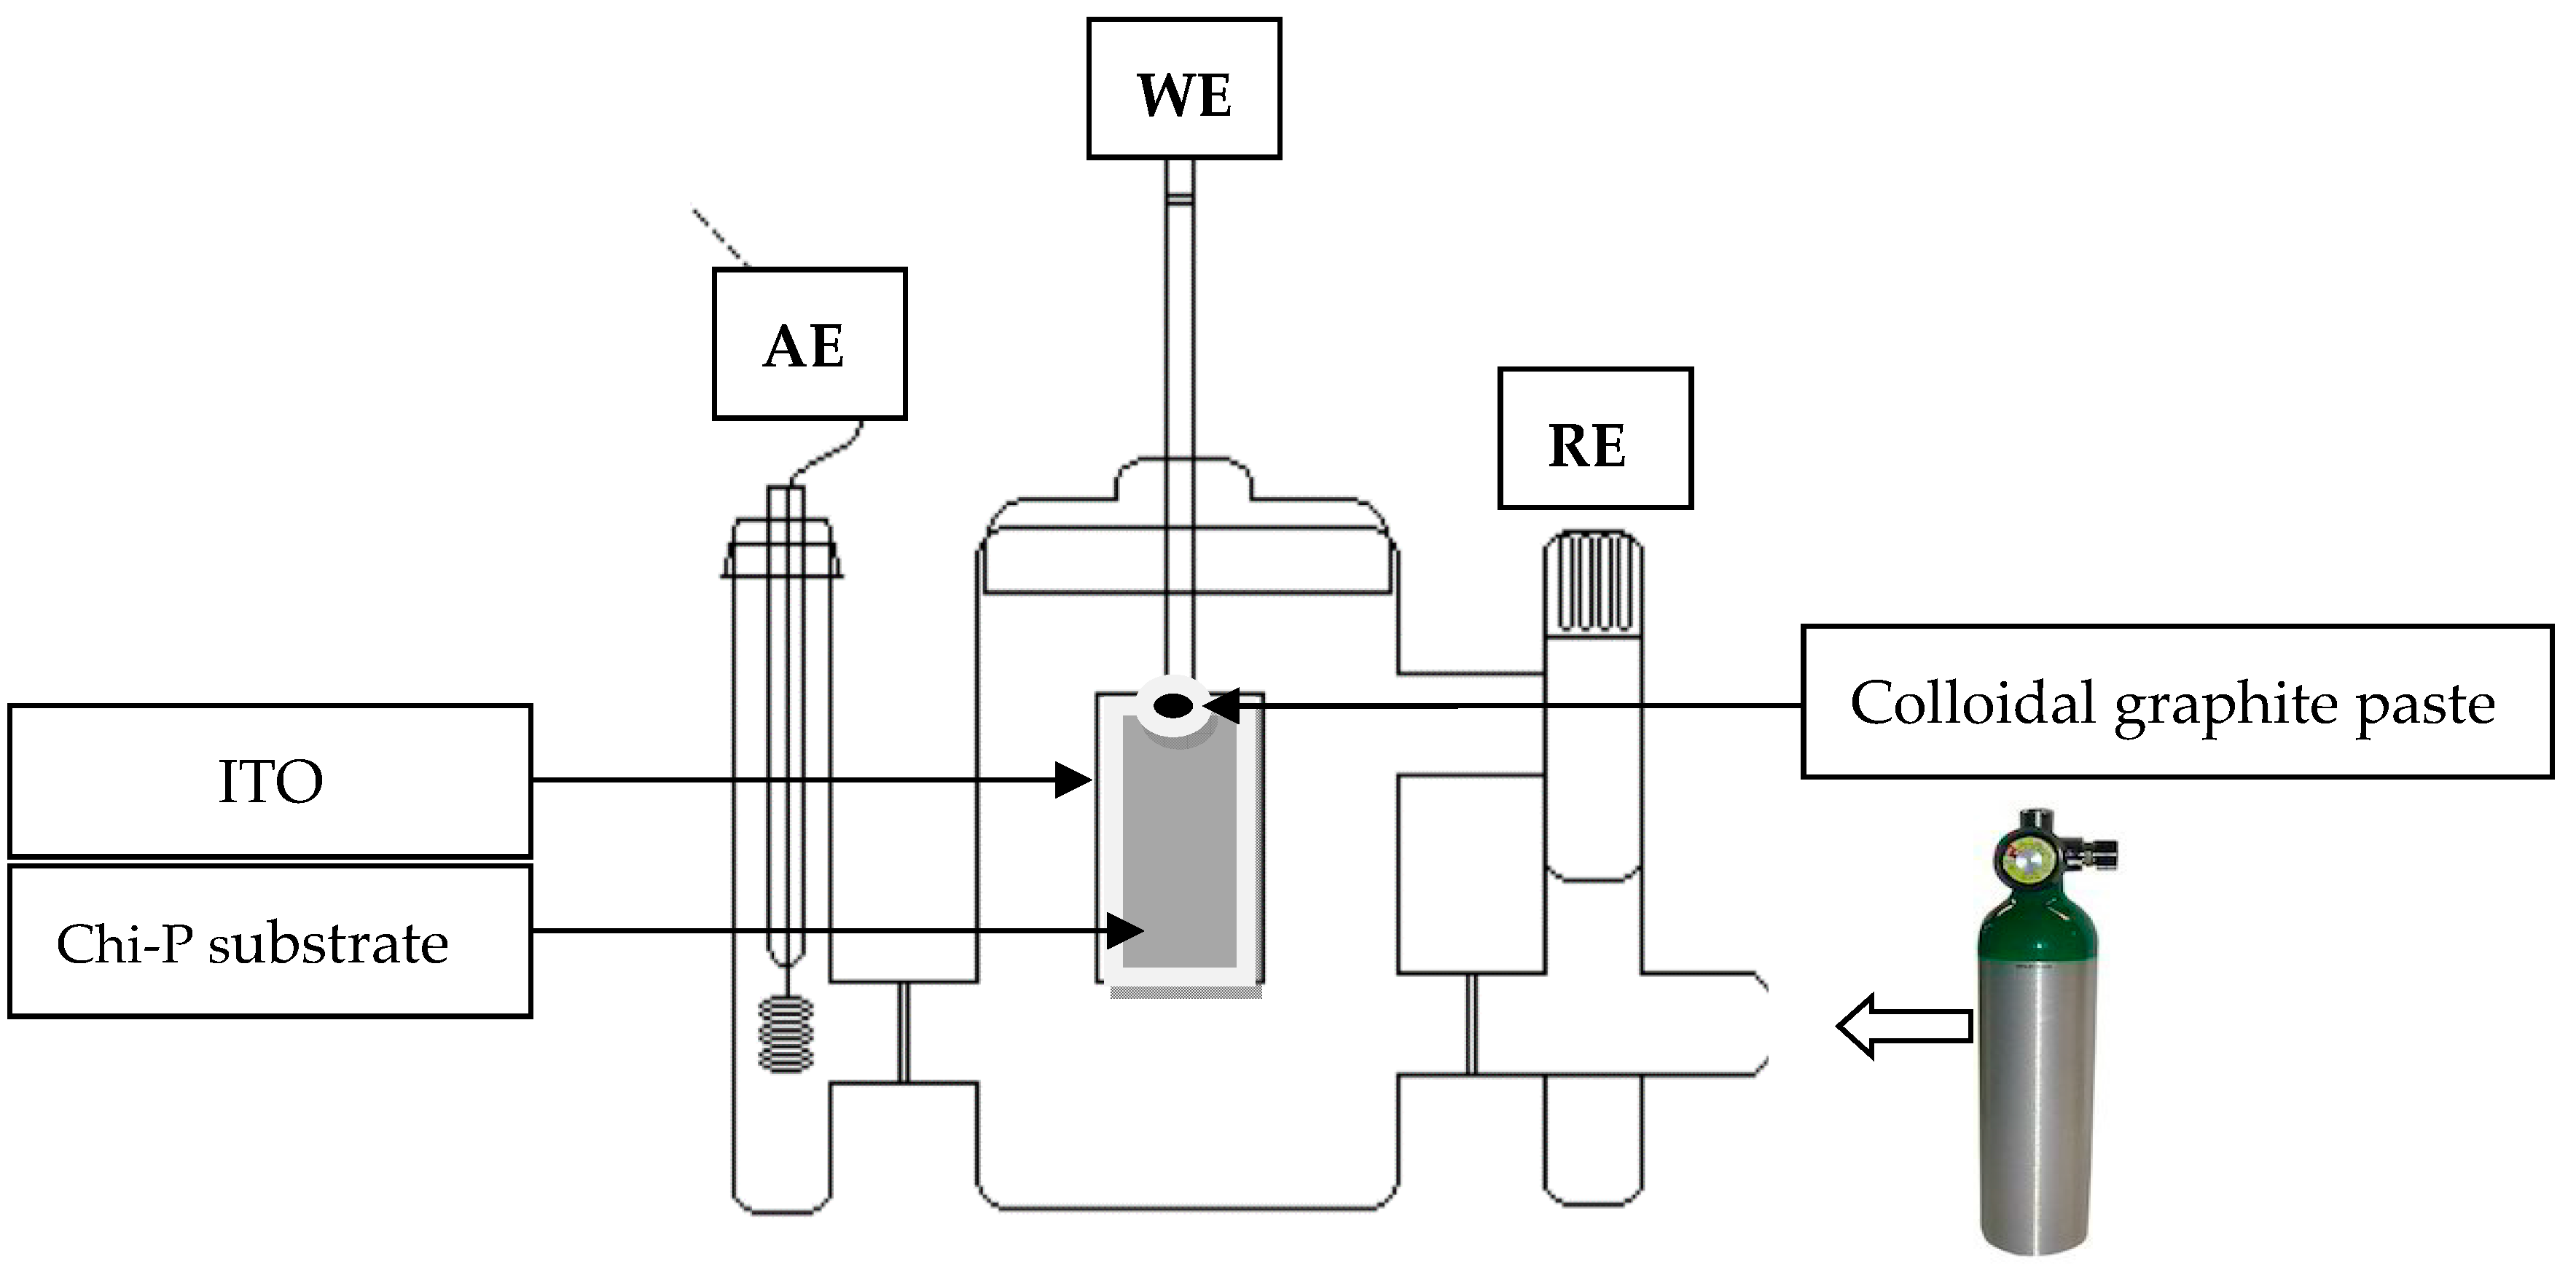
2.3. Electrocrystallization (EC) Method

In vitro EC of CaCO3 particles were produced in the presence of Chi-P onto the ITO glass surface at room temperature using a galvanostat/potentiostat BASi Epsilon (West Lafayette, IN, USA) instrument. The chronopotentiometry technique was used during the EC of CaCO3. ITO were washed with methanol and Milli Q water, obtained from a water purification system LaboStar 4-DI/UV and sonicated for 5 min. CaCO3 crystallization by using electrolyte solution with dissolved O2 in alkaline media was carried out through an electrochemical reaction. The electrolytic solution consisted of 0.2 mM CaCl2, 6 mM NaHCO3, and 10 mM NaCl. The EC equations of EC of CaCO3 has been as previously described [39]. The utilized reactants concentrations of the EC of CaCO3 demonstrated clearly the production of CaCO3 particles on ITO substrate. Before the EC of CaCO3 essays, a linear sweep voltammetry was performed in order to determine first the maximal potential value where the reduction of molecular O2 is reached. The maximum voltage activity established was at −890 mV [49]. Therefore, the use of this potential value generate a basic pH media allowing efficient conversion of bicarbonate to carbonate ions favoring the CaCO3 particle formation. Before the EC of CaCO3 essays was performed, the electrochemical cell was saturated with molecular O2 for 40 min. After the above potential was fixed, a set of chronoamperometry tests on CaCO3 coating for 120 min was carried out.

2.4. Characterization

The surface morphology of the resultant CaCO3 crystals was characterized by scanning electron microscopy (SEM) using JEOL JSM-6390LV and HITACHI TM3000 instruments. Fourier transform infrared spectroscopy (FTIR), and attenuated total reflectance in conjunction with FTIR (FTIR-ATR) analysis were performed by using FTIR Nicolet Magna 5PC spectrophotometer coupled to a PC with OMNIC software to data analysis and a Interspectrum Interspec p/n 200-X spectrometer (Toravere, Estonia) was used. TGA of Chi and Chi-P was carried out using a Netzsch (Selb, Germany), model STA 409 PC, system. The sample in a platinum crucible was heated from 25 °C to 800 °C at 10 °C/min in air atmosphere (70 mL/min). The XRD diffraction spectra were taken from a powdered resultant CaCO3 sample using a Siemens D-5000 X-ray diffractometer.

3. Results

In order to evaluate the Chi-P effect as a solid template on in vitro CaCO3 mineralization, a set of CaCO3 crystallization essays using the EC method were performed and the morphology of the resultant CaCO3 particles deposited onto the Chi-P surface were compared with the crystals obtained through GD method. The illustration of the EC of CaCO3 on the Chi-P and experimental conditions can be observed in Figure 1.
The EC of CaCO3 method is an electrochemical electrodeposition technique of inorganic material based on the use of a specific voltage in an electrochemical solution media that induces the formation of crystals in a controlled manner. The EC method consists of two stages: first, the particles suspended in a solution are forced to move towards an electrode by the application of a certain electric field, and then inorganic particles accumulate and deposit on the conductive ITO glass surface as a working electrode (WE). Once the EC tests were carried out, it was determined that CaCO3 crystals can be generated on ITO substrates in the absence and presence of Chi-P. This is due to the highly conductive capacity of the ITO substrate, which conducts the current previously established in the program at −890 mV in the electrochemical solution, allowing the reduction of oxygen, which generates an increase in the pH value that favors the conversion of bicarbonate to carbonate [39]. It is well known that the ITO substrate represents a conductive material with optoelectronic applications due to its good optical transparency, high conductivity, and electrochemical stability [40]. CaCO3 crystals obtained with EC method in the presence and absence of Chi-P onto ITO substrate were compared and evaluated through the measurement of current (mA) at different times (min). For this purpose, an electrolytic solution was placed into an electrochemical cell and the EC essays were performed in a galvanostat/potentiostat BASi Epsilon instrument. Figure 2 shows the chroamperometric curves related to crystalline deposits of CaCO3 onto the ITO surface during the EC performed on the ITO by using −890 mV for 120 min.
Figure 2 shows a notorious decrease in the electrochemical current curve during the EC of CaCO3 when Chi-P was used as a template (Figure 2B), in a similar manner than the control experiment without Chi-P (Figure 2A). However, the initial induced current was higher in Chi-P (ca. 1.0 mA) than control (ca. 0.42 mA). Moreover, we found the generated current stabilization for Chi-P begin ca. of 2.10 min at 0.11 mA instead of ca. 0.12 min at 0.17 mA in the absence of the additive. In both cases, the applied current became asymptotic until the end of the EC experiment at 0.035 mA and 2.15 min, respectively.
In order to evaluate the morphogenetic effect of Chi-P template on CaCO3 crystals growth onto ITO surface a scanning electron microscopy (SEM) was performed. Figure 3 shows the SEM images of CaCO3 crystals obtained on Chi-P surface. In general, Figure 3A shows the typical rhombohedral calcite crystals growth on ITO in absence of additive (control) of size ca. 10 μm. Figure 3B–D shows abundant truncate and rounded calcite particles growth in the presence of Chi-P as solid template of size ca. 8–20 μm. In addition, swollen and extended Chi-P sample embedded into the electrolytic solution and the starting rigid Chi-P film sample before the EC essays was observed in the Figure 3E,F, respectively. Then, diffusion of Chi-P molecules at the local ITO surface may have tremendous influence on the local nucleation of CaCO3 crystals, or alter the process of crystal formation as we observed by energy dispersive X-ray spectrometry (EDS) analysis.
It is well known that scanning electron microscopy/energy dispersive X-ray spectrometry (SEM/EDS) is a widely applied elemental microanalysis technique capable of identifying and quantifying almost all elements in the periodic table. With this in mind, SEM-EDS measurements of the resultant modified CaCO3 particles’ growth onto the ITO surface in the presence of Chi-P, Chi-P and ITO surfaces were conducted and all results are shown in Figure 4.
The ATR/FTIR technique allows that samples, in liquid or solid matter state, be examined directly without further preparation. In order to determine the chemical composition of Chi-P film (starting sample) and the resultant CaCO3 crystals precipitated through EC on Chi-P surface we used attenuated total reflectance (ATR) and Fourier-transform infrared spectroscopy (FTIR) as a sampling technique to provide excellent quality data in conjunction. The FTIR analysis is described in Appendix A (please see Appendix A.2). Figure 5 shows the FTIR spectra of Chi-P film, commercial CaCO3 and deposited CaCO3 particles. The spectra of Chi derivative plus CaCO3 crystals is slightly different to the original Chi-P spectrum showing new absorption bands at 1390 cm−1 and 871 cm−1, respectively. They are coincident with the broad band that appears in commercial CaCO3 samples at 1394 cm−13 asymmetric CO32−) and with the sharp band at 871 cm−12 asymmetric CO32−). Those bands confirmed the presence of deposited CaCO3 crystals.
In addition, the ATR/FTIR analysis was based on the presence of new absorption bands associated to CaCO3 deposition on the Chi-P surface. The inorganic particles depositions was confirmed through the absorption bands representing the main vibrations of the carbonate ions (CO32−). For a more detailed analysis of samples, the ATR/FTIR spectra for Chi-P and Chi-P + CaCO3 in different spectral regions are obtained (Figure 6).
In Figure 6 the FT-IR spectra of Chi-P and Chi-P + CaCO3 were shown. The main absorptions of CO32− ions were analyzed and it is important to note that most of its characteristics vibration bands appear only in the Chi-P + CaCO3 spectra. This suggests that spectral changes for this sample are associated with salt deposition on the Chi-P surface. In Figure 6A the weak vibrational band observed at 1073.5 cm−1 in Chi-P + CaCO3 spectra only was assigned to CO32− (symmetric stretching, ν1) from vaterite crystalline polymorph. Figure 6B shows two carbonate bands seen at 876.2 cm−1 that are common to both calcite and vaterite (asymmetric deformation, ν2) and at 850.4 cm−12, vaterite), respectively. The absorption band at 711.1 cm−1 is characteristic for calcite, whereas in vaterite the same band (symmetric deformation, ν4) is shifted to 743.3 cm−1 (Figure 6C) [50]. Previous research found that latter vibrations are characteristic of crystalline CaCO3 phases only [51,52]. In Figure 6D the main CO32− bands at 1429.8 cm−1 and 1424.3 cm−1 (asymmetric stretching, ν3) for vaterite and calcite polymorphs are presented, respectively. From previous analysis it could be concluded that a mixture of two CaCO3 crystalline polymorphs, vaterite and calcite, were crystallized on the surface of the Chi-P membrane. Those results are consistent with XRD analysis.
In order to further study the relationship between CaCO3 and Chi-P, a detailed FTIR analysis of Chi-P and Chi-P + CaCO3 spectra in the PO43− absorption regions are presented in Figure 7.
From Figure 7 it could be observed that the presence of deposited CaCO3 salt changes the shape of some bands in FTIR spectra, producing phosphate bands that are more resolved than in the original Chi-P spectra. This fact could be due to different chemical environments for those PO43− groups from the Chi-P membrane surface involved in the interaction with Ca2+ ions at deposition sites to form calcium phosphate or its hydrogen phosphate salts. This is supported by the presence of O-P-O bending bands v4 PO43− (572.9 cm−1, 558.5 cm−1, 600.1 cm−1) and HPO42− (551.2 cm−1) (Figure 7A). Other corresponding characteristic bands (P-O stretching of P-OH) are v1 PO43− (953.2 cm−1), v3 PO43− (1035.28 cm−1, 1077.8 cm−1) (Figure 7B). All those bands are coincident with those previously reported for calcium phosphate salts, demonstrating its formation on the surface of the Chi-P membrane [53,54,55,56].
In order to determine the internal lattice of crystalline CaCO3 products obtained through EC method and to determine the polymorphism of resultant CaCO3 crystals growth on Chi-P onto ITO substrate, X-ray diffraction (XRD) technique was performed as we can observe in Figure 8. Figure 8 shows the XRD pattern of CaCO3 crystals obtained by the EC method (Figure 8A), compared to the spectrum of the starting Chi-P sample (Figure 8B).

4. Discussion

4.1. Chemical Characterization of Chitin (Chi) and Chitin Phosphate (Chi-P)

The ATR spectra of starting Chi and functionalized Chi-P samples can be observed in the Supplementary Materials Figure S1. The typical amide I band at about 1655 cm−1 and amide II band at about 1555 cm−1 that gives the acetyl content in Chi are present. A broad 3000–3200 cm−1 band due to N–H and O–H stretching with small shoulders at about 3106 cm−1 band is observed for this biopolymer. From the spectrum of Chi-P several differences are apparent when compared with the spectrum of former lobster Chi. The peak at 1380 cm−1 was attributed to P=O stretching and the peak at 1042.7 cm−1 was due to –P–OH groups from Chi-P. The presence of a small peak at 956.1 cm−1 may also be attributed to the P–O stretching of P–OH, overlap with CH3 rocking band after Chi phosphorylation [57]. Furthermore, the Chi peak from O–H deformation of –CH2–OH at 1378 cm−1 almost disappears. It seems that Chi primary hydroxyl groups are involved in the substitution reaction as expected.
The thermal properties of lobster Chi and Chi-P were also investigated by TGA and results are given in Figures S2 and S3. It is important to clarify that the TGA was used only to demonstrate the phosphorylation reaction of chitin as supporting material. The resultant inorganic mineral on Chi-P was not considered in the current work by TGA due to the hybrid CaCO3-Chi-P material was demonstrated by using spectroscopic techniques (FTIR, Raman), X-ray diffraction (XRD), chronoamperometric curves and SEM analyses. The thermogravimetric (TG) curves from both compounds shown a first mass loss in the range of 55–110 °C due to water evaporation. The TG curve of Chi shows two maximum decomposition rates peaking at 316.4 °C and 384.1 °C, which are associated to weight losses of 12.1 and 60.2%, respectively. The first effect was attributed to a complex process corresponding to the initial biopolymer pyrolysis stage. During this process, simultaneous ring dehydration, depolymerization, and decomposition of deacetylated units of the polysaccharide occurs. In the second and larger process decomposition of acetylated units occurs, including polymer deacetylation. The Chi decomposition temperature range observed was in agreement with previously reported for other Chi sources between 300–460 °C [58]. On the contrary, it could be observed that Chi-P shown a complex decomposition process having three weight losses, which is a typical behavior of block copolymers. The maximum decomposition rates for each stage was peaking at 243.5 °C, 316.4 °C, and 480.1 °C and were associated to weight losses of 20.8, 18.3, and 3.1%, respectively. The first decomposition stage could be related to thermal decomposition of phosphorylated units where the hydrolysis of phosphate groups linked to Chi backbone occurs provoking a polymer backbone hydrolysis and dehydration. The second stage is assigned to Chi units decomposition processes, taking in count the coincidence in maximum decomposition rate temperature among both samples. It is of interest to note that the third stage occurs at 96 °C higher temperature than in Chi. It could be due to thermal degradation of residual compounds resulting from previous thermal stages (e.g., crosslinked chains) or formation of new type of phosphate species but this subject will deserve further investigation. In general, Chi-P was less thermal stable than Chi, which is in agreement with previous report for other Chi phosphate derivatives [57]. Finally, the elemental analysis allows us to determine the Chi-P degree of substitution that was 0.38 from the P/N mol ratio.

4.2. Study of CaCO3 Crystals Deposition by EC and GD Methods

The GD method of CaCO3 as in vitro crystallization has been widely employed using different biomacromolecules, instead of the EC method, which uses an electrochemical approach, can be realized in a short time and the resistant inorganic material selectively growth on the ITO substrate can be also directly monitored by using chronoamperometry or chronopotentiometry analysis. One of the aim of this work was to use both crystallization methods for knowing the effect of the same biomolecule using as additive or electrodeposited on the ITO conductive support as a solid template. It is well known that anionic functionalization, e.g., carboxylic, sulfate, or phosphate groups attach to the main chain of macromolecules has been reported as active group on biomineralization. Therefore, the EC method was selected to study the effect of Chi-P on CaCO3 and the resultant crystals compared to the classical GD method. The Elemental analysis is described in Appendix A (please see Appendix A.3).

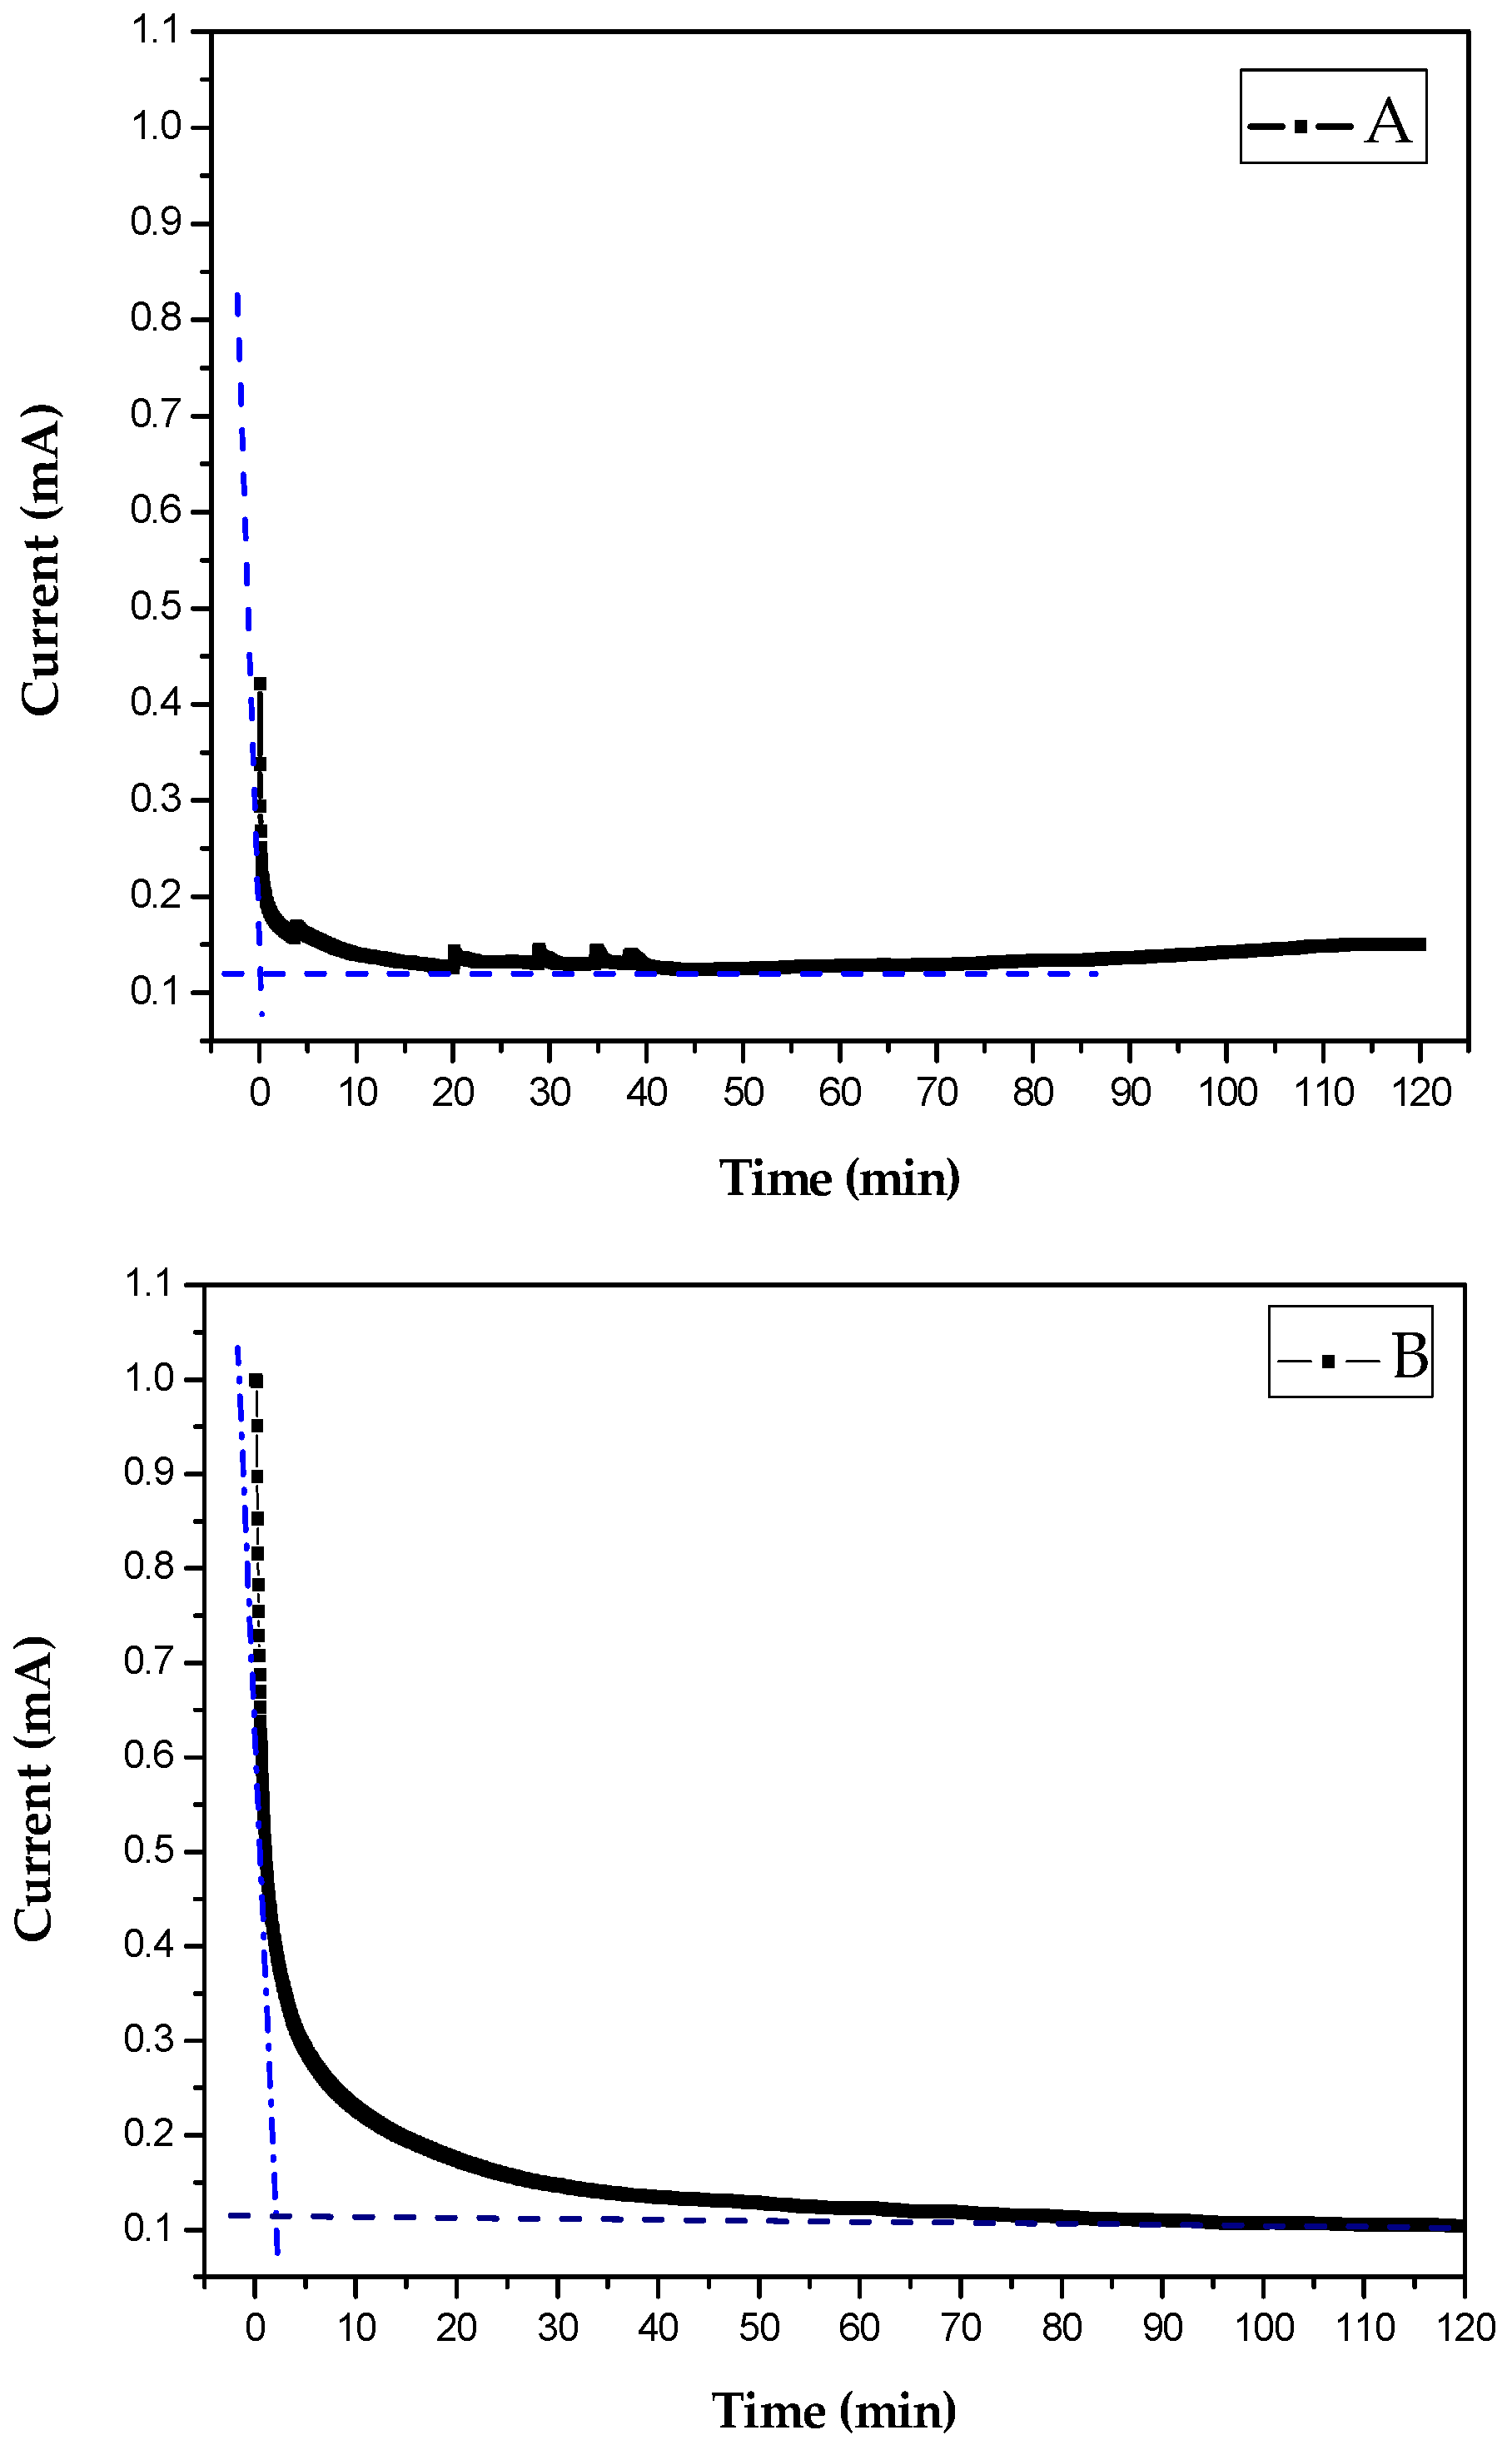
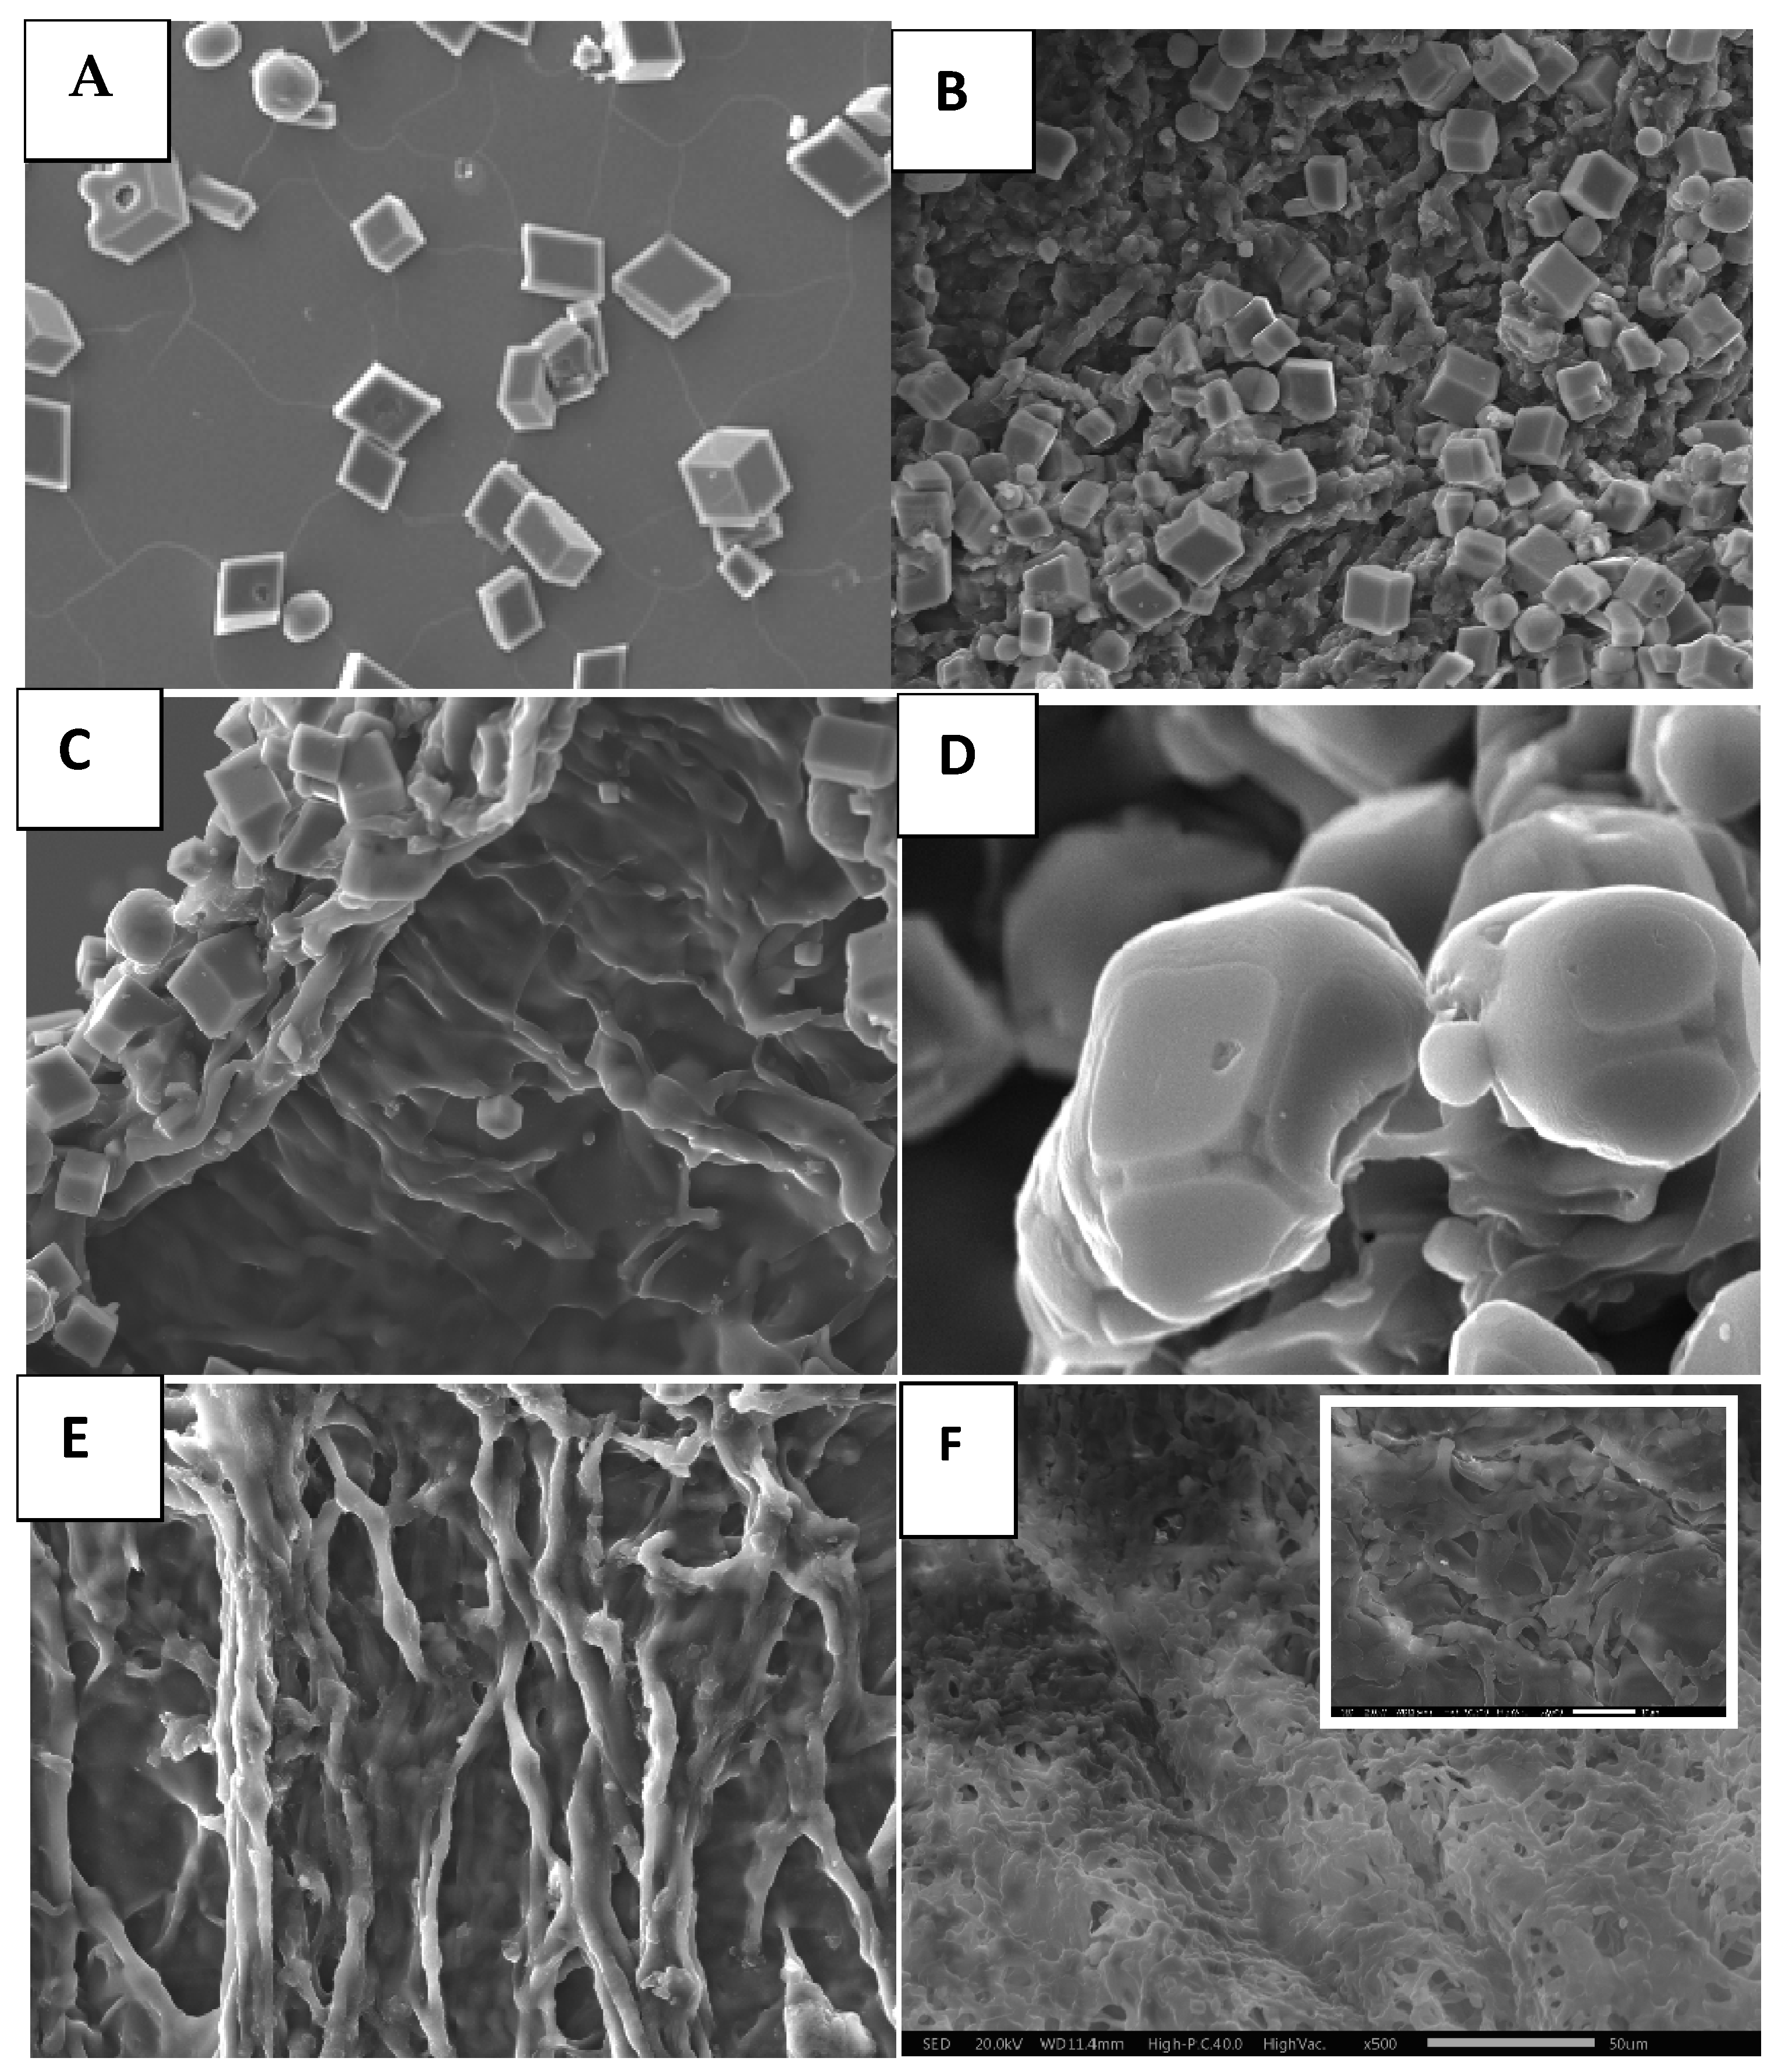
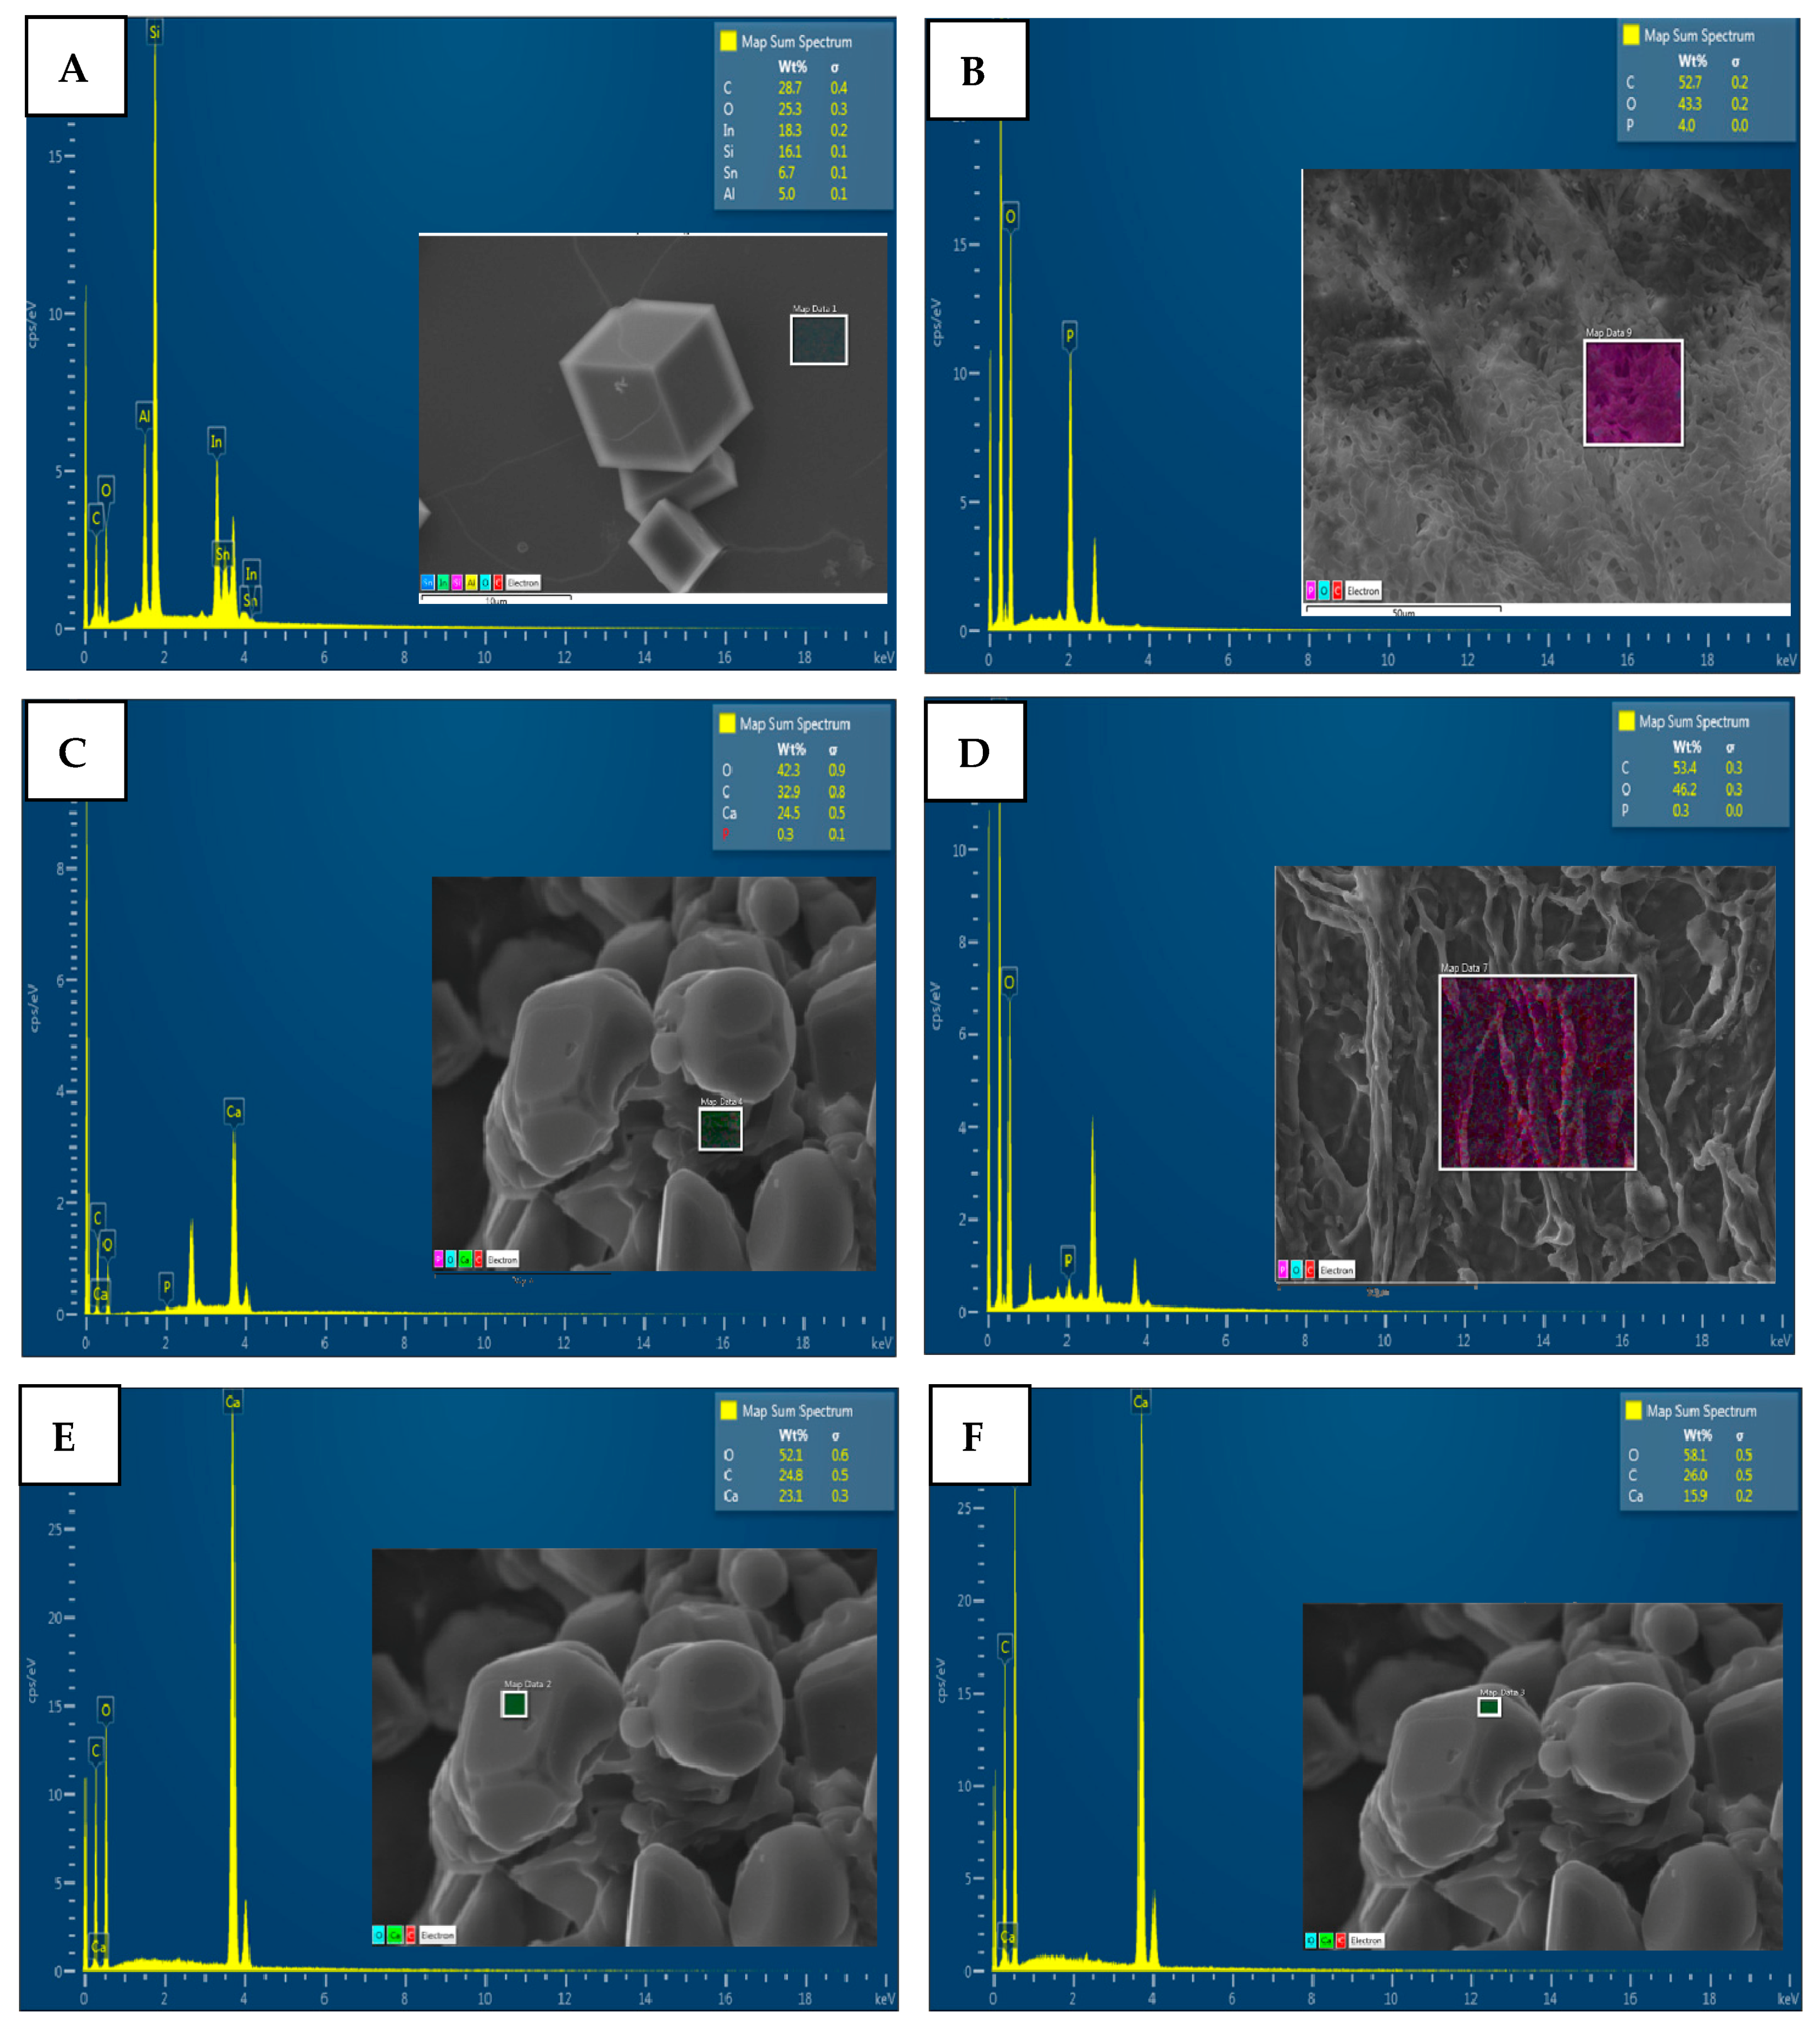
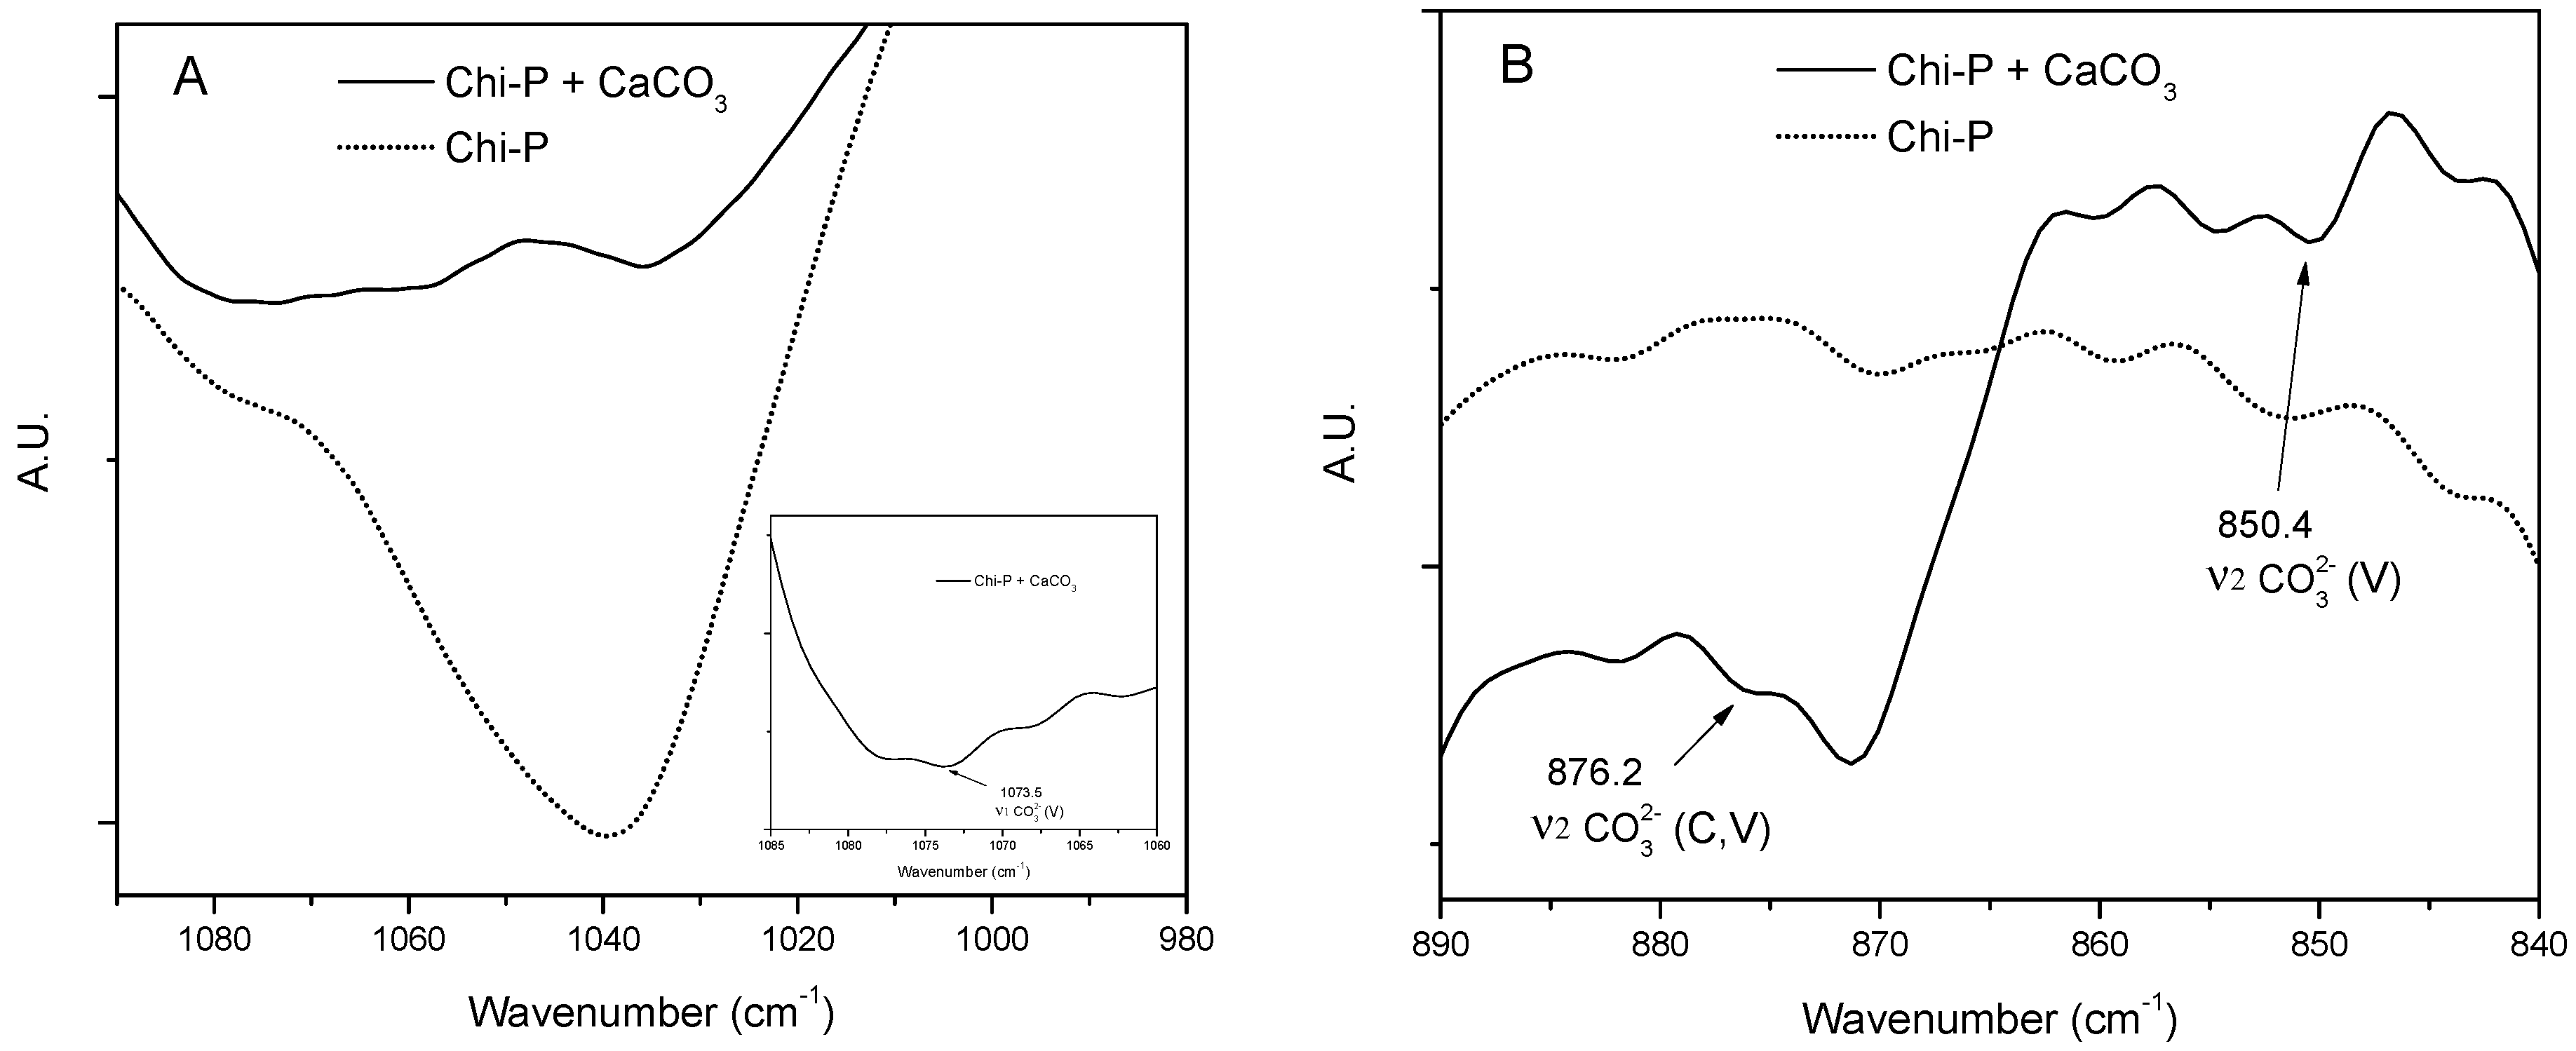
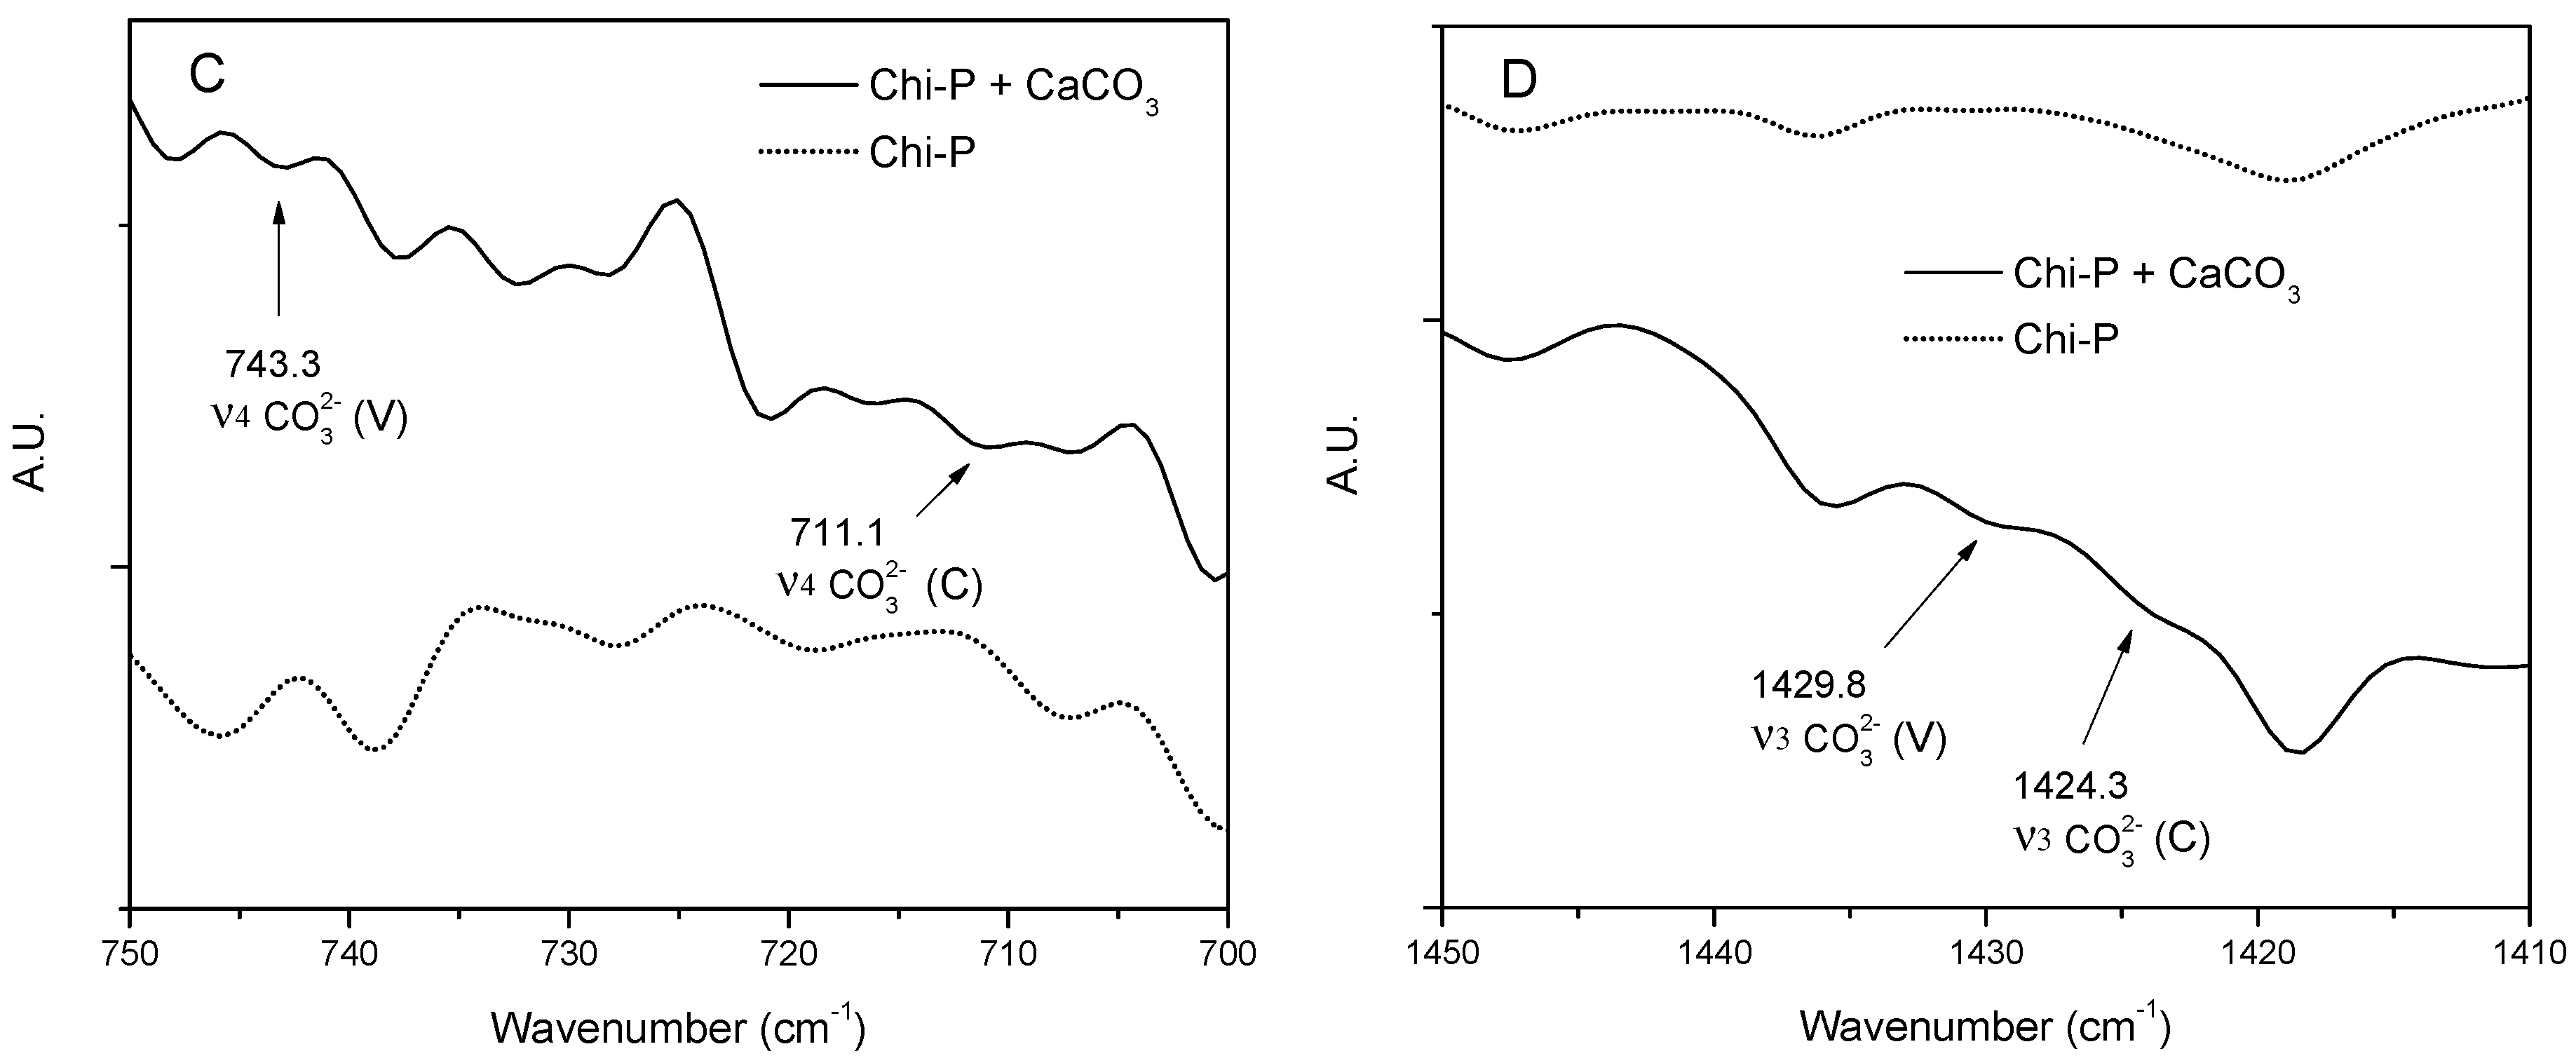
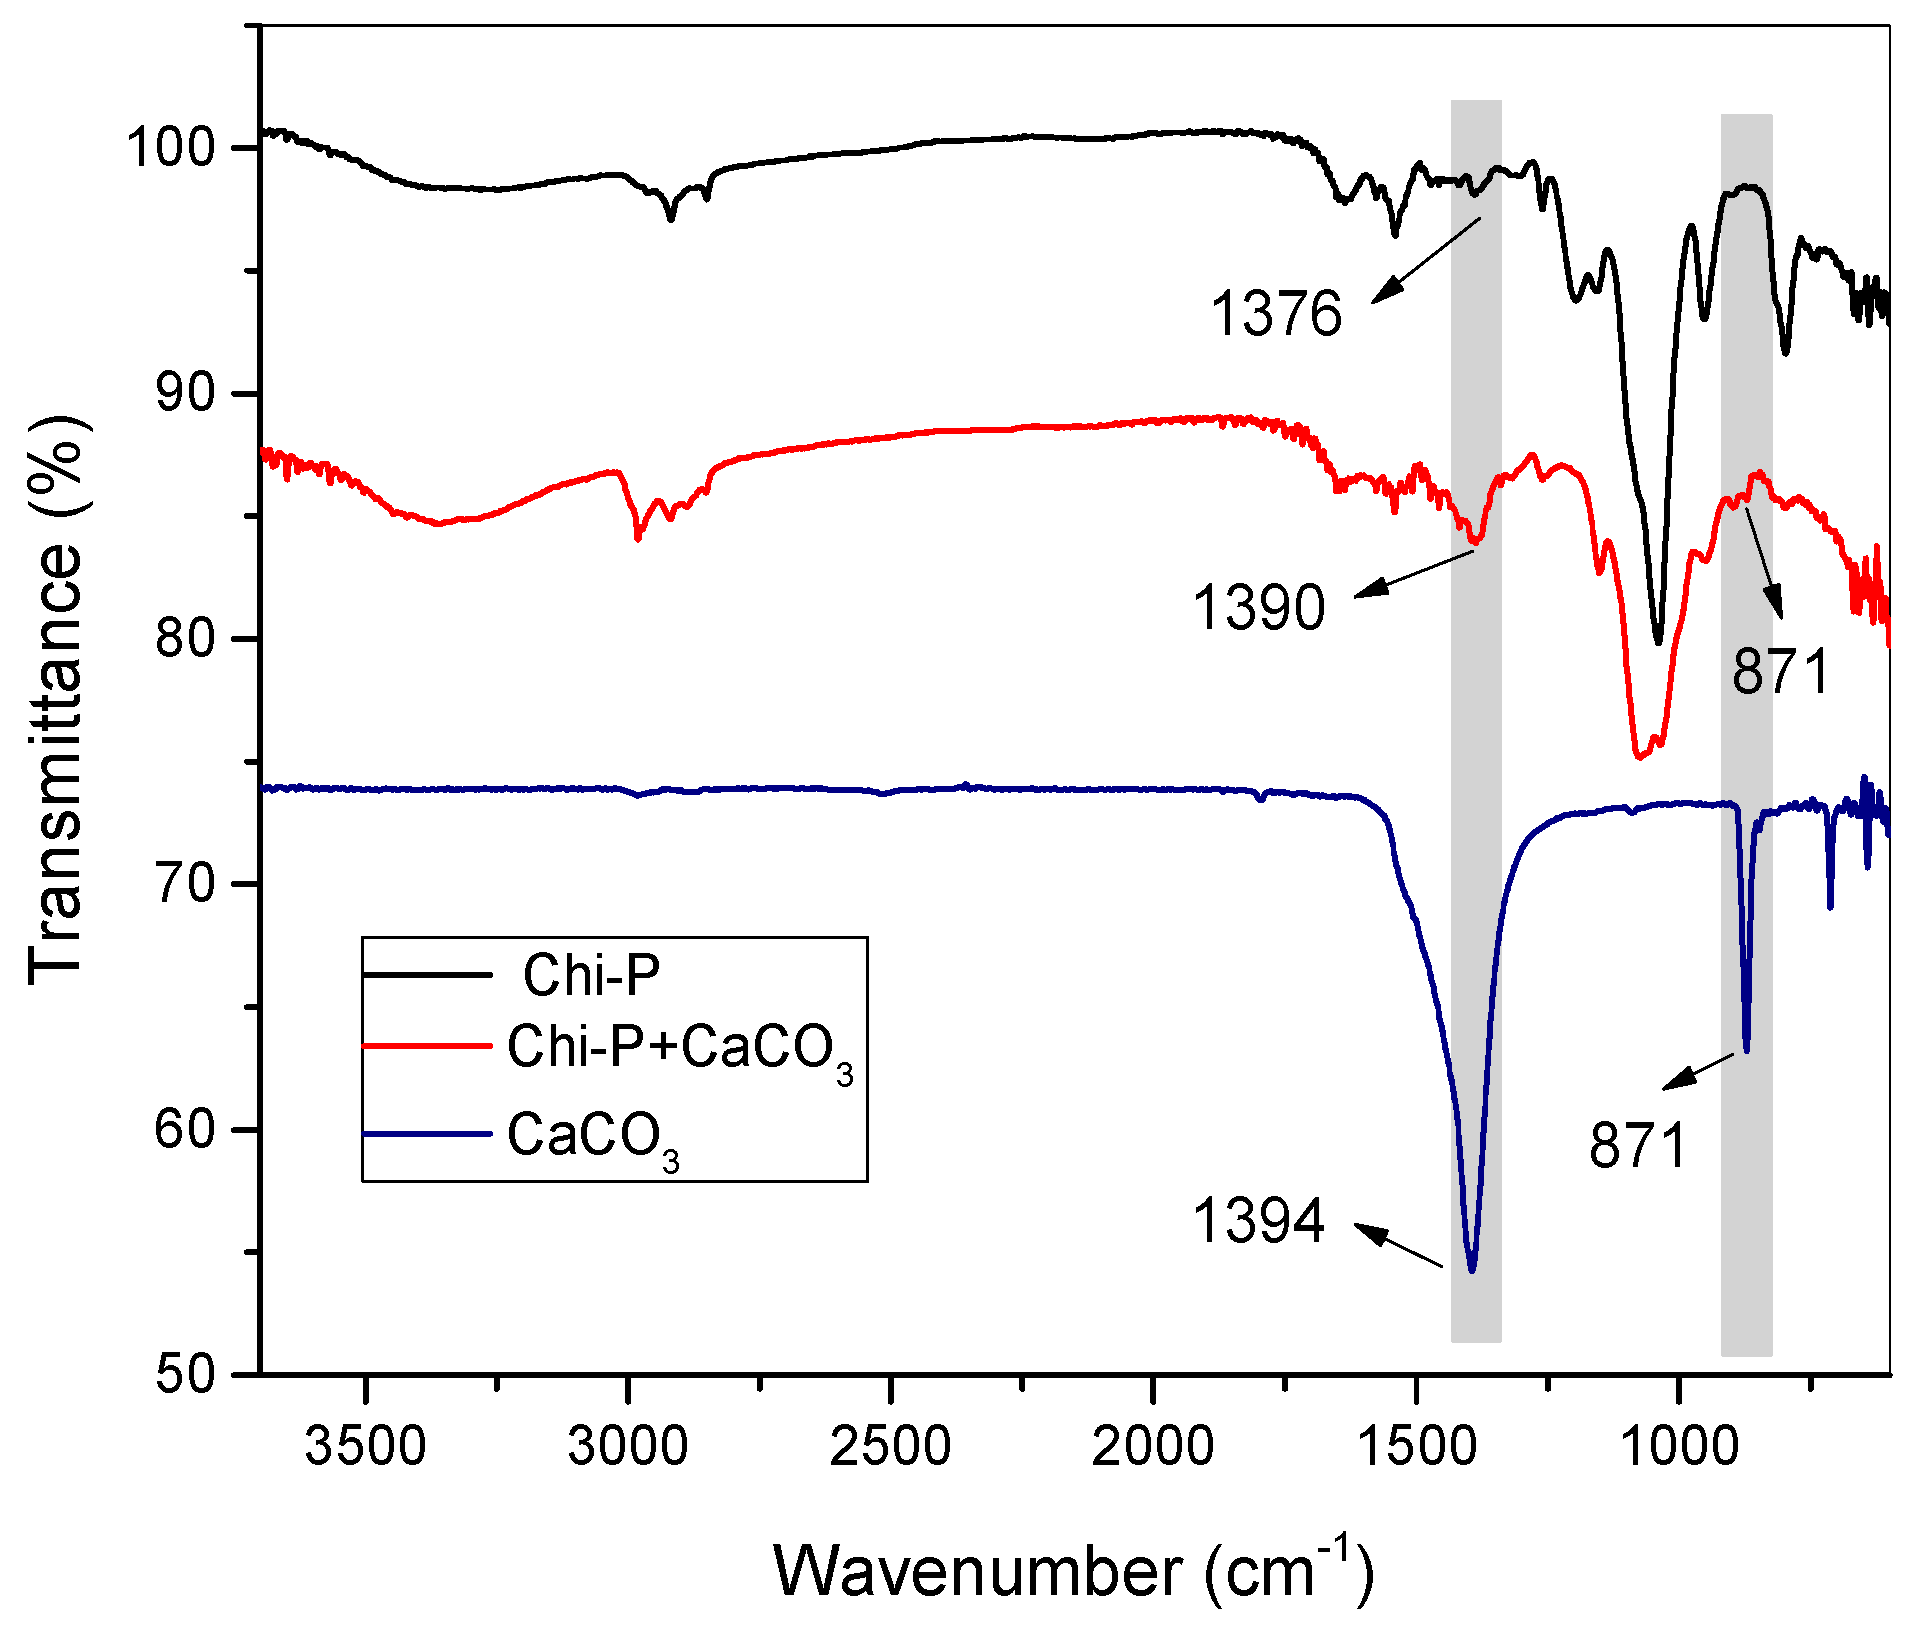
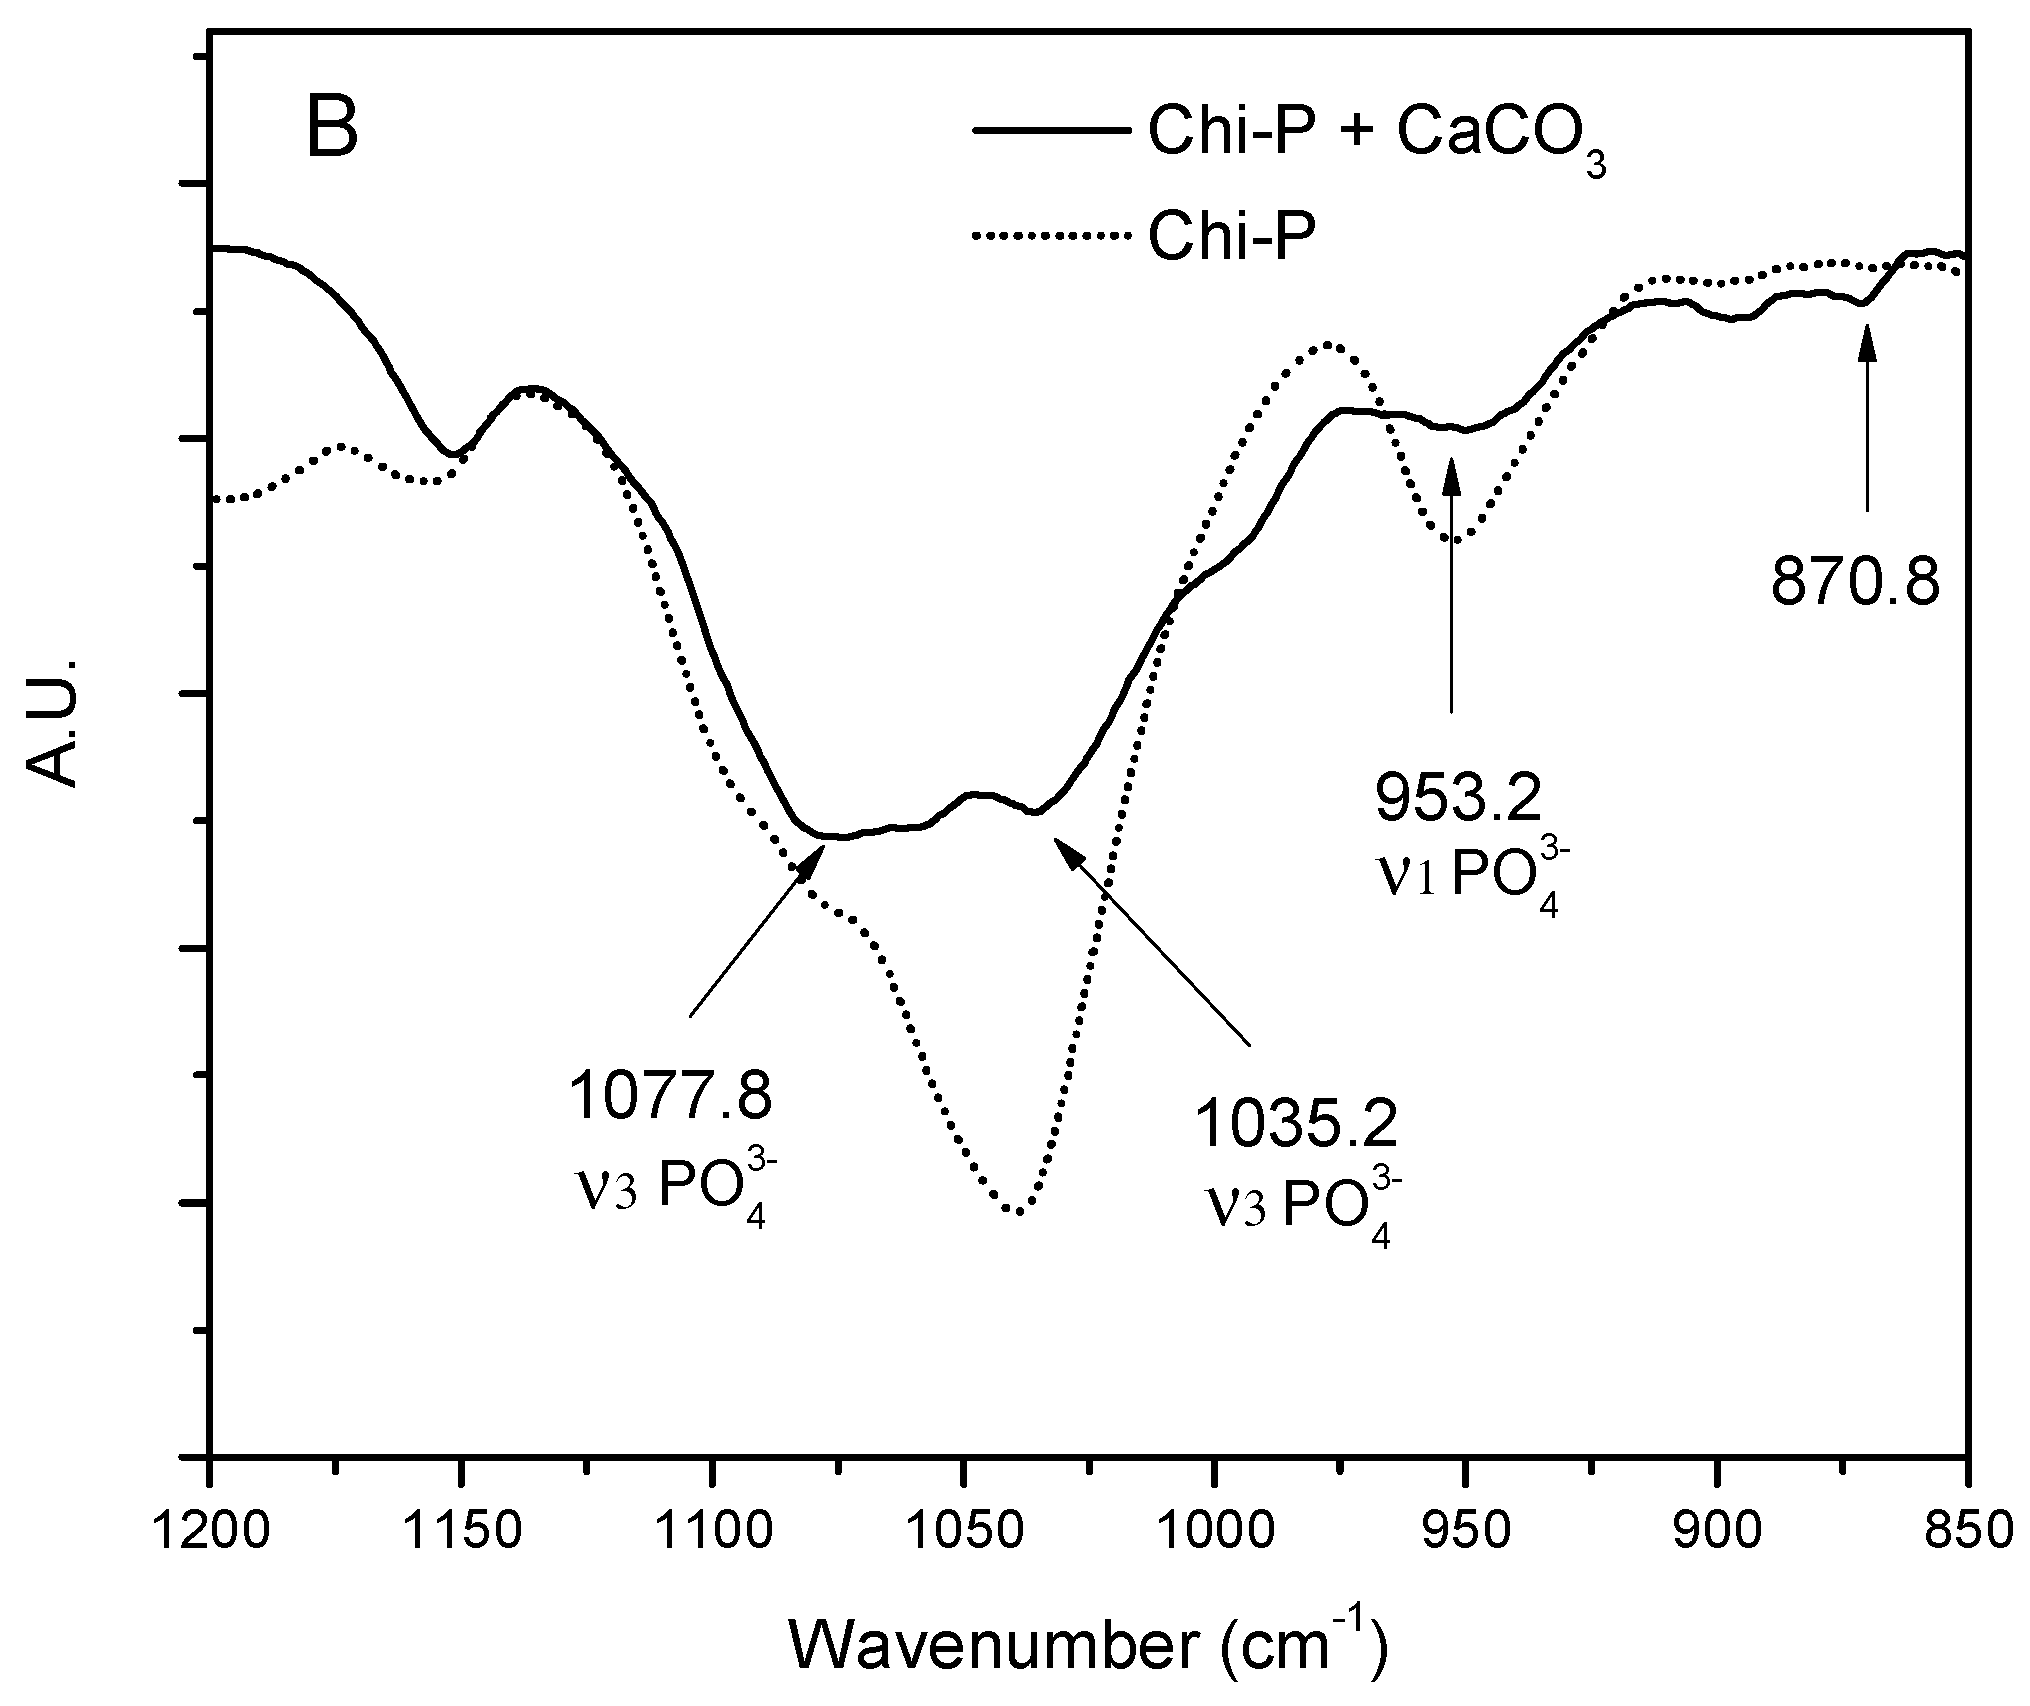
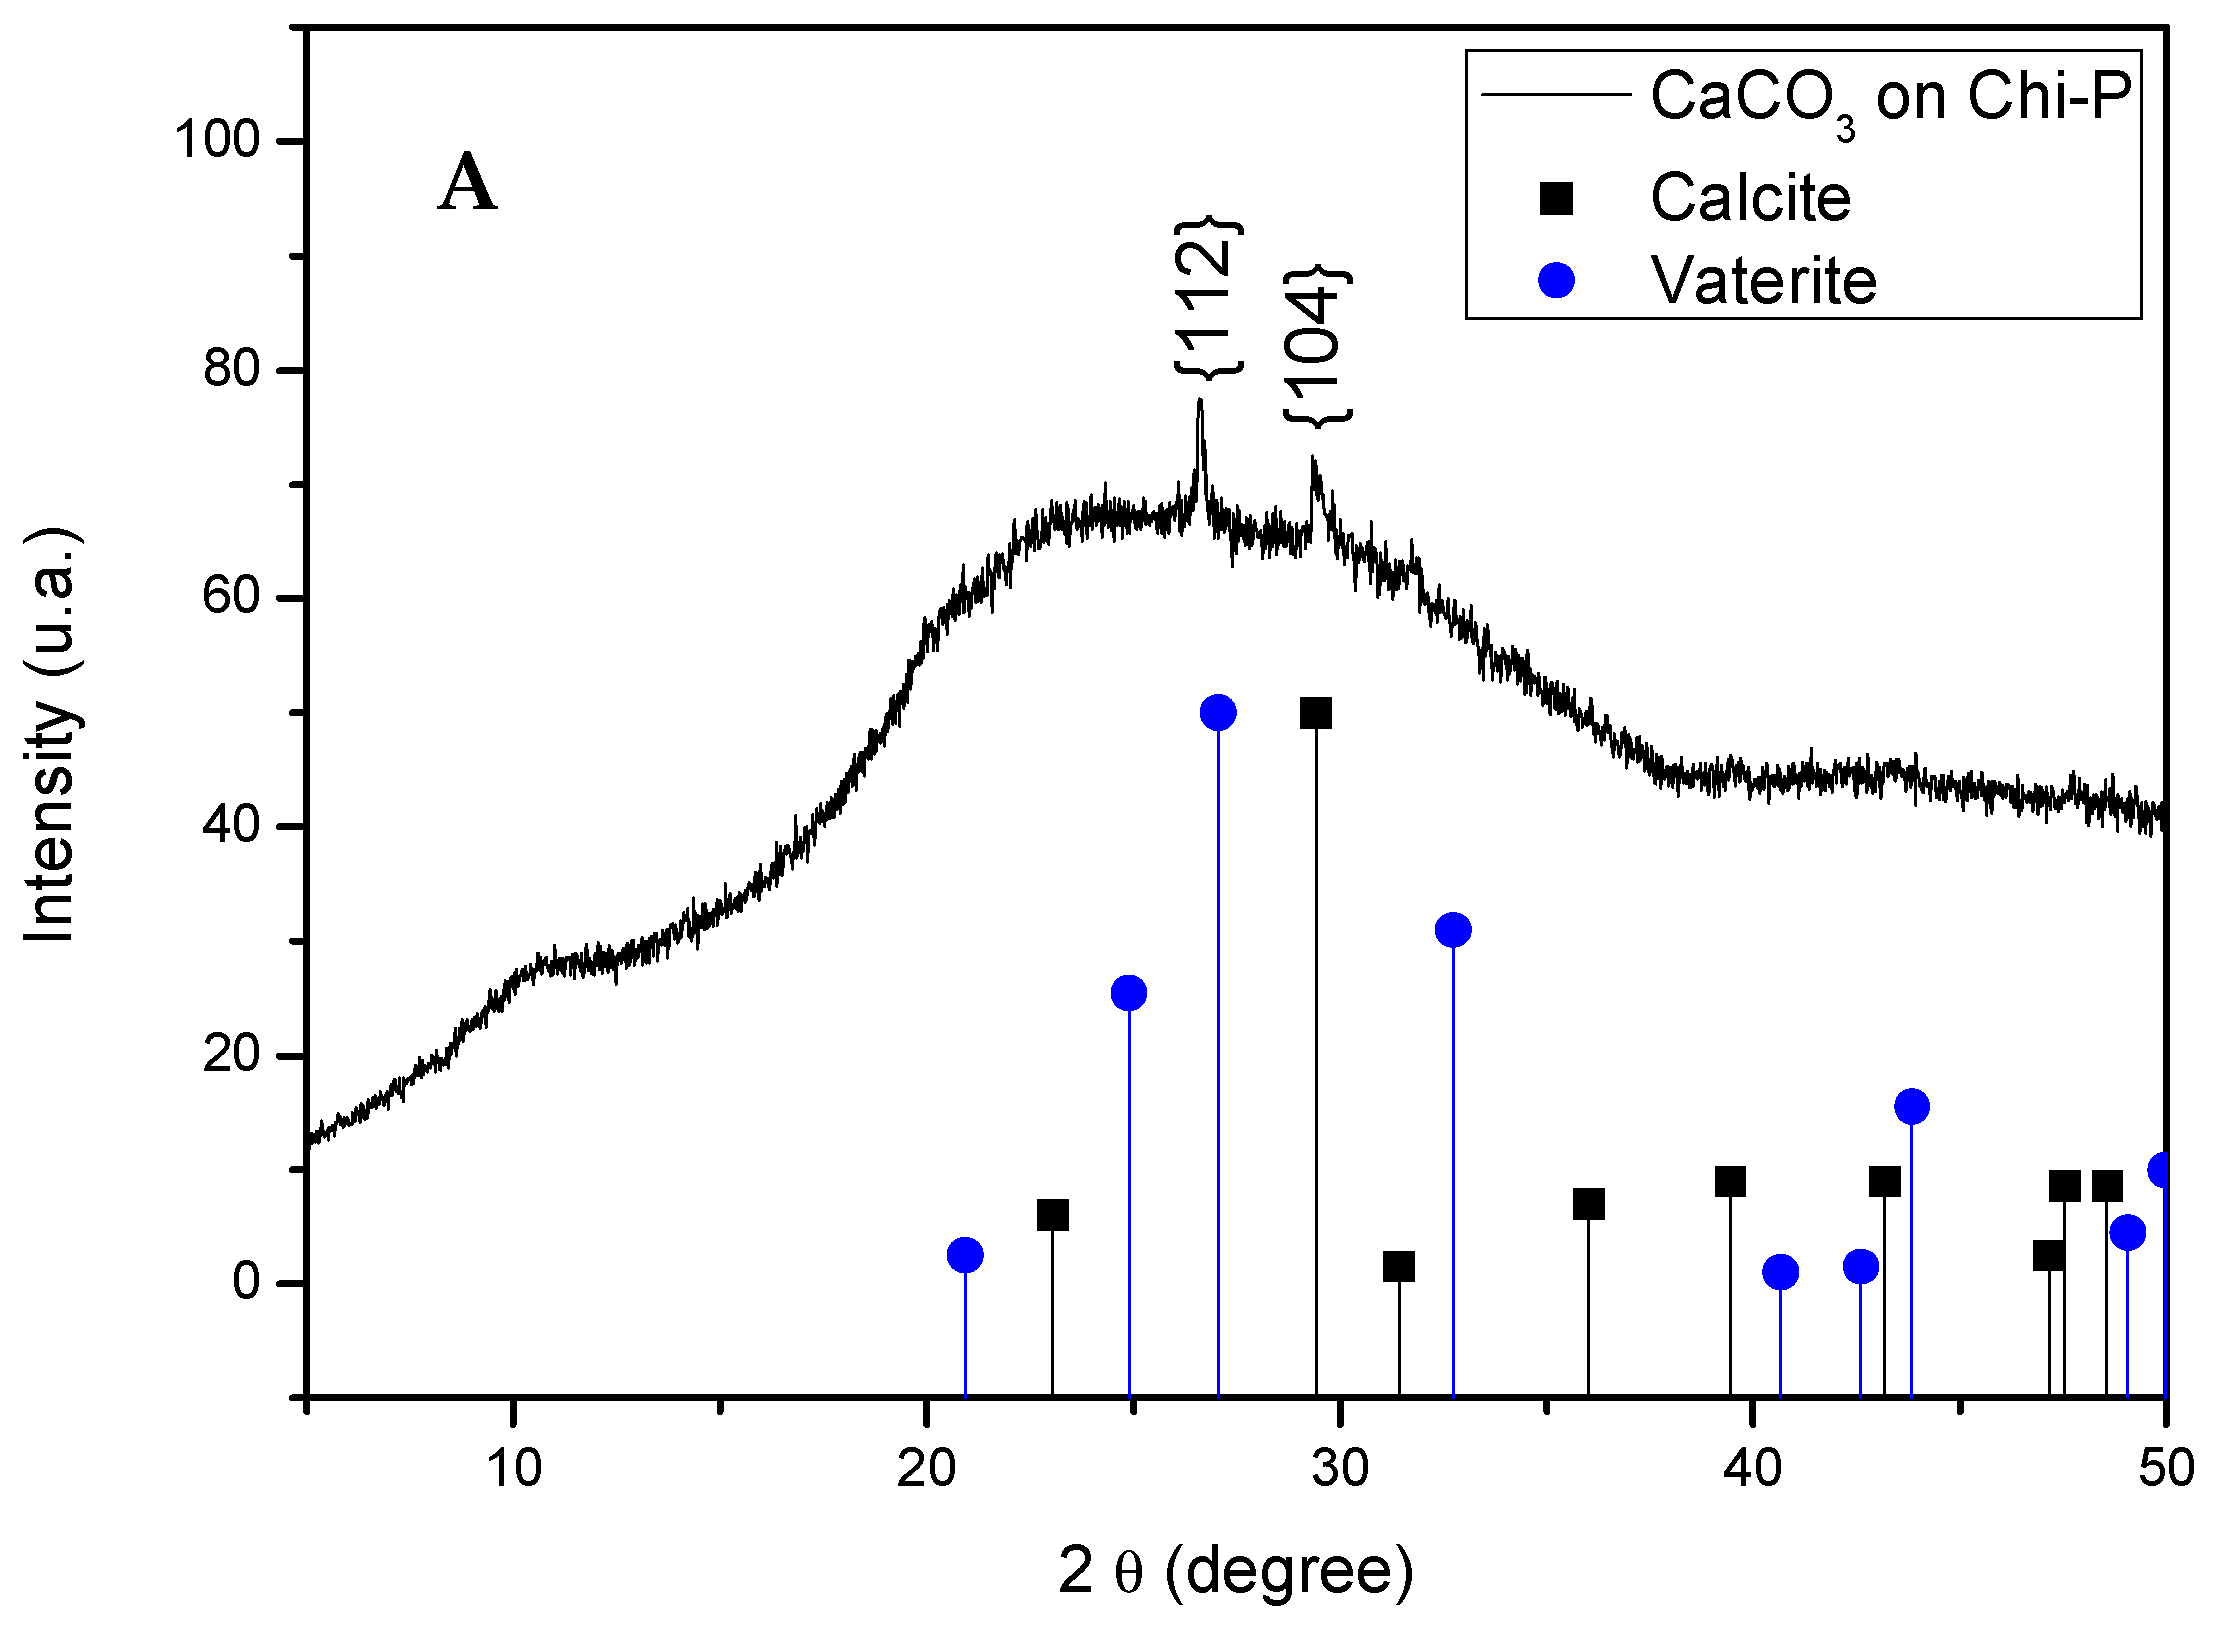
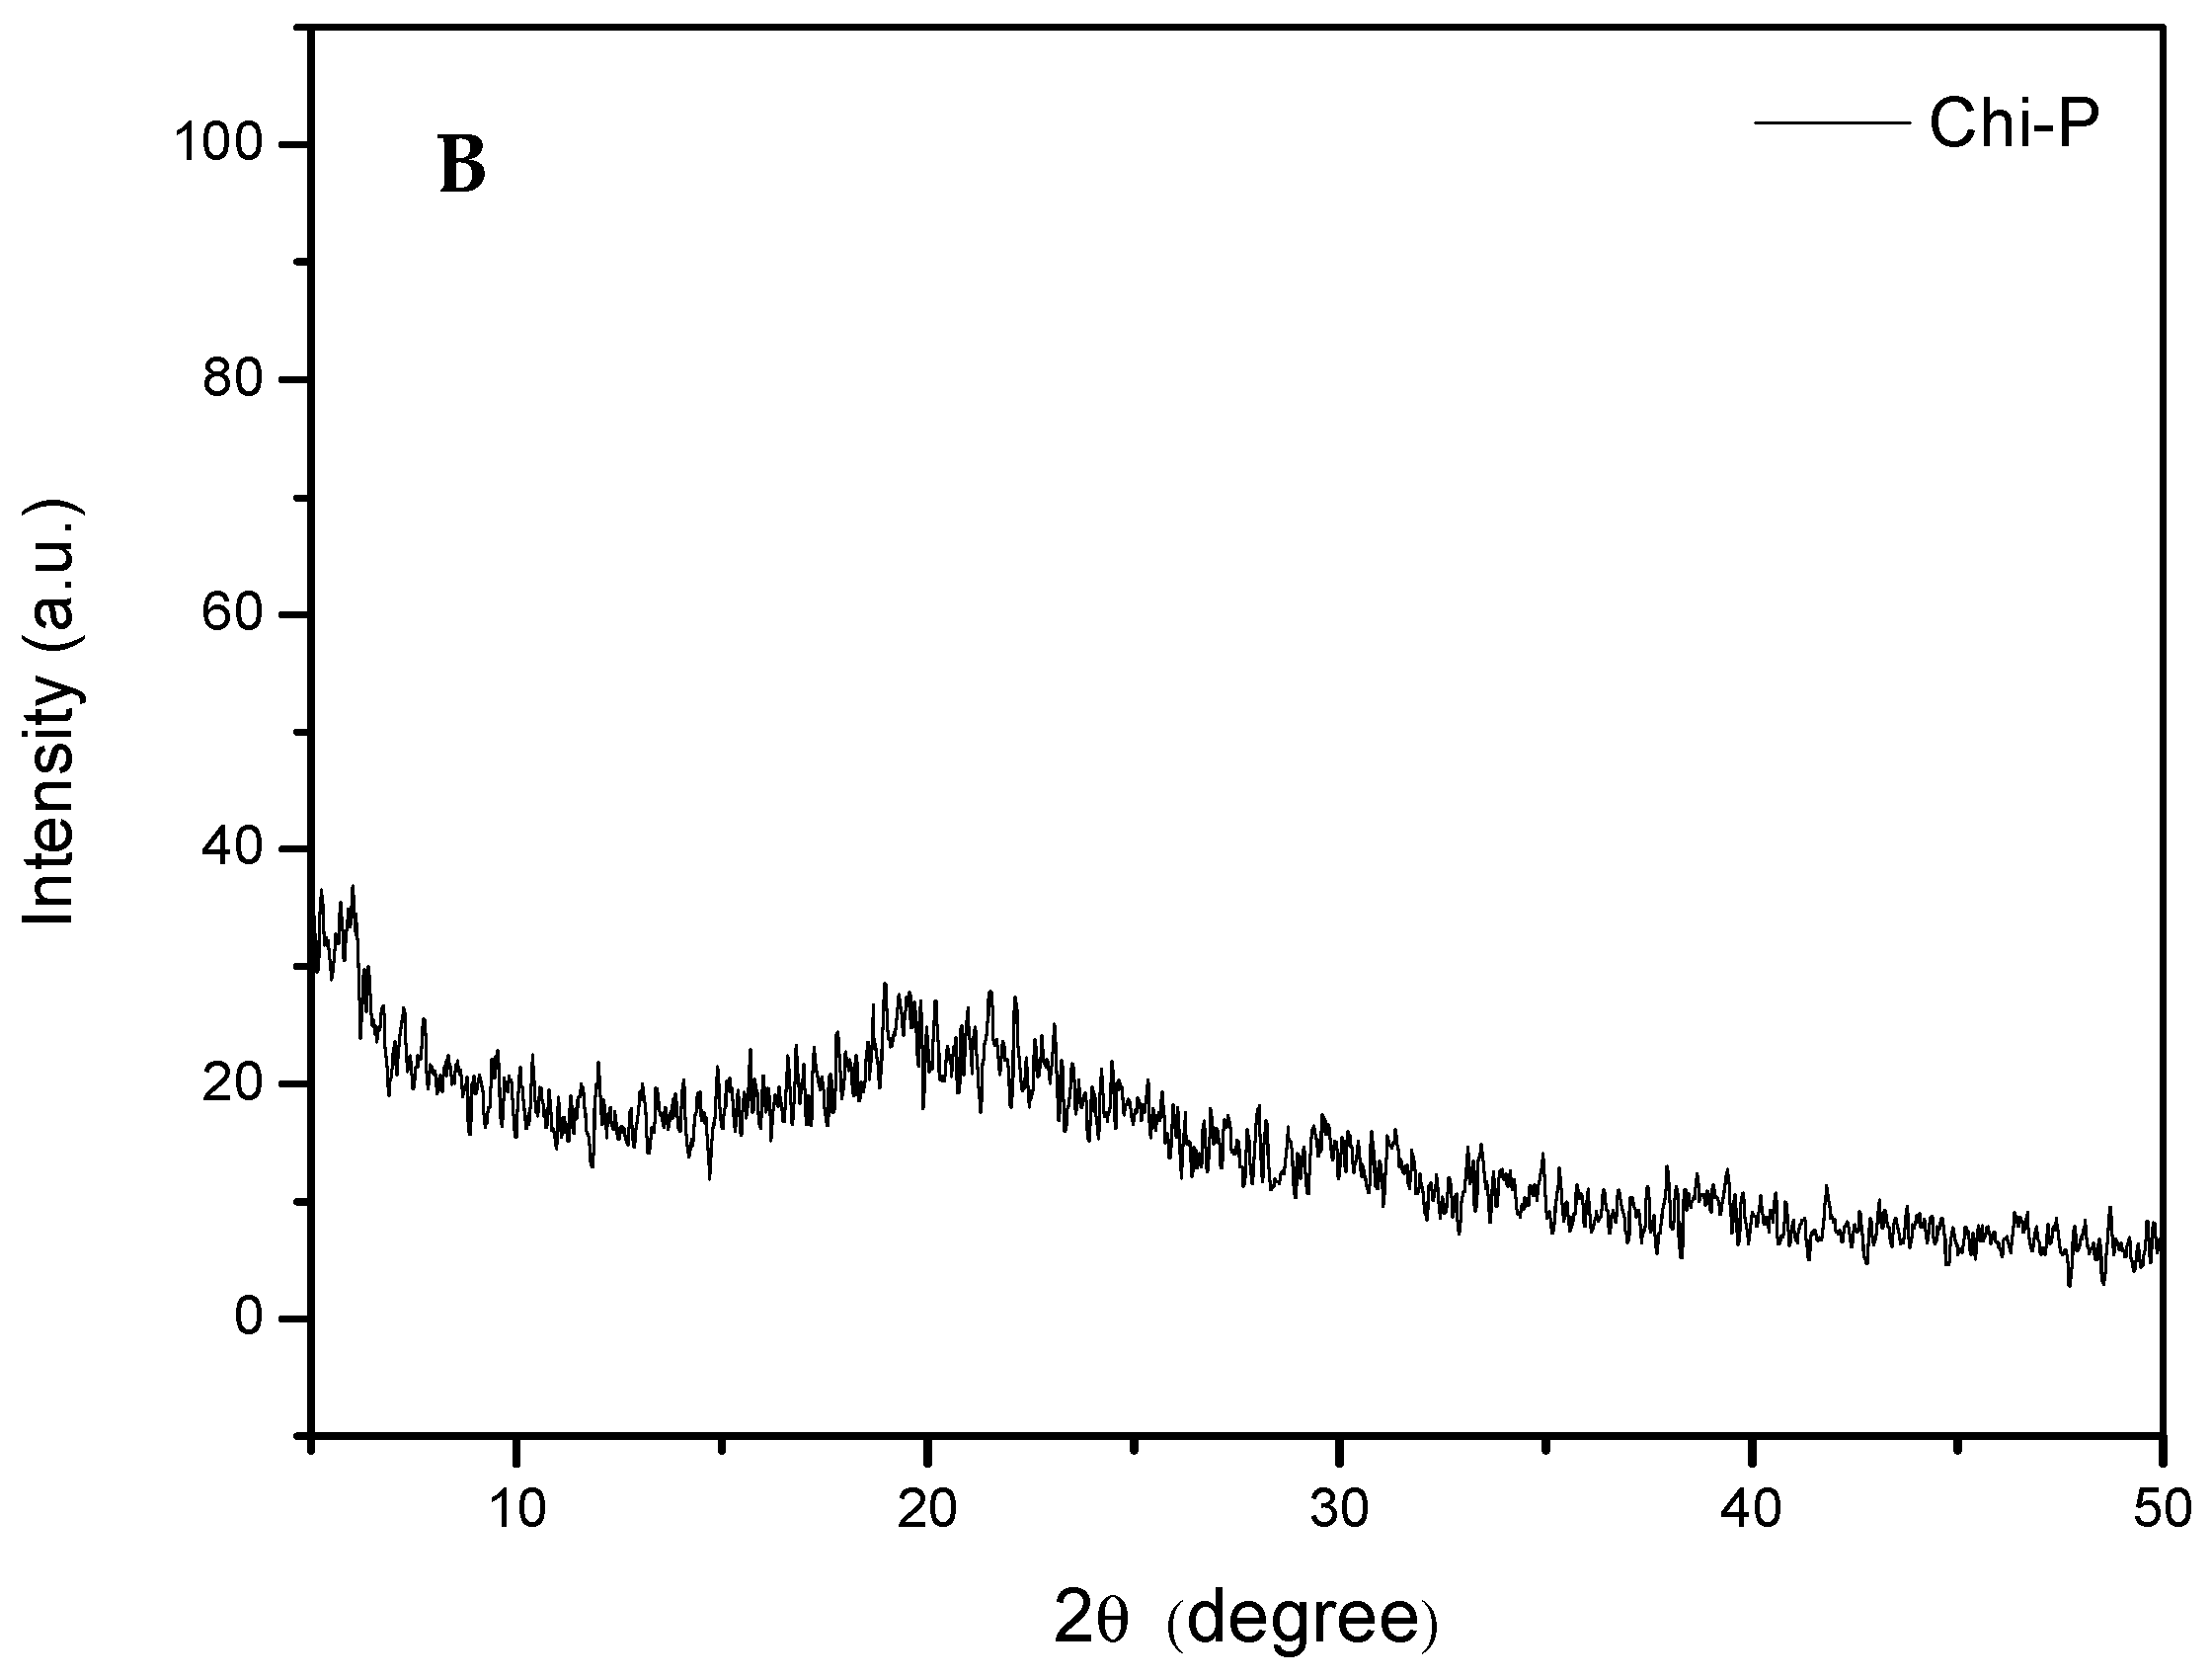
4.3. Characterization of CaCO3 Crystals through Amperometry, FTIR, SEM-EDS, and XRD Analyses

Amperometrical curves, as with all pulsed techniques, chronoamperometry generates high charging currents at the beginning of the EC essays, which decay exponentially with time. Since the current is integrated over relatively longer time intervals, chronoamperometry gives a better signal to noise ratio in comparison to other amperometric techniques. Here, we observe a strong influence of the electrochemical current curve during the EC when Chi-P, as a solid template on the ITO substrate, was used (see Figure 2B). This behavior can be rationalized by increasing the amount of inorganic resistant material when the EC was performed at a constant voltage, then the applied current through the WE decayed until the stabilization of the crystallized CaCO3 particles, which occurred in a very short time of 0.12 min at 0.17 mA. In this context, Chi-P induced the EC of CaCO3 as a promoter effect, although, in both cases, the current became asymptotic until the end of the EC test was reached at 0.035 mA.
The FTIR results clearly demonstrated that although small amounts of inorganic materials were deposited onto the Chi-P film through the EC method, as supported by SEM analysis, all absorption bands of calcite polymorphism of CaCO3 crystals can be identified by comparison with typical absorption bands of commercial CaCO3 samples. As the Chi-P film could present a low surface chemical salt deposition, it is very likely that the resulting spectrum will mainly show bands corresponding to this derivative. However, the resulting CaCO3 crystals’ bands (vaterite and calcite bands), as well as PO43− salts, were clearly identified in the spectra from those of Chi-P, proving ATR/FTIR usefulness for material surface characterization (Figure 6 and Figure 7). In a complementary analysis, Raman spectroscopy was performed on the low amounts of CaCO3 crystals grown on Chi-P surface, as was provided in supplementary material (please see Figure S4). Figure S4 shows the Raman spectra of ITO surface, starting Chi-P powder sample and CaCO3 crystals as calcite polymorphism grown on Chi-P (Figure S4C) after EC experiments. The Raman spectra allowed us to also identify the deposited layer of CaCO3 salt as calcite polymorphism confirming previous spectroscopic analysis.
In order to determine the elemental chemical information of all organic and inorganic components, that is, ITO substrate and the presence of Chi-P adsorbed on the crystal surface, energy dispersive X-ray spectroscopy (EDS) was also used. For the ITO substrate and Chi-P surface, the EDS measurements confirmed the presence of typical elemental composition of In, Sn, Al, and O for ITO (Figure 4A) and the C, O, and P for Chi-P (Figure 4B), respectively. The percentage of phosphorous content of the starting Chi-P sample was slightly higher of 4.0 wt% (Figure 4B). In Figure 4C, truncated crystals were found, suggesting an efficient modifier capacity of Chi-P during the EC of CaCO3, although with a low concentration of phosphate groups on the film surface and low amounts of deposited crystals. EDS analysis determined a phosphorous content of 0.3 wt% of Chi-P immediately at the interface from CaCO3 crystals and swollen Chi-P film (Figure 4D) (see Figure 4). Furthermore, EDS showed that theoretical calcium/oxygen ratio (Ca/O = 1/3) of the resultant CaCO3 crystals in both flat and rounded analyzed area (symbol in the image) changed. In order to confirm these results in a broad area from spherical CaCO3 particles, a flat and rounded area was selected and EDS was performed (Supplementary Materials Figure S5). This observation suggests that the adsorption of crystal particles onto Chi-P film does not occur preferentially on the Chi-P surface and the additive effect on the nucleation of CaCO3 may occur due to the diffusion or more expanded (or soluble) chains of Chi-P, which can alter the process of crystal growth formation in order to favor a selective morphogenetic effect on CaCO3. This effect could be due to the presence of small amount of phosphorylated Chi oligomers with higher water solubility than the original Chi-P polymer. Such oligomers could be solubilized and diffused from solid matrix to the aqueous media once the Chi-P film is swollen. It is known that Chi with phosphate derivatization in strong acid media may produce polymer degradation. With this in mind, SEM-EDS measurements of the resultant modified CaCO3 particle growth onto the ITO surface in the presence of Chi-P, the Chi-P and ITO surface performed as we observed in Figure 4. On the other hand, similar truncate calcite and aggregated spherical particles of CaCO3 were obtained when the GD method was performed. The morphological aspect of CaCO3 crystals obtained in the absence and presence of Chi-P through the GD method and aggregated truncate calcite crystals are shown in Supplementary Material Figure S6.
Finally, SEM-EDS results are in qualitative agreement with all inorganic CaCO3 particles obtained from both crystallization methods. It is important to mention that inspected CaCO3 particles on the Chi-P surface were difficult to determine by spectroscopic analysis despite the large number of CaCO3 particles layered on the Chi-P surface. Furthermore, an X-ray diffraction (XRD) analysis of the truncate calcite and spherical CaCO3 particles obtained with the EC method was performed as shown in Figure 8A. Here, the XRD analysis clearly demonstrates the coexistence of calcite and vaterite polymorphs. It can be seen that the only two diffraction peaks appear at 2θ = 29.4° and at 2θ = 26.7°, which are ascribed to the most intense (104) and (112) crystallographic faces of calcite and vaterite, respectively. The diffraction peaks for calcite and vaterite for crystallographic planes and 2θ degree are in agreement with both crystals designations as was recently published using the ultrasound technique [59]. In the case of the XRD spectrum of Chi-P sample (Figure 8B), it shows a typical non-crystalline XRD curve, suggesting an amorphous nature of Chi-P biopolymer. The present data strongly suggest the ability of anionic functionalize Chi-P template for modifying the morphological aspect of CaCO3 crystals and the stabilization capacity of the metastable form of vaterite. Consequently, the EC method offers a viable alternative for polymer-controlled crystallization of different inorganic minerals, such as Ca-salts, CaOx, hydroxyapatite, and silica, among others.

5. Conclusions

Phosphate moieties of Chi-P act showed inhibitor capability on the in vitro mineralization of CaCO3 as we demonstrated in both crystallization methods and by using chronoamperometric curves of CaCO3 obtained by the EC method. Since the phosphorous content of Chi-P was to be at ca. 3–4 wt% and CaCO3 surface interaction is driven by anionic surface charge, we suggest that in vitro EC and GD methods are influenced by parameters such as current, voltage, phosphorous content, purity, pH, and topography surface of Chi-P, etc. The resultant CaCO3 crystals obtained by EC method represents an advanced and fast in vitro mineralization system for studying different aspect of nucleation, crystal growth, size, and polymorphism of inorganic materials. For instance, Chi-P regulates the selectively precipitation of truncate and spherical aggregate CaCO3 crystals in both mineralization systems. Here, ATR-FTIR and XRD analysis determined clearly the coexistence of calcite and the metastable form of vaterite as the unique polymorphism when EC method was performed. In summary, anionic Chi-P biopolymer acted as an efficient modifier of CaCO3 crystallization using EC and GD methods and the EC demonstrated the viable capacity to control the polymorphism of CaCO3. Therefore, the classical EC method offers a great chance for understanding the crucial role of functionalized biomacromolecules on the stabilization of metastable forms of crystals in the biomineralization field.

Supplementary Materials

The following are available online at https://www.mdpi.com/2073-4352/8/2/82/s1. Figure S1. FTIR spectra of chitin (Chi) and phosphorylated chitin (Chi-P). Figure S2. SEM images of CaCO3 crystals obtained through the GD method. Figure S3. TGA analysis of chitin (Chi) and phosphorylated chitin (Chi-P). Figure S4. Thermogravimetric data of chitin (Chi) and phosphorylated chitin (Chi-P). Figure S5. X-ray diffraction of phosphorylated chitin (Chi-P). Figure S6. SEM-EDS of spherical calcite particles grown on an ITO surface.

Acknowledgments

This research was supported by FONDECYT 1171520, ACCDiS 15130011 granted by the Chilean Council for Science and Technology (CONICYT), and funded by the Program U-Redes, Vice-Presidency of Research and Development, University of Chile. GC would like to thanks to Proyecto Basal PFB-27 granted by the Chilean Council for Science and Technology (CONICYT), Unidad de Desarrollo Tecnológico (UDT), University of Concepción.

Author Contributions

Nicole Butto and Andronico Neira-Carrillo conceived, designed, and performed the experiments; Gustavo Cabrera-Barjas synthesized and characterized the chitin phosphate derivative and related material together with Andrónico Neira-Carrillo, and wrote the paper. Andrónico Neira-Carrillo contributed with reagents/materials/analysis tools and represents the senior author; he is also principal investigator of the 1171520 FONDECYT’ project and Program U-Redes, Vice-Presidency of Research and Development, University of Chile, in which the current research work was done. Therefore, Andrónico Neira-Carrillo is the first author of the intellectual input, designs, and approves the reported protocols of this study. Andrónico Neira-Carrillo and Gustavo Cabrera-Barjas was responsible for the manuscript correction, proofreading during all paper submissions, and handling the revisions and re-submission process of the revised manuscript.

Conflicts of Interest

The authors declare no conflict of interest.

Appendix A

Appendix A.1. Synthesis of Phosphorylated Chitin

The synthesis of Chi-P was carried out following the procedure reported by Nishi et al. [60] where 35 mL of concentrated methanesulfonic acid was placed in a round bottom flask submerged in an ice bath with magnetic stirring (500 r.p.m). To this media 5 g of prawn Chi was slowly added to complete dissolution. Phosphorus pentoxide was then added to the Chi solution at 1 equivalent mol to the Chi residues. The phosphorylation reaction was allowed to proceed for 4 h at 0–5 °C. The mixture of Chi solution with phosphorus pentoxide was poured into a large amount of ether and the white solid was centrifuged and washed with ethanol several times up to complete acid removal. The Chi-P derivative was suspended in water, dialyzed for three days using distilled water, and lyophilized.

Appendix A.2. FTIR Analysis

The FTIR spectra were measured using FTIR Nicolet Magna 5PC spectrophotometer coupled to a PC with OMNIC software to data analysis. The KBr disks were prepared by well blending KBr with dried polymer at 2% concentration.

Appendix A.3. Elemental Analysis

Elemental analysis of nitrogen (N) was carried out with a Perkin Elmer 2100 automatic analyzer and phosphorus content was determined by the modified molybdenum blue method [61]. The degree of Chi phosphoric substitution (DS) was calculated using the following equation:
DS = P (mol%)/N (mol%),
where %P phosphorus content of phosphoric groups, %N nitrogen content in chitin molecules.

References

  1. Lowenstam, H.A. Minerals formed by organisms. Science 1981, 211, 1126–1131. [Google Scholar] [CrossRef] [PubMed]
  2. Lowenstam, H.A.; Weiner, S. On Biomineralization; Oxford University Press: Oxford, UK, 1989; p. 336. ISBN 0-19-504977-2. [Google Scholar]
  3. Sanchez, C.; Arribart, H.; Giraud Guille, M.M. Biomimetism and bioinspiration as tools for the design of innovative materials and systems. Nat. Mater. 2005, 4, 277–288. [Google Scholar] [CrossRef] [PubMed]
  4. Simkiss, K.; Wilbur, K.M. Biomineralization: Cell Biology and Mineral Deposition; Academic Press: San Diego, CA, USA, 1989; p. 337. ISBN 0-12-643830-7. [Google Scholar]
  5. Addadi, L.; Weiner, S. Control and design principles in biological mineralization. Angew. Chem. Int. Ed. Engl. 1992, 31, 153–169. [Google Scholar] [CrossRef]
  6. Cölfen, H.; Mann, S. Higher-order organization by mesoscale self-assembly and transformation of hybrid nanostructures. Angew. Chem. Int. Ed. 2003, 42, 2350–2365. [Google Scholar] [CrossRef] [PubMed]
  7. Feng, J.; Wu, G.; Qing, C. Biomimetic synthesis of hollow calcium carbonate with the existence of the agar matrix and bovine serum albumin. Mater. Sci. Eng. C 2016, 58, 409–411. [Google Scholar] [CrossRef] [PubMed]
  8. Arias, J.L.; Neira-Carrillo, A.; Arias, J.I.; Escobar, C.; Bodero, M.; David, M.; Fernández, M.S. Sulfated polymers in biological mineralization: A plausible source for bio-inspired engineering. J. Mater. Chem. 2004, 14, 2154–2160. [Google Scholar] [CrossRef]
  9. Addadi, L.; Raz, S.; Weiner, S. Taking advantage of disorder: Amorphous calcium carbonate and its roles in biomineralization. Adv. Mater. 2003, 15, 959–970. [Google Scholar] [CrossRef]
  10. Gower, L.B. Biomimetic model systems for investigating the amorphous precursor pathway and its role in biomineralization. Chem. Rev. 2008, 108, 4551–4627. [Google Scholar] [CrossRef] [PubMed]
  11. Meldrum, F.C. Calcium carbonate in biomineralisation and biomimetic chemistry. Int. Mater. Rev. 2003, 48, 187–224. [Google Scholar] [CrossRef]
  12. Cartwright, J.H.E.; Checa, A.G.; Gale, J.D.; Gebauer, D.; Sainz-Díaz, C.I. Calcium carbonate polyamorphism and its role in biomineralization: How many amorphous calcium carbonates are there? Angew. Chem. Int. Ed. 2012, 51, 11960–11970. [Google Scholar] [CrossRef] [PubMed]
  13. Chen, X.; Qian, X.; An, X. Using calcium carbonate whiskers as papermaking filler. Bioresources 2011, 6, 2435–2447. [Google Scholar]
  14. Falini, G.; Fermani, S. The strategic role of adsorption phenomena in biomineralization. Cryst. Res. Technol. 2013, 48, 864–876. [Google Scholar] [CrossRef]
  15. Neira-Carrillo, A.; Yazdani-Pedram, M.; Retuert, J.; Díaz-Dosque, M.; Gallois, S.; Arias, J.L. Selective crystallization of calcium salts by poly(acrylate)-grafted chitosan. J. Colloid Interface Sci. 2005, 286, 134–141. [Google Scholar] [CrossRef] [PubMed]
  16. Gebauer, D.; Cö̈lfen, H.; Verch, A.; Antonietti, M. The multiple roles of additives in CaCO3 crystallization: A quantitative case study. Adv. Mater. 2009, 21, 435–439. [Google Scholar] [CrossRef]
  17. Gao, Y.X.; Yu, S.H.; Guo, X.H. Double hydrophilic block copolymer controlled growth and self-assembly of CaCO3 multilayered structures at the air/water interface. Langmuir 2006, 22, 6125–6129. [Google Scholar] [CrossRef] [PubMed]
  18. Zhao, L.N.; Feng, J.D.; Wang, X.Y.; Wang, Z.C. Synthesis of self-assembled needle-shaped calcium carbonate superstructures. Chin. Sci. Bull. 2010, 55, 2131–2135. [Google Scholar] [CrossRef]
  19. Laskshminarayanan, R.; Valiyaveettil, S.; Loy, G.L. Selective nucleation of calcium carbonate polymorphs: Role of surface functionalization and poly (vinyl alcohol) additive. Cryst. Growth Des. 2003, 3, 953–958. [Google Scholar] [CrossRef]
  20. Butler, M.F.; Glaser, N.; Weaver, A.C.; Kirkland, M.; Heppenstall-Butler, M. Calcium carbonate crystallization in the presence of biopolymers. Cryst. Growth Des. 2006, 6, 781–794. [Google Scholar] [CrossRef]
  21. Neira, A.C.; Fernandez, M.S.; Retuert, J.; Arias, J.L. Effect of the crystallization chamber design on the polymorphs of calcium carbonate using the sitting-drop method. In Architecture and Application of Biomaterials and Biomolecular Materials; EXS-1:321-326; Barron, A.E., Klok, H.-A., Deming, T.J., Eds.; Materials Research Society: Warrendale, PA, USA, 2004. [Google Scholar]
  22. Ma, Y.F.; Gao, Y.H.; Feng, Q.L. Effects of pH and temperature on CaCO3 crystallization in aqueous solution with water soluble matrix of pearls. J. Cryst. Growth 2010, 312, 3165–3170. [Google Scholar] [CrossRef]
  23. Pai, R.K.; Pillai, S. Nanoparticles of amorphous calcium carbonate by miniemulsion: Synthesis and mechanism. CrystEngComm 2008, 10, 865–872. [Google Scholar] [CrossRef]
  24. Gomez-Morales, J.; Hernández-Hernández, A.; Sazaki, S.; García-Ruiz, J.M. Nucleation and Polymorphism of calcium carbonate by a vapor diffusion sitting drop crystallization technique. Cryst. Growth Des. 2010, 10, 963–969. [Google Scholar] [CrossRef]
  25. Song, R.-Q.; Colfen, H. Additive controlled crystallization. CrystEngComm 2011, 13, 1249–1276. [Google Scholar] [CrossRef]
  26. Mann, K.; Olsen, J.V.; Macek, B.; Gnad, F.; Mann, M. Phosphoproteins of the chicken eggshell calcified layer. Proteomics 2007, 7, 106–115. [Google Scholar] [CrossRef] [PubMed]
  27. Falini, G.; Fermani, S. Chitin mineralization. Tissue Eng. 2004, 10, 1–6. [Google Scholar] [CrossRef] [PubMed]
  28. Ehrlich, H. Chitin and collagen as universal and alternative templates in biomineralization. Int. Geol. Rev. 2010, 52, 661–669. [Google Scholar] [CrossRef]
  29. Arias, J.L.; Fernández, M.S. Biomimetic processes through the study of mineralized shells. Mater. Charact. 2003, 50, 189–195. [Google Scholar] [CrossRef]
  30. Jimenez-Lopez, C.; Rodríguez-Navarro, A.; Domínguez-Vera, J.M.; Garcia-Ruiz, J.M. Influence of lysozyme on the precipitation of calcium carbonate: A kinetic and morphologic study. Geochim. Cosmochim. Acta 2003, 67, 1667–1676. [Google Scholar] [CrossRef]
  31. Fernández, M.S.; Passalacqua, K.; Arias, J.I.; Arias, J.L. Partial biomimetic reconstitution of avian eggshell formation. J. Struct. Biol. 2004, 148, 1–10. [Google Scholar] [CrossRef] [PubMed]
  32. Hernández-Hernández, A.; Rodríguez-Navarro, A.B.; Gomez-Morales, J.; Jiménez-Lopez, C.; Nys, Y.; García-Ruiz, J.M. Influence of model globular proteins with different isoelectric points on the precipitation of calcium carbonate. Cryst. Growth Des. 2008, 8, 1495–1502. [Google Scholar] [CrossRef]
  33. Hernández-Hernández, A.; Vidal, M.L.; Gomez-Morales, J.; Rodríguez-Navarro, A.B.; Labas, V.; Gautron, J.; Nys, Y.; García Ruiz, J.M. Influence of eggshell matrix proteins on the precipitation of calcium carbonate (CaCO3). J. Cryst. Growth 2008, 310, 1754–1759. [Google Scholar] [CrossRef]
  34. Hernández-Hernández, A.; Gomez-Morales, J.; Rodríguez-Navarro, A.B.; Gautron, J.; Nys, Y.; García-Ruiz, J.M. Identification of some active proteins in the process of hen eggshell formation. Cryst. Growth Des. 2008, 8, 4330–4339. [Google Scholar] [CrossRef]
  35. Rao, A.; Vásquez-Quitral, P.; Drechsler, M.; Fernández, M.S.; Neira-Carrillo, A.; Arias, J.L.; Berg, J.K.; Sánchez, M.; Gebauer, D.; Cölfen, H. pH-dependent schemes of calcium carbonate formation in the presence of alginates. Cryst. Growth Des. 2016, 16, 1349–1359. [Google Scholar] [CrossRef]
  36. Neira-Carrillo, A.; Retuert, J.; Martínez, F.; Arias, J.L. Effect of crosslinked chitosan as a constrained volume on the in vitro calcium carbonate crystallization. J. Chil. Chem. Soc. 2008, 53, 1367–1372. [Google Scholar] [CrossRef]
  37. Neira-Carrillo, A.; Fernández, M.S.; Poblete Hevia, G.; Gebauer, D.; Cölfen, H.; Arias, J.L. Retrosynthesis of CaCO3 via amorphous precursor particles using gastroliths of the Red Claw lobster (Cherax quadricarinatus). J. Struct. Biol. 2017, 199, 46–56. [Google Scholar] [CrossRef] [PubMed]
  38. Lédion, J.; Leroy, J.P.; Labbé, J.P. Détermination du caractère incrustant D’une eau par un essai D’entartrage accélère. TSM L’eau 1985, 80, 323–328. [Google Scholar]
  39. Pavez, J.; Silva, J.; Melo, F. Homogeneous calcium carbonate coating obtained by electrodeposition: In Situ atomic force microscope observations. Electrochim. Acta 2005, 50, 3488–3494. [Google Scholar] [CrossRef]
  40. Neira-Carrillo, A.; Sánchez, M.; Vásquez-Quitral, P.; Vargas-Fernández, A.; Silva, J.F. Control of calcium oxalate morphology through electrocrystallization as an electrochemical approach for preventing pathological disease. Ionics 2015, 21, 3141–3149. [Google Scholar] [CrossRef]
  41. Hau, N.; Chang, Y.; Feng, C. Kinetics study of silver Electrocrystallization on (3-mercaptopropyl) trimethoxysilane-grafted indium tin oxide plastic substrate. Electrochim. Acta 2015, 158, 121–128. [Google Scholar] [CrossRef]
  42. Gozalvo, R. Efecto de un Extracto de Origen Vegetal en la Mineralizacion Patologica de Oxalato de Calcio Sobre Fibras Polimericas Electrohiladas. Bachelor´s Thesis, Facultad de Ciencias de la Salud, Universidad San Sebastián, Santiago, Chile, 2017. [Google Scholar]
  43. Cardenas, G.; Cabrera, G.; Taboada, E.; Miranda, S.P. Chitin characterization by SEM, FTIR, XRD, and 13C cross polarization/mass angle spinning NMR. J. Appl. Polym. Sci. 2004, 93, 1876–1885. [Google Scholar] [CrossRef]
  44. Neira-Carrillo, A.; Retuert, J.; Martínez, F.; Arias, J.L. Calcium carbonate growth modification by constituents released from porous filter membranes. J. Chil. Chem. Soc. 2008, 53, 1469–1473. [Google Scholar] [CrossRef]
  45. Neira-Carrillo, A.; Vásquez-Quitral, P.; Díaz, M.P.; Fernández, M.S.; Arias, J.L.; Yazdani-Pedram, M. Control of calcium carbonate crystallization by using anionic polymethylsiloxanes as templates. ‎J. Solid State Chem. 2012, 194, 400–408. [Google Scholar] [CrossRef]
  46. Neira-Carrillo, A.; Krishna Pai, R.; Fernández, M.S.; Carreño, E.; Vásquez-Quitral, P.; Arias, J.L. Synthesis and characterization of sulfonated polymethylsiloxane polymer as template for Crystal growth of CaCO3. Colloid Polym. Sci. 2009, 287, 385–393. [Google Scholar] [CrossRef]
  47. Neira-Carrillo, A.; Vásquez Quitral, P.; Yazdani-Pedram, M.; Arias, J.L. Crystal growth of CaCO3 induced by new carboxylated monomethylitaconate grafted polymethylsiloxane. Eur. Polym. J. 2010, 46, 1184–1193. [Google Scholar] [CrossRef]
  48. Neira-Carrillo, A.; Acevedo, D.F.; Miras, M.C.; Barbero, C.A.; Gebauer, D.; Cölfen, H.; Arias, J.L. Influence of conducting polymers based on carboxylated polyaniline on in vitro CaCO3 crystallization. Langmuir 2008, 24, 12496–12507. [Google Scholar] [CrossRef] [PubMed]
  49. Castañeda, E. Efecto de los Ácidos Poliacrílico y Fítico y de Quitosano Sobre la Electrocristalización de Carbonato Cálcico. Bachelor´s Thesis, Facultad de Ciencias Veterinarias y Pecuarias, Universidad de Chile, Santiago, Chile, 2015. [Google Scholar]
  50. Vagenas, N.V.; Gatsouli, A.; Kontoyannis, C.G. Quantitative analysis of synthetic calcium carbonate polymorphs using FT-IR spectroscopy. Talanta 2003, 59, 831–836. [Google Scholar] [CrossRef]
  51. Rodriguez-Blanco, J.D.; Shaw, S.; Benning, L.G. The kinetics and mechanisms of amorphous calcium carbonate (ACC) crystallization to calcite, via vaterite. Nanoscale 2011, 3, 265–271. [Google Scholar] [CrossRef] [PubMed]
  52. Chen, J.; Xiang, L. Controllable synthesis of calcium carbonate polymorphs at different temperatures. Powder Technol. 2009, 189, 64–69. [Google Scholar] [CrossRef]
  53. Destainville, A.; Champion, E.; Bernache-Assollante, D.; Laborde, E. Synthesis, characterization and thermal behavior of apatite tricalcium phosphate. Mater. Chem. Phys. 2003, 80, 269–277. [Google Scholar] [CrossRef]
  54. Han, J.-K.; Song, H.-Y.; Saito, F.; Lee, B.-T. Synthesis of height purity nano-sized hydroxyapatite powder by microwave-hydrothermal method. Mater. Chem. Phys. 2006, 99, 235–239. [Google Scholar] [CrossRef]
  55. Berzina-Cimdina, L.; Borodajenko, N. Research of calcium phosphates using Fourier transform infrared spectroscopy. In Infrared Spectroscopy-Materials Science, Engineering and Technology; InTech: London, UK, 2012; ISBN 978-953-51-0537-4. [Google Scholar]
  56. Jastrzębski, W.; Sitarz, M.; Rokita, M.; Bułat, K. Infrared spectroscopy of different phosphates structures. Spectroc. Acta A Mol. Biomol. Spectrosc. 2011, 79, 722–727. [Google Scholar] [CrossRef] [PubMed]
  57. Jayakumar, R.; Egawa, T.; Furuike, T.; Nair, S.V.; Tamur, H. Synthesis, characterization, and thermal properties of phosphorylated chitin for biomedical applications. Polym. Eng. Sci. 2009, 49, 844–849. [Google Scholar] [CrossRef]
  58. Stawski, D.; Rabiej, S.; Herczynska, L.; Draczynski, Z. Thermogravimetric analysis of chitins of different origin. J. Therm. Anal. Calorim. 2008, 93, 489–494. [Google Scholar] [CrossRef]
  59. Juhasz-Bortuzzo, J.A.; Myszka, B.; Silva, R.; Boccaccini, A.R. Sonosynthesis of vaterite-Type calcium carbonate. Cryst. Growth Des. 2017, 17, 2351–2356. [Google Scholar] [CrossRef]
  60. Nishi, N.; Ebina, A.; Nishimura, S.; Tsutsumi, A.; Hasegawa, O.; Tokura, S. Highly phosphorylated derivatives of chitin, partially deacetylated chitin and chitosan as new functional polymers: Preparation and characterization. Int. J. Biol. Macromol. 1986, 8, 311–317. [Google Scholar] [CrossRef]
  61. He, Z.; Honeycutt, C.W. A modified molybdenum blue method for orthophosphate determination suitable for investigating enzymatic hydrolysis of organic phosphates. Commun. Soil Sci. Plant Anal. 2005, 36, 1373–1383. [Google Scholar] [CrossRef]
Figure 1. Experimental setup for the EC experiments of CaCO3 onto ITO in the presence of Chi-P. WE, AE, and RE are the working electrode, auxiliary reference, and working electrode, respectively.
Crystals 08 00082 g001
Figure 2. Chronamperometry curves for EC of CaCO3 crystals. Without additive (A) and in the presence of Chi-P as a solid template (B).
Crystals 08 00082 g002
Figure 3. SEM images of CaCO3 crystals obtained through the EC method on Chi-P onto the ITO surface. Control calcite on ITO (A); truncate and rounded calcites on Chi-P (BD); swollen and extended Chi-P sample embedded into the electrolytic solution (E); and the starting Chi-P sample before the EC (F). The size of Chi-P sample attached to ITO was ca. 3 mm × 3 mm. The insert in (F) shows compact matrix of Chi-P at high magnification.
Crystals 08 00082 g003
Figure 4. SEM-EDS measurements of CaCO3 crystals obtained through EC in the presence of Chi-P at 24 °C for 2 h. EDS data of ITO surface (A), starting Chi-P sample (B), combined area of the Chi-P sample and crystal (C), swollen Chi-P embedded into the electrolytic solution (D), flat plane (E), and rounded plane (F) of crystal. The color assigned to each element were arbitrarily selected in the EDS measurements.
Crystals 08 00082 g004
Figure 5. FTIR spectra of Chi-P, CaCO3 and CaCO3 crystals obtained through EC in the presence of Chi-P at 24 °C for 2 h.
Crystals 08 00082 g005
Figure 6. ATR/FTIR spectra for Chi-P membrane and Chi-P + CaCO3 deposited salt analyzed in different spectral regions from 700 cm−1 to 1450 cm−1 (A–D). The presence of bands associated with different CaCO3 polymorphs (V = vaterite, C = calcite) are indicated.
Crystals 08 00082 g006aCrystals 08 00082 g006b
Figure 7. ATR/FTIR spectra of Chi-P membrane and Chi-P + CaCO3 deposited inorganic minerals in different spectral regions.
Crystals 08 00082 g007aCrystals 08 00082 g007b
Figure 8. XRD spectra of CaCO3 crystals obtained through EC on Chi-P onto ITO substrate (A) and the Chi-P sample (B). The vertical black and blue lines, and the blue line designations in the graph, indicate calcite and vaterite standard peaks, respectively.
Crystals 08 00082 g008aCrystals 08 00082 g008b

