Article

Thermoluminescent Properties of Cerium-Doped Lu2SO5 and Y2SiO5 Single Crystalline Films Scintillators Grown from PbO-B2O3 and Bi2O3 Fluxes

1
Institute of Nuclear Physics, Polish Academy of Sciences, 31342 Krakow, Poland
2
Institute of Physics, Kazimierz Wielki University in Bydgoszcz, 85090 Bydgoszcz, Poland
*
Authors to whom correspondence should be addressed.
Crystals 2018, 8(3), 120; https://doi.org/10.3390/cryst8030120
Submission received: 8 February 2018 / Revised: 22 February 2018 / Accepted: 22 February 2018 / Published: 4 March 2018
(This article belongs to the Special Issue Crystals, Films and Nanocomposite Scintillators)

Abstract

:
In this work we show the influence of material preparation technology on the thermoluminescent properties of single crystalline films (SCFs) of Ce3+-doped Lu2SiO5 (LSO) and Y2SiO5 (YSO) orthosilicates. LSO:Ce and YSO:Ce SCFs were grown by the liquid phase epitaxy method from two different melt-solutions based on PbO-B2O3 and Bi2O3 fluxes. Absorption, cathodoluminescence, and thermoluminescent properties of LSO:Ce and YSO:Ce SCFs grown from the two previously mentioned types of fluxes were compared, and results of spectrally resolved thermoluminescence measurements and thermoluminescent glow curves of SCFs recorded in different spectral ranges were presented. We have found that the observed differences in thermoluminescent properties of the SCFs under study can be caused by the domination of Ce4+ and Pb2+ emission centers in LSO:Ce and YSO:Ce SCFs grown using PbO-B2O3 flux, and Ce3+ and Bi3+ emission centers in the SCFs grown from Bi2O3 flux.

1. Introduction

Lutetium (Lu2SiO5, LSO) and yttrium (Y2SiO5, YSO) orthosilicates are related to the well-known scintillation materials [1]. Due to their high-density, LSO with rare-earth dopants are competitive to other scintillating materials, such as LuAlO3 (LuAP) perovskite or Lu3Al5O12 (LuAG) or Gd3Ga5O12 (GGG) garnets for X-ray imaging with submicron resolution [2,3]. Specifically, during the last few years, Tb3+, Ce3+, and Ce3+-Tb3+ single crystalline films (SCFs) of LSO and YSO orthosilicates were developed using the liquid phase epitaxy (LPE) method [4,5,6,7,8] for application as scintillating screens in microimaging detectors with special resolution even in the submicron range [9,10].
In our previous works [11,12,13], we also studied the thermoluminescence (TL) properties of Ce3+-doped LSO and YSO SCFs grown by the LPE method from PbO-B2O3 flux. We have shown that the LSO:Ce and YSO:Ce SCFs exhibit unexpected strong thermoluminescent signal above room temperature (RT) [11,12,13]. Such promising results led us to further research in this subject. Firstly, it is interesting to determine the nature of trapping centers in Ce3+-doped LSO and YSO SCFs, responsible for such strong thermoluminescence taking into account the absence of substitution-type defects and expected very low concentration of oxygen vacancies in these SCFs due to the very low temperature of their preparation by the LPE method in oxygen-containing atmosphere (air).
In our last works [11,12,13], we assumed that the formation of such trapping centers in LSO:Ce and YSO:Ce SCFs is related to the use of PbO-based flux and Pt mounting for the crystallization of these films. The nature of these traps is mainly caused by the presence of Pb2+ (from flux) and Pt4+ (from crucible) contaminations in these SCF samples and the formation of different local charge and volume compensated lattice defects, such as the oxygen or cation vacancies around the mentioned impurities, which can act as trapping centers in the TL of these SCFs [11,12,13].
On the one hand, the large lead contamination of LSO:Ce and YSO:Ce SCFs in the 0.02–0.19 at.% range (see Table 1) can lead also to the creation of Ce4+- and Pb2+-based centers with local charge and volume compensation, which can also be involved in the TL processes in these SCFs as emission centers [8]. On the other hand, in LSO:Ce and YSO:Ce SCFs grown by the LPE method from Bi2O3 flux, mainly the Ce3+ valence state is realized in these SCFs in the case of the incorporation of isovalent Bi3+ ions as flux agent [8,14,15]. Therefore, in these SCFs we can mainly expect the formation of Bi3+- and Ce3+-based centers [8,15].
Taking these data into account, in this paper we concentrate our attention on the study of the influence of material preparation technology by the LPE method on the TL properties of LSO:Ce and YSO:Ce SCFs. Especially, we compare the influence of different contamination coming to SCFs from PbO-B2O3 or Bi2O3 fluxes, used for LPE growth, on the thermoluminescent properties of these SCFs (e.g., the TL glow curve shape and the TL emission spectra).

2. SCF Preparation and Investigation Methods

Nominally undoped and cerium-doped LSO and YSO SCFs were prepared onto undoped YSO substrates (Table 1). The SCFs were grown by the LPE method from a super-cooled melt-solution based on two different fluxes: PbO-B2O3 (samples 1, 2 and 5, 6) and Bi2O3 (samples 1, 2 and 5, 6) (Table 1, see also [8,15] for details). The samples were doped with cerium ions using CeO2 activator with concentration in the 10–20% range. All growth processes were carried out at relatively close growth conditions.
Detailed information about the investigated LSO, YSO, LSO:Ce, and YSO:Ce SCF samples is presented in Table 1. The growth temperatures of LSO- and YSO-based SCFs based on PbO-B2O3 were in the 986–993 °C range. In the case of Bi2O3 flux, the LSO and YSO based SCF growth processes were carried out in the 918–945 °C range. The thicknesses of the achieved SCFs were between 6.1 μm (sample 3) and 64 μm (sample 6).
The absorption spectra of the SCFs under study were measured using a Jasco 760 UV-VIS spectrometer (Jasco Int. Co. Ltd, Tokyo, Japan) in the 190–600 nm range. The cathodoluminescence (CL) spectra were investigated at RT using a JSM-820 scanning electron microscope (SEM) (JEOL, Tokyo, Japan), additionally equipped with a StellarNet spectrometer (StellarNet Inc, Tampa, FL, USA) with a thermoelectrically-cooled CCD detector working in the 200–925 nm range.
Measurements of the spectrally resolved thermoluminescence were performed at a set-up based on a SP150 spectrograph (Acton Research Corporation, Acton, MA, USA). The spectral range was 190–1080 nm. The applied heating rate was approximately 0.8 °C/s. Thermal infrared radiation emission was cut off by the use of a KG5 filter with transmittance 300–800 nm (Schott AG, Mainz, Germany). The received spectra were numerically calibrated with respect to wavelength scale and luminescence intensity of the measurement system.
Thermoluminescence was measured using a Risø DA-20 TL/OSL reader (Risø DTU, Roskilde, Denmark) equipped with EMI 9235QB bialkali photomultiplier (sensitivity range approximately 200–600 nm). TL glow curves of all samples were registered from 50 °C to 450 °C. The heating rate was 1 °C/s. Measurements were carried out using two emission band pass filters. The “green” filter Schott BG39 transmits light from 350 to 700 nm. The “UV” Hoya U-340 filter enables measurement in the range of 250 up to 400 nm. Before each irradiation, the samples were annealed in the reader at 450 °C for 10 s.
For both experiments, SCF samples were irradiated with alpha particles. They were exposed to the 241Am source (fluence rate of 1.7 × 105 cm−2·s−1, energy at samples surface of 5.06 MeV) built-into the Risø DA-20 TL/OSL reader. The ranges of used alpha particles in LSO and YSO hosts, calculated with SRIM software [14] were 11.7 μm and 13.4 μm, respectively. The thicknesses of SCFs in the investigated samples (see Table 1, column 6) were higher than the estimated ranges of alpha particles in these materials for all samples except for sample 3 (SCF’s thickness 6.1 μm). Therefore, we can assume that for the remaining samples the thermoluminescent signal originates only from the SCFs. For sample 3, the TL signal may also be partly emitted from YSO substrate.

3. Results

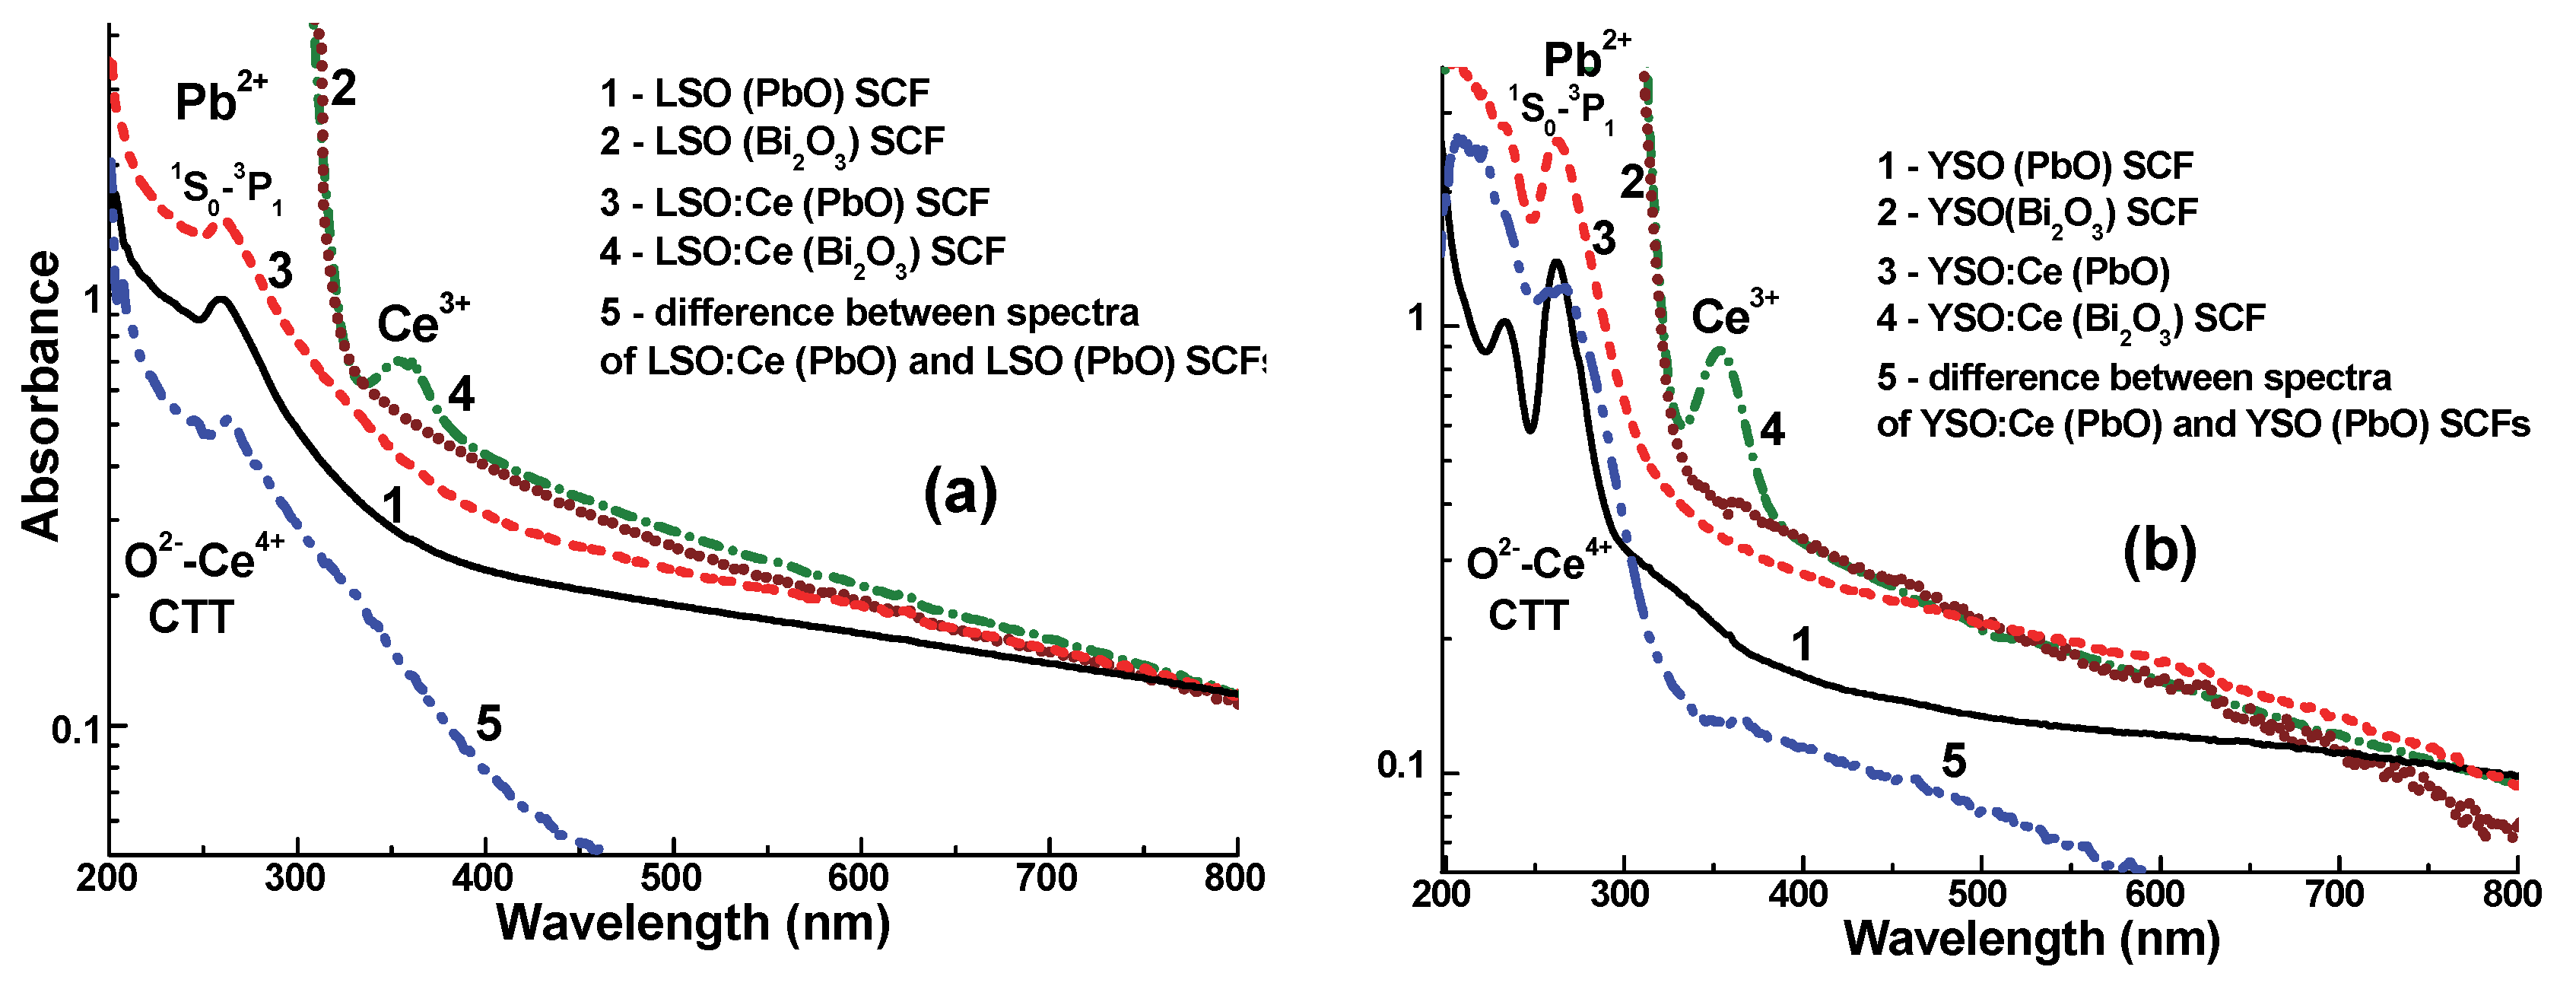
3.1. Absorption Spectra

The absorption spectra of the nominally undoped and Ce-doped LSO and YSO SCFs grown from PbO- and Bi2O3-based fluxes are shown in Figure 1a,b, respectively. The characteristic features of the absorption spectra of undoped YSO and LSO SCFs grown from PbO flux are the presence of the intensive bands peaked around 250 nm, 230 nm, and below 200 nm. The intensity of these bands increase with decreasing SCF growth temperature (e.g., the Pb2+ content in SCFs), and vice versa. Thus, the mentioned bands are caused by the absorption of Pb2+ flux-related impurity. Namely, the bands peaked around 260 nm and <200 nm correspond to the 1S03P1, 3P2, and 1P1 transitions of Pb2+ ions (A, B, and C bands), respectively [16]. The latter bands can also be overlapped with the broad bands in the same spectral range related to the charge transfer transition (CTT) between the Pb2+ ions and bottom of YSO and LSO conduction bands. The continuous absorption of YSO- and LSO-based SCF samples throughout the whole spectrum up to 800 nm can be caused by the Pb2+→Pb4+ charge transfer transitions [17].
The absorption spectra of YSO:Ce and LSO:Ce SCFs grown from Bi2O3 flux are characterized by very strong bands peaked below 320 nm which are related to the 1S03P1 transitions of Bi3+ ions [18]. The large Bi3+ concentration (up to 2 at %) in these SCFs can explain the very large intensity of these bands.
Ce3+ doping in LSO and YSO SCFs grown from PbO and Bi2O3 fluxes yields the additional absorption bands in both the UV and visible ranges (Figure 1a and Figure 2b, curves 2 and 3, respectively). The band peaked at 352 nm—related to the 4f–5d1 transitions of Ce3+ ions—is well-resolved in the absorption spectra of LSO:Ce and YSO:Ce SCFs grown from the Bi2O3 flux; whereas in the spectra of LSO:Ce and YSO:Ce SCFs grown from PbO flux, this band is observed only in the form of small bumps on the low-energy wings of the strong absorption bands related to the transitions of Pb2+ ions. Therefore, the main valence state of cerium ions in the last samples is not the Ce3+ state. Taking the comparable (by the order of value) cerium and lead content in LSO:Ce and YSO:Ce SCFs (0.03–0.1 at %) into account, we can even suppose the formation of the Ce4+-Pb2+ pair centers in these SCFs with the local charge and volume compensations.

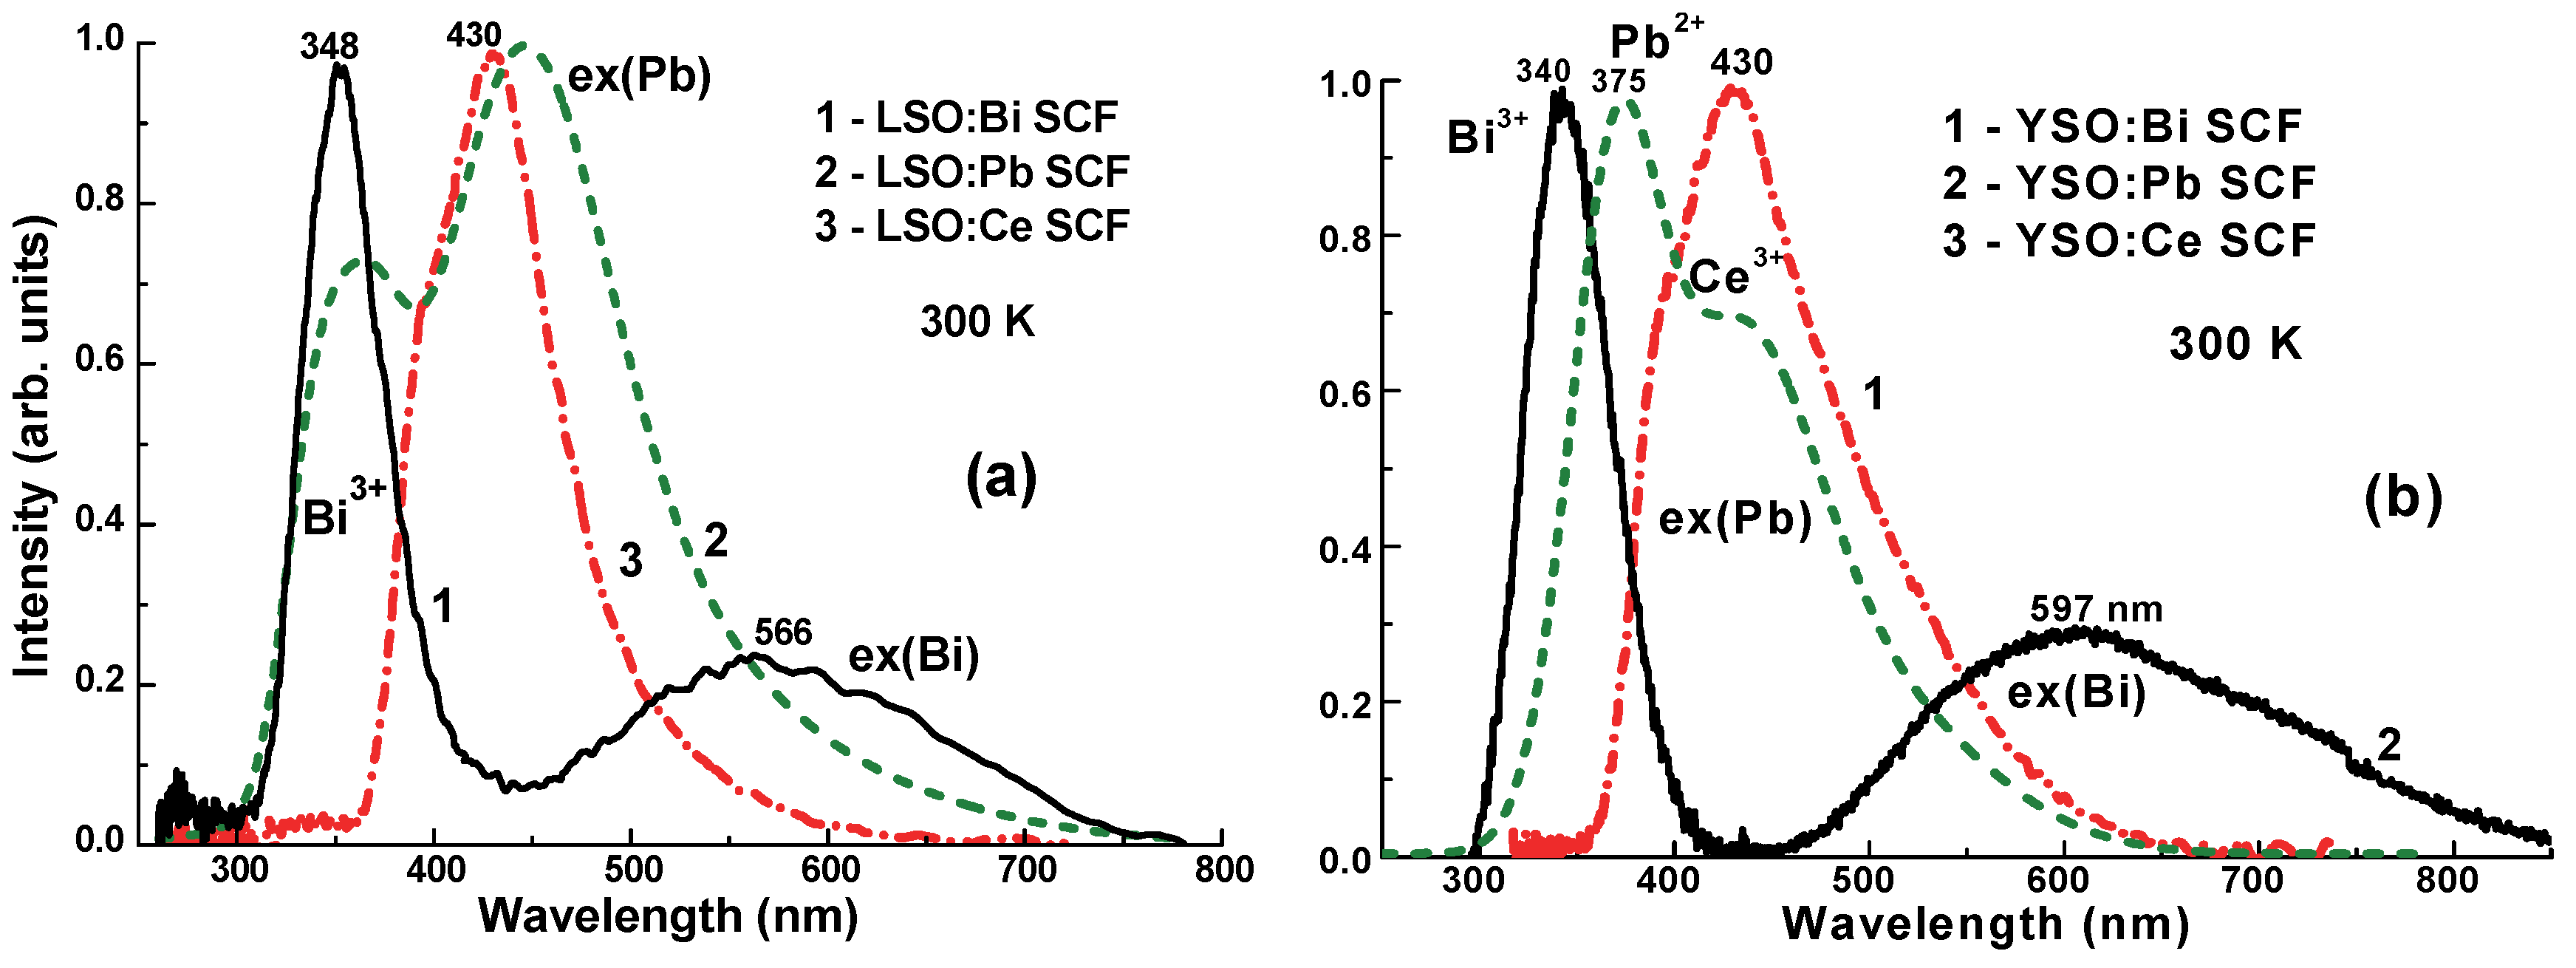
3.2. Cathodoluminescence (CL) Spectra

The CL spectra of nominally LSO and YSO SCFs grown from Bi2O3 flux under excitation with the energy above the band gap of LSO and YSO hosts show two emission bands in the UV and visible ranges (Figure 2a and Figure 2b, curves 1, respectively). These bands are related to the luminescence of Bi3+-based centers due to contamination from Bi2O3 flux, and are typical for the luminescence of Bi3+ (ns2) ions in orthosilicates and other oxide compound hosts [18,19]. The dominant UV bands, peaked at 348 and 340 nm for LSO:Bi and YSO:Bi SCFs, respectively, arise from the 3P1,01S0 radiative transitions of Bi3+ ions in the seven-fold coordinated Y1/Lu1 cation positions [20,21,22]. The weaker complex emission bands in the visible range, peaked at 566 nm for LSO:Bi SCFs and at 597 nm for YSO:Bi SCFs at 300 K, probably arise from: (i) the luminescence of the excitons localized around Bi3+ ions in YSO and LSO hosts; [18,19] (ii) the intrinsic luminescence of Bi2+ centers which are formed under high-energy excitation by way of the capture of an electron by Bi3+ ions [23,24].
The CL spectra of nominally undoped YSO and LSO SCFs grown from PbO based flux are shown in Figure 2a,b, curves 2, respectively. Both spectra consist of the superposition of the two main UV bands peaked at 374 and 365 nm and two visible bands peaked 434 and 446 nm, respectively. All the mentioned bands are related to the luminescence of Pb2+-based centers due to contamination from PbO-based flux. The emission bands peaked at 374/365 nm correspond to the 3P11S0 transitions of Pb2+ ions in Y1/Lu1 sites of YSO and LSO hosts with seven oxygen ligands [7,16] (further noted as Pb1 centers, respectively). The nature of the 434/446 nm emission bands (Pb2 centers) is still not clear, and can been interpreted as: (i) the emission of the excitons localized around Pb2+ based centers [6,7,8]; (ii) the luminescence of Pb2+ ions in Y1/Lu1 sites of the X2 structure with seven oxygen ligands or in Y2/Lu2 sites of the X1 structure with six oxygen ligands [15,22].
Accounting for the fact that the Pb2+ luminescence in LSO and YSO hosts is significantly quenched at room temperature and the Coulomb’s compensation is necessary to balance the non-equal Lu3+ (Y3+) cation charge state at the embedding of the divalent lead ion, the intensity of the luminescence Pb2+ is very small, and its presence in LPE-grown SCFs always leads to a decrease of the luminescence and scintillation efficiency of rare-earth ions—specifically Ce3+ions [15].
On the contrary, the Bi3+ ions can be used as activators in LuAG, LSO, and LuAP hosts due to favorable charge state and their dominant intrinsic 1S03P1 radiative transitions in the UV range [16]. An example is provided in Figure 2, where the CL spectra of LSO and YSO SCFs grown from Bi2O3 flux are shown. It is necessary to mention that the photoelectron yield in the Bi-doped LSO and YSO SCFs shows values lower by several times [16] compared with the SCF counterparts grown from PbO-based flux.
The CL spectra of Ce doped LSO and YSO SCFs grown from Bi2O3 flux are shown in Figure 2a and Figure 2b, curves 3, respectively. The dominant doublet emission band peaking around 430 nm in spectra of both YSO:Ce and LSO:Ce SCFs is caused by the Ce3+ ions in the positions of Y1 and Lu1 cations with seven oxygen ligands (Ce1 centers). At the same time, some enhancement of these emission bands at the long-wavelength side can be caused by the luminescence of Ce3+ ions in the Y2 and Lu2 positions of YSP and LSO hosts with six oxygen ligands (Ce2 centers) [25,26].

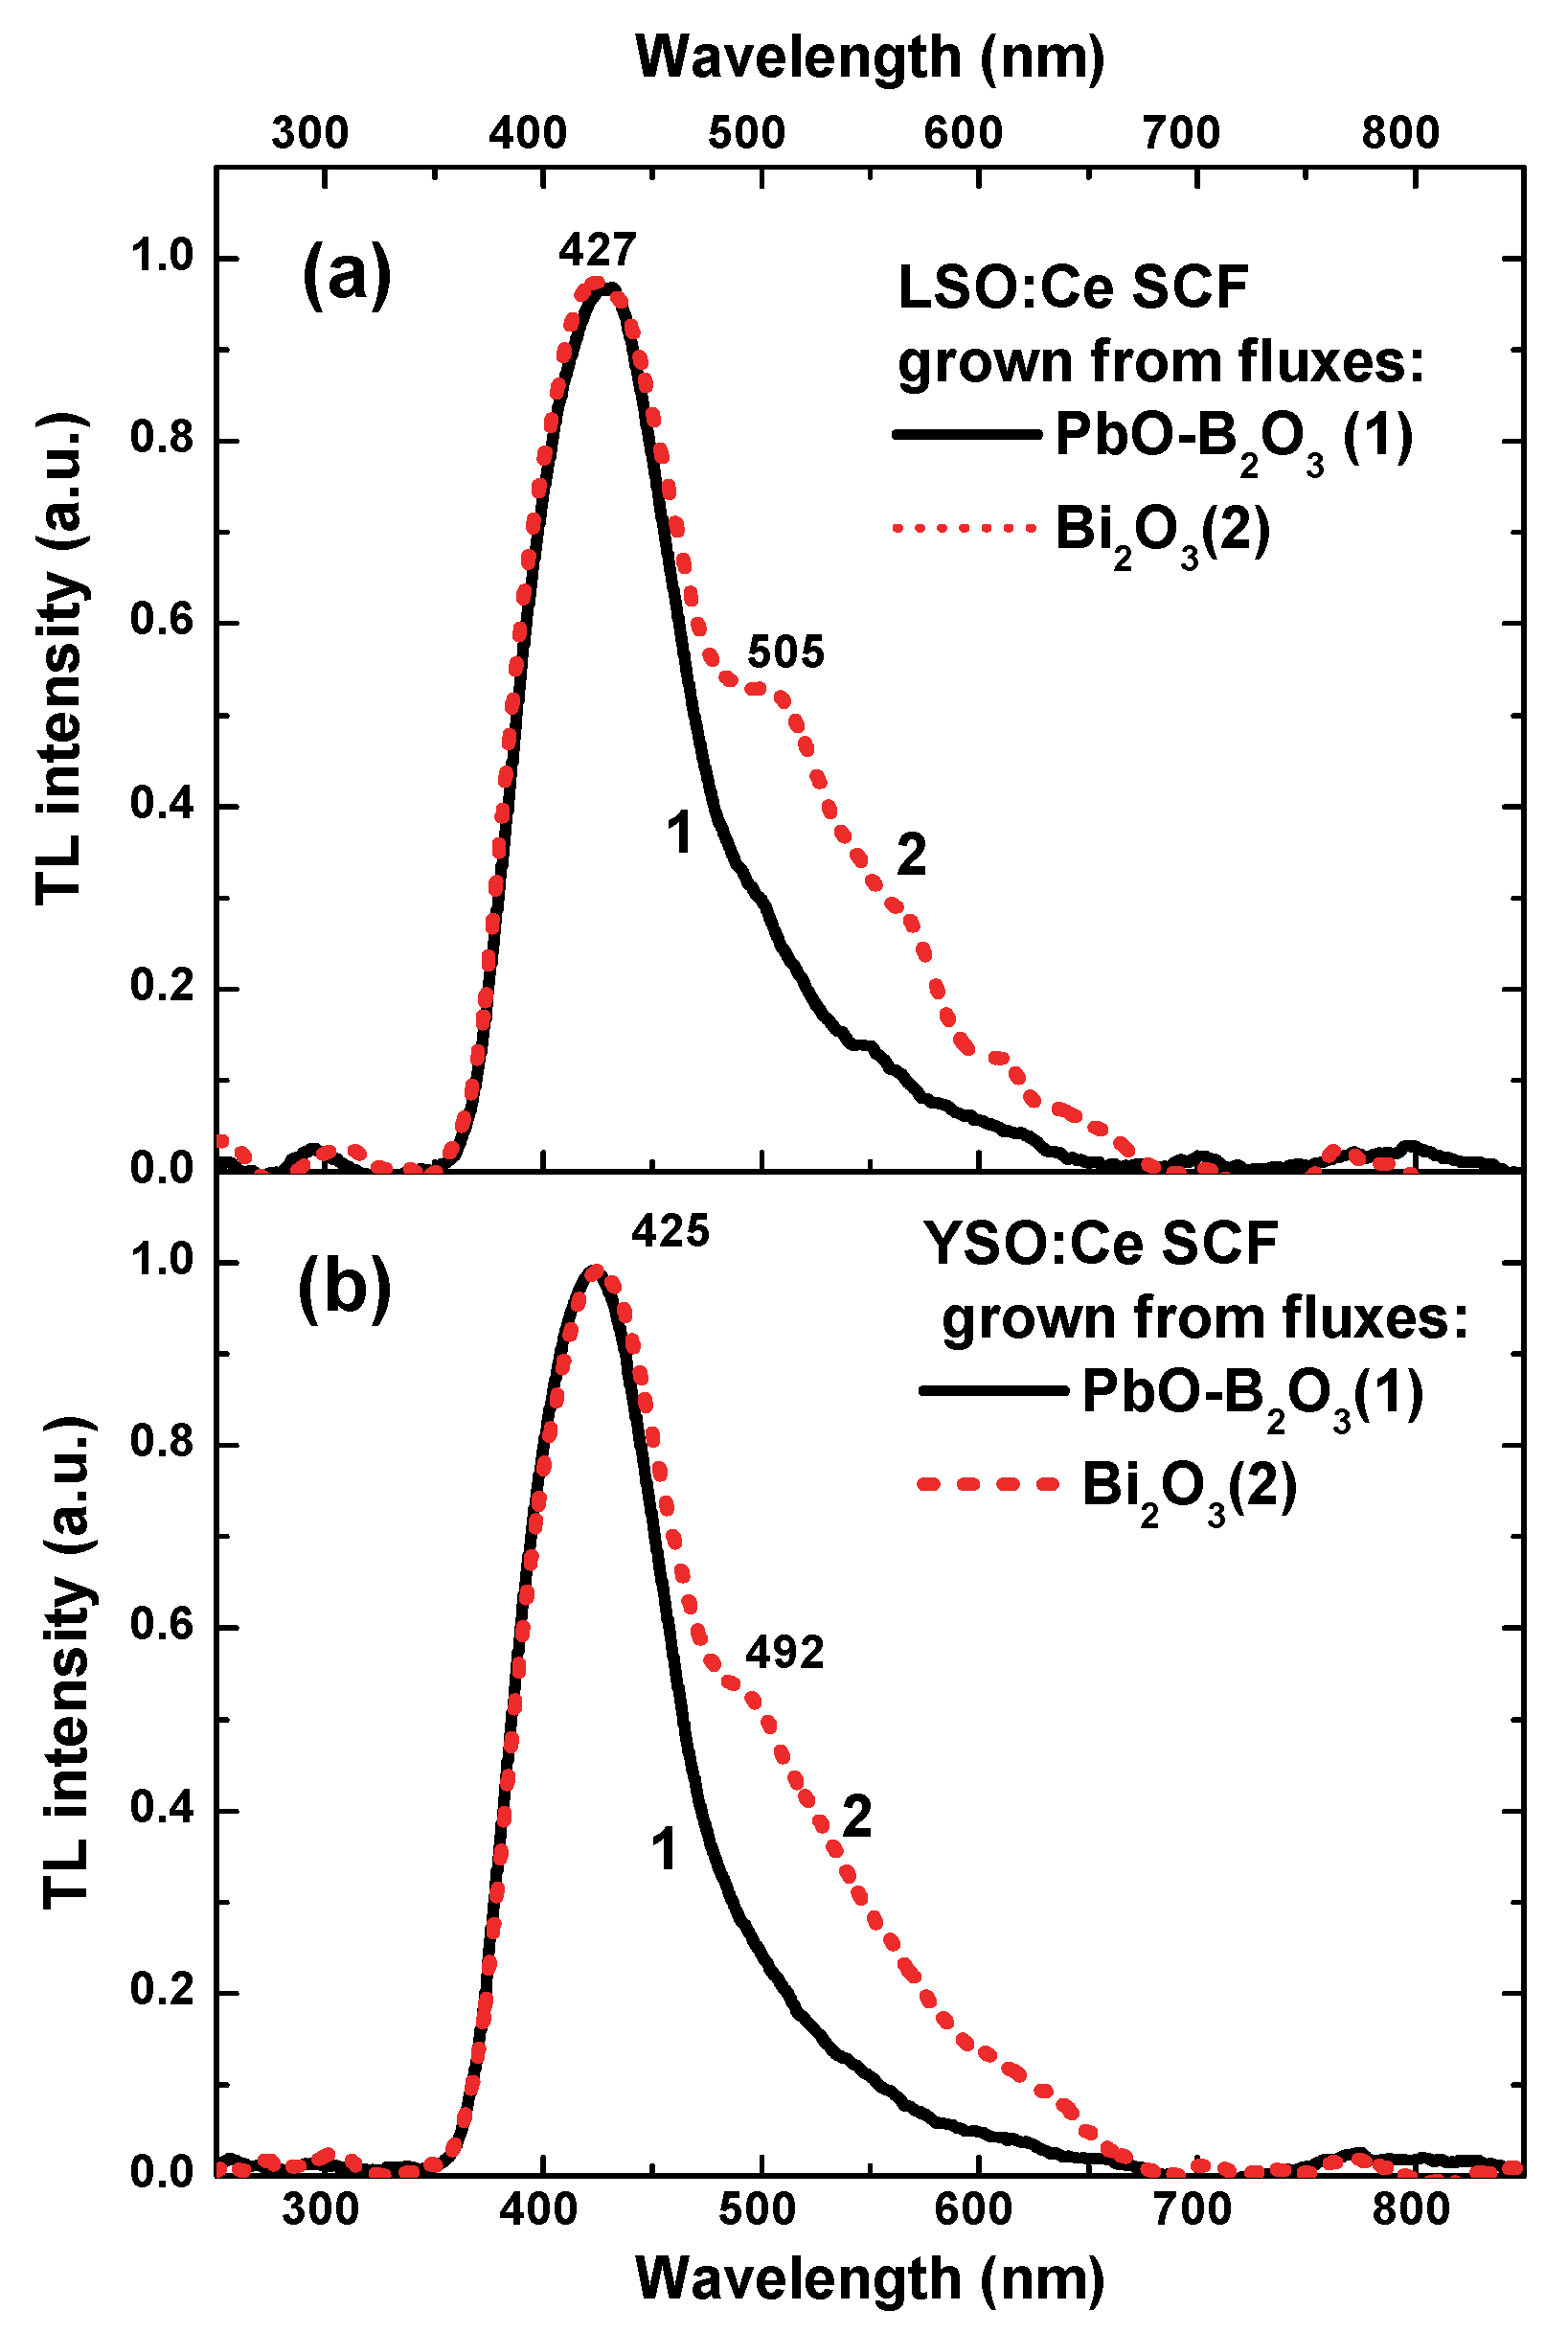
3.3. Spectrally-Resolved Thermoluminescence

LSO:Ce and YSO:Ce SCF samples grown from both fluxes were annealed at 400 °C for 30 min and then exposed to alpha particles (at fluence of 6.95 × 109 cm−2). Emission spectra of each sample were collected 3 to 5 days after irradiation. The registered emission spectra were integrated over the whole temperature range.
The comparison of the thermoluminescence emission spectra of both LSO:Ce and YSO:Ce SCFs grown using PbO-B2O3- and Bi2O3-based fluxes is presented in Figure 3. For all measured samples, a peak at 420 nm is dominant within the TL emission spectra. This peak may be associated with the luminescence of Ce3+ centers. LSO:Ce and YSO:Ce SCFs prepared with Bi2O3 flux also possess an additional luminescence band peaked at 500–600 nm. The enhanced TL emission spectra of these SCF samples with the additional bands peaked at 505 and 492 nm (Figure 3a and 3b, respectively) are most probably related to the luminescence of the Bi3+-based centers in the complex emission bands in the visible range, namely to the luminescence of the localized excitons around Bi3+ single and pair centers or to the luminescence of Bi2+ centers [15,18,19]. It is interesting to note here that the UV emission bands—related to the intrinsic 3P1,01S0 radiative transitions of Bi3+ ions—are fully absent in the TL emission spectra. This can be an additional indication of the different nature of the UV and visible emission bands of Bi3+ ions. Namely, the presence of the CL and thermoluminescence of LSO:Ce and YSO:Ce SCFs in the visible band presuppose the recombination nature of such emission (e.g., the subsequent processes of creation e/h pairs, their trapping, and recombination around Bi3+ centers).

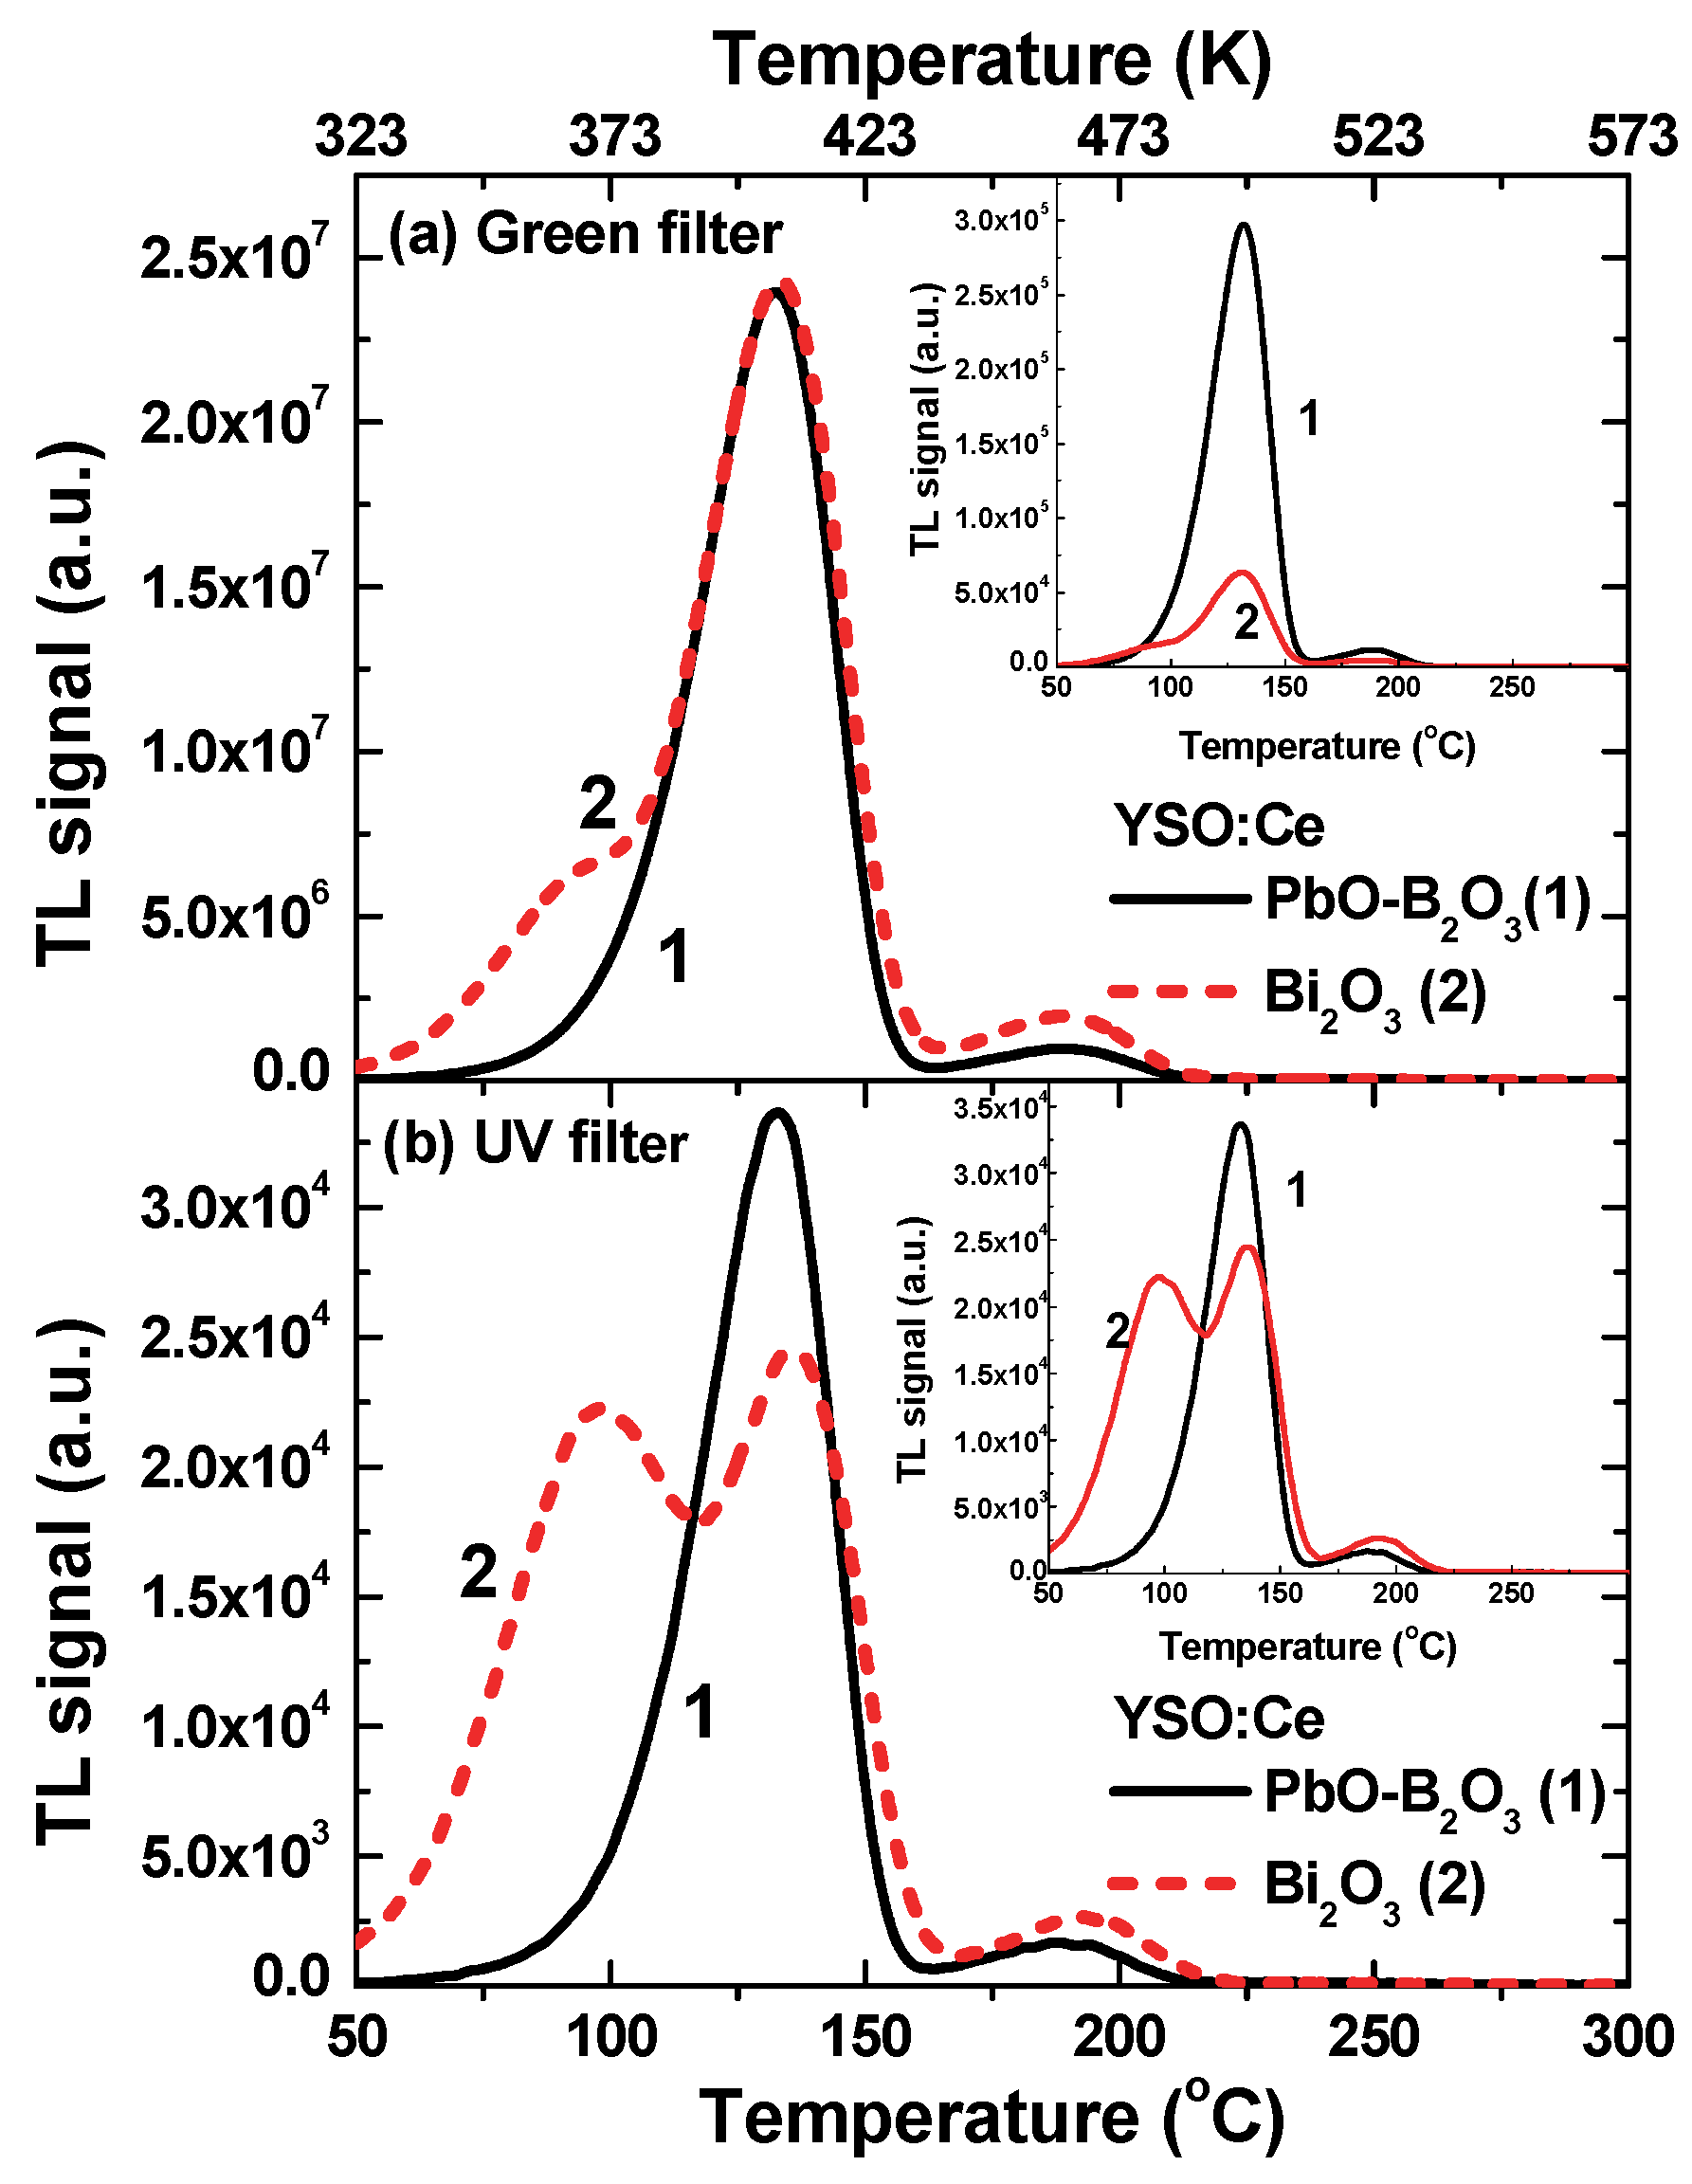
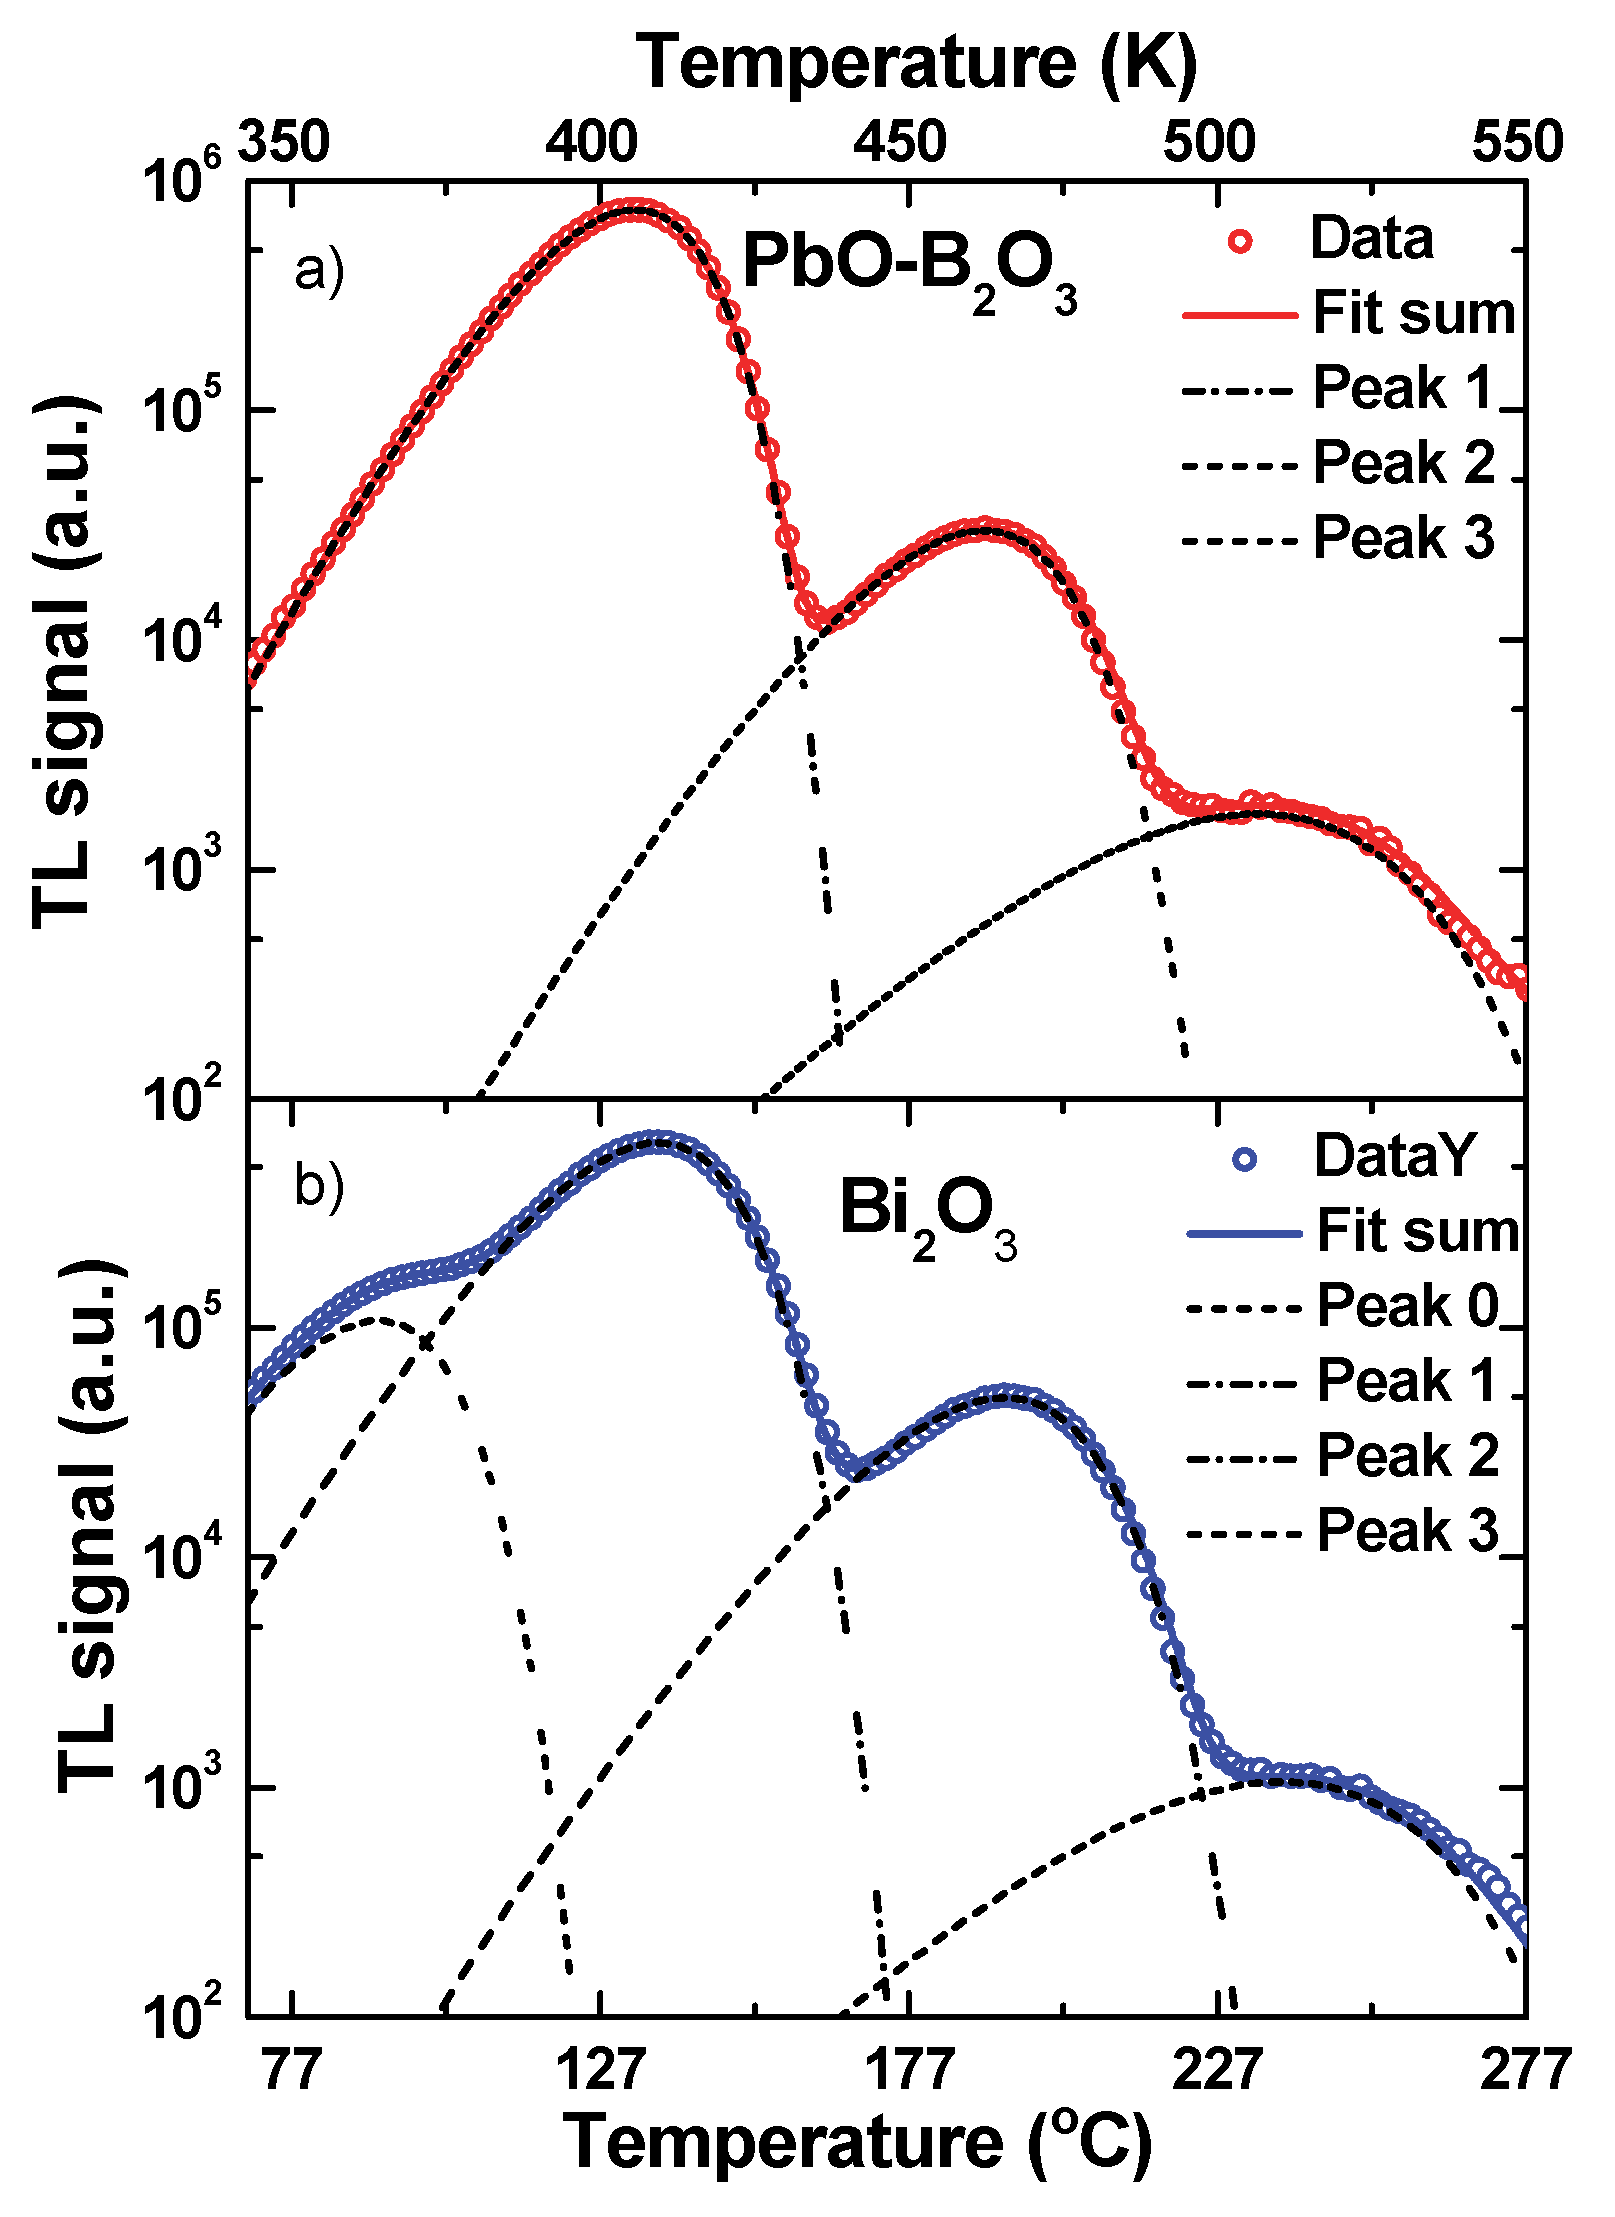
3.4. Thermoluminescence Glow Curves
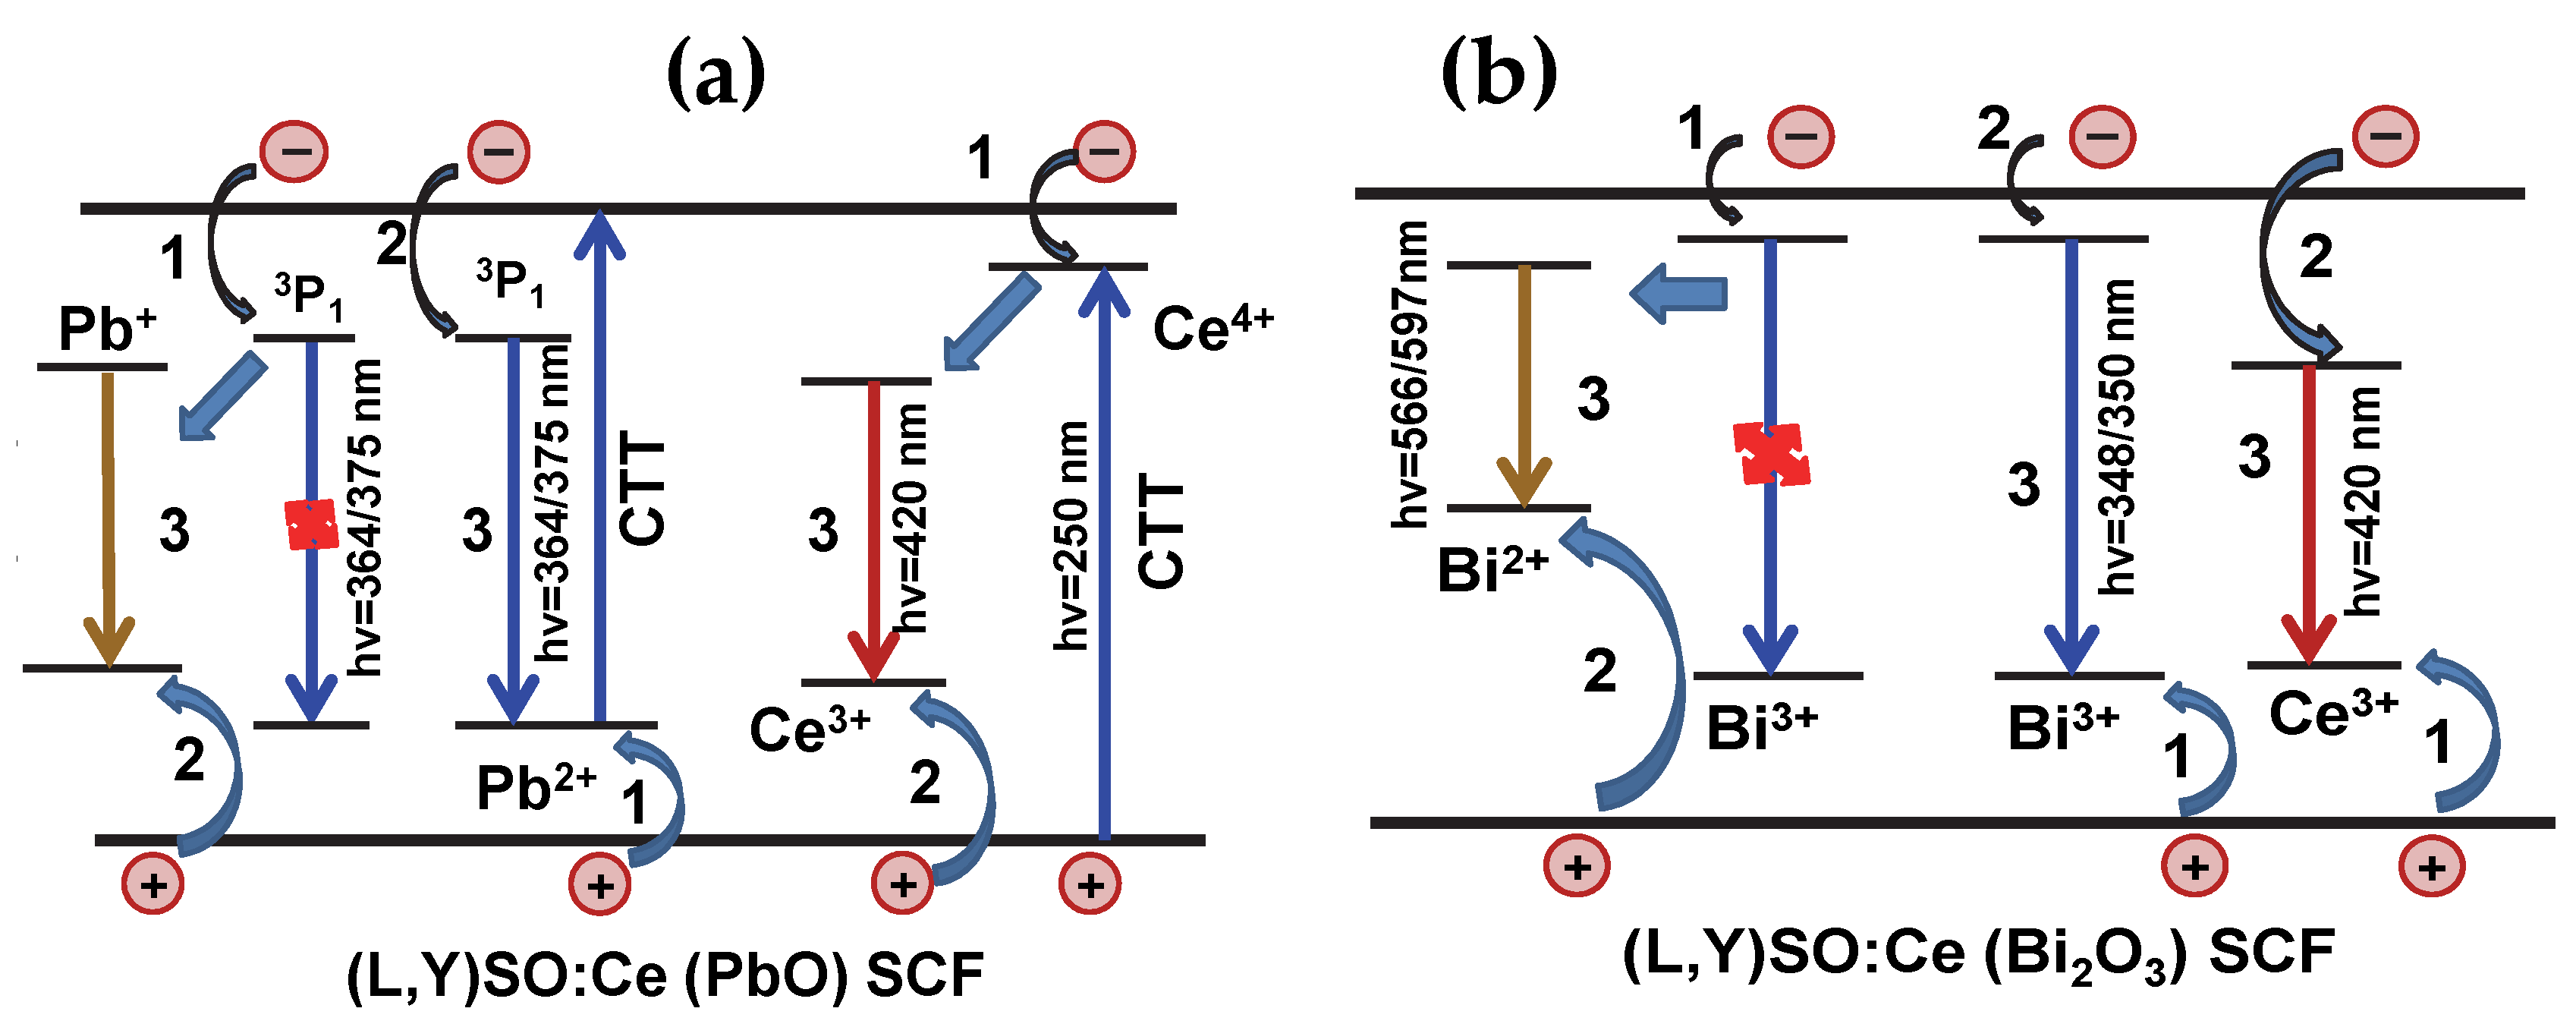
Thermoluminescence glow curves of the investigated samples were collected immediately after irradiation, which was preceded by an annealing process. The doses used for TL readouts with two applied band pass filters were not the same, due to different signal intensities. For measurements in the “UV” range (filer Hoya U-340), samples were exposed to alpha particles with a fluence of 4.08 × 107 cm−2 or beta particles with dose of 6.66 Gy. As a “green” filter’s transmittance (350–700 nm) is better matched to samples’ emission spectra, the dose used was ten times lower than in “UV” range measurements (an alpha fluence of 4.08 × 106 cm−2, a beta dose of 0.67 Gy). Figure 4 and Figure 5 present thermoluminescence glow curves of LSO:Ce and YSO:Ce SCF samples collected using (a) Schott BG39 (“green” range) and (b) Hoya U-340 (“UV” range) emission filters. The inset graphs show corresponding TL glow curves measured after beta irradiation. Because of different samples’ sizes, the registered TL signals were normalized to SCFs’ surface area in the case of alpha irradiation or samples’ masses in the case of beta irradiation.
As can be seen from Figure 4, LSO:Ce SCFs show a significant signal in the above room temperature range. For all samples, two separate TL peaks can be distinguished. The first peak, with the highest intensity, is positioned at around 405 K (132 °C), and the second one at approximately 460 K (187 °C). LSO:Ce SCF sample grown from Bi2O3 flux possess more enhanced TL signal—an additional peak at 360 K (87 °C) is observed. Because this peak occurs only in the glow curves of LSO:Ce SCFs grown from Bi2O3 flux we can suspect that this part of the signal originates from the centers related to Bi3+ ions. The TL measurements conducted with the “green” filter exactly match the emission spectrum of the samples (350–700 nm). Readouts using the “UV” emission filter cover only a part of the spectrum below 400 nm. The shapes of TL glow curves registered under both filters are similar. However, it can be noticed that the intensity of the low-temperature peak (360 K) of SCF samples grown from Bi2O3 based flux is relatively higher than that in the TL glow curve registered with UV filter. This is not observed in thermoluminescence spectra, probably because of high fading of this peak. The spectrally-resolved TL measurements took place a few days after exposure, so this unstable peak decayed.
Figure 5 presents thermoluminescence glow curves of YSO:Ce SCF samples. Sub-graphs show comparison of YSO:Ce TL signal registered with “green” (a) and “UV” (b) emission filters. In the case of YSO:Ce SCF, we can observe similar effects as in the case of LSO:Ce SCF samples. For all the crystals, we can easily distinguish at least two peaks positioned at approximately 407 K (134 °C) and 462 K (189 °C). For (Lu,Y)SO:Ce samples, proportions between the first and second peaks are similar for the same fluxes. For LSO:Ce and YSO:Ce SCF samples, we can also observe the effect of relative increase of low-temperature peak intensity, when measuring in the UV range. In the case of YSO:Ce SCF, this difference is higher—for sample 4, the peak at 365 K became comparable with the peak at 410 K. For LSO:Ce SCFs grown from Bi2O3 flux, thermoluminescence intensity is larger in comparison with their PbO-B2O3-based SCF counterparts. For YSO:Ce SCFs grown from both fluxes, the TL intensity in the main glow peak at 410 K are comparable.
For a more detailed comparison of the obtained TL glow curves, they were deconvoluted into individual peaks. For this purpose, GlowFit software was used [27]. An example of such deconvolution for YSO:Ce samples is shown in Figure 6. Complex results are presented in Table 2. The calculated trap depth energies of two easily distinguishable peaks were similar for the samples grown with the same flux. For the samples grown with the flux based on PbO-B2O3, the trap energies were approximately 1.10 and 1.25 eV, and for the samples prepared with Bi2O3 fluxes they were 1.00 and 1.17 eV. For both materials, the existence of a third peak placed in temperatures above 470 K was discovered. The third peak in YSO:Ce SCF samples is shifted towards higher temperatures (∼509 K) in comparison with LSO SCF (∼476 K). For this peak, the calculated energy also differed significantly in the materials under study: 0.51 eV for LSO:Ce and 0.87 eV for YSO:Ce. SCFs grown from fluxes based on Bi2O3—both LSO:Ce and YSO:Ce SCFs—possess an additional peak placed around 362 K. For both materials, the trap depth energies are also similar and amount to 0.88 eV. This result also confirms the hypothesis about the Bi3+ center origin of this peak.
TL glow curves of all the investigated samples were also read after exposure to beta particles. The obtained TL glow curves are presented in the corresponding insets of graphs in Figure 4 and Figure 5. In this case, due to higher penetration of beta radiation [28], registered thermoluminescent signal originates not only from SCFs, but also from the substrates. TL signal from YSO substrates dominates over the measured glow curves, due to larger mass of the substrate in comparison with SCF. For this reason, the effects observed for alpha exposure are not visible in this case.
The observed difference in the TL glow curves under alpha and beta particle radiation can in principle be used for the creation of hybrid film–substrate detectors based on the epitaxial structures of LSO:Ce or YSO:Ce for simultaneous registration of the different components of mixed ionization fluxes. In these types of detectors, the separation of the signal coming from the film and substrate parts can be performed using the differences in peak positions of their TL glow curves.

4. Discussion

The above-described differences in the thermoluminescent properties of LSO:Ce and YSO:Ce SCFs prepared from PbO-B2O3 and Bi2O3 fluxes most likely result from the differences in the type and concentration of main emission centers. Namely, Ce4+ and Pb2+ absorption/emission centers were dominant for LSO and YSO SCFs grown from PbO-B2O3 flux (Figure 1a and Figure 2a), while the Ce3+ and Bi3+ absorption/emission centers were dominant in the SCFs grown from Bi2O3 flux (Figure 2b) (see also [8,15]). This could have caused the difference in the TL emission spectra presented in Figure 3. At the same time, due to the different valence state of cerium ions in these SCFs, the recombination processes at Ce ions take place by way of different mechanisms (Figure 7); see also [29,30] and reference therein:
  • in (Lu,Y)SO:Ce SCF, grown from PbO-B2O3 flux (Figure 7a):
    • Ce4+ + e + p → (Ce3+)* + p → Ce3+ + hv(420 nm) + p → Ce4+ (Figure 7a, right part);
    • Pb2+ + e + p →Pb2+p + e →(Pb2+)* → Pb2+ + hv(364/375 nm) (Figure 7b, middle part);
    • Pb2++ e + p → Bi2++p →ex(Bi)*→ Bi3+ + hv(434/446nm) (Figure 7b, left part).
  • in (Lu,Y)SO:Ce SCF, grown from Bi2O3 flux (Figure 7b):
    • Ce3+ + e + p → Ce3+p + e = (Ce3+)* → Ce3+ + hv(420 nm); (Figure 7b, right part);
    • Bi3+ + e + p → Bi3+p +e →(Bi3+)* → (Bi3+)* + hv(350 nm) (Figure 7b, middle part);
    • Bi3++ e + p → Bi2++p →ex(Bi)*→ Bi3+ + hv(568/597 nm) (Figure 7b, left part).
As can be seen from Figure 4 and Figure 5, the difference in the structure of trapping centers in LSO:Ce and YSO:Ce grown from PbO-B2O3 and Bi2O3 fluxes is mainly connected with the presence of additional low-temperature peaks at 360–364 °C in (Lu,Y)SO:Ce (Bi2O3) SCF samples (Table 2). At the same time, the intensity of the overall TL signal in both SCF samples was caused by the concentration of cerium emitting centers and as Pb2+ or Bi3+ related emission centers as well as the relative luminescence efficiency of these centers. Namely, the significantly largest TL signal (larger by one order of magnitude) was observed in the LSO:Ce (Bi2O3) SCFs (Figure 4) with a typical Ce content of 0.032 at.% and highest Bi content of 2.30 at.% (Table 1) in comparison with the YSO:Ce (PbO-B2O3) SCFs (Figure 5) with higher Ce content of 0.052 at.% and typical Pb content of 0.03 at.% (Table 1).

5. Conclusions

The thermostimulated luminescent properties of LSO:Ce and YSO:Ce SCF scintillators grown using the LPE method from PbO-B2O3- and Bi2O3-based fluxes were investigated depending on Ce content in the 0.02–0.052 at.% range, as well as Pb and Bi contents in the 0.03–0.19 at.% and 0.03–2.30 at.% ranges, respectively.
The Ce3+-related luminescence band peak (420 nm) dominated in the TL emission spectra both of LSO:Ce and YSO:Ce SCFs. The SCF samples grown using Bi2O3 flux also possessed the 500–600 nm emission band related to the visible luminescence of Bi3+-based centers. The LSO:Ce and YSO:Ce SCFs grown from Bi2O3 flux showed significantly larger intensity of TL (larger by some order of magnitude) in comparison with their SCF counterparts grown from the PbO-B2O3-based flux, due to stronger participation of Bi3+ emitting centers in the TL properties of these SCF samples.
The observed differences in the TL properties of the two studied types of SCFs were caused by: (i) the presence of an additional peak at 360–365 K in SCF samples grown from Bi2O3 flux; (ii) the differences in their main emission centers: the Ce3+ and Bi3+ centers in LSO:Ce and YSO:Ce SCFs grown from Bi2O3 flux, and Ce4+ and Pb2+ centers in SCFs grown from PbO-B2O3-based flux; (iii) the largest emission efficiency of Bi3+ flux-related centers in comparison with Pb2+flux-related counterparts.
The effects described above were observed only after irradiation with alpha particles (penetration depth below 10–12 μm). The reason is that beta particles have much larger penetration range and therefore signal originates not only from SCFs, but also from the YSO substrates. In principle, the last effect can be used for the separation of the α- and β-particles in the mixed ionizing radiation fluxes with different penetration capacity using a composite SCF-substrate TL detector, grown by the LPE methods.

Acknowledgments

This work was supported by the Ministry of Science and Higher Education of Poland under Invents Plus project No IP2014 048873 and Polish National Science Centre 2016/21/B/ST8/03200 project.

Author Contributions

Anna Kilian and Pawel Bilski performed TL measurements of SCF samples and wrote project of paper, Vitalii Gorbenko performed SCF growth experiments, Tetiana Zorenko performed the measurements of SCF absorption as well as selected the samples for TL measurements, Kazimierz Paprocki performed the measurements of CL spectra, Sandra Witkiewicz calculated the Pb, Bi and Ce content in SCF samples and contributed to the idea of composite TL detector; Yuriy Zorenko analyzed the whole experimental materials and contributed in writing Introduction, SCF growth and Discussion parts as well as Conclusion of the paper.

Conflicts of Interest

The authors declare no conflict of interest.

References

  1. Melcher, C.L.; Manente, R.A.; Peterson, C.A.; Schweizer, J.S. Czochralski growth of rare earth oxyorthosilicate single crystals. J. Cryst. Growth 1993, 128, 1001–1005. [Google Scholar] [CrossRef]
  2. Мartin, Т.; Koch, A. Recent development in X-ray imaging with micrometer spatial resolution. J. Synchrotron Radiat. 2006, 13, 180–194. [Google Scholar] [CrossRef] [PubMed]
  3. Zorenko, Y.; Gorbenko, V.; Konstankevych, I.; Grinev, B.; Globus, M. Scintillation properties of Lu3Al5O12:Ce single crystalline films. Nucl. Instrum. Methods Phys. Res. A 2002, 486, 309–314. [Google Scholar] [CrossRef]
  4. Martin, T.; Douissard, P.-A.; Couchaud, M.; Cecilia, A.; Baumbach, T.; Dupré, K.; Rack, A. LSO-based single crystal film scintillator for synchrotron-based hard X-ray micro-imaging. IEEE Trans. Nucl. Sci. 2009, 56, 1412–1418. [Google Scholar] [CrossRef]
  5. Douissard, P.A.; Cecilia, A.; Martin, T.; Chevalier, V.; Couchaud, M.; Baumbach, T.; Dupré, K.; Kühbacher, M.; Rack, A. A novel epitaxially grown LSO-based thin-film scintillator for micro-imaging using hard synchrotron radiation. J. Synchrotron Radiat. 2010, 17, 571–583. [Google Scholar] [CrossRef] [PubMed]
  6. Zorenko, Y.; Nikl, M.; Gorbenko, V.; Savchun, V.; Voznyak, T.; Kucerlova, R.; Sidletskiy, O.; Grynyov, B.; Fedorov, A. Growth and luminescent properties of Lu2SiO5 and Lu2SiO5:Ce single crystalline films. Opt. Mater. 2011, 33, 846–852. [Google Scholar] [CrossRef]
  7. Zorenko, Y.; Gorbenko, V.; Savchyn, V.; Voznyak, T.; Gorbenko, V.V.; Nikl, M.; Mares, J.A.; Sidletskiy, O.; Grynyov, B.; Fedorov, A.; et al. Scintillation and luminescent properties of undoped and Ce3+ doped Y2SiO5 and Lu2SiO5 single crystalline films grown by LPE method. Opt. Mater. 2012, 34, 1969–1974. [Google Scholar] [CrossRef]
  8. Zorenko, Y.; Gorbenko, V.; Savchyn, V.; Zorenko, T.; Grinyov, B.; Sidletskiy, O.; Fedorov, A. Growth and luminescent properties of Ce and Ce-Tb doped (Y,Lu,Gd)2SiO5:Ce single crystalline films. J. Cryst. Growth 2014, 401, 577–583. [Google Scholar] [CrossRef]
  9. Douissard, P.A.; Cecilia, A.; Rochet, X.; Chapel, X.; Martin, T.; Van De Kamp, T.; Helfen, L.; Baumbach, T.; Luquot, L.; Xiao, X.; et al. A versatile indirect detector design for hard X-ray microimaging. J. Instrum. 2012, 7, P09016. [Google Scholar] [CrossRef]
  10. Cecilia, A.; Rack, A.; Douissard, P.-A.; Martin, T.; dos Santos Rolo, T.; Vagovič, P.; Hamann, E.; van de Kampa, T.; Riedel, A.; Fiederle, M.; et al. LPE grown LSO: Tb scintillator films for high-resolution X-ray imaging applications at synchrotron light sources. Nucl. Instrum. Methods Phys. Res. A 2011, 648, S321–S323. [Google Scholar] [CrossRef]
  11. Twardak, A.; Bilski, P.; Zorenko, Y.; Gorbenko, V.; Mandowski, A.; Mandowska, E.; Sidletskiy, O. Comparative study of TSL and OSL properties of LSO and LSO:Ce single crystals and single crystalline films. Radiat. Meas. 2013, 56, 196–199. [Google Scholar] [CrossRef]
  12. Bilski, P.; Twardak, A.; Zorenko, Y.; Zorenko, T.; Gorbenko, V.; Mandowska, E.; Mandowski, A.; Sidletskiy, O.; Mares, J. Thermoluminescent properties of undoped and Ce-doped LSO and YSO single crystals and single crystalline films scintillators. IEEE Trans. Nucl. Sci. 2014, 61, 276–281. [Google Scholar]
  13. Zorenko, Y.; Gorbenko, V.; Bilski, P.; Twardak, A.; Mandowska, E.; Mandowski, A.; Sidletskiy, O. Comparative analysis of the scintillation and thermoluminescent properties of Ce-doped LSO and YSO crystals and films. Opt. Mater. 2014, 36, 1715–1719. [Google Scholar] [CrossRef]
  14. Zorenko, Y.; Gorbenko, V.; Zorenko, T.; Malinowski, P.; Jary, V.; Kucerkova, R.; Beitlerova, A.; Mares, J.A.; Nikl, M. Luminescent and scintillation properties of Bi3+ doped Y2SiO5 and Lu2SiO5 single crystalline films. J. Lumin. 2014, 154, 525–530. [Google Scholar] [CrossRef]
  15. Zazubovich, S.; Krasnikov, A.; Zorenko, Y.; Gorbenko, V.; Babin, V.; Mihokova, E.; Nikl, M. Luminescence of Pb- and Bi- Related Centers in Aluminum Garnet, Perovskite, and Orthosilicate Single-Crystalline Films. In Nanocomposite, Ceramic, and Thin Film Scintillators; Pan Stanford Publishing Pte. Ltd: Singapore, 2016; pp. 227–287, ISBN 978–981–4745–22–2 (Hardcover); ISBN 978–981–4745–23–9 (eBook). [Google Scholar]
  16. Gorbenko, V.; Krasnikov, A.; Mihokova, E.; Nikl, M.; Zazubovich, S.; Zorenko, Y. Luminescence of lead-related centers in single crystalline films of Lu2SiO5. J. Phys. D Appl. Phys. 2012, 45, 355304. [Google Scholar] [CrossRef]
  17. Scott, G.B.; Page, J.L. Pb valence in iron garnets. J. Appl. Phys. 1977, 48, 1342. [Google Scholar] [CrossRef]
  18. Gorbenko, V.; Krasnikov, A.; Mihokova, E.; Nikl, M.; Zazubovich, S.; Zorenko, Y. Photoluminescence and excited state structure of Bi3+-related centers in Lu2SiO5:Bi single crystalline films. J. Lumin. 2013, 134, 469–476. [Google Scholar] [CrossRef]
  19. Babin, V.; Gorbenko, V.; Krasnikov, A.; Mihokova, E.; Nikl, M.; Zazubovich, S.; Zorenko, Y. Photoluminescence and excited state structure in Bi3+-doped Y2SiO5 single crystalline films. Radiat. Meas. 2013, 56, 90–93. [Google Scholar] [CrossRef]
  20. Ilmer, M.; Grabmaier, B.C.; Blasse, G. Luminescence of Bi3+ in gallate garnets. Chem. Mater. 1994, 6, 204–206. [Google Scholar] [CrossRef]
  21. Lacklinson, D.E.; Scott, G.B.; Page, G.L. Absorption spectra of Bi3+ and Fe3+ in Y3Ga5O12. Solid State Commun. 1974, 14, 861–863. [Google Scholar] [CrossRef]
  22. Kärner, T.; Laguta, V.V.; Nikl, M.; Shalapska, T.; Zazubovich, S. On the origin of cerium-related centres in lead-containing single crystalline films of Y2SiO5: Ce and Lu2SiO5: Ce. J. Phys. D Appl. Phys. 2014, 47, 065303. [Google Scholar] [CrossRef]
  23. Awater, R.H.P.; Dorenbos, P. X-ray Induced Valence Change and Vacuum Referred Binding Energies of Bi3+ and Bi2+ in Li2BaP2O7. J. Phys. Chem. C 2016, 120, 15114–15188. [Google Scholar] [CrossRef]
  24. Awater, R.H.P.; Dorenbos, P. Towards a general concentration quenching model of Bi3+ luminescence. J. Lumin. 2017, 188, 487–489. [Google Scholar] [CrossRef]
  25. Pidol, L.; Bruno Viana, B.; Kahn-Harari, A.; Ferrand, B.; Dorenbos, P.; van Eijk, C.W.E. Scintillation and thermoluminescence properties of Lu2Si2O7:Ce3+ crystals. Nucl. Instrum. Methods A 2005, 537, 256–260. [Google Scholar] [CrossRef]
  26. Feng, H.; Jary, V.; Mihokova, E.; Ding, D.; Nikl, M.; Ren, G.; Li, H.; Pan, S.; Beitlerova, A.; Kucerkova, R. Temperature dependence of luminescence characteristics of Lu2(1−x)Y2xSiO5:Ce3+ scintillator grown by the Czochralski method. J. Appl. Phys. 2010, 108, 033519–033524. [Google Scholar] [CrossRef]
  27. Puchalska, M.; Bilski, P. GlowFit—A new tool for thermoluminescence glow-curve deconvolution. Radiat. Meas. 2006, 41, 659–664. [Google Scholar] [CrossRef]
  28. Ziegler, J.F.; Ziegler, M.D.; Biersack, J.P. SRIM—The stopping and range of ions in matter. Nucl. Instrum. Methods B 2010, 268, 1818–1823. [Google Scholar] [CrossRef]
  29. Nikl, M.; Kamada, K.; Babin, V.; Pejchal, J.; Pilarova, K.; Mihokova, E.; Beitlerova, A.; Bartosiewicz, K.; Kurosawa, S.; Yoshikawa, A. Defect Engineering in Ce-Doped Aluminum Garnet Single Crystal Scintillators. Cryst. Growth Des. 2014, 14, 4827–4833. [Google Scholar] [CrossRef]
  30. Nikl, M.; Yoshikawa, A. Recent R&D Trends in Inorganic Single-Crystal Scintillator Materials. Adv. Optical Mater. 2015, 3, 463–481. [Google Scholar]
Figure 1. Absorption spectra (in the log scale) of LSO (a) and YSO (b) SCFs (curves 1 and 2) and LSO:Ce (a) and YSO:Ce (b) SCFs (curves 3 and 4), grown from PbO (curves 1 and 2) and Bi2O3 (curves 3 and 4) based fluxes. The difference between the spectra of LSO:Ce (PbO) and LSO (PbO) SCFs (curve 5a) and YSO:Ce (PbO) and YSO (PbO) SCFs (curve 5b) shows the presence of O2-→Ce4+ charge transfer transition (CTT) bands in the absorption spectra of LSO:Ce and YSO:Ce SCFs, grown from PbO based flux.
Crystals 08 00120 g001
Figure 2. Normalized cathodoluminescence (CL) spectra of nominally undoped (1, 2) and Ce3+-doped (3) (a) LSO SCFs and (b) YSO SCFs at 300 K.
Crystals 08 00120 g002
Figure 3. Normalized emission spectra of (a) LSO:Ce and (b) YSO:Ce, prepared with PbO-B2O3 (1) and Bi2O3 (2) fluxes, irradiated with alpha particles (6.95 × 109 cm−2). Emission spectra were integrated over the whole temperature range. TL: thermoluminescence.
Crystals 08 00120 g003
Figure 4. TL glow curves of LSO:Ce SCFs grown from PbO (1) and Bi2O3 (2) based fluxes, registered using (a) “green” and (b) “UV” emission filters. Main graphs show TL glow curves measured after irradiation with alpha particles (3.9 × 107 cm−2) and insets show TL glow curves after exposure to beta particles.
Crystals 08 00120 g004
Figure 5. TL glow curves of YSO:Ce SCFs, grown from PbO (1) and Bi2O3 (2) based fluxes, registered using (a) “green” and (b) “UV” emission filter. Main graphs show TL glow curves measured after irradiation with alpha particles (3.9 × 107 cm−2) and insets show TL glow curves after exposure to beta particles.
Crystals 08 00120 g005
Figure 6. Deconvolution of TL glow curves, registered with “green” emission filter, in YSO:Ce SCF, grown using (a) PbO-B2O3 and (b) Bi2O3 fluxes.
Crystals 08 00120 g006
Figure 7. Difference in mechanisms of excitation of the luminescence of Ce4+ and Ce4+centers as well as Pb2+ and Bi3+ centers in LSO:Ce and YSO:Ce SCFs grown from (a) PbO and (b) Bi2O3 based fluxes, respectively.
Crystals 08 00120 g007
Table 1. Growth conditions of the Lu2SiO5 (LSO)- and Y2SiO5 (YSO)-based single crystalline film (SCF) samples under study. Tg and h are the temperature and the thickness of SCF growth.
IDMaterialFluxPb/Bi Content, at %Ce Content, at %h, μmTg, °C
1LSO:Ce PbO-B2O30.190.00221990
2LSO:Ce Bi2O32.300.03215935
3YSO:CePbO-B2O30.030.0526.1983
4YSO:CeBi2O30.030.00215918
5LSOPbO-B2O30.04-9993
6LSOBi2O31.46-64940
7YSOPbO-B2O30.035-15.5986
8YSOBi2O31.46-10945
Table 2. Parameters of individual TL peaks of LSO:Ce and YSO:Ce SCFs obtained after deconvolution. Relative intensity shows the intensity of a particular peak with respect to peak with maximum intensity.
IDPeak 0Peak 1Peak 2Peak 3
Relative Intensity (%)Tmax (K)E (eV)Relative Intensity (%)Tmax (K)E (eV)Relative Intensity (%)Tmax (K)E (eV)Relative Intensity (%)Tmax (K)E (eV)
1---1004031.114.14581.290.184780.52
2173600.881004041.007.44591.180.144740.50
3---1004061.104.04621.230.235070.87
4173640.871004091.017.84661.160.175100.87

