Review

Thermodynamic Picture of Dimer-Mott Organic Superconductors Revealed by Heat Capacity Measurements with External and Chemical Pressure Control

Department of Chemistry, Graduate School of Science, Osaka University, Machikaneyama 1-1, Toyonaka, Osaka 560-0043, Japan
*
Author to whom correspondence should be addressed.
Crystals 2018, 8(4), 143; https://doi.org/10.3390/cryst8040143
Submission received: 24 February 2018 / Revised: 18 March 2018 / Accepted: 19 March 2018 / Published: 21 March 2018
(This article belongs to the Special Issue Advances in Organic Conductors and Superconductors)

Abstract

:
This article reviews and discusses the thermodynamic properties of dimer-Mott-type molecular superconductive compounds with (BEDT-TTF)2X composition, where BEDT-TTF is bis(ethylenedithio)tetrathiafulvalene and X denotes counter-anions, respectively. We focus mainly on the features occurring in the κ-type structure in which the d-wave superconductive phase appears depending on the Coulomb repulsion U and the bandwidth W, which is tunable by external and chemical pressures. First, we report the high-pressure ac (alternating current) calorimetry technique and experimental system constructed to measure single-crystal samples of molecule-based compounds to derive low-temperature thermodynamic parameters. Using extremely small resistance chips as a heater and a thermometer allows four-terminal detection of an accurate temperature and its oscillation in the sample part with sufficient sensitivity. From the analyses of the temperature dependence of the ac heat capacity of κ-(BEDT-TTF)2Cu(NCS)2 under external pressures, we discuss the changes in the peak shape of the thermal anomaly at the superconductive transition temperature Tc at various external pressures p. The rather sharp peak in CpT−1 at Tc = 9.1 K with a strong coupling character at ambient pressure is gradually reduced to weaker coupling as the pressure increases to 0.45 GPa concomitant with suppression of the transition temperature. This feature is compared with the systematic argument of the chemical–pressure effect on the basis of thermal anomalies around the superconductive transition of κ-(BEDT-TTF)2X compounds and other previously studied typical dimer-Mott 2:1 compounds. Finally, the discussion is extended to the chemical pressure effect on the normal state electronic heat capacity coefficient γ obtained by applying magnetic fields higher than Hc2 and the residual γ*, which remains in the superconductive state due to the induced electron density of states around the node structure. From the overall arguments with respect to both chemical and external pressures, we suggest that a crossover of the electronic state inside the superconductive phase occurs and the coupling strength of electron pairs varies from the electron correlation region near the metal-insulator boundary to the band picture region.

1. Introduction

Molecule-based superconductors are attracting much attention in condensed matter science because they provide a platform to discuss the physics related to the electron correlations in low-dimensional and relatively soft lattice systems [1,2,3,4]. Although there are several types of superconductive compounds in molecule-based systems, such as doped fullerene, graphite, polymers, and the recently observed picene [5,6,7,8], most are categorized as charge transfer complexes of organic donor/acceptor molecules with counter-ions. Electron pairs are formed by the attractive force in itinerant π-electrons released from frontier orbitals such as the HOMO (highest occupied molecular orbital) and LUMO (lowest unoccupied molecular orbital) to form electron bands. The band structure is determined by the molecular arrangement where the condensation energies are dominated by relatively weak van der Waals interactions.
Since a variety of molecular packings are possible in these charge transfer complexes, even in the same combination of donor/acceptor and counter-ions, the development of new superconductors and investigations of their physical properties have been extensively performed over the past four decades, as summarized in the literature [1,2,3,4,9,10,11,12,13]. To date, the most widely studied are the 2:1 complexes consisting of TMTSF (tetramethyltetraselenafulvalene), BEDT-TTF, BETS (bis(ethylenedithio)tetraselenafulvalene), and M(dmit)2 (dmit is 1,3-dithiole-2-thione-4,5-dithiolate) with their counter-ions. Due to the segregated stacking of organic donor/acceptor molecules and counter-ion molecules, they show a layered structure of organic molecules and counter-ions to form quasi-one-dimensional and two-dimensional electronic systems [1,2,3,4,9,10,11,12,13,14,15,16,17]. Complexes of BEDT-TTF and BETS with monovalence counter-anions give numerous superconductive materials.
Among the various superconductive complexes, we have focused mainly on the κ-type dimer-Mott systems of BEDT-TTF and analogous molecules, which are extensively studied as a prototype of effective half-filling compounds. They sometimes show antiferromagnetic insulating states due to the electron correlation mechanism. The antiferromagnetic spin correlation due to the on-site Coulomb repulsion in the half-filled state plays a dominant role in determining the low-temperature electronic states. The electronic features of the dimer-Mott systems are summarized as a pressure–temperature phase diagram (Figure 1) where the ratio of the band energy W and the electron correlation in the dimer unit U are the essential parameters controlling the ground state features [14,15]. The antiferromagnetic Mott insulating phase changes the superconductive phase by applying pressure due to the decrease in the U/W ratio. Kanoda et al. mapped several compounds with rigidly dimerized BEDT-TTF compounds in the phase diagram and discussed the relation between the chemical and the external pressure effects in [11,14,15]. A superconductivity where Tc exceeds 10 K appears near the metal–insulator boundary, which is known as the Mott boundary. The diagram in Figure 1 is recognized as a typical bandwidth control of a two-dimensional electron correlation system in two-dimensional (2D) half-filling state [14,15,18,19,20]. It is known that the phase diagram dominated by the parameter V/t, where V is the intermolecular Coulomb and t the intermolecular transfer—discussed experimentally by Mori et al. [21] and theoretically by McKenzie et al. [22]—gives a pressure-sensitive feature. This phase diagram is realized in non-dimeric arrangements, such as θ-type BEDT-TTF systems. In the case of the dimer-Mott system, the pair symmetry of the superconductivity and the possibility of unconventional pairings with a nodal gap feature through NMR [23], STM [24], and thermodynamic [25,26] experiments have been discussed, although the electron–phonon interactions are considered to be relatively large in organic systems [27].
To investigate the relationship between superconductivity and electron correlation physics, which peculiarly appears in 2D dimer-Mott systems especially for κ-type compounds, and to discuss the mechanism of superconductivity, the characteristic features occurring inside the superconductive phase, as well as the features of the phase transition, must be pursued. Thermodynamic information from heat capacity measurements can provide quantitative information via the analysis of entropic information of the superconductivity [28,29,30,31]. By analyzing the features of the thermal anomalies at the transitions and low energy excitations simultaneously, it is possible to grasp systematic changes in the superconductive phase where the quantum mechanical crossover is observed. For this purpose, pressure-controlled thermodynamic measurements to tune the U/W ratio and systematic arguments with the parameter of this ratio are required [32,33]. In this article, we summarize the thermodynamic features in the superconductive phase of dimer-Mott compounds from heat capacity measurements under pressure. We also discuss the results by comparing with the features observed in the chemical pressure effects produced by changing the anions (X) in the κ-(BEDT-TTF) 2X system.

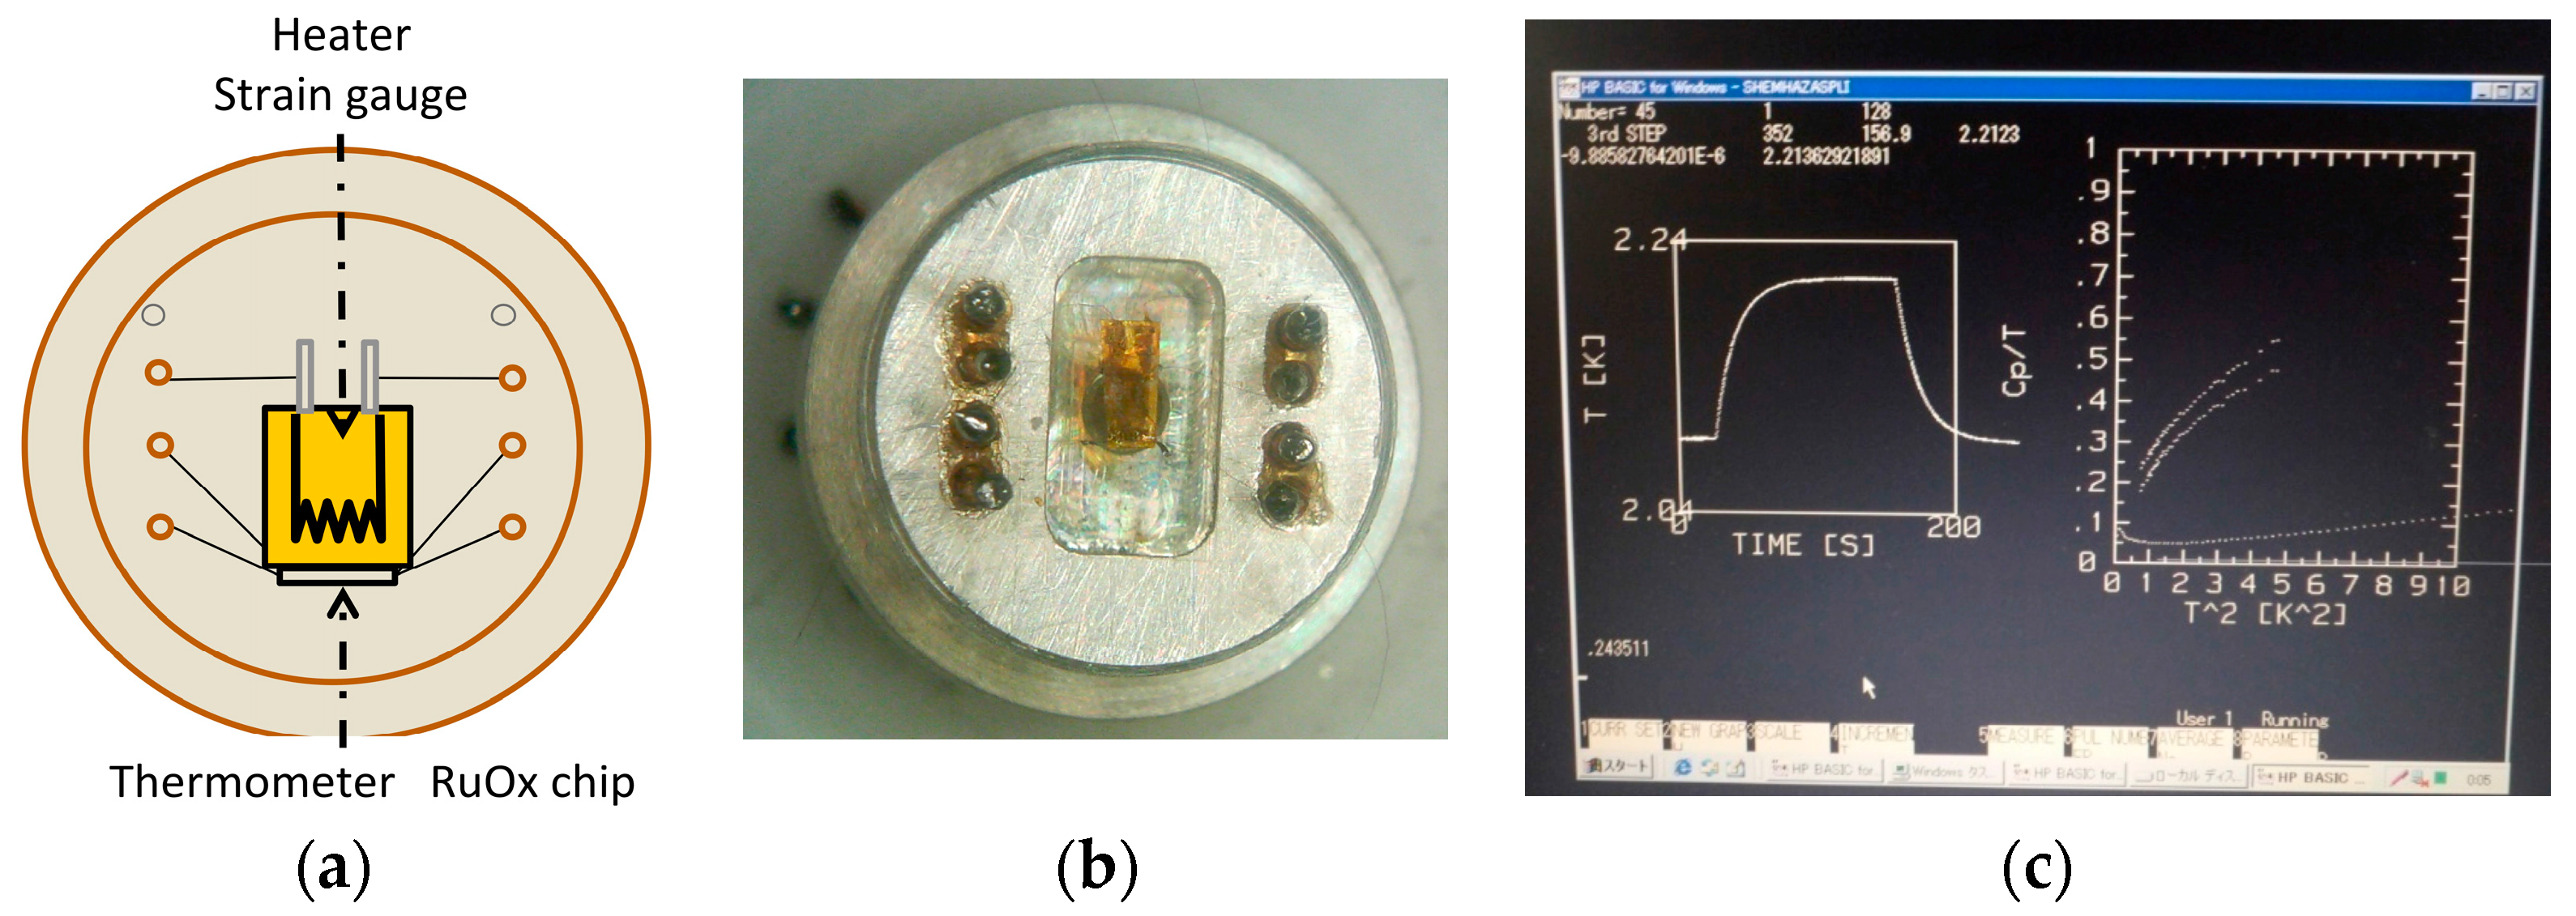
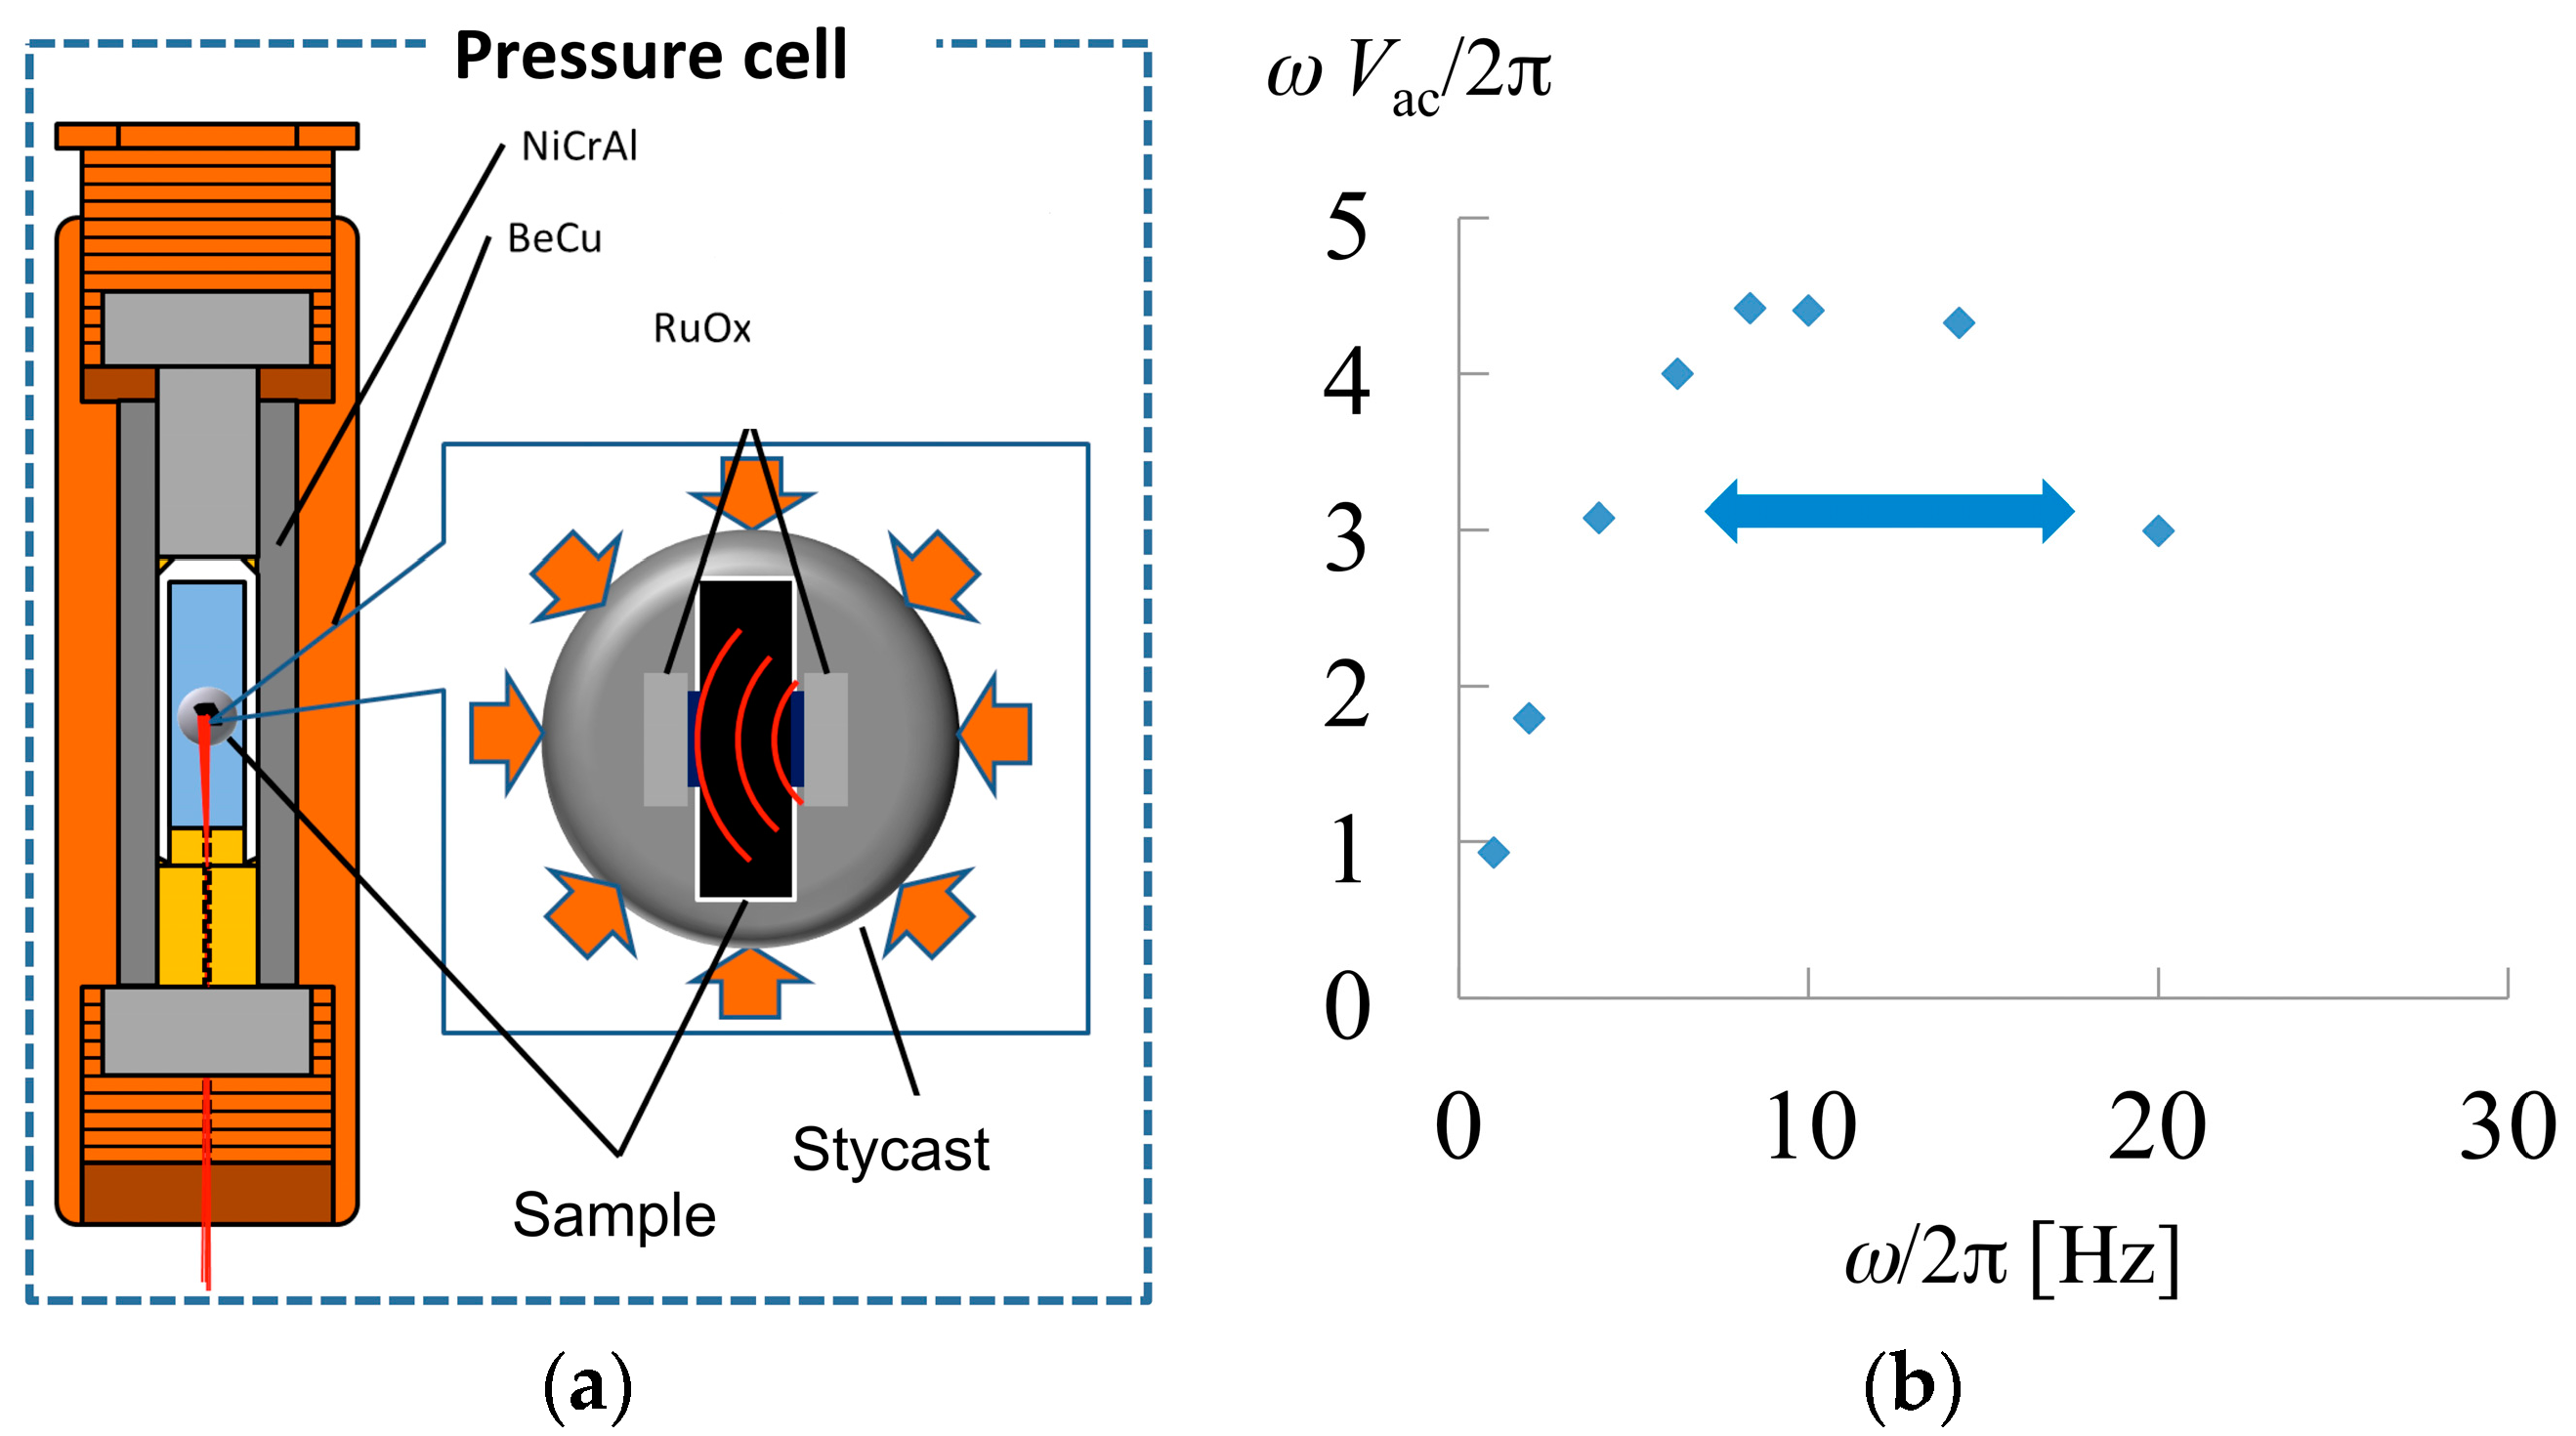
2. Calorimetry Apparatus to Measure the Heat Capacity under Pressure

To measure the heat capacity of single-crystalline samples of organic superconductors at ambient pressure, we used the thermal relaxation calorimetry technique developed by Bachmann et al. [34,35]. We constructed and modified our original apparatus—that aimed to measure the heat capacity of molecule-based compounds—to realize accurate measurements for 80 μg–1 mg single crystals. Figure 2 shows a schematic drawing and photograph of the sample cell. Developments of the apparatus focusing on the technique to measure single crystals are reported in the literature [36,37,38].
The application of external pressure reduces the inter-atomic or inter-molecular distance in crystal lattices, inducing various structural transformations due to molecular or atomic arrangements, dielectric, magnetic, and transport properties, which are dominated by the orbital overlap between neighboring atoms and molecules. It also induces an increase in bandwidth W, which directly affects the U/W ratio. To measure the heat capacity while varying the external pressure, both the temperature and magnetic fields are important to realize new functionalities and to understand the mechanism of pressure-induced phase transitions. For heat capacity measurements of molecular compounds under pressure, we used the ac calorimetry technique. The adiabatic technique and the relaxation technique for heat capacity measurements are quite difficult because they usually require a substantial amount of sample and semi-adiabatic conditions around the sample from the surroundings. Such conditions cannot be realized when the crystal and the thermometer are in direct contact with the pressure medium. Therefore, the ac technique [39], which separates the difference of the temperature relaxation rates inside the sample parts from that of the surroundings, is the best way to detect precise thermodynamic information, as suggested by Eicher and Gey [40]. The detection of temperature oscillations using the frequencies in the range between τext−1 < ω < τint−1, where τext and τint are the internal and external temperature relaxation rates, respectively, can give an accurate heat capacity of the sample parts.
We constructed an ac heat capacity measurement apparatus for single-crystalline samples of molecular compounds. Measurements are available over a wide temperature range from a low temperature of about 0.7 K up to about 20 K while reducing the sample amount to 200 μg–2 mg [41,42,43,44,45]. The construction details are reported elsewhere [33,41,42]. The adoption of extremely small chips as the thermometer and the accurate detection using the four-terminal method have worked well to achieve high-resolution detection for organic superconductors, providing heat capacity measurements in the low-temperature region. Figure 3 shows a schematic view of the apparatus where the sample part and pressure cell are set with CuBe and NiCrAl. We utilized a ruthenium oxide tiny chip sensor with a room temperature resistance of 102–4 Ω, dimensions of 0.6 × 0.3 mm2, and a thickness of 0.2 mm. We also used another small-sized chip sensor with a resistance of 1 kΩ at room temperature. The GE (General Electric) vanish confirms good contact between the sample and the sensor and the sample parts were also coated by a small amount of epoxy (Stycast 1266, 2850FT, and 2850GT etc.) before being sealed inside a Teflon capsule with a pressure medium (Daphne 7373 oil, Idemitsu). The sample cell was set in the CuBe piston cylinder and clamped using CuBe screws on both sides.
The temperature modulation excited by the ON/OFF current of the heater was detected by the thermometer using an ac resistance bridge. The modulation occurs more rapidly than the relation of heat to the surroundings expressed by text. Since the sensitivity of the ruthenium oxide chip increases in the low-temperature region, this technique is available even in the low-temperature region where thermocouples are not very sensitive. Furthermore, the ruthenium oxide chip sensor has a variable range hopping-type transport feature and can be utilized in extremely low-temperature regions with small magnet resistance.
The frequency dependence of the oscillation amplitude for typical organic crystals is shown in Figure 3b. Although this system is constructed for low-temperature experiments, the use of a tiny Pt chip thermometer and a Cernox thermometer make it possible to detect heat capacity measurements between 20 K and 300 K, as reported by Danda [45] and Konoike [46]. Danda et al. reported the Verwey transition of iron oxide (Fe3O4) in a higher temperature system [45]. The sharp peak due to magnetic and charge-ordering transition at 124 K is broadened by pressures up to 1 GPa without significantly changing the transition temperature. The most serious problem is to separate the background contribution since the extra contribution of the addenda, which consists of the chips, the lead wires, and the Stycast, is included.

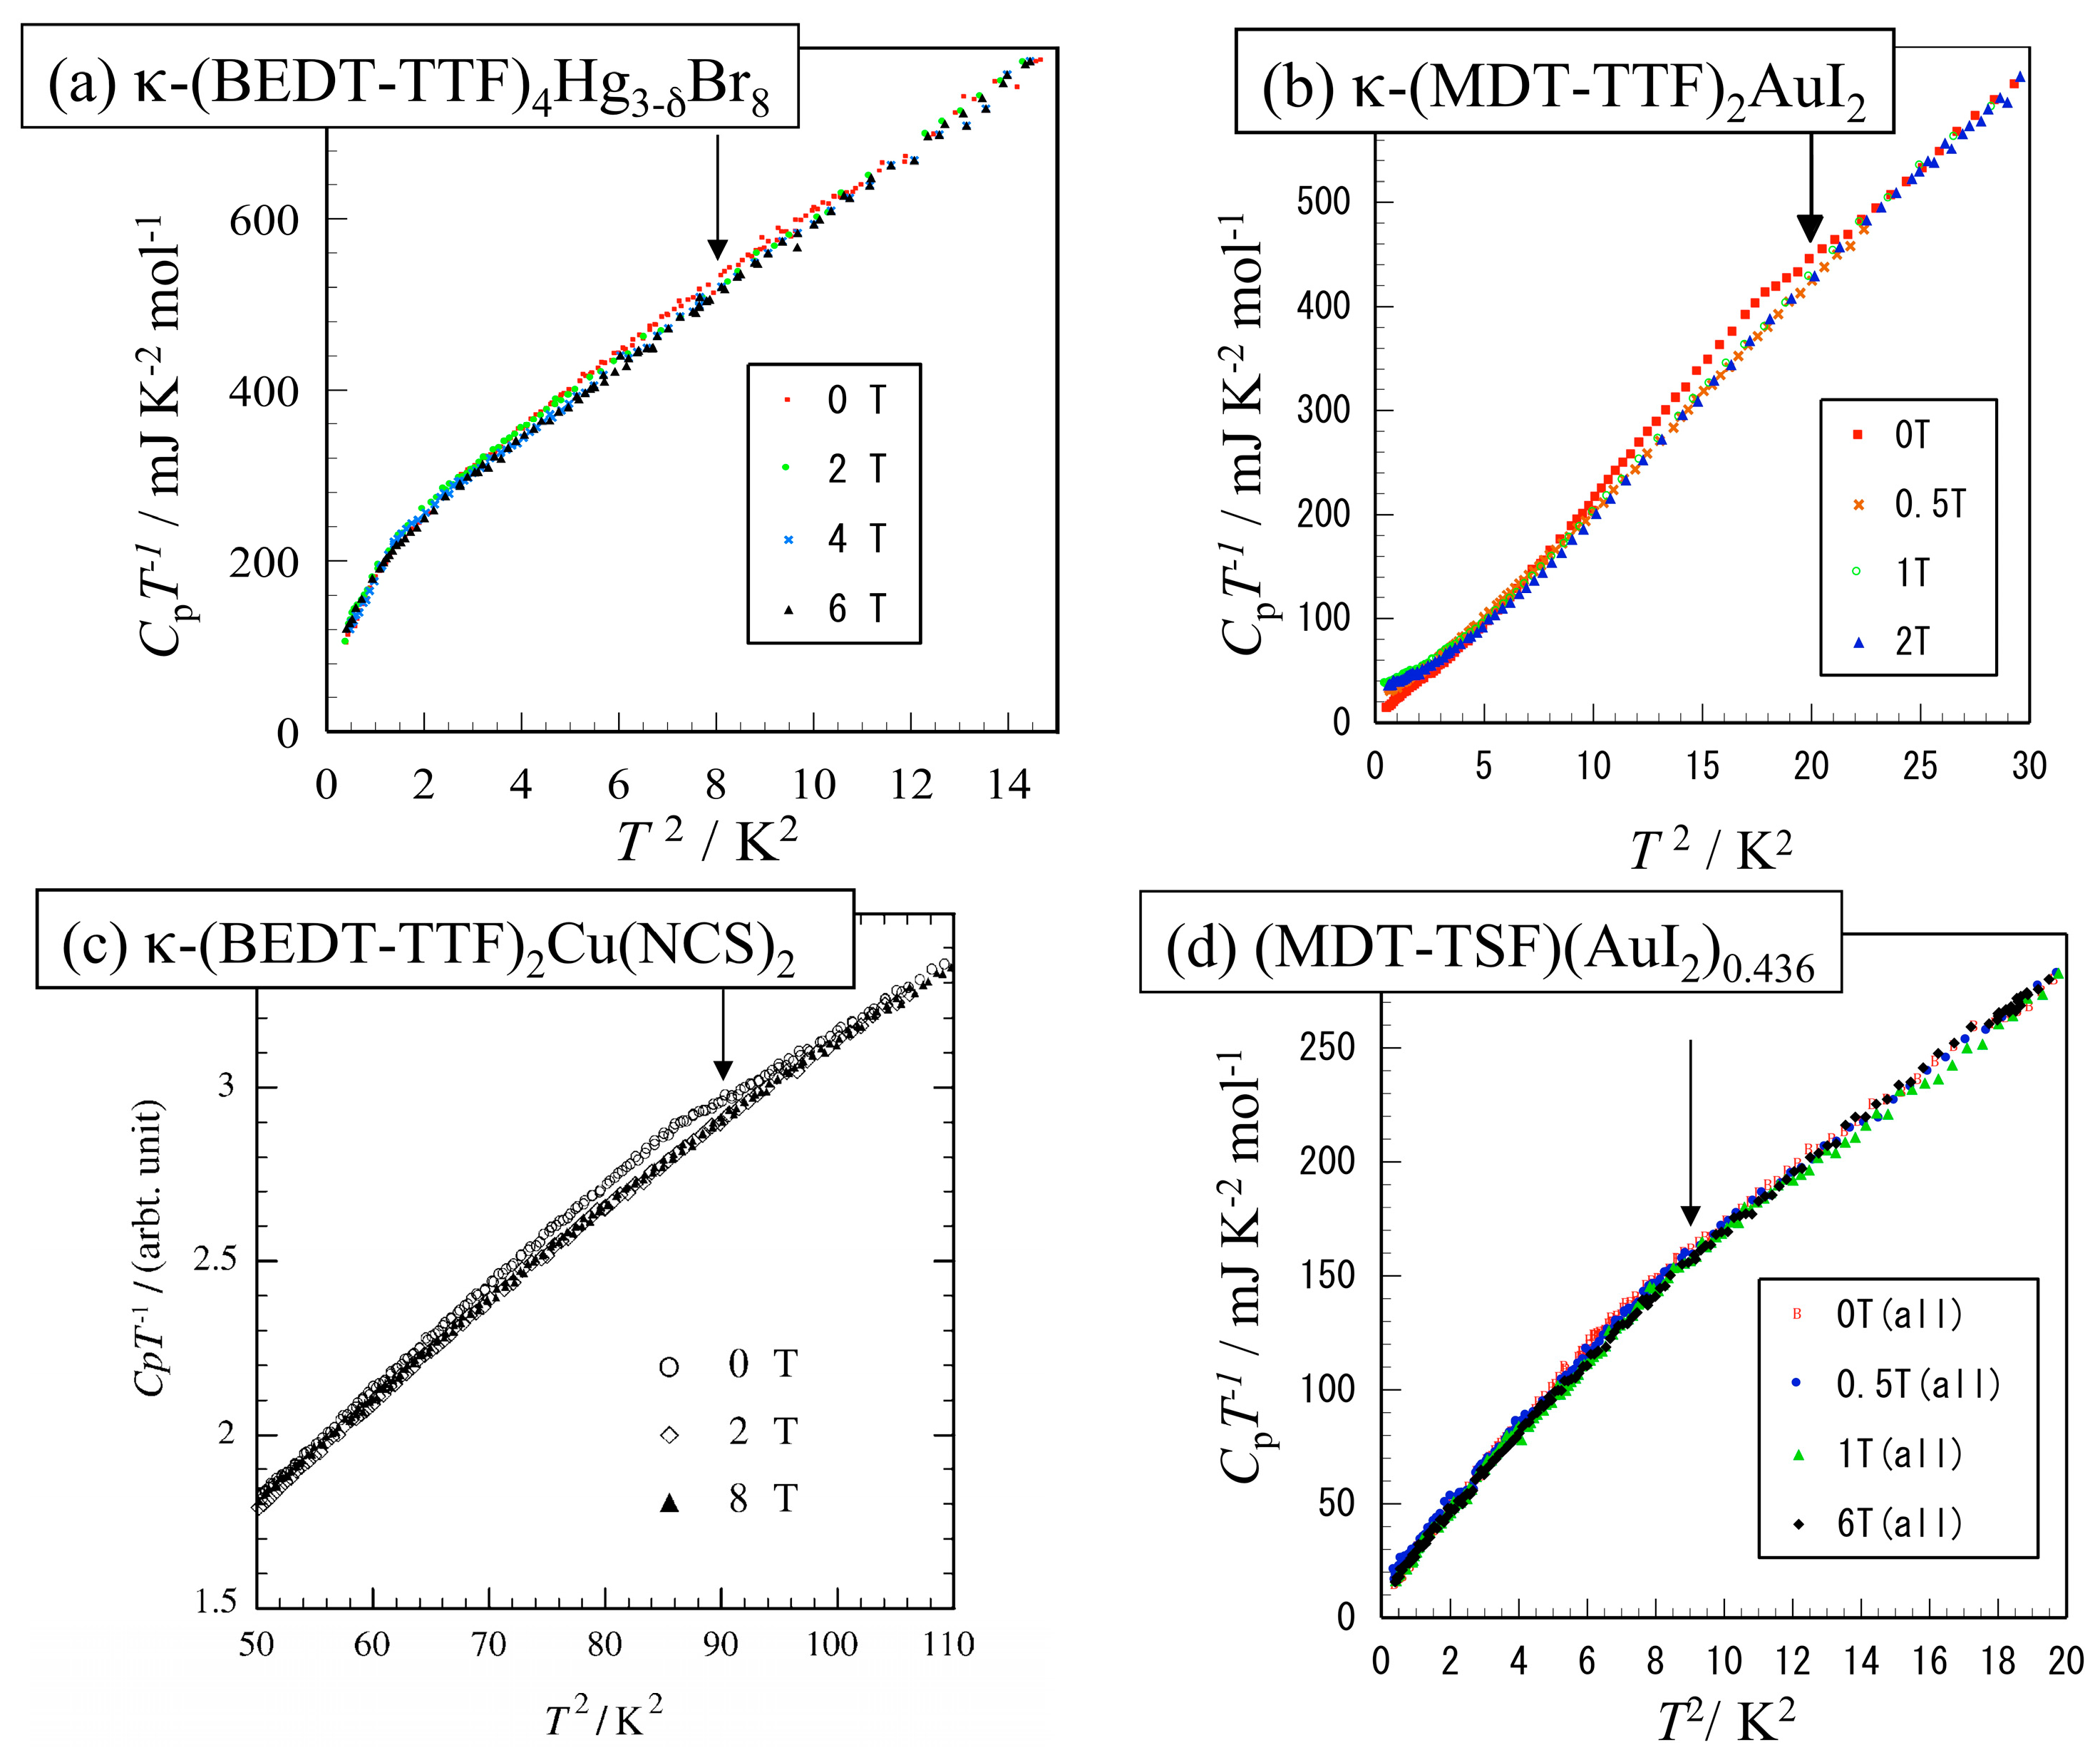
3. Heat Capacity of κ-(BEDT-TTF)2X under Pressure

In this section, we review the calorimetry results of dimer-Mott compounds under pressure. Figure 4 shows the temperature dependence of the heat capacities of four charge transfer complexes, including κ-(BEDT-TTF)2Cu(NCS)2, obtained by relaxation calorimetry. The details are reported in the published literature [47,48,49,50,51]. Compared with other compounds in the figure, κ-(BEDT-TTF)2Cu(NCS)2 exhibits a rather sharp peak as shown in Figure 4c [49,50]. The thermodynamics of this compound and κ-(BEDT-TTF)2Cu[N(CN)2]Br, which has a similar transition temperature, have already been thoroughly discussed. Several groups have analyzed the peak shape and the magnitude of the heat capacity jump at Tc for κ-(BEDT-TTF)2Cu(NCS)2 [49,50,52,53,54,55,56,57]. In the initial investigation stage of this material, the heat capacity jump is reported as evidence of the bulk nature of the superconductivity, as reported by Katsumoto et al. [52] and Andraka et al. [53]. Additionally, Graebner et al. [54] measured the ac heat capacity with an absolute precision around the peak and suggested, for the first time, a strong coupling nature with a larger condensation energy. More recently, Müller et al. [55] reported a detailed analysis of the peak shape. They showed the data over a wide temperature range to determine the α value of the coupling strength. The data are shown in Figure 4c where the magnitude of CpTc−1 ≃ 60 mJ K−2 mol−1 is consistent with the strong coupling picture in Refs [26,49,50,54,55,56]. A similar thermodynamic feature has also been reported for κ-(BEDT-TTF)2Cu[N(CN)2]2Br, which shows a stronger coupling peak shape [57].
To confirm the thermodynamic peak in the ac heat capacity data obtained by the high-pressure calorimetric system, we have analyzed the data at ambient pressure and compared them with the relaxation calorimetry data. Figure 5a shows the ac heat capacity measurement results at ambient pressure obtained using a high-pressure calorimeter as a CpT−1 vs. T2 plot [32]. A thermal anomaly is detected as a hump structure around 9 K in this plot, although there is a rather large background due to the addenda heat capacity in the pressure cell. This anomaly is associated with the superconductive transition since the peak temperature and the peak shape resemble the preceding data obtained by the thermal relaxation technique in Figure 4c. Upon applying magnetic fields almost parallel to the plane in the present pressure calorimetry set up, the anomaly is suppressed through comparative analyses of the magnetic field dependence, as already reported [32]. The data obtained up to 7 T has a constant shift of CpT−1 values at different magnetic fields (Figure 5a).
Usually, in quasi-2D superconductors, an increase in the magnetic field applied parallel to the plane drastically suppresses and broadens the thermal anomaly. To analyze the peak shape around Tc in detail, Figure 5b plots ΔCpT−1 as the electronic heat capacity around the transition temperature. Here, ΔCp is determined as the discrepancy of the heat capacity values in the 0-T and 7-T data assuming that the thermal anomaly due to superconductive transition is almost reduced in a magnetic field of 7 T. The analytic details were reported in Ref. [32]. The peak resembles the typical shape of the superconductive transition with a strong coupling feature. ΔCp at 2 T is also evaluated and plotted as the discrepancy from the 7-T data. A slight downward shift in the transition temperature and suppression of the magnitude of heat capacity jump are observed.
Figure 6a shows the temperature dependence of the ac heat capacity at 0.15 GPa and Figure 6b shows the result of the similar analysis as was performed for ambient pressure data in Figure 5b. The transition temperature is reduced to about 5–6 K, which is consistent with the results of the proceeding work [44]. Subtracting the 7-T data also gives the relative change of the electronic heat capacity contribution ΔCp for each field, which is shown in the ΔCpT−1 vs. T plot in Figure 6b. It is difficult to see a distinct peak structure even for the data of 0 T; however, the magnetic field seems to suppress the peak and the transition temperature systematically. We can mention that the peak shape broadens compared with that at ambient pressure. The suppression of the peak structure becomes more remarkable in the case of 0.30 GPa and 0.45 GPa. Since the sensitivity of the resistance sensor increases in the lower temperature region, small anomalies, if any exist, can be more easily detected in the lower Tc cases. In fact, several compounds with a magnetic or superconductive transition around 2–4 K have been detected in a high-pressure calorimeter [41,42].
To compare the relative change in the broadness and the magnitude of the heat capacity jump induced by the pressure in the same figure, Figure 7 plots the overall feature in the peak shape of ΔCpT−1 obtained at ambient pressure, 0.15 GPa, and 0.30 GPa, where the temperature in the horizontal axis is the relative temperature normalized by the transition temperature (Tc) of each pressure. A qualitative comparison of the peak shape for the superconductive transition indicates that the reduction in the transition temperature is accompanied by a systematic change in the peak structure. As Tc decreases due to the increase in pressure, the magnitude of the peak of ΔCpT−1 becomes smaller and the peak shape broadens gradually. This is explained by the continuous reduction in the coupling strength of the superconductivity in a dimer-Mott system. The sharp peak with a relatively high Tc means the coupling strength is strong and is almost as large as the condensation energy of the electron pairs. In contrast, broadening is considered to be the suppression of such pairing forces as the system becomes more metallic. κ-(BEDT-TTF)2Cu[N(CN)2]Br and κ-[(BEDT-TTF)1−x(BEDSe-TTF)x]2Cu[N(CN)2]Br compounds also show a broadening in the peak shape and a decrease in the heat capacity jump ΔCpT−1 as the transition temperature is suppressed. However, the latter may have some extra effects related to the frustration due to the increase in the triangularity in the molecular arrangement of the dimer units. We have also reported the suppression of the peak by pressure in κ-(BEDT-TTF)2Ag(CN)2H2O [44]. These features are consistent with κ-(BEDT-TTF)2Cu(NCS)2, as summarized in Figure 7.

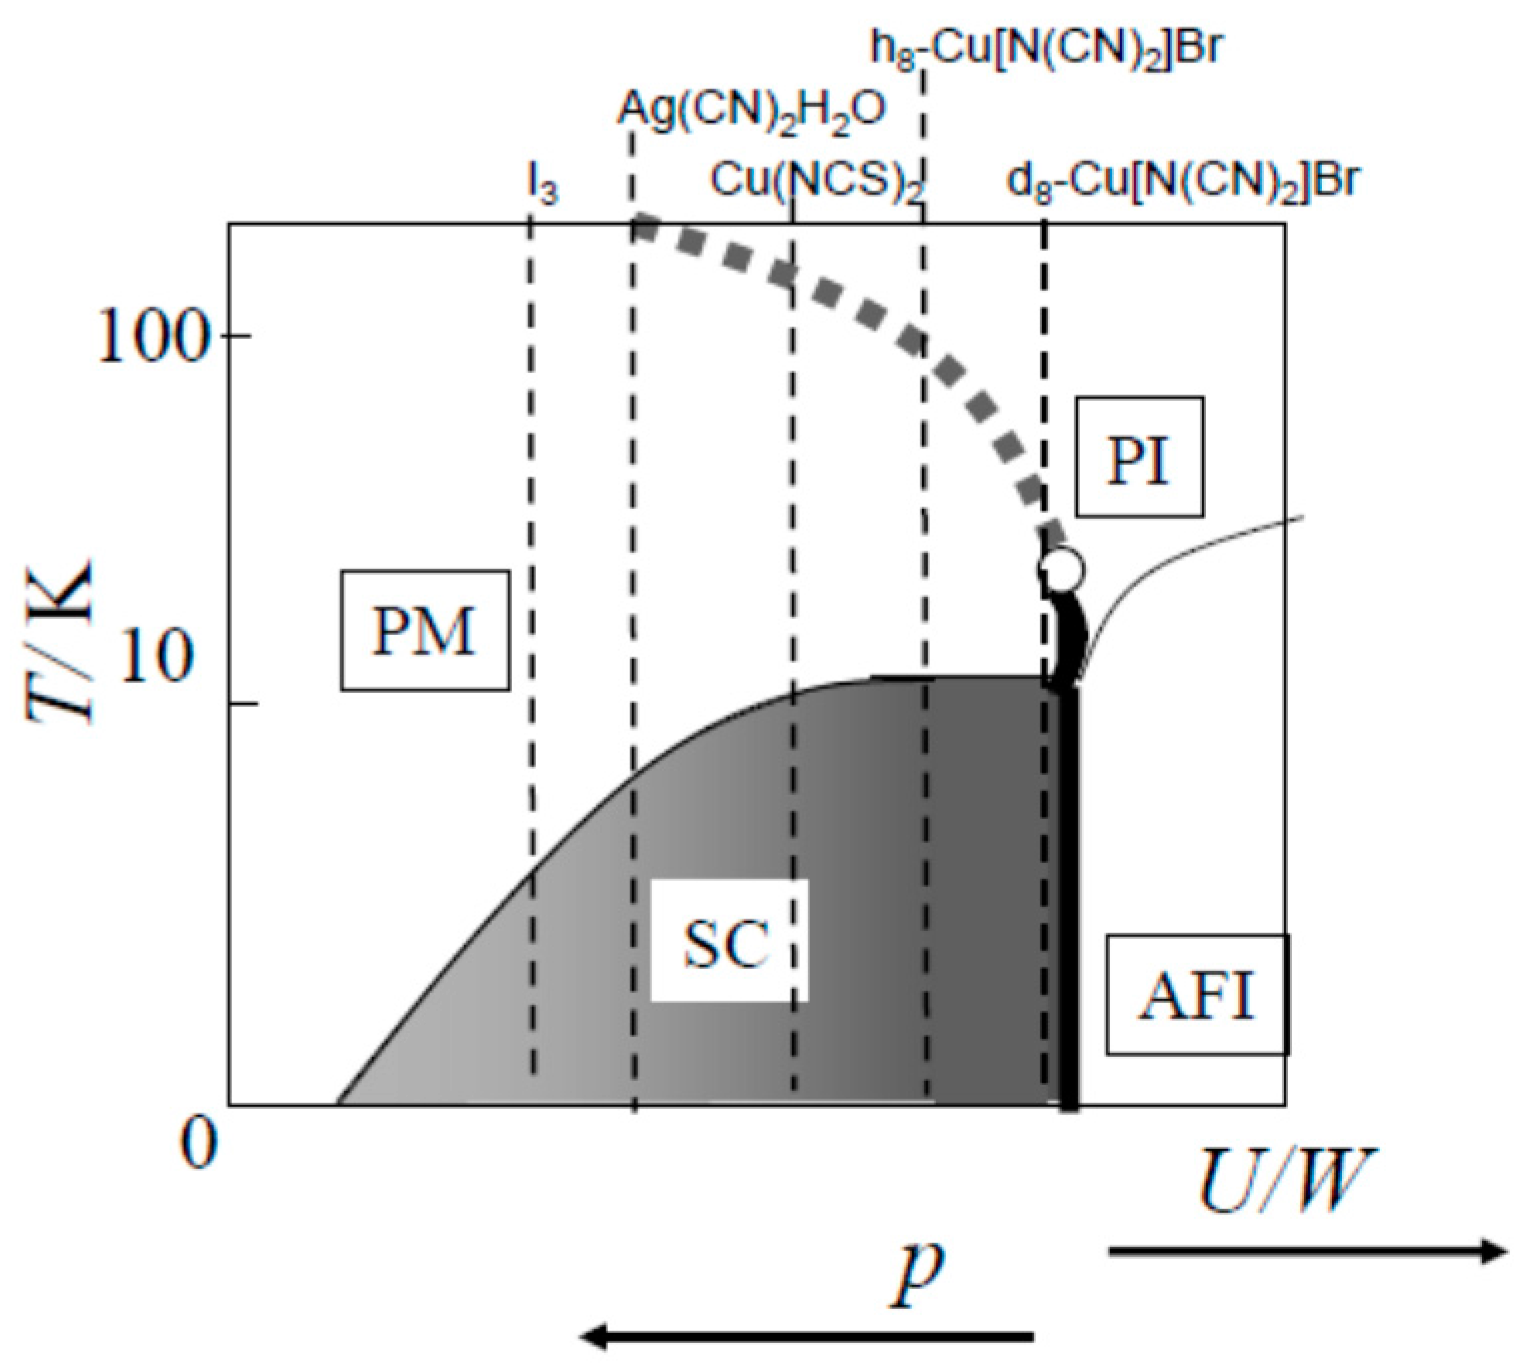
4. Chemical Pressure Effect on Dimer-Mott Organic Compounds

The systematic change in the peak shape in the κ-(BEDT-TTF)2Cu(NCS)2 and similar features observed in other κ-(BEDT-TTF)2X compounds under pressures can be compared with the chemical pressure effects of the dimer-Mott system induced by varying the counter-anions. It is well known that the counter-anion size of organic charge transfer complexes induces a kind of pressure effect in the molecular arrangement, causing systematic changes in the physical properties. According to transport and NMR studies of the dimer-Mott phase diagram, the external pressure effects in 10 K class compounds with X = Cu(NCS)2 and Cu[N(CN)2]Br are consistent with the chemical pressure effects. Similar to the case where the external pressure increases, counter-ions with smaller volumes change the features from a strong correlation system to a normal metallic system. Many thermodynamic studies by heat capacity measurements of several κ-type compounds with different counter-ions have been performed up to now [49,50,51,52,53,54,55,56,57,58,59,60]. As mentioned in the previous section, the strong coupling nature of κ-(BEDT-TTF)2Cu(NCS)2 has been observed in 10 K class superconductors (Figure 4c and Figure 8). The values of ΔCp/γTc of two typical compounds κ-(BEDT-TTF)2Cu(NCS)2 and κ-(BEDT-TTF)2Cu[N(CN)2]Br—which were obtained using the normal state heat capacities obtained under strong magnetic fields above Hc2 as the background heat capacity of exceed 2.0—are much larger than that of the BCS (Bardeen Cooper Schrieffer) weak coupling theory [54,55,57]. As compared with these higher Tc compounds, the heat capacity jump of middle-class (about 4–5 K) superconductors, such as κ-(BEDT-TTF)2Ag(CN)2H2O (Tc = 5 K) [58], gives a ΔCp/γTc value of 1.1. Although κ-(MDT-TTF)2AuI2 consists of a different asymmetric donor molecule, its Tc is 4.5 K [49] and it has a ΔCp/γTc value of 1.4. These values are within the weak coupling region.
The plot in Figure 8 shows the systematic change in the peak shape for several superconductive compounds with the κ-type structure using the scaled temperature of t = T/Tc for each compound. We also include the ΔCp/Tc data of mixed crystals of κ-[(BEDT-TTF)1−x(BEDSe-TTF)x]2Cu[N(CN)2]Br compounds with x = 0.10. A clear tendency is observed; 10 K class superconductors have a sharper peak with a large ΔCpT−1. This is typical for strong coupling systems, but 4–5 K class compounds have a smaller mean field type peak. The systematic change in the peak shape indicates a gradual crossover from a strong coupling region near the boundary to a weak coupling region in the superconductive phase, as shown schematically in Figure 8 (right) [32,33]. Although some exceptions exist, such as κ-(BEDT-TTF)2I3 being reported to have strong coupling features [59], the overall tendency seems to be consistent with the external pressure controlled effects. This feature is reasonably consistent with our observations of κ-(BEDT-TTF)2Cu(NCS)2 under pressure, as summarized in Figure 7.
The similar tendency observed between the data of the external and the chemical pressure-controlled experiments demonstrates that a crossover occurs inside the superconductive phase due to variations in the coupling strength of the superconductive electrons. A similar situation may occur in high Tc cuprates or heavy electron systems in which the quantum mechanical features produce a crossover in the ground state, giving complicated phase diagrams.
It is important to mention that although the peak shape of ΔCp/Tc varies with the decrease in U/W, the temperature dependence of the heat capacity in the low-temperature region gives a quadratic temperature-dependent term, as suggested by the nodal feature of the d-wave formation [60]. Figure 9a,b compares the temperature dependence of the low-temperature heat capacity of two κ-type compounds with a high Tc (10 K) class and a middle Tc class. The existence of the quadratic temperature dependence in the electronic heat capacity clearly shows the difference in the BCS characters, even though the peak shapes are quite different, as we discussed in Figure 8. Since the large lattice contribution in the heat capacity creates ambiguity in background subtraction in such organic systems, the recovery of the γ by magnetic fields of both compounds also shows an (H/Hc2)1/2-dependence characteristic of d-wave pairings. The change in the nodal direction, even in the same κ-type structure, has been suggested theoretically, depending on the balance of the transfer integral inside the dimer and the ratio between the transfer integrals in the rectangle and the diagonal directions of the superconductivity. It is emphasized, however, that the electron correlations still seem to be an important mechanism for realizing superconductivity in this system. The existence of the nodes is also consistent with other experiments, such as the thermal conductivity, NMR, and STM experiments [23,24,25,26].

5. Normal State Electronic Heat Capacity Coefficient γ and the Residual γ*

A quantitative comparison and the overall discussion of the coupling strength observed in the peak shape of the heat capacity and magnitude of the electronic heat capacity coefficient γ of the normal state should reveal a more profound understanding of the superconductive state of the dimer-Mott system. For this purpose, low-temperature heat capacity data should be discussed systematically throughout the superconductive phase. In this section, we survey the normal state γ and the residual γ* in the superconductive state observed from the data of the low-temperature heat capacity, which reflects the low energy excitations in the superconductive phase. We discuss the peculiar feature and stability of the superconductive states in terms of the competition between the stability of the Fermi liquid nature and the magnitude of the electron correlations. Since the ground state of the κ-(BEDT-TTF)2X compounds in question is superconductive with electron pairs, the heat capacity measurements with magnetic fields higher than Hc2 should be performed to evaluate the electron density of state of the Fermi surface. The electronic heat capacity coefficient obtained under a magnetic field is defined as the normal state γ and is proportional to the electron density of states DF) in the band theory.
To discuss the systematic changes of γ in the dimer-Mott-type superconductive phase, Figure 10b plots the γ values of several compounds with the conceptual phase diagram (Figure 10a). We use the values of the dimerized compounds of κ-(BEDT-TTF)2X and some other compounds also considered as dimer-based systems. The data are taken from Table 9 in Ref. [28] and the low-temperature heat capacity results reported in Refs. [42,59,60,61,62,63]. In this plot, we also included β-(BEDT-TTF)2I3 in a well-annealed case according to the proposed phase diagram in Refs. [11,14,15]. The two arrows show that the systematic tendency occurs in the superconductive phase. Complexes of partially deuterated BEDT-TTF molecules with X = Cu[N(CN)2]Br were used to systematically investigate the change in the normal state γ near the boundary region [62,63]. The normal state γ drastically decreases around the boundary despite the fact that Tc maintains a relatively high value around 10 K, indicating that the Mott boundary occurs as a first-order transition in the dimer-Mott system. The change in γ occurs in a region far away from the boundary, suggesting that the band-like feature reflecting in the electronic density of states systematically varies. In the discussion on this region, we include data of solid solution compounds of BEDT-TTF and BEDSe-TTF with X = Cu[N(CN)2]Br since light doping (less than 10%) of BEDSe-TTF tends to reduce the Tc by keeping the bulk superconductive feature [33]. The arrow on the left side of the figure clearly indicates that the γ values increase as the U/W ratio increases. This is considered as a kind of Brinkman–Rice enhancement. It predicts that the increase in the electron correlation of the parameter U/W leads to an increase in the density of states similar to that observed in correlated metallic systems with a distinct band structure [63,64,65]. The normal state γ value gives a maximum around κ-(BEDT-TTF)2Cu(NCS)2, which shows a stable bulk superconductivity with a transition temperature of 9.1 K. In this compound, the cooling rate does not affect the transition temperature located close to the boundary, which differs from the case of X = Cu[N(CN)2]Br (both deuterated and non-deuterated cases).
The Brinkman–Rice-type enhancement is due to the increase in the enhanced correlation U in the region where the Fermi liquid picture holds. The increase in the correlation influences the effective mass of the normal electrons within the band picture and, therefore, it leads to an increase in γ values. The compounds in the left arrow region are considered to have a Fermi liquid character with a well-defined electron band. However, increasing U further leads the system to an anomalous metallic state where the picture with a gap-like structure between the upper and the lower Hubbard bands become dominant if the Mott boundary is approached. The relatively smaller normal state γ value despite the higher transition temperature and the stronger coupling character in the superconductivity in κ-(BEDT-TTF)2Cu[(N(CN)2]Br than Cu(NCS)2 can be explained from this perspective. The decrease in γ in the partially deuterated compound denoted by d[1,1]-Cu[N(CN)2]Br is considered as evidence of further opening of the Hubbard gap, leading to a decreased electron density of state as a band picture. On the other hand, the smaller γ values in the middle-class Tc compounds of κ-(BEDT-TTF)2Ag(CN)2H2O and κ-(MDT-TTF)2AuI2 located in the band region can be explained in the frame of the Brinkman–Rice picture. Recently, Imajo et al. studied λ-(BETS)2GaCl4, which is also classified as a dimer-Mott-type superconductor and has a Tc of about 5.2 K. It shows a similar normal state γ = 22.9 mJK−2mol−1 [66]. This result is consistent with this picture. We also include the γ values of κ-(BEDT-TTF)2I3 [59] and β-(BEDT-TTF)2X (X = I3, AuI2) [67,68], which are also consistent with the above feature. Not only is the coupling strength reflected in the heat capacity jump but the feature of the normal state γ value also suggests that the electron correlations become stronger by approaching the boundary and are important for stabilizing the bulk superconductivity. When the transition temperature decreases with a decrease in the U/W ratio, the Mott–Hubbard picture is gradually suppressed and the Fermi liquid nature is enhanced. The change from strong coupling to weak coupling observed by pressure calorimetry is related to this crossover from the electron correlation region to the band-like region.
The crossover in the coupling nature originating from the magnitude of the electron correlation is also reflected in the low-temperature residual γ* in the superconductive state (Figure 10c). The superconductivity of the dimer-Mott system is a d-wave with a nodal gap with four-fold symmetry around the two-dimensional Fermi surface, as detected by the magnetic angle-resolved heat capacity measurements. In such nodal gap superconductors, normal electrons inevitably remain due to the residual disorder in the crystals even without an external magnetic field. The effects of disorder and impurities can induce normal electrons around the nodal position with a very small gap. Figure 10c also shows the data for γ*. As previously reported, the γ* value shows a sample dependence but the value is about several percent of the normal state γ and less than 1–2 mJK−2mol−1 in the cases of κ-(BEDT-TTF)2Cu[N(CN)2]Br and κ-(BEDT-TTF)2Cu(NCS)2. However, those with lower Tc compounds tend to have larger γ* values despite the heat capacity giving a distinct peak at the transition. In the cases of κ-(BEDT-TTF)2Ag(CN)2H2O and κ-(MDT-TTF)2AuI2, the reported γ* values are 5.1 mJK−2mol−1 and 5.9 mJK−2mol−1, respectively [33,49]. A more recent experiment on κ-(BEDT-TTF)2Ag(CN)2H2O claims a smaller γ* value (less than 2 mJK−2mol−1) using the fitting of the d-wave model [60]. This seems to be larger than those of κ-(BEDT-TTF)2Cu[N(CN)2]Br, and κ-(BEDT-TTF)2Cu(NCS)2. λ-(BETS)2GaCl4 also gives a relatively large value of 3.2 mJK−2mol−1 [66].
Although the bulk nature of the superconductivity is retained in these compounds, pair breaking due to suppression of the electron correlation and the increase in the stability of Fermi liquid nature occurs in the superconductive phase. The competition of the band picture, which just enhances the electron density of state and the Mott–Hubbard picture, should exist in the superconductive phase; however, a gradual crossover occurs inside the superconductive phase. These characters can be considered to have similar physics in the over-doped region of high Tc cuprates. The heat capacity peak around the transition becomes much broader and the bulk nature of the superconductivity is suppressed in the over-doped region due to the Fermi liquid character, which stabilizes the band nature. This character is in contrast with the under-doped and optimal-doped regions [69]. Considering the overall thermodynamic features of dimer-Mott systems, the mechanism to produce a d-wave type superconductor is quite reasonably related to the electron correlations U, and the superconductivity is stabilized in the anomalous metallic region near the Mott boundary. Here, we discussed mainly κ-type compounds with a dimer lattice. More detailed thermodynamic information for other types of dimer-Mott structures with β-, β’-, and λ-type compounds is necessary in the future.

6. Conclusions

We systematically discuss the thermodynamic parameters to quantitatively evaluate the superconductive characters of the dimer-Mott system, which appear as tuning of the U/W ratio. The calorimetric information of κ-(BEDT-TTF)2Cu(NCS)2 and other counter-anion compounds reveals that the magnitude of the coupling strength is suppressed from the high Tc region to lower Tc region. The chemical pressures also confirm the changes in the peak shape of this thermal anomaly. A comparative discussion of the electronic heat capacity coefficients in the low-temperature heat capacity in both the superconductive state at 0 T and the normal state demonstrates that a crossover from the band character region to the strong electron correlation region exists in the superconductive phase. Such a crossover may support the unconventional nature of the superconductivity in dimer-Mott superconductors since the superconducting character near the strong correlation region provides stability compared with the lower Tc region where the band character becomes dominant. This feature resembles cuprate superconductors in which the electron correlations and band character compete with each other, yielding complicated electronic features in the optimal doping region. More systematic thermodynamic experiments with a parameter of pressure are required to further investigate the system.

Acknowledgments

This work is partly supported by CREST, JST Program in the area of “Establishment of Molecular Technology towards the Creation of New Functions”.

Author Contributions

Yasuhiro Nakazawa conceived and designed the experiments; Hiroki Akutsu performed crystal syntheses and structure analyses; Shusaku Imajo, Yuki Matsumura, and Satoshi Yamashita performed the experiments and analyzed the data.

Conflicts of Interest

The authors declare no conflict of interests.

References

  1. Ishiguro, T.; Yamaji, K.; Saito, G. Organic Superconductors; Springer: Heidelberg, Germany, 1998; pp. 1–245. [Google Scholar]
  2. Williams, J.M.; Ferraro, J.R.; Thorn, R.J.; Carlson, K.D.; Geiser, U.; Wang, H.-H.; Kini, A.M.; Whangbo, M.-H. Organic Superconductors; Prentice-Hall, Inc.: Upper Saddle River, NJ, USA, 1992; pp. 65–179. [Google Scholar]
  3. Lebet, A. The Physics of Organic Superconductors and Conductors; Springer: Berlin, Germany, 2008; pp. 1–704. [Google Scholar]
  4. Uji, S.; Mori, T.; Takahashi, T. Focus on Organic Conductors. Sci. Technol. Adv. Mater. 2009, 10, 020301. [Google Scholar] [CrossRef] [PubMed]
  5. Haddon, R.C.; Hebard, A.F.; Rosseinsky, M.J.; Murphy, D.W. Conducting films of C60 and C70 by alkali-metal doping. Nature 1991, 350, 320–322. [Google Scholar] [CrossRef]
  6. Palstra, T.T.M.; Zhou, O.; Iwasa, Y.; Sulewski, P.E.; Flemming, R.M.; Zegarski, B.R. Superconductivity at 40K in cesium doped C60. Solid State Commun. 1995, 93, 327–330. [Google Scholar] [CrossRef]
  7. Greene, R.L.; Street, G.B.; Suter, L.J. Superconductivity in Polysulfur Nitride (SN)x. Phys. Rev. Lett. 1975, 34, 577–579. [Google Scholar] [CrossRef]
  8. Kubozono, Y.; Mitamura, H.; Lee, X.; He, X.; Yamanari, Y.; Takahashi, Y.; Suzuki, Y.; Kaji, Y.; Eguchi, R.; Akaike, K.; et al. Metal-intercalated aromatic hydrocarbons: A new class of carbon-based superconductors. Phys. Chem. Chem. Phys. 2011, 13, 16476–16493. [Google Scholar] [CrossRef] [PubMed]
  9. Kagoshima, S.; Kato, R.; Fukuyama, H.; Seo, H.; Kino, H. Interplay of Structural and Electronic Properties. In Advances in Synthetic Metals Twenty Years of Progress in Science and Technology; Chapter 4; Elsevier: Lausanne, Switzerland, 1999; pp. 262–316. [Google Scholar]
  10. Mori, H. Materials Viewpoint of Organic Superconductors. J. Phys. Soc. Jpn. 2006, 75, 051003. [Google Scholar] [CrossRef]
  11. Kanoda, K. Metal-Insulator Transition in κ-(ET)2X and (DCNQI)2M: Two Contrasting Manifestation of Electron Correlation. J. Phys. Soc. Jpn. 2006, 75, 051007. [Google Scholar] [CrossRef]
  12. Kato, R. Development of π-Electron Systems Based on [M(dmit)2] (M = Ni and Pd; dmit: 1,3-dithiole-2-thione-4,5-dithiolate) Anion Radicals. Bull. Chem. Soc. Jpn. 2014, 87, 355–374. [Google Scholar] [CrossRef]
  13. Kino, H.; Fukuyama, H. Phase Diagram of Two-Dimensional Organic Conductors: (BEDT-TTF)2X. J. Phys. Soc. Jpn. 1996, 65, 2158–2169. [Google Scholar] [CrossRef]
  14. Kanoda, K. Recent progress in NMR studies on organic conductors. Hyperfine Interact. 1997, 104, 235–249. [Google Scholar] [CrossRef]
  15. Kanoda, K. Electron correlation, metal-insulator transition and superconductivity in quasi-2D organic systems, (ET)2X. Phys. C Superconduct. 1997, 287, 299–302. [Google Scholar] [CrossRef]
  16. Kobayashi, H.; Cui, H.; Kobayashi, A. Organic metals and superconductors based on BETS (BETS = bis(ethylenedithio)tetraselenafulvalene). Chem. Rev. 2004, 104, 5265–5288. [Google Scholar] [CrossRef] [PubMed]
  17. Fujiwara, H.; Kobayashi, H.; Fujiwara, E.; Kobayashi, A. An Indication of Magnetic-Field-Induced Superconductivity in a Bifunctional Layered Organic Conductor, κ-(BETS)2FeBr4. J. Am. Chem. Soc. 2002, 124, 6816–6817. [Google Scholar] [CrossRef] [PubMed]
  18. Kagawa, F.; Miyagawa, K.; Kanoda, K. Unconventional critical behaviour in a quasi-two-dimensional organic conductor. Nature 2005, 436, 534–537. [Google Scholar] [CrossRef] [PubMed]
  19. Gati, E.; Garst, M.; Manna, R.S.; Tutsch, U.; Wolf, B.; Bartosch, L.; Schubert, H.; Sasaki, T.; Schlueter, J.A.; Lang, M. Breakdown of Hooke’s law of elasticity at the Mott critical endpoint in an organic conductor. Sci. Adv. 2016, 2, e1601646. [Google Scholar] [CrossRef] [PubMed]
  20. Matsumura, Y.; Imajo, S.; Yamashita, S.; Akutsu, H.; Nakazawa, Y. Thermodynamic Investigation by Heat Capacity Measurements of κ-type Dimer-Mott Organic Compounds with Chemical Pressure Tuning. Int. J. Mod. Phys. B 2018, 32, 1840024. [Google Scholar] [CrossRef]
  21. Mori, H.; Tanaka, S.; Mori, T. Systematic study of the electronic state in θ-type BEDT-TTF organic conductors by changing the electronic correlation. Phys. Rev. B 1998, 57, 12023–12029. [Google Scholar] [CrossRef]
  22. McKenzie, R.H.; Merino, J.; Marston, J.B.; Sushkov, O.P. Charge ordering and antiferromagnetic exchange in layered molecular crystals of the θ type. Phys. Rev. B 2001, 64, 085109. [Google Scholar] [CrossRef]
  23. Miyagawa, K.; Kanoda, K.; Kawamoto, A. NMR Studies on Two-Dimensional Molecular Conductors and Superconductors: Mott Transition in κ-(BEDT-TTF)2X. Chem. Rev. 2004, 104, 5635–5654. [Google Scholar] [CrossRef] [PubMed]
  24. Arai, T.; Ichimura, K.; Nomura, K.; Takasaki, S.; Yamada, J.; Nakatsuji, S.; Anzai, H. Tunneling spectroscopy on the organic superconductor κ-(BEDT-TTF)2Cu(NCS)2 using STM. Phys. Rev. B 2001, 63, 104518. [Google Scholar] [CrossRef]
  25. Nakazawa, Y.; Kanoda, K. Low-temperature specific heat of κ-(BEDT-TTF)2Cu[N(CN)2]Br in the superconducting state. Phys. Rev. B 1997, 55, R8670–R8673. [Google Scholar] [CrossRef]
  26. Taylor, O.J.; Carrington, A.; Schlueter, J.A. Specific-Heat Measurements of the Gap Structure of the Organic Superconductors κ-(ET)2Cu[N(CN)2]Br and κ-(ET)2Cu(NCS)2. Phys. Rev. Lett. 2007, 99, 057001. [Google Scholar] [CrossRef] [PubMed]
  27. Girlando, A.; Masino, M.; Brillante, A.; Valle, R.G.D.; Venuti, E. BEDT-TTF organic superconductors: The role of phonons. Phys. Rev. B 2002, 66, 100507. [Google Scholar] [CrossRef]
  28. Sorai, M.; Nakazawa, Y.; Nakano, M.; Miyazaki, Y. Calorimetric Investigation of Phase Transitions Occurring in Molecule-Based Magnets. Chem. Rev. 2013, 113, PR41-122. [Google Scholar] [CrossRef] [PubMed]
  29. Gopal, E.S.R. Specific Heats at Low Temperature; Heywood Books: London, UK, 1966. [Google Scholar]
  30. Wosnitza, J. Quasi-Two-Dimensional Organic Superconductors. J. Low Temp. Phys. 2007, 146, 641–667. [Google Scholar] [CrossRef]
  31. Wosnitza, J. Superconductivity in Layered Organic Metals. Crystals 2012, 2, 248–265. [Google Scholar] [CrossRef]
  32. Muraoka, Y.; Imajo, S.; Yamashita, S.; Akutsu, H.; Nakazawa, Y. Thermal Anomaly around the Superconductive Transition of κ-(BEDT-TTF)2Cu(NCS)2 with External Pressure and Magnetic Field Control. J. Therm. Anal. Calorim. 2016, 123, 1891–1897. [Google Scholar] [CrossRef]
  33. Nakazawa, Y.; Yoshimoto, R.; Fukuoka, S.; Yamashita, S. Investigation on Electronic States of Molecule-Based Compounds by High-Pressure AC Calorimetry. Curr. Inorg. Chem. 2014, 4, 122–134. [Google Scholar] [CrossRef]
  34. Bachmann, R.; DiSalvo, F.J., Jr.; Geballe, T.H.; Greene, R.L.; Howard, R.E.; King, C.N.; Kirsch, H.C.; Lee, K.N.; Schwall, R.E.; Thomas, H.-U.; et al. Heat Capacity Measurements on Small Samples at Low Temperatures. Rev. Sci. Instrum. 1972, 43, 205–214. [Google Scholar] [CrossRef]
  35. Stewart, G.R. Measurement of low-temperature specific heat. Rev. Sci. Instrum. 1983, 54, 1–11. [Google Scholar] [CrossRef]
  36. Sorai, M. Comprehensive Handbook of Calorimetry and Thermal Analysis; Wiley: New York, NY, USA, 2004. [Google Scholar]
  37. Imajo, S.; Fukuoka, S.; Yamashita, S.; Nakazawa, Y. Construction of Relaxation Calorimetry for 101–2 Micro-gram Samples and Heat Capacity Measurements of Organic Complexes. J. Therm. Anal. Calorim. 2016, 123, 1871–1876. [Google Scholar] [CrossRef]
  38. Fukuoka, S.; Horie, Y.; Yamashita, S.; Nakazawa, Y. Development of Heat Capacity Measurement System for Single Crystals of Molecule-Based Compounds. J. Therm. Anal. Calorim. 2013, 113, 1303–1308. [Google Scholar] [CrossRef]
  39. Sullivan, P.F.; Seidel, G. Steady-State, ac-Temperature Calorimetry. Phys. Rev. 1968, 173, 679–685. [Google Scholar] [CrossRef]
  40. Eichler, A.; Gey, W. Method for the determination of the specific heat of metals at low temperatures under high pressures. Rev. Sci. Instrum. 1979, 50, 1445–1452. [Google Scholar] [CrossRef] [PubMed]
  41. Kubota, O.; Nakazawa, Y. Construction of a low-temperature thermodynamic measurement system. Rev. Sci. Instrum. 2008, 79, 053901. [Google Scholar] [CrossRef] [PubMed]
  42. Kubota, O.; Fukuoka, S.; Nakazawa, Y.; Nakata, K.; Yamashita, S.; Miyasaka, H. Thermodynamic Investigation of Coordination-Networked Systems of [Mn4] Single-Molecule Magnets under Pressure. J. Phys. Condens. Matter 2010, 22, 026007. [Google Scholar] [CrossRef] [PubMed]
  43. Tokoro, N.; Kubota, O.; Yamashita, S.; Kawamoto, A.; Nakazawa, Y. Thermodynamic Study of κ-(BEDT-TTF)2Ag(CN)2H2O under Pressures and with Magnetic Fields. J. Phys. Conf. Ser. 2008, 132, 012010. [Google Scholar] [CrossRef]
  44. Tokoro, N.; Fukuoka, S.; Kubota, O.; Nakazawa, Y. Low-temperature heat capacity measurements of κ-type organic superconductors under pressure. Phys. B Condens. Matter 2010, 405, S273–S276. [Google Scholar] [CrossRef]
  45. Danda, M.; Muraoka, Y.; Yamamoto, T.; Nakazawa, Y. High-Pressure AC Calorimetry System Using Pt Chip Thermometer. Netsu Sokutei 2012, W39, 29–32. [Google Scholar]
  46. Konoike, T.; Uchida, K.; Osada, T. Specific Heat of the Multilayered Massless Dirac Fermion System. J. Phys. Soc. Jpn. 2013, 81, 043601. [Google Scholar] [CrossRef]
  47. Naito, A.; Nakazawa, Y.; Saito, K.; Taniguchi, H.; Kanoda, K.; Sorai, M. Anomalous enhancement of electronic heat capacity in the organic conductors κ-(BEDT-TTF)4Hg3−δX8 (X = Br, Cl). Phys. Rev. B 2005, 71, 054514. [Google Scholar] [CrossRef]
  48. Yamashita, S.; Naito, A.; Nakazawa, Y.; Saito, K.; Taniguchi, H.; Kanoda, K.; Oguni, M. Drastic cooling rate dependence of thermal anomaly associated with the superconducting transition in κ-(BEDT-TTF)4Hg2.89Br8. J. Therm. Anal. Calorim. 2005, 81, 591–594. [Google Scholar] [CrossRef]
  49. Nakazawa, Y.; Yamashita, S. Thermodynamic Properties of κ-(BEDT-TTF)2X Salts: Electron Correlations and Superconductivity. Crystals 2012, 2, 741–761. [Google Scholar] [CrossRef]
  50. Yamashita, S.; Ishikawa, T.; Fujisaki, T.; Naito, A.; Nakazawa, Y.; Oguni, M. Thermodynamic behavior of the 10 K class organic superconductor κ-(BEDT-TTF)2Cu(NCS)2 studied by relaxation calorimetry. Thermochim. Acta 2005, 431, 123–126. [Google Scholar] [CrossRef]
  51. Ishikawa, T.; Nakazawa, Y.; Ymashita, S.; Oguni, M.; Saito, K.; Takimiya, K.; Otsubo, T. Thermodynamic Study of an Incommensurate Organic Superconductor. (MDT-TSF)(AuI2)0.436. J. Phys. Soc. Jpn. 2006, 75, 074606. [Google Scholar] [CrossRef]
  52. Katsumoto, S.; Kobayashi, S.; Urayama, H.; Yamochi, H.; Saito, G. Low-Temperature Specific Heat of Organic Superconductor κ-(BEDT-TTF)2Cu(NCS)2. J. Phys. Soc. Jpn. 1988, 57, 3672–3673. [Google Scholar] [CrossRef]
  53. Andraka, B.; Kim, J.S.; Stewart, G.R.; Calson, K.D.; Wang, H.H.; Williams, J.M. Specific heat in high magnetic field of κ-di[bis(ethylenedithio)tetrathiafulvalene]-di(thiocyano)cuprate [κ-(ET)2Cu(NCS)2]: Evidence for strong-coupling superconductivity. Phys. Rev. B 1989, 40, 11345–11347. [Google Scholar] [CrossRef]
  54. Graebner, J.E.; Haddon, R.C.; Chichester, S.V.; Glarum, S.H. Specific heat of superconducting κ-(BEDT-TTF)2Cu(NCS)2 near Tc [where BEDT-TTF is bis(ethylenedithio)tetrathiafulvalene]. Phys. Rev. B 1990, 41, 4808–4810. [Google Scholar] [CrossRef]
  55. Müller, J.; Lang, M.; Helfrich, R.; Steglich, F.; Sasaki, T. High-resolution ac-calorimetry studies of the quasi-two-dimensional organic superconductor κ-(BEDT-TTF)2Cu(NCS)2. Phys. Rev. B 2002, 65, 140509. [Google Scholar] [CrossRef]
  56. Lortz, R.; Wang, Y.; Demuer, A.; Böttger, P.H.M.; Bergk, B.; Zwicknagl, G.; Nakazawa, Y.; Wosnitza, J. Calorimetric Evidence for a Fulde-Ferrell-Larkin-Ovchinnikov Superconducting State in the Layered Organic Superconductor κ-(BEDT-TTF)2Cu(NCS)2. Phys. Rev. Lett. 2007, 99, 187002. [Google Scholar] [CrossRef] [PubMed]
  57. Elsinger, H.; Wosnizta, J.; Wanka, S.; Hagel, J.; Schweitzer, D.; Strunz, W. κ-(BEDT-TTF)2Cu[N(CN)2]Br: A Fully Gapped Strong-Coupling Superconductor. Phys. Rev. Lett. 2000, 84, 6098–6101. [Google Scholar] [CrossRef] [PubMed]
  58. Ishikawa, T.; Yamashita, S.; Nakazawa, Y.; Kawamoto, A.; Oguni, M. Calorimetric study of molecular superconductor κ-(BEDT-TTF)2Ag(CN)2H2O which contains water in the anion layers. J. Therm. Anal. Calorim. 2008, 92, 435–438. [Google Scholar] [CrossRef]
  59. Wosnitza, J.; Liu, X.; Schweitzer, D.; Keller, H.J. Specific heat of the organic superconductor κ-(BEDT-TTF)2I3. Phys. Rev. B 1994, 50, 12747–12751. [Google Scholar] [CrossRef]
  60. Imajo, S.; Yamashita, S.; Akutsu, H.; Nakazawa, Y. Quadratic Temperature Dependence of Electronic Heat Capacities in the κ-Type Organic Superconductors. Int. J. Mod. Phys. B 2016, 30, 1642014. [Google Scholar] [CrossRef]
  61. Nakazawa, Y.; Taniguchi, H.; Kawamoto, A.; Kanoda, K. Electronic specific heat at the boundary region of the metal-insulator transition in the two-dimensional electronic system of κ−(BEDT-TTF)2Cu[N(CN)2]Br. Phys. Rev. B 2000, 61, R16295–R16298. [Google Scholar] [CrossRef]
  62. Nakazawa, Y.; Taniguchi, H.; Kawamoto, A.; Kanoda, K. Electronic specific heat of BEDT-TTF-based organic conductors. Phys. B Condens. Matter 2000, 281–282, 899–900. [Google Scholar] [CrossRef]
  63. Brinkman, W.F.; Rice, T.M. Application of Gutzwiller’s Variational Method to the Metal-Insulator Transition. Phys. Rev. B 1970, 2, 4302–4304. [Google Scholar] [CrossRef]
  64. McWhan, D.B.; Remeika, J.P.; Rice, T.M.; Brinkman, W.F.; Maita, J.P.; Menth, A. Electronic Specific Heat of Metallic Ti-Doped V203. Phys. Rev. Lett. 1971, 27, 941–943. [Google Scholar] [CrossRef]
  65. Tokura, Y.; Taguchi, Y.; Okada, Y.; Fujishima, Y.; Arima, A.; Kumagai, K.; Iye, Y. Filling dependence of electronic properties on the verge of metal–Mott-insulator transition in Sr1−xLaxTiO3. Phys. Rev. Lett. 1993, 70, 2126–2129. [Google Scholar] [CrossRef] [PubMed]
  66. Imajo, S.; Kanda, N.; Yamashita, S.; Akutsu, H.; Nakazawa, Y.; Kumagai, H.; Kobayashi, T.; Kawamoto, A. Thermodynamic Evidence of d-Wave Superconductivity of the Organic Superconductor λ-(BETS)2GaCl4. J. Phys. Soc. Jpn. 2016, 85, 043705. [Google Scholar] [CrossRef]
  67. Stewart, G.R.; Williams, J.M.; Wang, H.H.; Hall, L.N.; Perozzo, M.T.; Carlson, K.D. Bulk superconducting specific-heat anomaly in β-di[bis (ethylenedithio) tetrathiafulvalene] diiodoaurate [β-(ET)2AuI2]. Phys. Rev. B 1986, 34, 6509–6510. [Google Scholar] [CrossRef]
  68. Andres, K.; Schwenk, H.; Veith, H. Peculiarities of Organic Superconductors of the (BEDT-TTF)2X Family. Phys. B+C 1986, 143, 334–337. [Google Scholar] [CrossRef]
  69. Matsuzaki, T.; Momono, N.; Oda, M.; Ido, M. Electronic specific heat of La2-xSrxCuO4: Pseudogap formation and reduction of the superconducting condensation energy. J. Phys. Soc. Jpn. 2004, 73, 2232–2238. [Google Scholar] [CrossRef]
Figure 1. Electronic phase diagram of dimer-Mott compounds with a D2X composition. Diagram is constructed based on the chemical and external pressure dependences of the physical properties of κ-(BEDT-TTF)2X compounds by Kanoda in Refs. [14,15]. Position of several compounds with different counter-anions are shown by dashed lines. Horizontal axis is the U/W ratio, which is tunable by an external pressure.
Crystals 08 00143 g001
Figure 2. Schematic (a) and photograph (b) of the relaxation calorimetry cell used to measure the heat capacity of small amounts of samples of molecule-based compounds. Photograph (c) shows the relaxation curvature in the measurement.
Crystals 08 00143 g002
Figure 3. (a) Schematic of the ac calorimetry system in the hybrid pressure cell of CuBe and NiCrAl. Sample part consists of a single crystal sample and two chip sensors working as a thermometer and a heater; (b) a typical curve of the frequency dependence of the ac amplitude voltage to evaluate the measurement validity. In the plateau region, which is marked by the arrow, the oscillation frequency satisfies the appropriate conditions for the measurements.
Crystals 08 00143 g003
Figure 4. CpT−1 vs. T2 plot of superconductive compounds (a) κ-(BEDT-TTF)4Hg1−δBr8 (Refs. [47,48]); (b) κ-(MDT-TTF)2AuI2 (Ref. [49]); (c) κ-(BEDT-TTF)2Cu(NCS)2 (Refs. [49,50]); and (d) (MDT-TSF)(AuI2)0.436 (Ref. [51]) obtained under 0 T and with magnetic fields.
Crystals 08 00143 g004
Figure 5. (a) CpT−1 vs. T2 plot of the ac heat capacity of κ-(BEDT-TTF)2Cu(NCS)2 at ambient pressure with magnetic fields of 0 T, 2 T, and 7 T applied parallel to the conducting layer. The values of CpT−1 under magnetic fields are plotted with constant offsets in the vertical axis. The arrow shows the superconductive transition temperature. (b) Temperature dependence of the ΔCpT−1 obtained by subtracting the 7-T data as the background (ΔCpT−1(H) = CpT−1(H) − CpT−1(7 T)) to evaluate the anomaly in the temperature dependence due to the electronic heat capacity around the transition (details are reported in Ref. [32]).
Crystals 08 00143 g005
Figure 6. (a) CpT−1 vs. T2 plot of the ac heat capacity of κ-(BEDT-TTF)2Cu(NCS)2 at 0.15 GPa with magnetic fields of 0 T, 1 T, 2 T, and 7 T. The values of CpT−1 under magnetic fields are plotted with constant offsets in the vertical axis. The arrow indicates the superconductive transition temperature at 0 T; (b) temperature dependence of the ΔCpT−1 at 0.15 GPa obtained by subtracting the 7-T data as the background (details are reported in Ref. [32]).
Crystals 08 00143 g006
Figure 7. Systematic changes in the peak shape of κ-(BEDT-TTF)2Cu(NCS)2 as the pressure increases up to 0.30 GPa. (See details in Ref. [32].) Temperature in the horizontal axis is scaled by Tc to qualitatively evaluate the sharpness of the thermal anomaly. Correspondence of the data in each pressure is shown in the schematic phase diagram of the dimer-Mott system.
Crystals 08 00143 g007
Figure 8. Shape of the thermal anomalies at the superconductive transitions of several compounds with the κ-D2X composition. ET is an abbreviation of BEDT-TTF molecules. BEDSe-TTF10% means that a solid solution system of BEDT-TTF(90%) and BEDSe-TTF(10%) molecules. Cel in this plot is determined as the difference of the 0 T data and the heat capacity data obtained under magnetic fields higher than Hc2 for each compound. (The data are from Ref. [33].) The dashed curves in the figure are a guide for the eyes to see temperature dependencies. The temperature in the horizontal axis is scaled by the transition temperature of each compound to compare the peak shape changes. The right part of the figure shows qualitatively the variation in the peak shapes in the dimer-Mott phase diagram.
Crystals 08 00143 g008
Figure 9. Temperature dependence of the electronic heat capacity determined as the difference of the 0-T data and the normal state data obtained under magnetic fields higher than Hc2 for (a) κ-(BEDT-TTF)2Cu[N(CN)2]Br and (b) κ-(BEDT-TTF)2Ag(CN)2H2O below the transition temperatures. (Ref. [60].) The lines and the curve shown in the figure denote T linear, T2, T3, and T−3/2exp(−Δ/kBT) temperature dependence.
Crystals 08 00143 g009
Figure 10. Systematic variations of the low-temperature thermodynamic parameters in the compounds mapped in the dimer-Mott phase diagram (a). Changes in (b) the normal states electronic heat capacity coefficient γ obtained by heat capacity data above Hc2 and (c) the residual electronic heat capacity coefficient γ* in the superconductive state at 0 T are plotted in accordance with the position in the phase diagram. The position of each compound is determined in reference to Refs [11,14,15]. The data are taken from Table 9 in Ref. [28] and the reported results data in Refs [42,59,60,61,62,63]. Systematic change of the thermodynamic parameters occurring with the change in chemical pressure, namely the change in the parameter of the U/W ratio, suggests that a kind of crossover exists inside the superconductive phase. Compounds shown as the name of the counter-anions are BEDT-TTF(ET) complexes. BEDSe-TTF 5%, 10% mean the solid solution systems of BEDT-TTF and BEDSe-TTF. (See text.) d[n,n]-Cu[N(CN)2]Br denotes a Cu[N(CN)2]Br compound with BEDT-TTF of which ethylene groups are partially deuterated (Ref. [61,62]) to tune the chemical pressure. Arrows show the characteristic tendency reflecting the physical properties.
Crystals 08 00143 g010

