1. Introduction
A large number of people suffer from urinary stone problems [
1,
2]. There are several types of urinary stones that differ in composition and etiology. The most common type of urinary stone is composed of calcium oxalate and is caused by metabolic disorders that are often treatable.
The so-called infectious stones are a separate kind of urinary stones, whose formation is related to urinary tract infection [
3,
4]. The infection is a result of the activity of microorganisms producing urease, mainly those from
Proteus species. Urease is a characteristic bacterial enzyme performing a catalytic function, i.e., the hydrolysis of urea (H
2N–CO–NH
2), which is normally present in the urine of a healthy person. The final products are carbamic acid (H
2N–COOH) and ammonia (NH
3). The former hydrolyses spontaneously to another molecule of ammonia and carbonic acid (H
2CO
3), according to the following reactions [
5,
6]:
Further reactions increase the pH of urine and cause a significant increase in the concentration of CO
32− and NH
4+ ions. The latter ion normally occurs in urine at low concentrations due to the presence of NH
4Cl. Ammonia ions together with calcium Ca
2+ and magnesium Mg
2+ cations present in the urine lead to the crystallization, at first, of carbonate apatite (Ca
10(PO
4)
6CO
3; CA) and then, of struvite (magnesium ammonium phosphate hexahydrate; MgNH
4PO
4·6H
2O), according to the following reactions [
6]:
CA is a minor component of this kind of stones, but it precipitates first (at lower pH). Struvite is the predominant crystalline component, but it crystallizes at higher pH (
).
Some literature sources [
7,
8,
9,
10] mention that hydroxylapatite Ca
10 (PO
4)
6(OH)
2 (HAP) is also present as a minor component of infectious urinary stones. Struvite mixed to various degrees with HAP and CA constitutes the so-called infectious urinary stones also called the struvite stones. It should be pointed out that HAP and CA belong to the family of apatites. Carbonate ions CO
32− can substitute OH
− groups in the structure of HAP, which is the A-type substitution that gives CA [
11].
Generally, the investigation of the precipitations accompanying the infection of the urinary tract may be performed in artificial urine or in real stones removed from patient’s bodies. In the experiments in artificial urine the infection is induced through the introduction of a suspension of bacteria to the artificial urine or is simulated in a chemical manner (e.g., Ref. [
12]). In both cases, struvite and HAP and/or CA are formed, which may be further examined. The experiments performed in artificial urine and investigations of stones removed from patient’s bodies have demonstrated that struvite appears in crystalline form, while HAP/CA shows poor crystallinity [
7]. The studies have also revealed amorphous matter both in experiments in artificial urine and in the actual urinary stones [
7]. However, although the apatites and other precipitates related to infectious urinary stones have been studied with different techniques for over 40 years, the exact nature of these solid phases is not well understood.
Over recent years we have published a series of articles concerning infectious urinary stones [
12,
13,
14,
15,
16,
17,
18]. In these articles we considered struvite and CA as the main components of this kind of stones. However, we met with the objections that CA cannot be formed in artificial urine of the composition used in our study. It was also pointed out that CA may be in crystalline form only, not amorphous as we claimed in some of our articles [
12,
13,
14,
15,
16,
17,
18]. Therefore, the first aim of this study was to obtain precipitates in artificial urine in the case of the presence of bacteria and in the case when the infection is mimicked in a chemical manner. The second and most important aim of the present study was also to characterize the obtained precipitates using different techniques, i.e., X-ray Diffraction (XRD), Energy Dispersive X-ray (EDX), Scanning Electron Microscopy (SEM), optical microscopy as well as Raman and Infrared (IR) Spectroscopies and to establish what kinds of precipitates are formed in the case of infectious urinary stones.
2. Materials and Methods
The artificial urine used in our experiments was made of the components listed in
Table 1. This composition of artificial urine is widely accepted in the literature [
19,
20,
21]. The artificial urine was prepared by dissolving chemicals (Sigma Aldrich, Darmstadt, Germany) of reagent-grade purity in distilled water. Then the solution of artificial urine was filtered through a membrane filter with pore size of 0.2 μm. The content of the mineral components in such artificial urine corresponds to the mean concentration found in a 24-h period in normal human urine. Tryptic soy broth (TSB) was used to stimulate bacterial growth. The initial pH of artificial urine was adjusted to a value of 5.8.
In this study two kinds of experiments were performed. In the first one, the precipitation of solid phases occurred without bacteria. In this case to mimic urease activity aqueous ammonia solution (1.2 M) was successively added. Such an addition causes an increase in pH value, as it occurs in the actual urinary tract infection. The aqueous ammonia solution was added until pH reached the value 9.5. The reason why it is the highest value of pH is explained below. In the second kind of experiment the formation of solid phases occurred due to the presence of appropriate bacteria. The
Proteus mirabilis (
P. mirabilis) were used as these bacteria are the most often isolated from human urinary stones (70% of all cases) [
22,
23]. Before the experiment of solid phase formation, the bacteria were maintained on a slant of tryptic soy agar overnight at 37 °C and then suspended in artificial urine at the concentration of 5 × 10
5 CFU per mL (CFU—colony forming unit). The presence of bacteria in artificial urine, strictly speaking the activity of bacterial enzyme—urease—causes an increase in pH, as mentioned in the Introduction. The pH increases beginning from the initial value of 5.8 to 9.5. The pH equal to 9.5 is the highest value and is achieved after 8 h of incubation. The pH level is correlated with the bacteria viability, pH higher than 8 has a bacteriocidic effect. The pH of the artificial urine was monitored during the experiments using a digital pH-meter (Elmetron CPC-401) at an accuracy of 0.01. The experiments in the absence as well as in the presence of bacteria were conducted under thermostated conditions at 37.0 ± 0.5 °C. In the absence of bacteria the temperature was kept constant by circulating water from a constant temperature water bath; in the presence of bacteria the samples were incubated at 37 °C. The experiments were made at least in triplicate for the assessment of repeatability.
The aim of the present study was to examine HAP and/or CA or other solid phases that might appear in both cases, in the absence and the presence of
P. mirabilis. The appearance of struvite in infectious urinary stones is well known and confirmed [
24,
25] and its presence is not controversial. However, the appearance of HAP and/or CA or other solid phases promote controversies. In this study the results of examination of HAP and/or CA or other solid phases which appear with struvite and without it are presented and discussed. Especially the examination of the solid phases appearing without struvite is very important and interesting. Crystalline struvite may disturb the examination of other solid phases. Therefore, we performed two kinds of experiments. The first one was performed in artificial urine of the composition presented in
Table 1. In such a case in artificial urine, as a consequence of the activity of urease or the addition of aqueous ammonia solution, struvite and other solid phases appear (HAP and/or CA or other solid phases). In this kind of experiment struvite may disturb some measurements, but the advantage of this experiment is that the composition of artificial urine is not changed. The second kind of experiment was performed in artificial urine whose composition was changed. This change was such that magnesium chloride hexahydrate was not a component of prepared artificial urine. Such a change causes struvite not to crystallize, but other solid phases (HAP and/or CA) appear. This kind of experiment facilitates the examination of formed precipitations.
The experimental protocol used for precipitate formation in the presence of bacteria involved placing a 2 mL of 5 × 10⁶ CFU/mL bacterial suspension in a dialysis sac (12,000–14,000 Molecular Weight Cut Off—MWCO; Serva) placed in a tube containing 50 mL; of artificial urine (thus, the added bacterial suspension corresponds to 1 × 10⁵ bacteria per ml of the whole sample). Isolation of the bacteria contained in the dialysis sac from the urine solution allowed sampling without the potential interference of bacteria whose chemical components could interfere in the interpretation and comparison of samples with and without bacteria. Experiments were performed at 37 °C.
The precipitates appearing during the experiments were taken at pHs equal to 7, 8, and 9 in order to check whether the composition of the precipitates depends on pH. In order to separate the precipitates formed from artificial urine the samples were centrifuged (a centrifuge Eppendorf 5702, 12,000 rpm for 5 min in the case of the absence of bacteria and Sigma 1–15, 12,000 rpm for 20 min in the case of the presence of bacteria). Then, the resultant precipitates were rinsed in distilled water three times and each time centrifuged. The so prepared precipitates were dried at room temperature for 24 h and examined directly after drying.
Prepared dry samples were examined using XRD, EDX, SEM, optical microscopy, Raman and IR Spectroscopies. XRD was done using an X’pert PRO MPD (PANalytical) diffractometer. A Cu K
α radiation monochromatized by nickel filter was applied. Measurements were done in the range of 2θ angles from 5° to 90°. A continuous scan was used (step 0.0167°); the measurement time of one step was 25 s. The X’pert High Score Plus (PANalytical, Almelo, The Netherlands) software was used for indexing peaks in the XRD pattern. The SEM micrographs were performed using a Vega 5135 MM-Tescan microscope (Tescan, Brno, Czech Republic) (
Figure 1b,c) and FEI Quanta 200F microscope (ThermoFisher Scientific, Hillsboro, USA) (
Figure 1d,e). EDX analysis was made using Oxford Instruments X-Max (50 mm
2) (Oxford Instruments, Abingdon, United Kingdom). The samples from different stages of precipitation (collected at different pHs) were observed using optical microscopy OptaTech MN800 (OptaTech, Warsaw, Poland) and Nikon Eclipse TE2000-S (Nikon Instruments Europe B.V., Amsterdam, The Netherlands).
A dispersive three-grating spectrometer T-64000 (Jobin-Yvon, Edison, NJ, USA) equipped with confocal microscope BX-40 (Olympus, Tokyo, Japan) was used to collect Raman spectra of the obtained precipitates. An Ar/Kr laser was used as an excitation light source. Different wavelengths generated by this laser were tested and finally the Ar 514.5 nm line was selected for systematic studies. In the applied configuration the spectral resolution was c.a. 0.5 cm
−1. The laser light power on the sample surface did not exceed 2 mW. The acquisition time was 120 s per point and two scans were averaged. All experiments were performed at room temperature, in back-scattering configuration using a long-distance objective with 50× magnification. Also, some attempts were made to perform measurements of the samples prepared in the presence of bacteria. Unfortunately, in spite of the use of a Fourier-Transform Raman system with the IR excitation source (Nd:YAG laser, λ = 1064 nm), the re-emission (fluorescence) overlapped the Raman signal. This is a phenomenon quite often observed for biological material (microorganisms or the products of their activity) [
26,
27].
Absorption spectra in the middle IR region were collected at room temperature with the use of a Fourier Transform Infrared Spectrometer (A Thermo Scientific Nicolet, Waltham, MA, USA) equipped with an Attenuated Total Reflectance (ATR) accessory with diamond crystal. The spectral resolution was 2 cm−1 and 32 scans were averaged. Dry samples prepared according to the procedure described above were tested. The solid phases deposited on glass plates were tested also with the ATR accessory and the samples were held onto the diamond crystal by a special screw ensuring constant pressure.
Various vibrational spectroscopies are powerful, non-invasive tools for phase analysis in solid state. They consist of an analysis of interactions between electromagnetic waves with oscillating matter. In the case of Raman spectroscopy, the coherent electromagnetic wave (laser light) from the range of ultra-violet (UV), visible (Vis) or near infrared (NIR) is used to excite a sample and the inelastically scattered waves are analyzed. In absorption infrared (IR) spectroscopy the loss of radiation intensity when the ray passes through a sample is measured. Due to different selection rules (activity in Raman spectroscopy requires a change in system polarizability during oscillation, while in IR spectroscopy, the dipole momentum must change), depending on system symmetry, only part of the vibrational modes are visible in both Raman and IR spectra. Thus, to obtain a complete picture of the investigated systems Raman as well as IR spectroscopies were used.
Vibrational spectroscopy techniques allow confirmation of the results of X-ray studies. Moreover, they offer additional information about the chemical structure of matter. This means, that they are able to distinguish different disorder phases, which was one of the most important goals of performed investigations. It is also worthy to note that as used in these studies the equipment does not require any special treatment of samples which is an additional advantage of the selected analytical methods.
In order to check the theoretical possibility of formation of HAP and CA in artificial urine a chemical speciation analysis was performed using computer code HySS [
28]. This analysis allows determination of concentrations of Ca
10(PO
4)
6(OH)
2 and Ca
10(PO
4)
6CO
3 complexes formed in artificial urine during the precipitation processes. On the basis of the stability constants and initial concentrations of various complexes, the concentrations of the Ca
10(PO
4)
6(OH)
2 and Ca
10(PO
4)
6CO
3 complexes formed in artificial urine within the given pH range were calculated. The stability constants used in the HySS program were calculated with the aid of computer code EQUIL [
29] or taken from literature [
30,
31,
32]. The calculations were carried out for the temperature equal to 37 °C.
3. General Characterization of Precipitates
Struvite and CA and/or HAP are the main components of infectious urinary stones. Struvite with regard to its crystallinity is not controversial. The main subjects of the present study are HAP and/or CA whose precipitation is still not fully understood. HAP and/or CA arise in the course of infection in urinary tract caused by the bacterial urease activity. HAP and/or CA may also be formed when the infection is mimicked by aqueous ammonia solution.
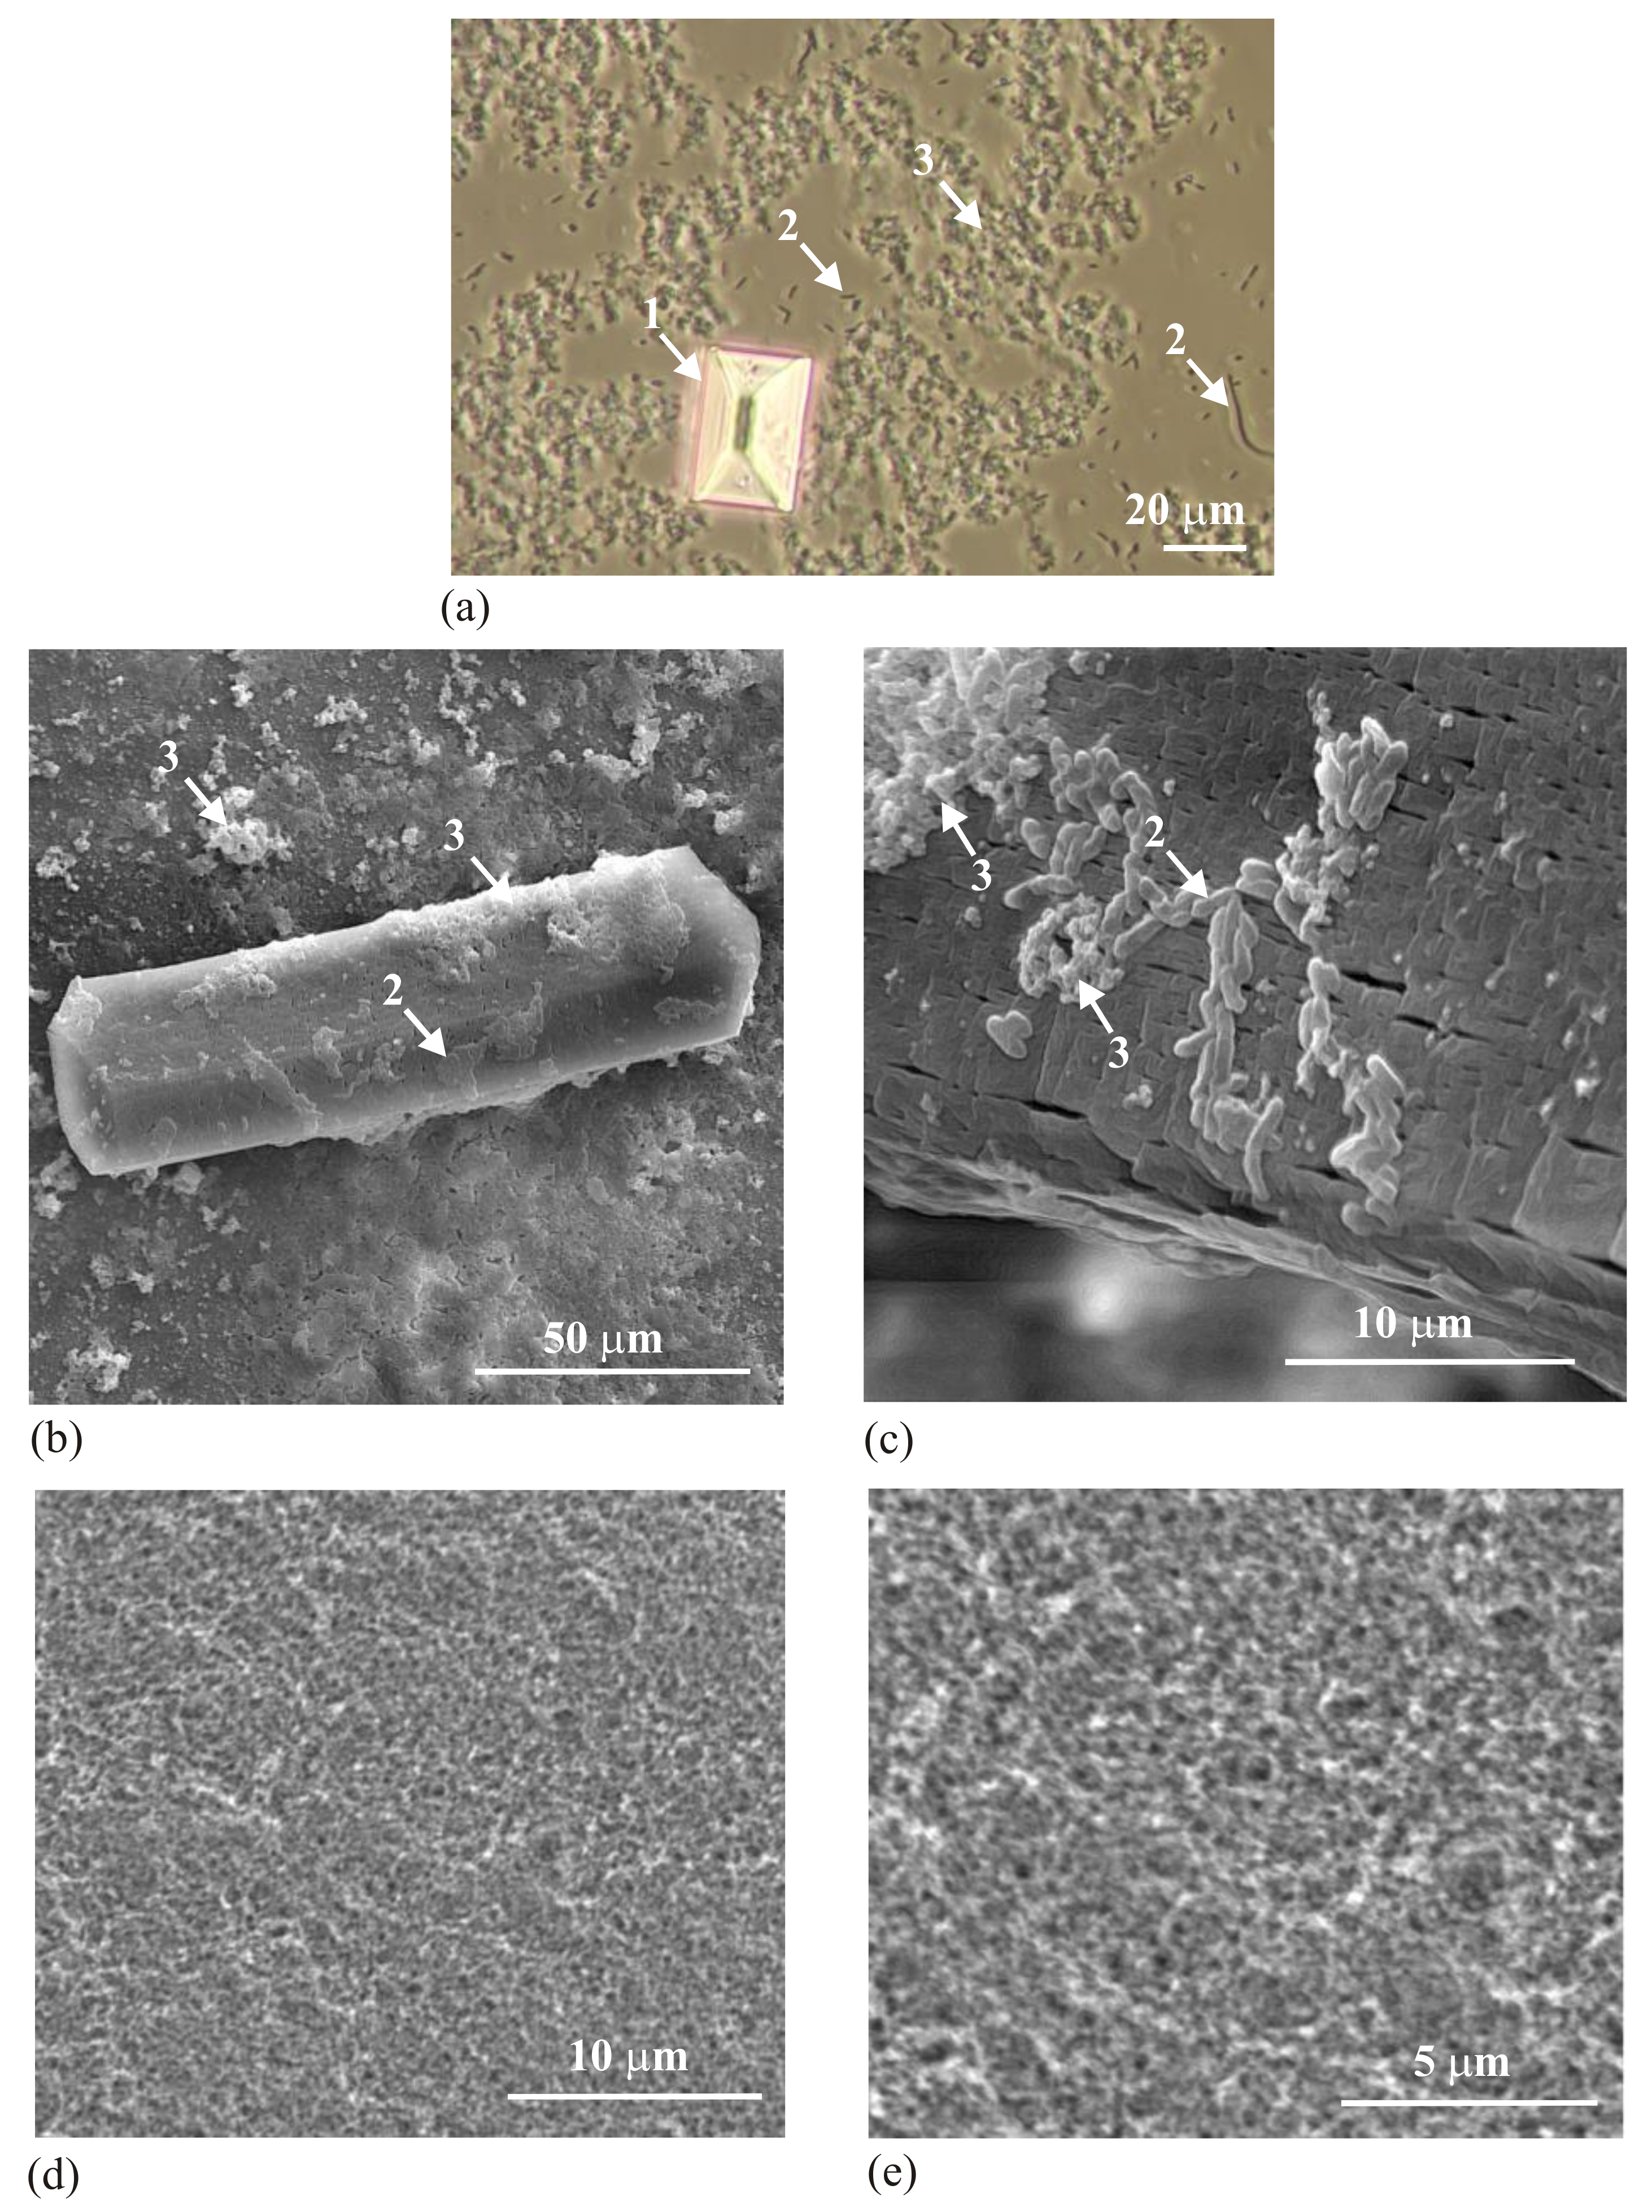
Figure 1 shows the obtained precipitates, struvite (arrow 1) and HAP and/or CA (arrow 3).
Figure 1a presents the wet sample obtained in the presence of bacteria (arrows 2). This sample was obtained by taking a drop of solution of artificial urine with the precipitated solid phases, placement on a microscope slide and covering with a coverslip. The sample was observed with the aid of an optical microscope using transmitted light. The picture presents struvite in crystalline form (arrow 1) with well-defined crystallographic surfaces, bacteria (arrows 2) and the precipitate being the subject of our interest (arrow 3). There is no evidence that this precipitate is crystalline.
Figure 1b–e shows SEM micrographs of the obtained precipitates.
Figure 1b shows the crystalline struvite, bacteria (arrow 2) with the precipitate being the subject of our interest (arrow 3).
Figure 1c shows a similar struvite crystal like the one shown in
Figure 1b, but at higher magnification. Here, one can see bacteria (arrow 2) with the precipitate being the subject of our interest (arrow 3). Both bacteria and the precipitate of interest are deposited on struvite. Struvite shows very characteristic structuration suggesting its porous nature. This issue is known and has been described in the literature [
33,
34].
Figure 1d,e shows the obtained precipitate in the absence of bacteria and in the case when the composition of artificial urine is modified (without magnesium chloride hexahydrate) so that no formation of struvite takes place; only the precipitate which is the subject of our interest occurs. On the basis of
Figure 1 it can be concluded that the analyzed precipitate is not in a visible crystalline form. This precipitate forms aggregated particles without special organization and without visible features of crystallinity. However, it is not surprising. Biominerals often show a habit not typical of crystals, of not having the faces characteristic of crystals [
35].
In order to find out more detailed information, the obtained precipitates which were the subject of our interest were examined using different techniques. The results are presented in the following Sections.
5. Raman Analysis
Raman spectroscopy was used as complementary to XRD and is a very useful phase analysis technique. It was used to confirm XRD data presented in the previous section and to supplement them with chemical structure information. It should be especially interesting in the case of amorphous phases, as XRD is not selective in this field.
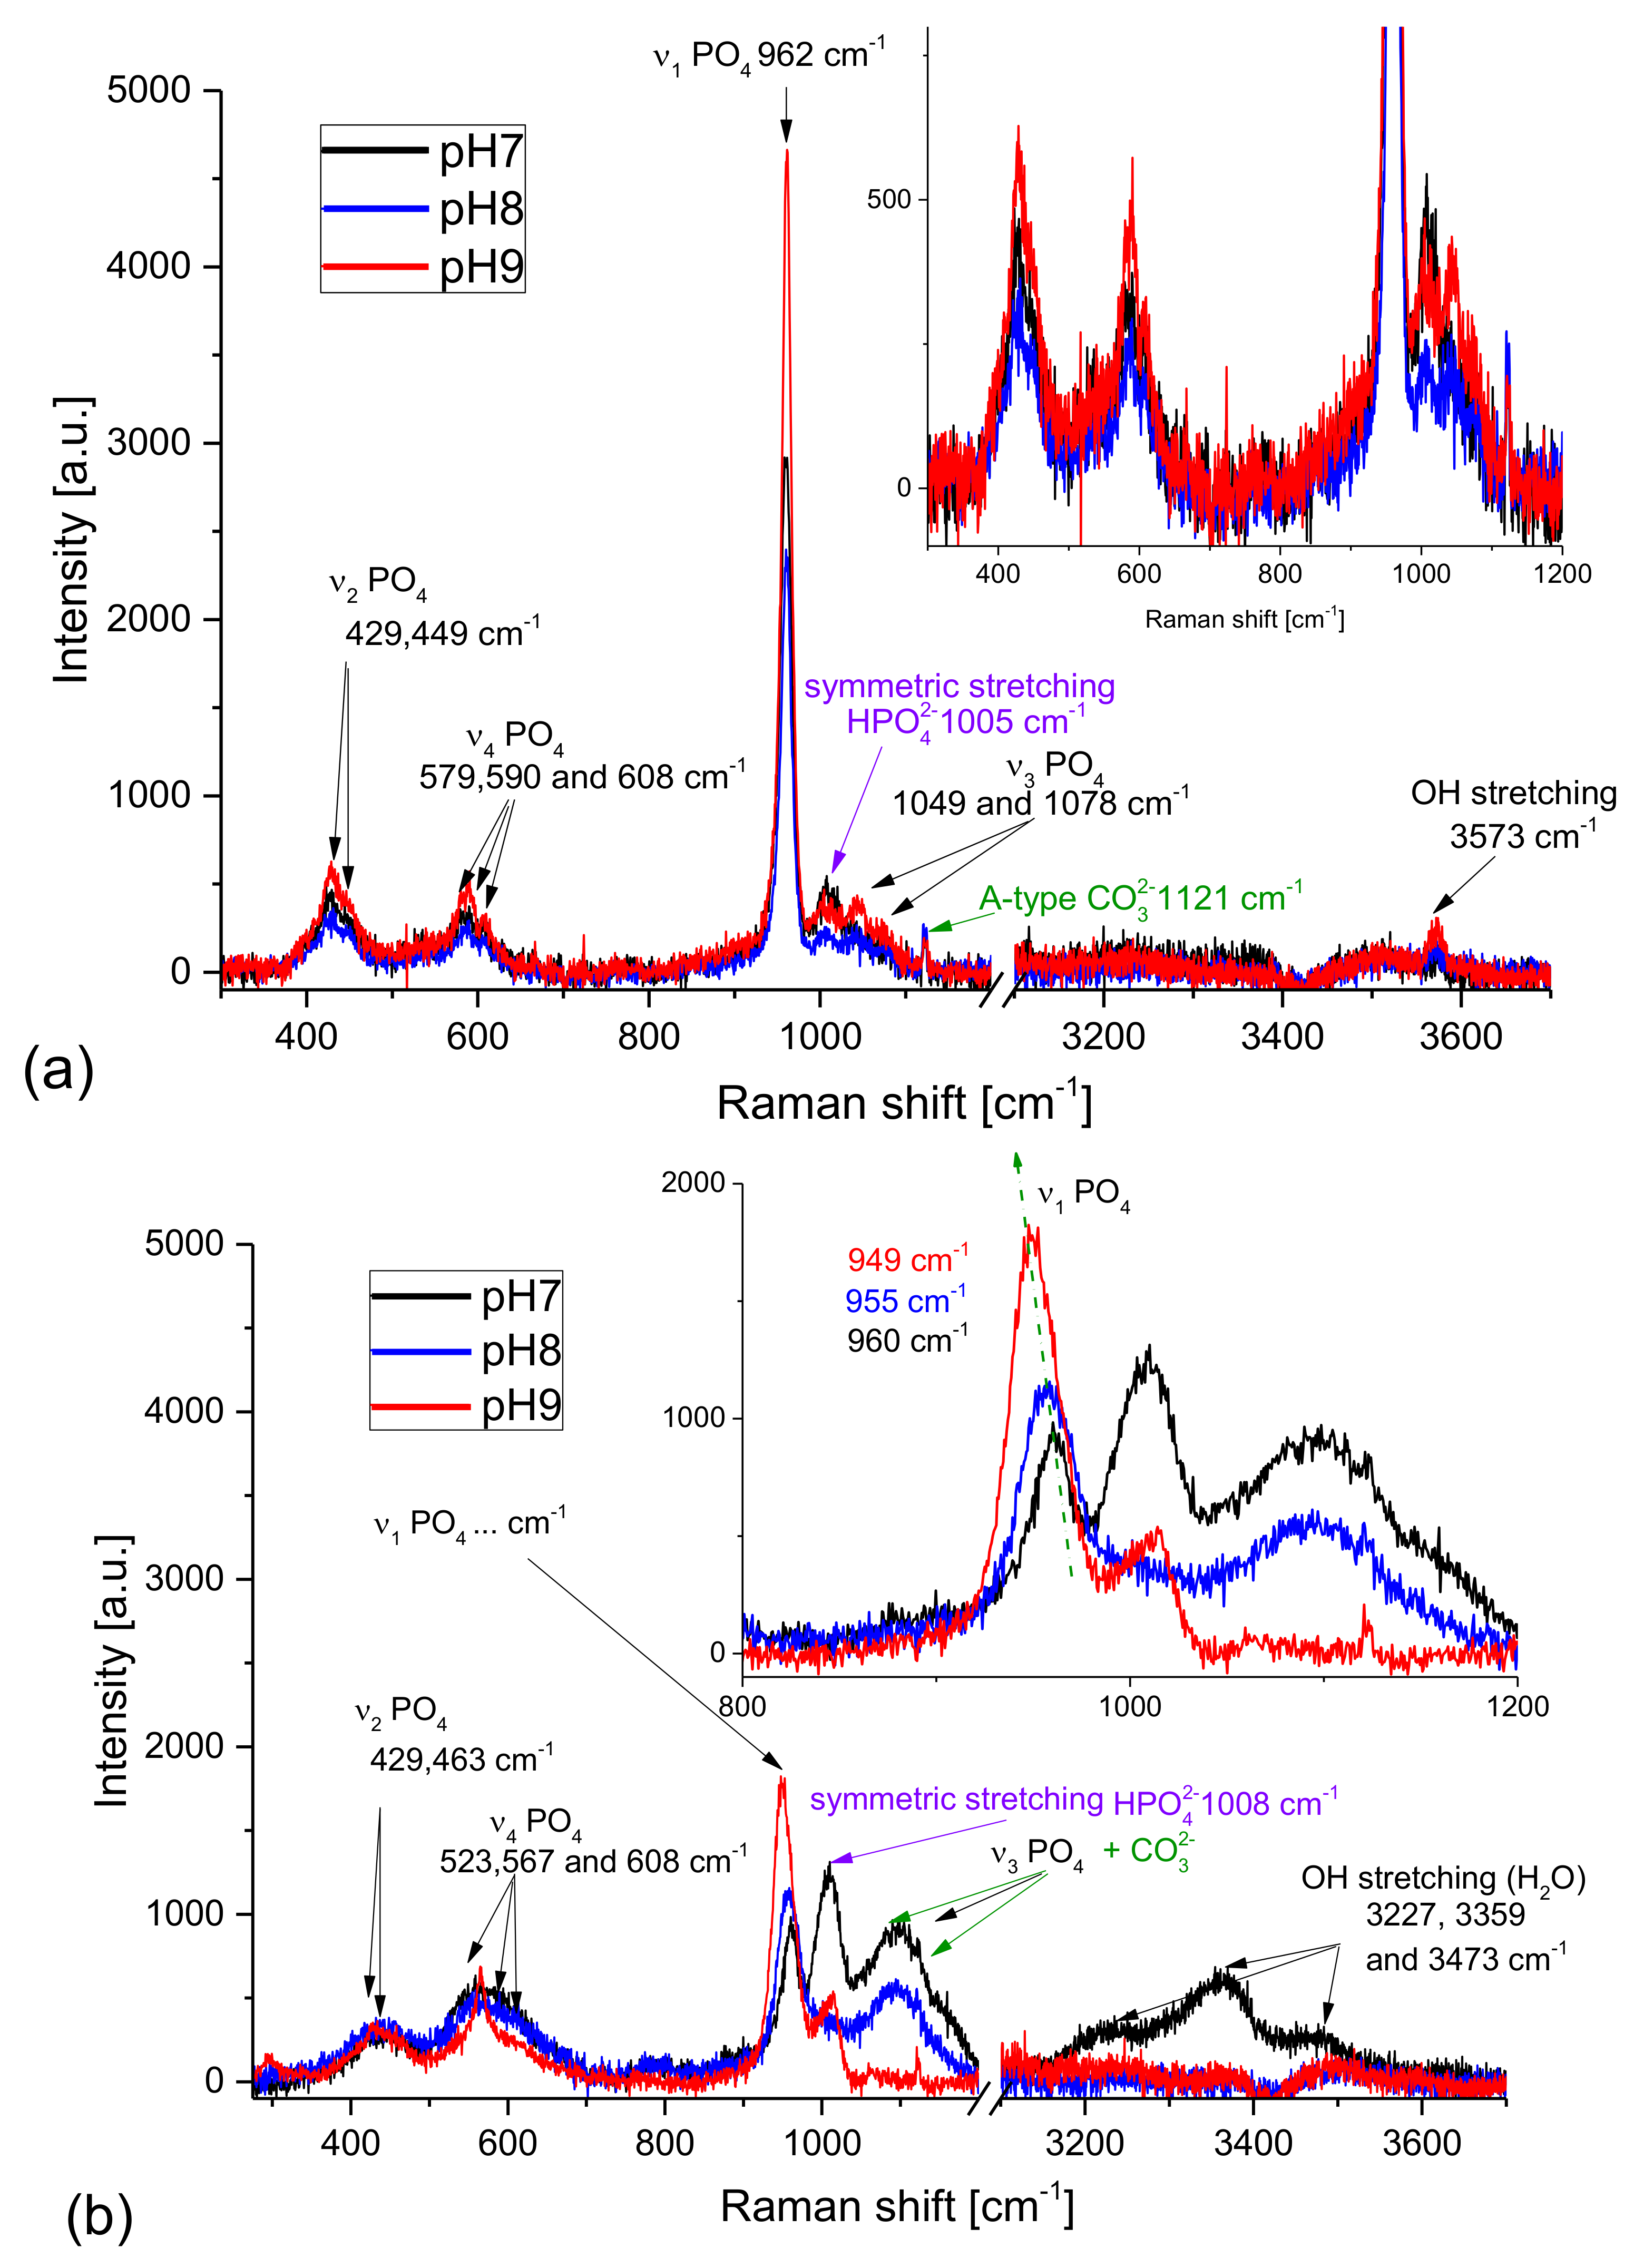
Figure 6a presents Raman spectra of the samples obtained from artificial urine of modified composition (without magnesium chloride hexahydrate). The pH was increased by successive additions of aqueous ammonia solution (the series without the presence of bacteria). The Raman spectra shown in
Figure 6a do not differ essentially from one another; they are almost identical for all pH values. The bands at 447, 579 [
45], 962, 1029, 1047, and 1076 cm
−1 [
11] characteristic of HAP are the most intensive in these spectra. This finding implies that HAP is the dominant phase in the samples examined. The relatively broad FWHM (full width at half maximum) proved that the HAP crystalline phase is not perfect. The peak broadening may be assigned to amorphous phase formation or to the numerous defects in the crystal lattice. The broad Raman lines are also characteristic of nanocrystalline phases as the surface (defect from the crystallography point of view) to volume ratio increases with decreasing size of the crystals. The microcrystalline structure observed for the prepared samples (compare to
Figure 1) suggests that the Raman peak broadening results rather from the amorphous phase presence, than from the crystal size reduction. This is in agreement also with our XRD results presented in
Section 4.1, as in the diffractograms the amorphous phase assigned halo is present. The open question is the presence of carbonate apatite or carbonate ions in the samples. According to the literature, the Raman band assigned to CO
32− ion appears at 1106 cm
−1 [
45] for A-type HAP (CO
32− is substituted in the structure of HAP at the OH
− site). However, there is no band at this wavelength, while the line well visible at 1121 cm
−1 may be assigned to the carbonate anion. The shift is probably due to the internal stresses induced in the sample, which is characteristic of polycrystalline as well semi-crystalline (mixture of amorphous and crystalline phases) structures. It is also worth noting the presence of HPO
42− anions in the samples proved by the Raman line at 1005 cm
−1 [
45]. It is not surprising as the pK
a2 for phosphoric (V) acid is 1.2 × 10
−7. It means that at pH >7.21 the concentration of HPO
42− ions should be higher than that of PO
43− ones. This is in agreement with the results presented in [
17]. Here, it is shown (
Figure 4 in Ref. [
17]) that the concentration of HPO
42− ion is higher than that of PO
43− for pH higher than 7.21. The position of the band assigned to HPO
42− suggests that the HPO
42− ions substituted rather PO
43− ions in the apatite lattice than formed separate crystals: brushite (dicalcium phosphate dihydrate, CaHPO
4·2H
2O, with the characteristic Raman line at 991 cm
−1 [
46]) or monetite (anhydrous dicalcium phosphate, CaHPO
4) with the characteristic Raman line at 963 cm
−1 [
46]). The band at 3573 cm
−1 is assigned to the OH stretching modes.
Figure 6b presents the Raman spectra of the samples obtained from artificial urine of non-modified composition. The pH was increased by successive addition of aqueous ammonia solution (the series without the presence of bacteria). These spectra are essentially different from the previous ones recorded for the samples obtained from artificial urine of modified composition. All bands assigned to PO
4 tetrahedra overlap with the standard-bands of HAP, however, their FWHMs are significantly broader than those of the samples obtained from the modified artificial urine. It strongly suggests that the amorphous phase of HAP dominates in the samples (especially in the precipitates formed at pH = 8). For the sample of pH = 7, a strong line characteristic of HPO
42− ions appears. However, it is necessary to remember that the presence of Mg
2+ cations in the reacting mixture opens new pathways for many chemical reactions (sedimentations, substitutions, etc.) influencing the environment of the reaction. Moreover, the solubilities of magnesium phosphate and calcium phosphate are significantly different. Taking into account that the forming precipitates may still react as the equilibrium state is not reached immediately, it is reasonable to suppose that the solid phases with HPO
42− can be formed. The number and diversity of reaction pathways which may be taking place makes it impossible to give a simple answer to the question of the mechanisms of formation of different solid phases. Moreover, the precipitation composed of different solid phases can change the pH in the system and shift the meta-stable equilibrium being a result of co-existence of many various species (solids, ions, water, non-ionized salts etc.). Further studies, especially kinetics ones, should be probably useful to explain more precisely the mechanism of formation of various phases in the urine environment.
The solid phase precipitated at pH = 7 is strongly hydrated as a relatively strong complex band between 3100 and 3600 is visible with the maxima at c.a. 3230, 3360, and 3475 cm−1. For the sample obtained at pH = 8 the water is practically absent. The amorphous character of the sample is proved by both: the broad lines of PO43− modes and also by the broad line characteristic of the OH stretching vibrations (3570 cm−1).
It is also worth noting that the bands assigned to PO
4 are the highest and the narrowest for the sample precipitated at the highest pH. It means that the crystallinity of this sample is the highest. Additionally, the band at about 1120 cm
−1 characteristic of A-type CO
32− is present. The maximum of the ν
1 PO
4 band shifts toward lower frequencies with increasing pH (
Figure 6b, inset). This is probably due to the substitution of Ca
2+ anions by Mg
2+ and NH
4+ cations as the characteristic maxima for apatite and struvite are at 962 and 949 cm
−1 respectively. However, the presence of the 1100 cm
−1 line characteristic of A-type CO
32− and a relatively strong line at 1006 cm
−1 prove that the struvite-like structures are accompanied by other phases: carbonates and various apatites containing both PO
43− and HPO
42− anions. The broad bands related to ν
2 and ν
4 PO
4 modes show that the sample is partially amorphous. Also, the broad line corresponding to the OH stretching vibrations suggests that the hydroxylapatite is formed and its crystallinity is low.
Concluding, the highest amount of ACP and ACCP is found in the sample prepared at the lowest pH of 7. This means that the amount of carbonates/carbonate apatite decreases with increasing pH. The sample at the highest pH used contains a mixture of struvite and crystalline as well amorphous phosphate and carbonate structures (HAP, ACP, ACCP). For all samples the Raman line characteristic of HPO42− was also detected. Probably this ion plays an important role in formation of various apatite, hydroxylapatite and carbonated apatite structures as well as struvite formation in the urine environment. This observation throws new light on the formation of these phases and may explain why the pH has such a strong influence on the precipitation process.
6. IR Analysis
The precipitates were also examined using Fourier-Transform Infrared (FTIR) spectroscopy. This technique is sensitive to polar groups and compounds such as carbonyl (C=O) groups or water. Thus, it is especially useful to study carbonates as well as the water content in precipitated phases.
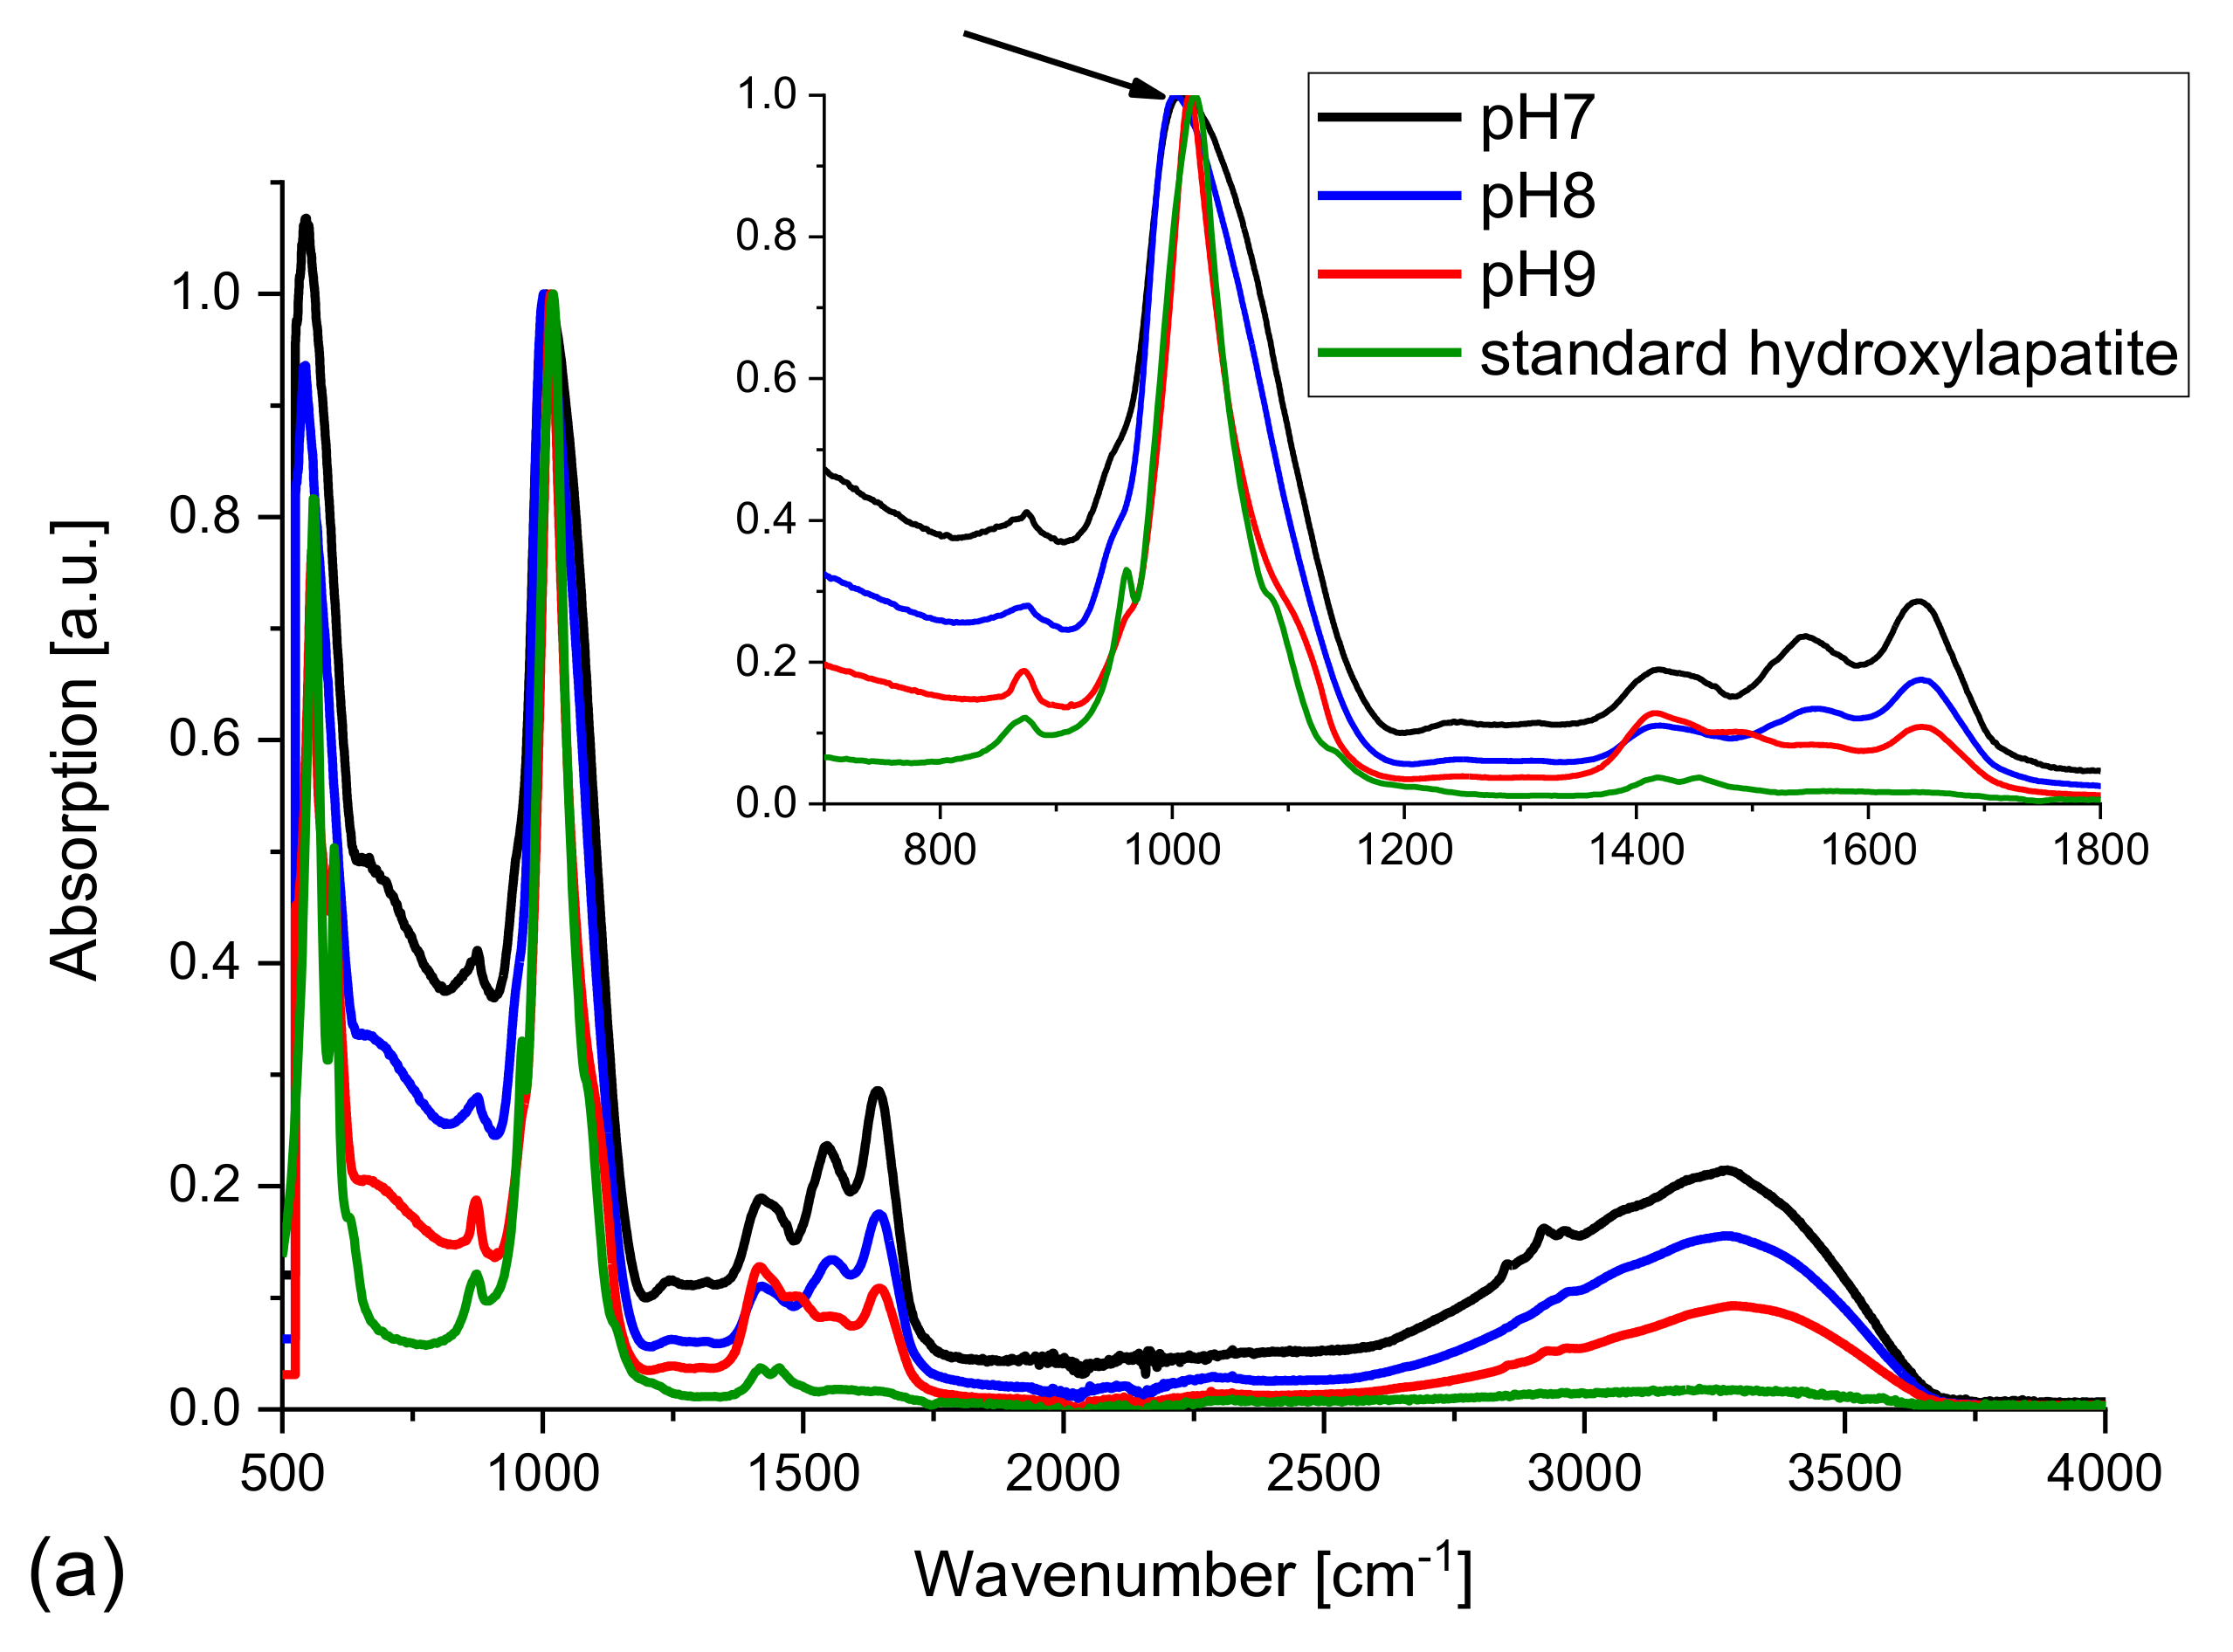
The spectra, normalized to the most intensive line, recorded for dry samples obtained in the absence of bacteria are presented in
Figure 7. The spectra of the samples obtained from artificial urine of modified composition (magnesium chloride hexahydrate not added) match well (
Figure 7a) the standard HAP spectrum taken from the RRUFF
TM Database [
46]. It is worth emphasizing that the spectra of the precipitated solid phases show broad bands in the frequency region 1500–1800 cm
−1, which are not present for standard HAP. These peaks are characteristic of the CO
32− ions and testify to the presence of carbonates; they may indicate the presence of carbonate apatite. One can also see a very broad band with a maximum at 3300–3400 cm
−1 which is characteristic of the OH stretching vibrations. It should be noted that both carbonate and hydroxyl group absorption bands are broad, which is typical of disordered phases. Probably, the presence of carbonate anions that substituted the phosphate or hydroxyl ones, leads to formation of partially amorphous phases. The inset in
Figure 7a shows higher magnification of the region between 800 and 1200 cm
−1 with the main band (mode ν
1 of PO
4) of HAP at 1020 cm
−1. As follows from the inset, the band in the spectra of the examined samples matches well that appearing in the standard HAP spectrum; there is no displacement, however for higher pH (8 and 9) a low frequency shoulder occurs, which may be assigned to the partial substitution of calcium ions by other cations [
36,
37].
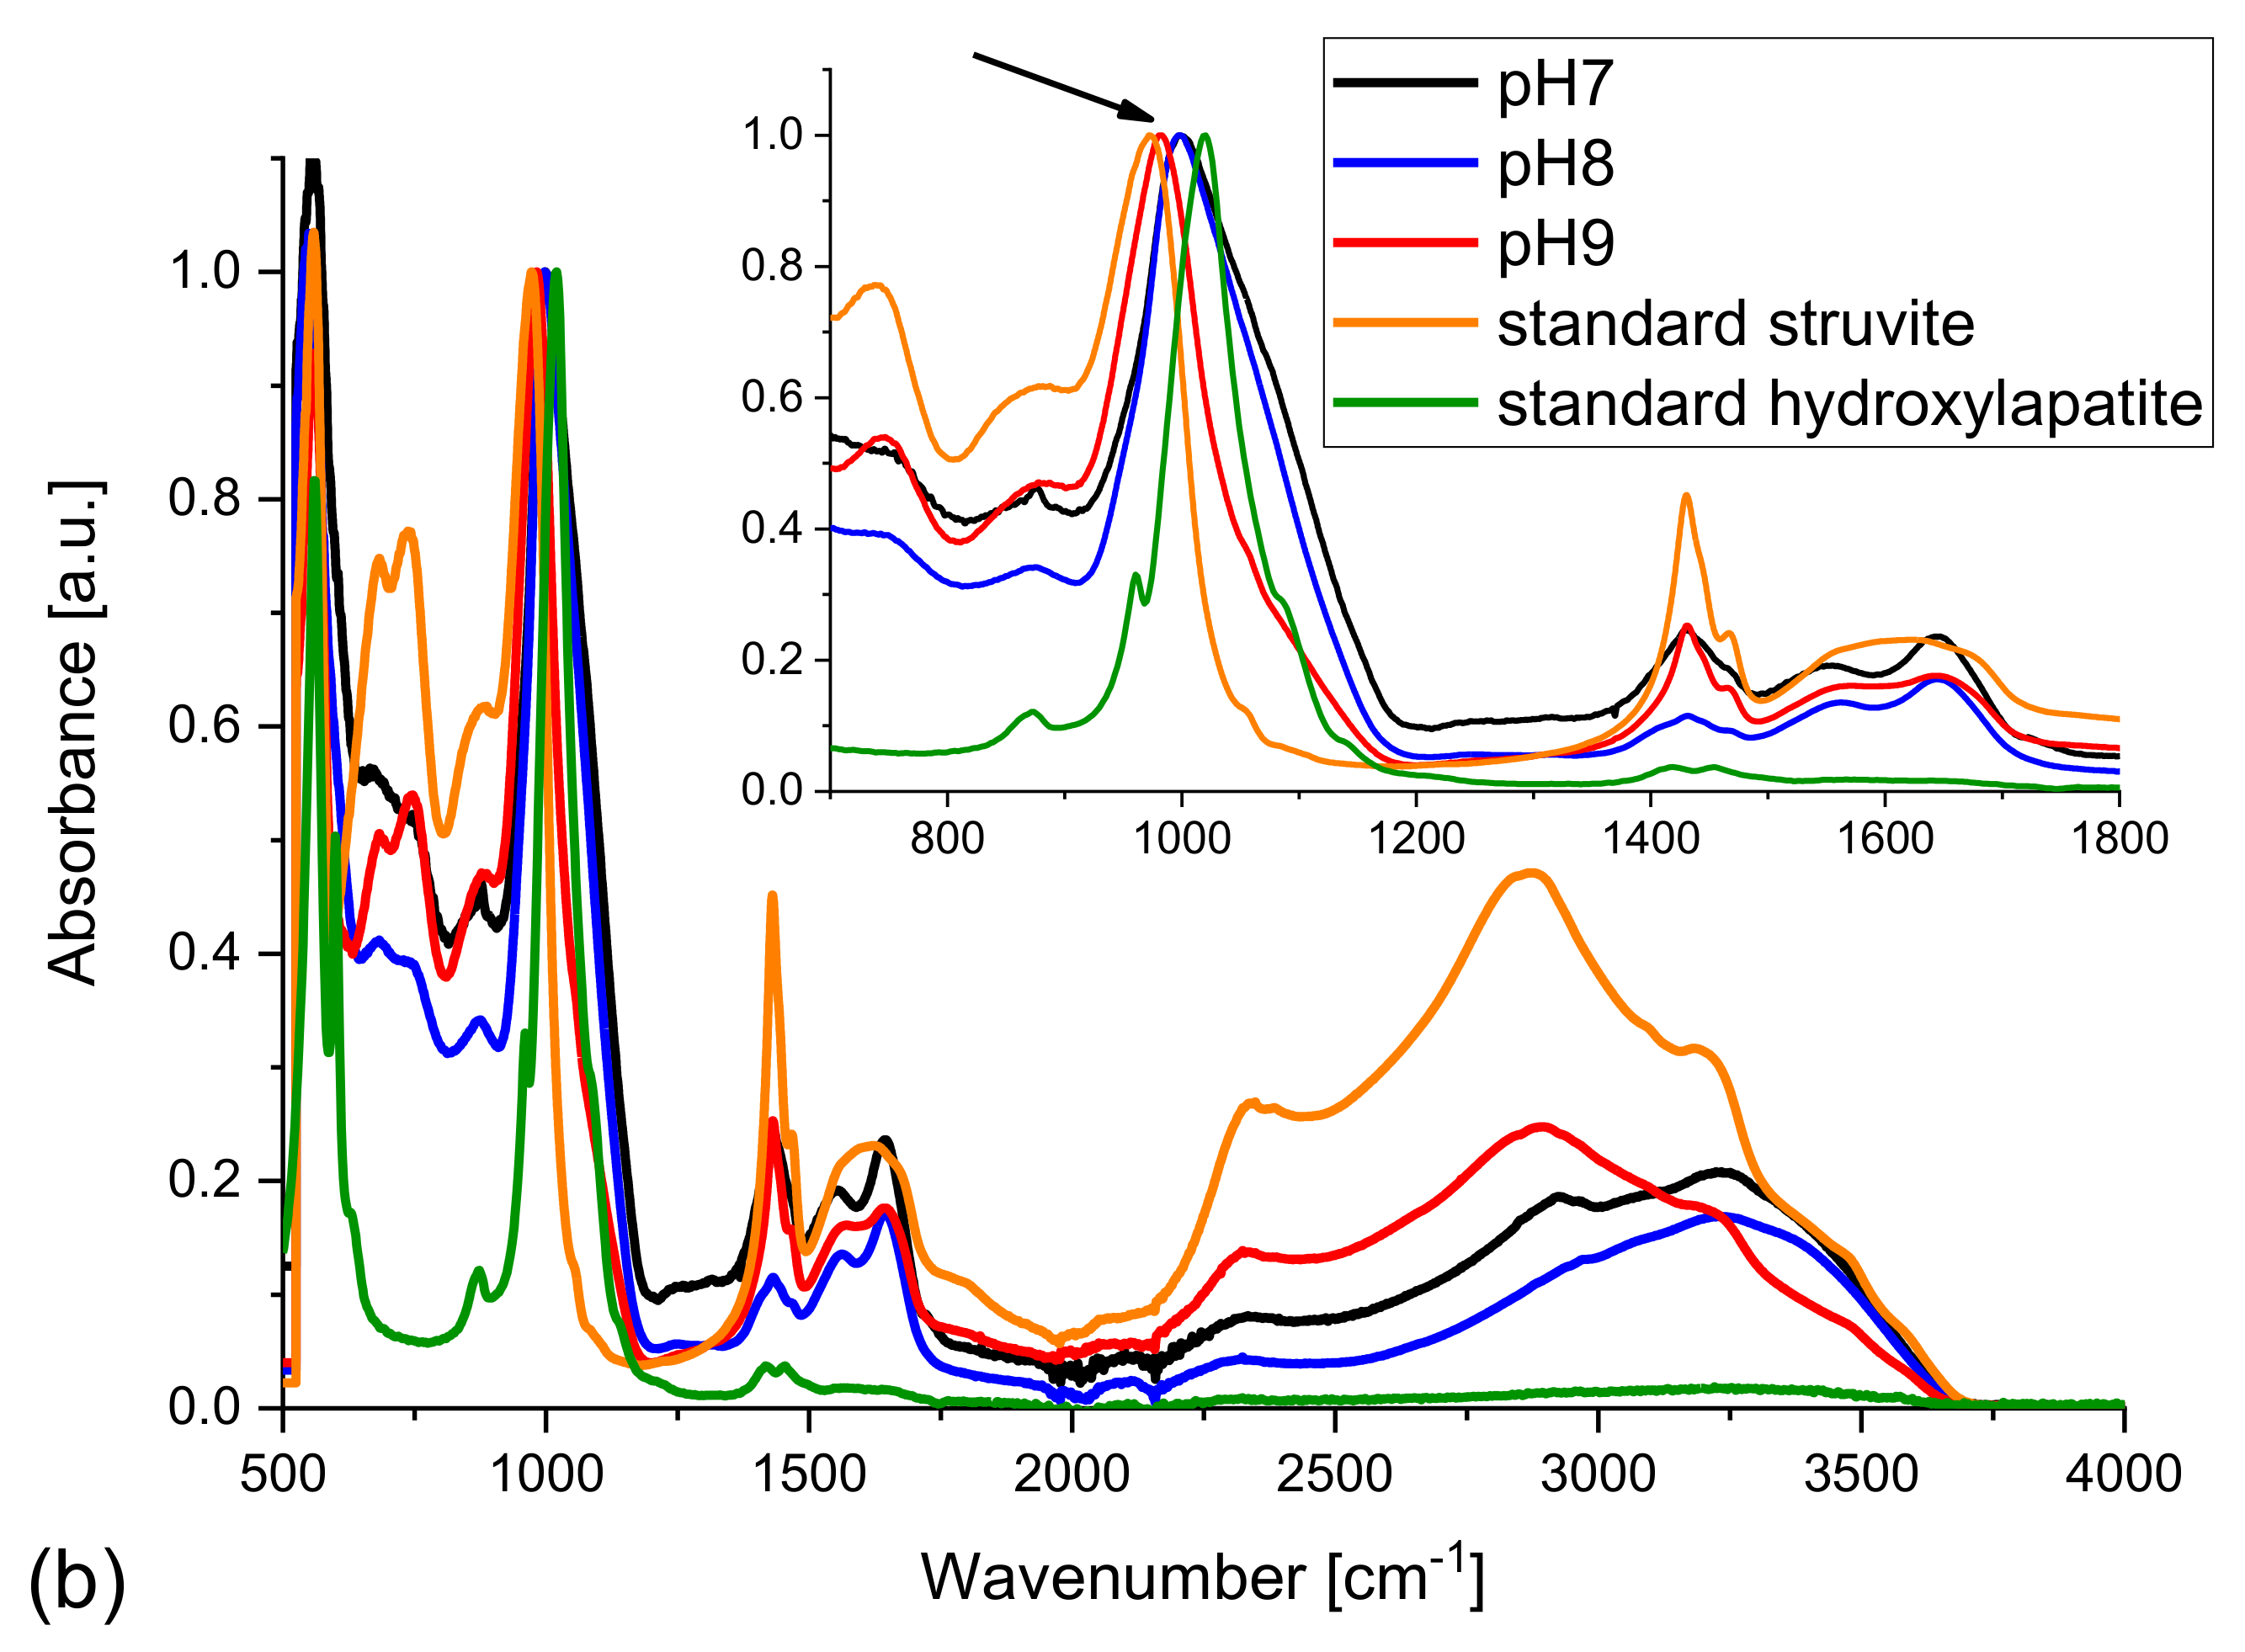
The IR spectra of the samples obtained from the artificial urine of normal composition of artificial urine (with magnesium chloride hexahydrate) were also measured. In such samples the presence of struvite is expected besides carbonates/carbonate apatite and HAP. Therefore, in
Figure 7b the spectra of standard HAP and standard struvite are added. A comparison of the obtained experimental spectra with those of standard HAP and struvite reveals that the experimentally obtained solid phases may be a mixture of struvite, HAP, and carbonates/carbonate apatite. Let us focus on the peaks at 1020 cm
−1 characteristic of standard HAP and 980 cm
−1 characteristic of standard struvite. According to
Figure 7b (inset), the peak in the spectrum of the sample at pH = 7 coincides well with the peak in the spectrum of standard HAP. However, it is shifted towards lower wavenumbers with increasing pH (
Figure 7b). It should be noted that with increasing pH struvite starts to crystallize. In compliance with Equation (4) struvite starts to crystallize for pH ≥ 7.2. This means that for pH of 7 struvite is not expected to be formed. Therefore, the main peak in the spectrum of the sample at pH = 7 matches well that recorded for standard HAP. In the spectrum of the sample at pH = 8 the peak is slightly shifted towards smaller frequencies. In other words, it is shifted towards the position of the peak characteristic of standard struvite. The reason for such a shift is that with increasing pH more and more struvite appears. For pH = 9 when the quantity of struvite is the highest, this shift is the largest (
Figure 7b, inset). This result may suggest that the samples obtained experimentally are mixture of HAP and struvite, which is in agreement with the Raman experiments. The quantity of struvite increases with pH. In
Figure 7b one also sees peaks at 1590 and 1650 cm
−1 characteristic of the presence of CO
32−. It means that besides HAP and struvite, the sample also contains carbonates. Because none of the other peaks is changed, it is highly probable that it is carbonate apatite.
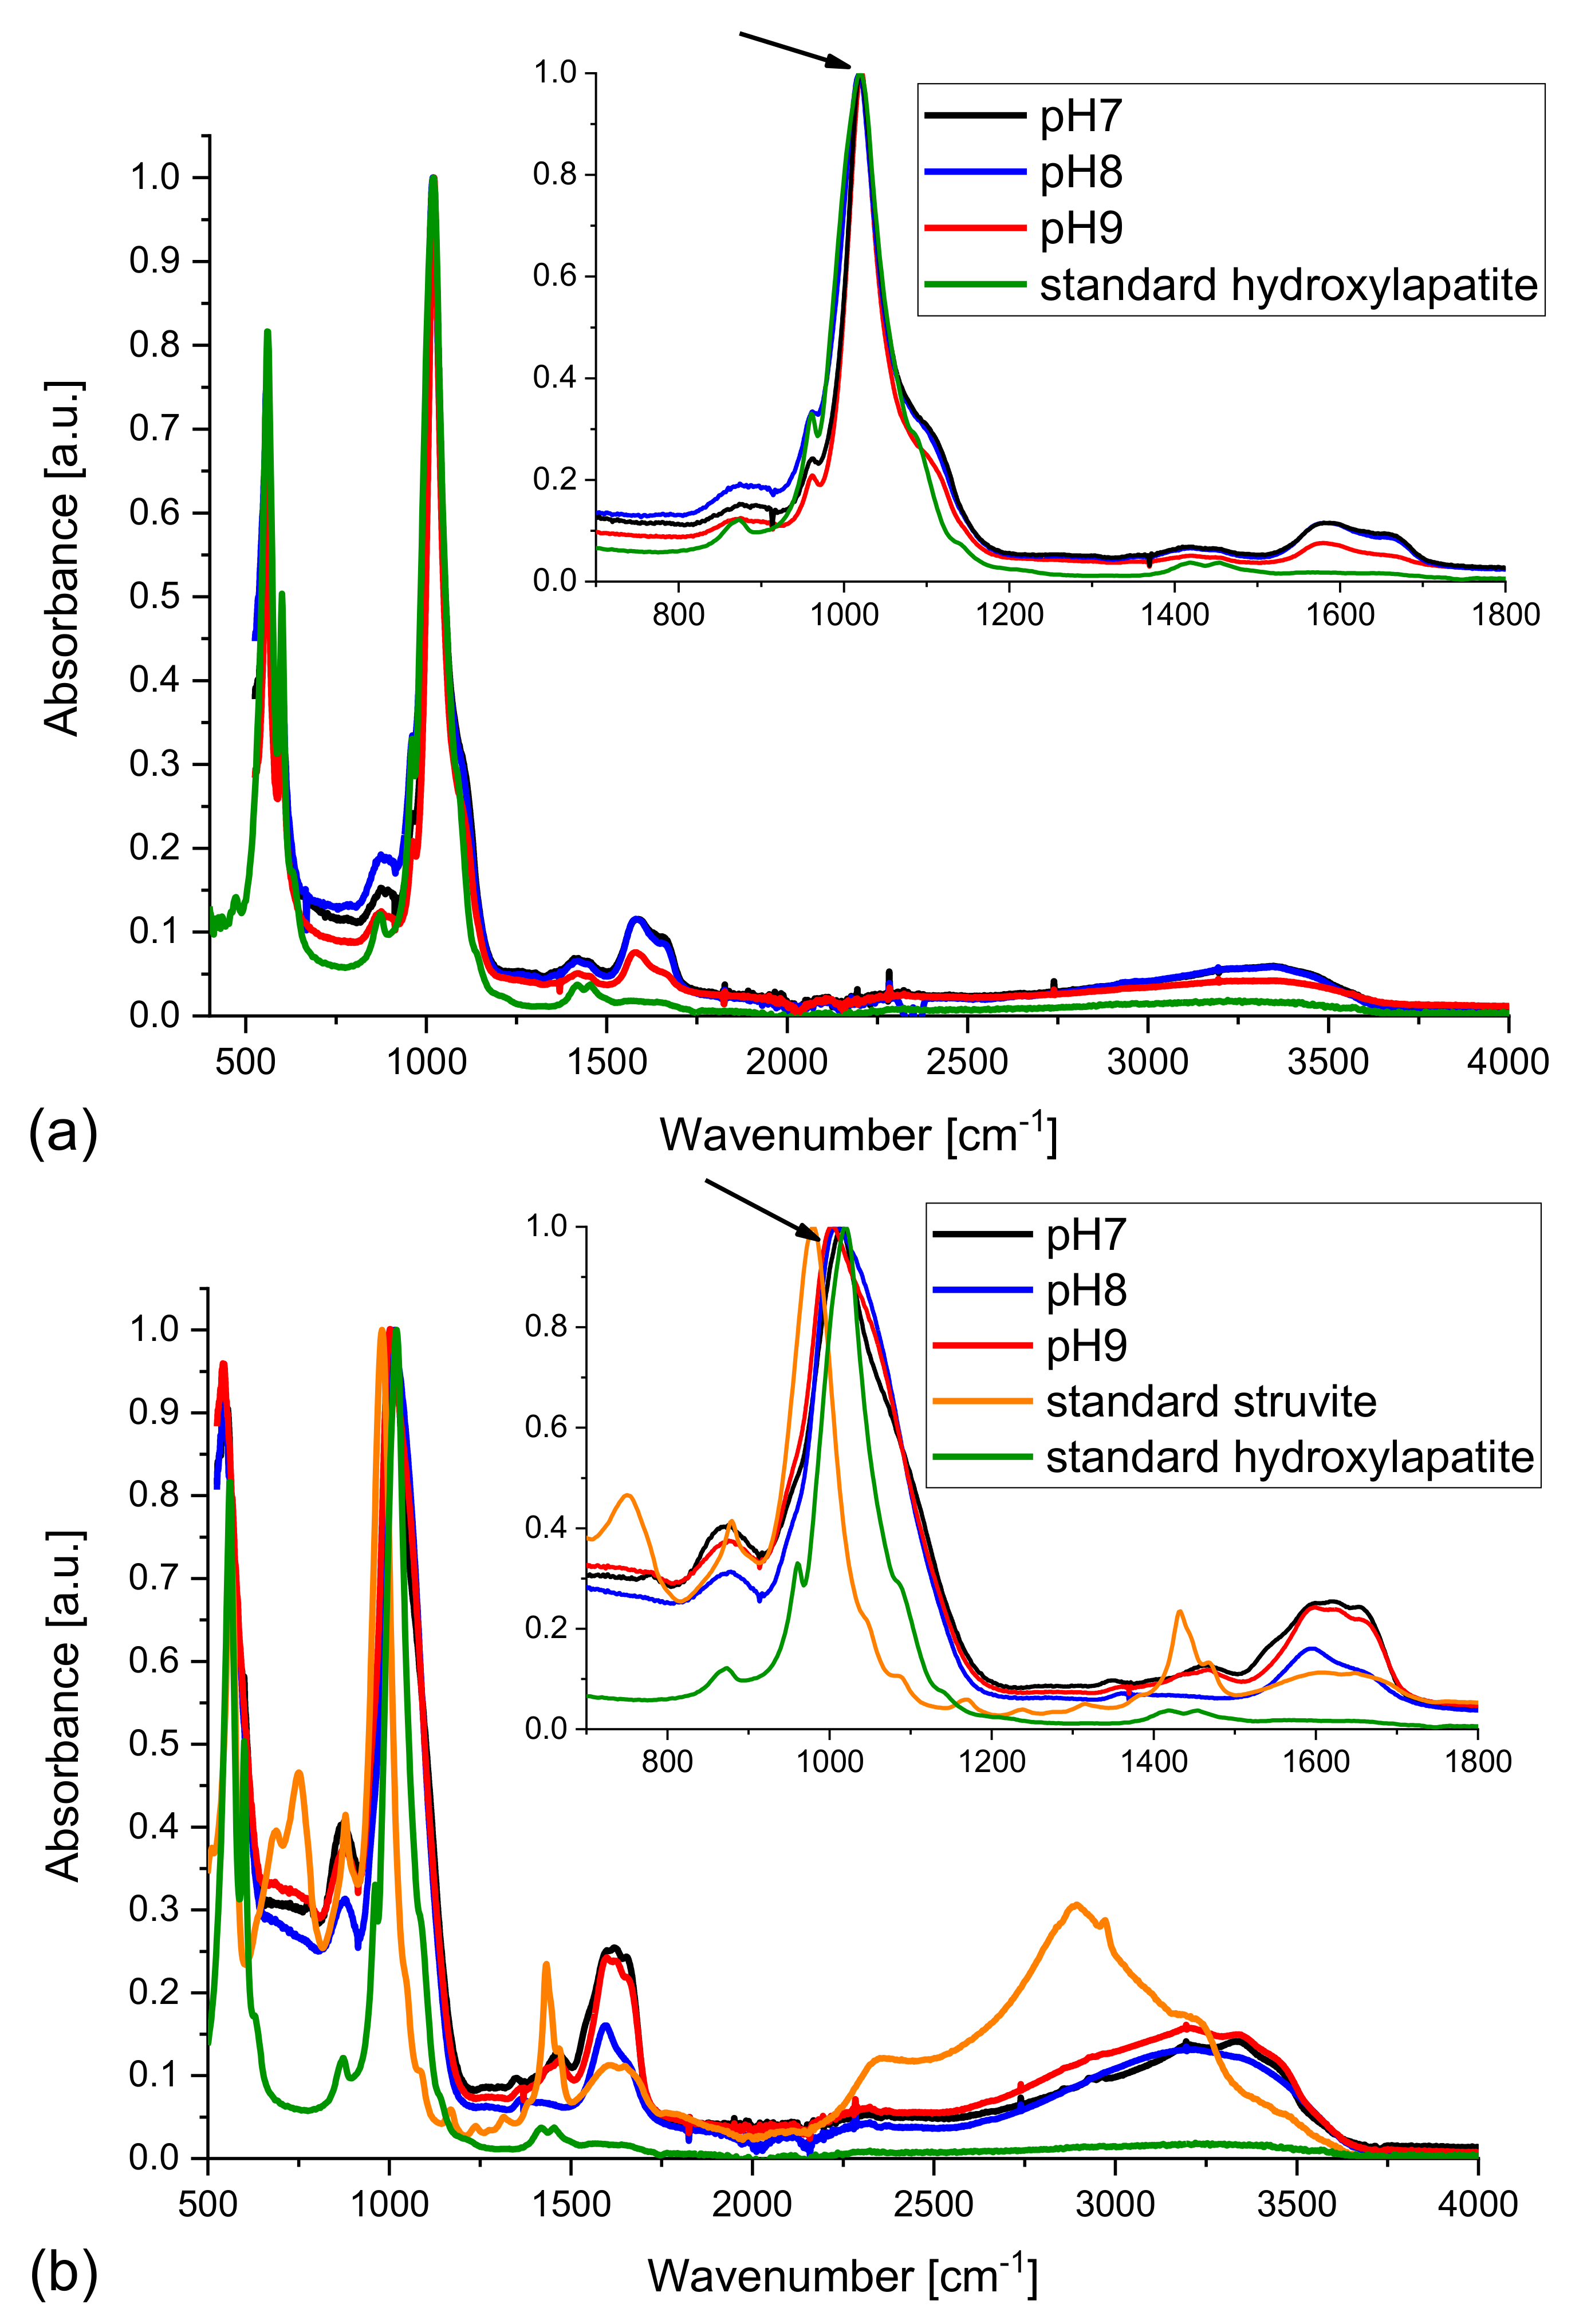
Figure 8 presents the FTIR spectra of the samples formed in the presence of bacteria, normalized to the maximum intensity.
Figure 8a presents the IR spectra of the samples obtained in the case of modified composition of artificial urine (magnesium chloride hexahydrate not added). The main peak of standard HAP at 1020 cm
−1 matches well the peaks of the samples examined. There is no displacement observed (
Figure 8a, inset, arrow). There are also peaks at 1590 and 1650 cm
−1 characteristic of the presence of carbonates, CO
32−. With increasing pH, these peaks become smaller. This fact confirms that at the smallest pH of 7 the highest amount of carbonates must be formed. All experiments were performed in water environment as the broad band with a maximum at 3250 cm
−1 is visible. The lower FWHM of the bands and some changes in the intensity of the lines characteristic of carbonates suggest that the sample at pH = 9 is partly crystallized, most probably containing hydroxylapatite (or apatite) and carbonate apatite.
The situation is a little bit different in the case of samples obtained from the artificial urine of normal composition (with magnesium chloride hexahydrate);
Figure 8b. Here one can see that the peak for 1020 cm
−1 characteristic of standard HAP is shifted towards smaller frequencies with increasing pH (
Figure 8b, inset, arrow). This shift can be explained by the appearance of struvite for pH higher than 7.2. The displacement of this peak is well visible in the inset of
Figure 8b. In other words, the peak is shifted towards the peak characteristic of struvite. One can also see the peaks characteristic of CO
32−. This proves the presence of carbonates in the sample. It means that at pH = 9, HAP, struvite, and carbonate phases co-exist, which is consistent with the results of previous Raman investigation. Taking into account that the positions of the peaks characteristic of HAP are not changed, it may be suggested that carbonate appears in the form of carbonate apatite. Santos and Clayton have shown that the vibrational bands of phosphorous ions in apatites shift with changes in the carbonate content [
47].
Summarizing, the vibrational spectra of the samples precipitated in the artificial urine of modified composition of artificial urine (magnesium chloride hexahydrate not added) are almost the same for all tested pHs. There are no essential differences with increasing pH. In the case of normal composition of artificial urine the differences between spectra for different pH are notable. Carbonates/carbonate apatite appears first, at pH = 7 and its amount decreases with increasing pH. Such a tendency is observed especially in the case of the presence of bacteria. With increasing pH the amount of HAP increases. Additionally, in the samples precipitated in artificial urine of normal composition, struvite is detected along with the phases containing HPO42− ions.
7. Chemical Speciation Analysis
In order to check the theoretical possibility of formation of HAP and/or CA in artificial urine, a chemical speciation analysis was performed using HySS [
28] and EQUIL [
29] computer codes. The ways of calculating the molar or percentage concentrations of various complexes in modified and non-modified artificial urine with the use of this computer software has already been presented in detail in earlier papers [
16,
17]. The starting point when using the HySS software is an introduction of the initial molar concentrations of all the components of urine (
Table 1) [
16,
17] and the values of stability constants of the complexes forming in urine [
16,
17]. The EQUIL program makes it possible to calculate stability constants for most complexes at a temperature of 37 °C while the values of –log
β stability constants of the complexes which are taken into account in the analysis have been already published [
16,
17]. However, in this study, apart from the aforementioned complexes [
16,
17] an additional assumption is made that hydroxylapatite complexes are formed in urine and their stability constant is −log
β = 38.97 [
30]. Such an approach permits determination of the molar and percentage concentrations of carbonate apatite and hydroxylapatite complexes, and also the range of pH in which they are formed.
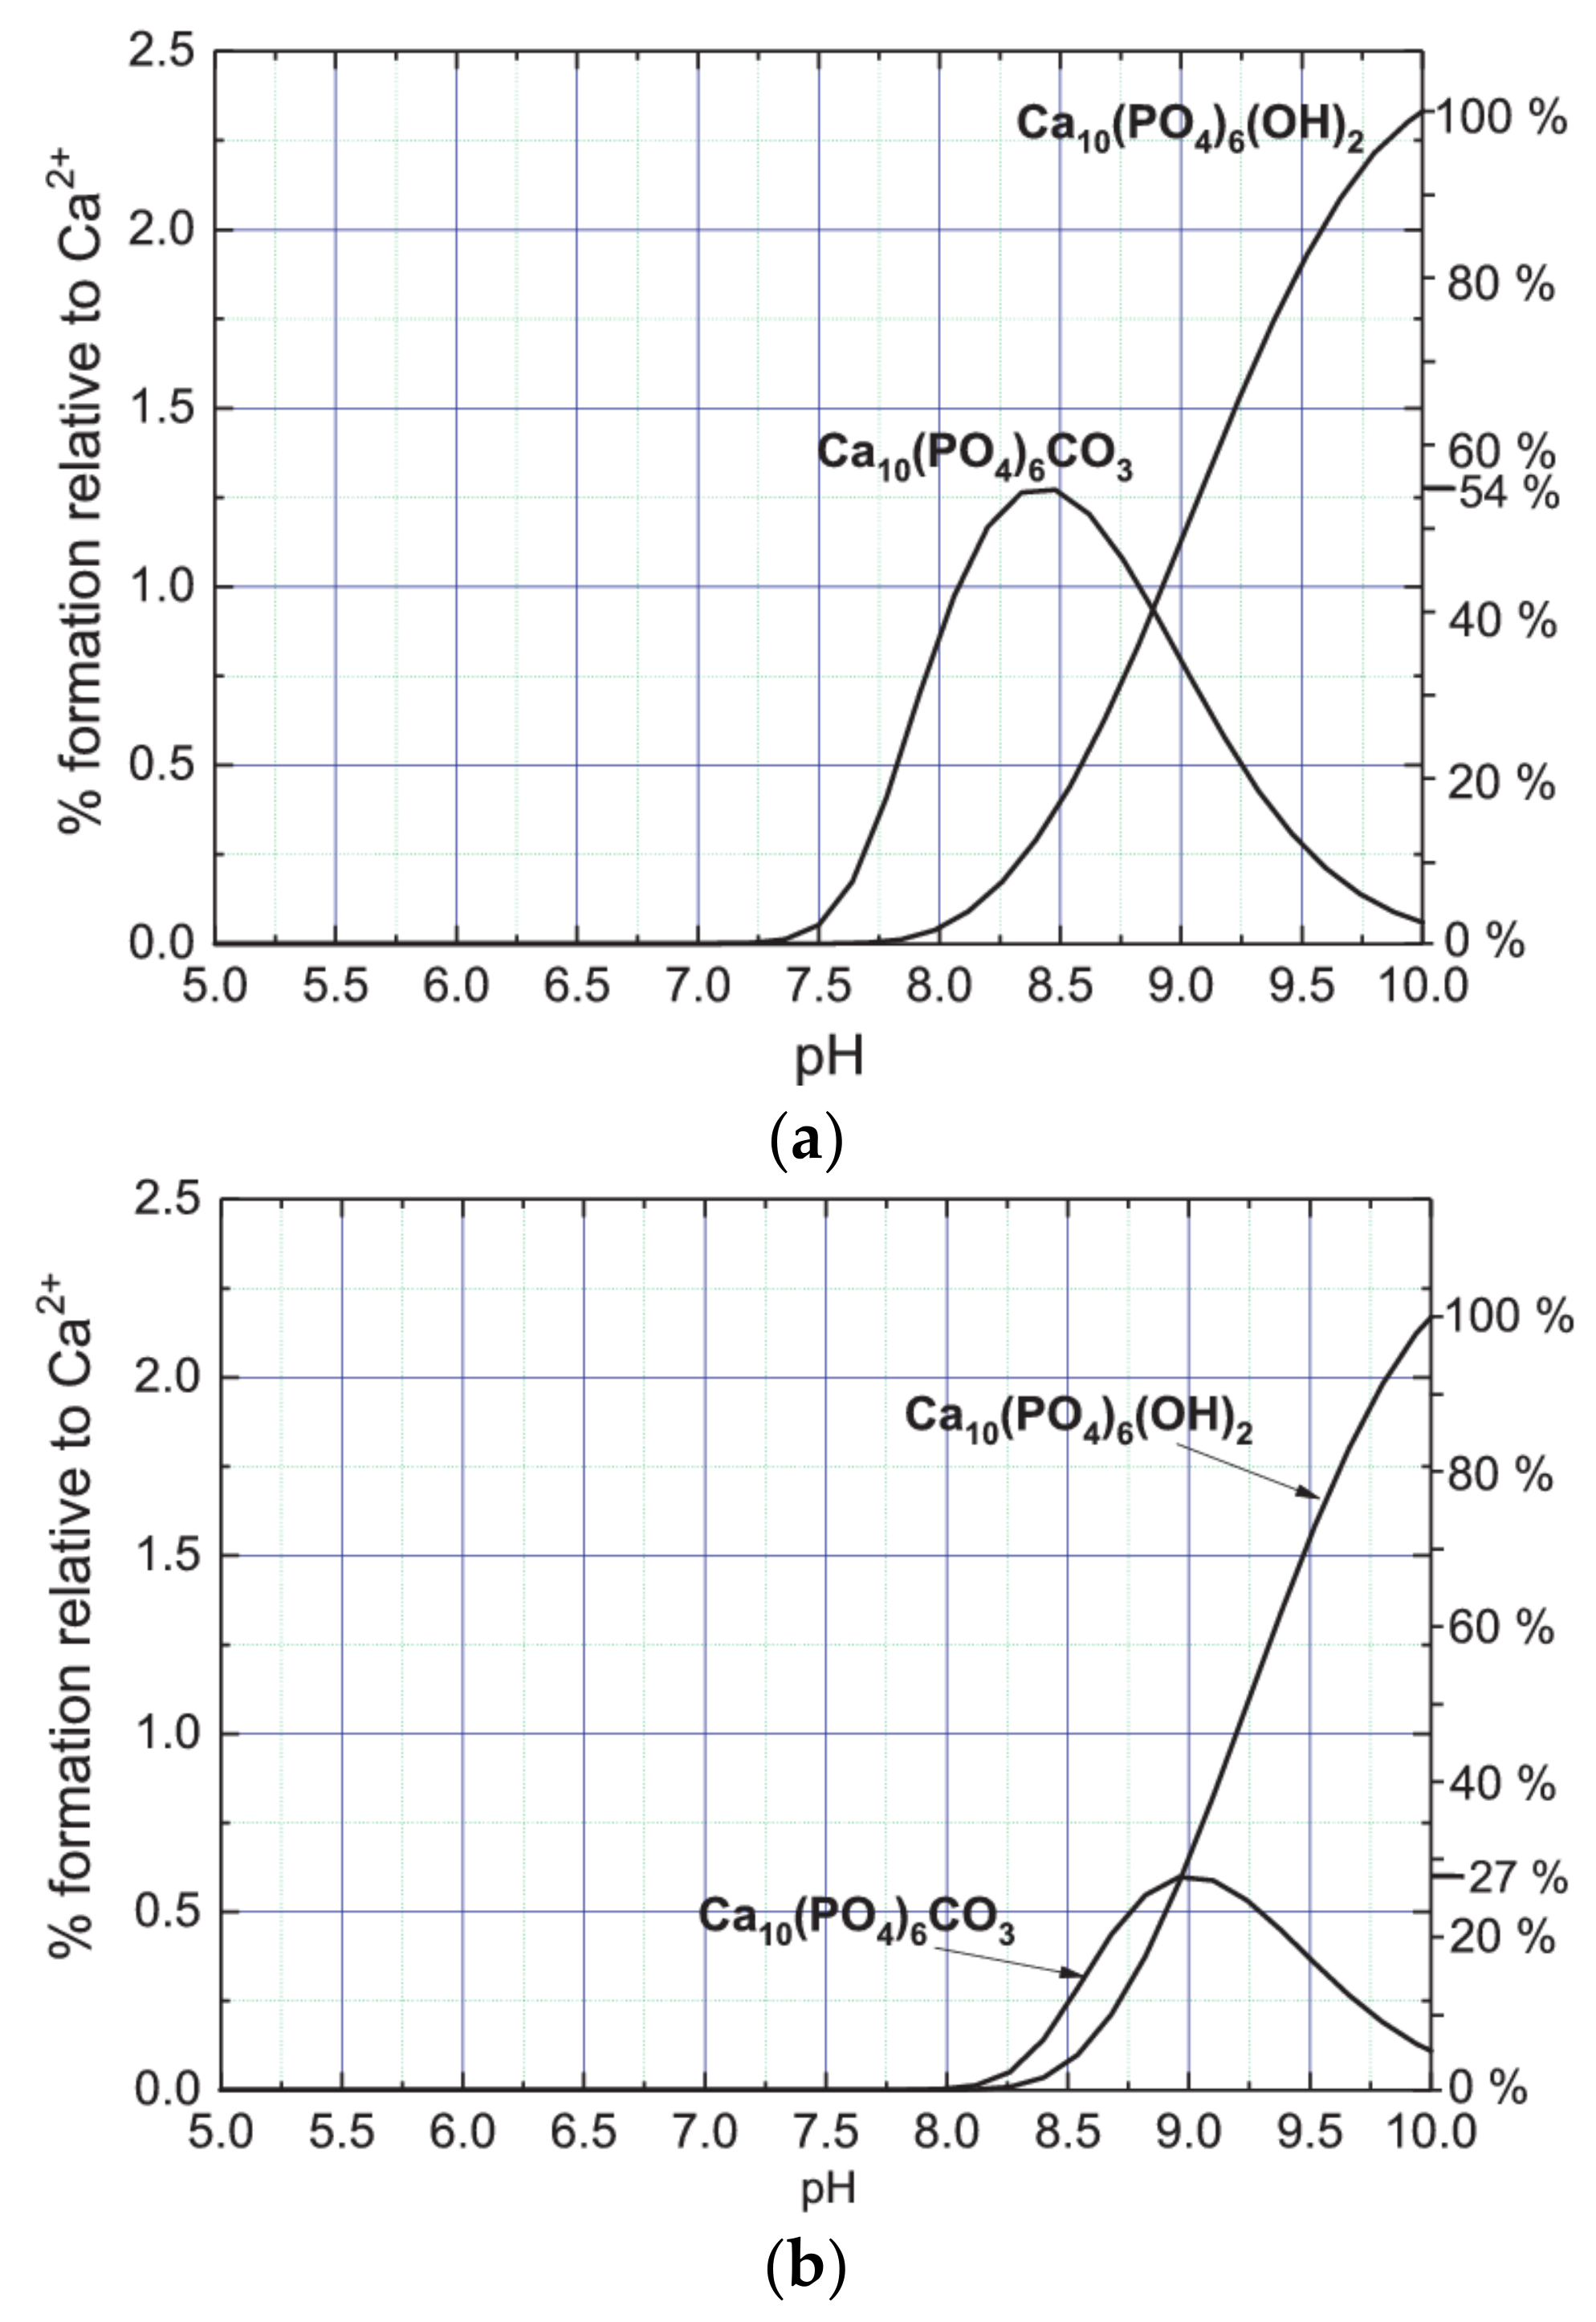
The results obtained of such a speciation analysis are presented in
Figure 9.
Figure 9a presents the percentage content of Ca
10(PO
4)
6CO
3 (CA complex) and Ca
10(PO
4)
6(OH)
2 (HAP complex) complexes depending on the pH of the artificial urine of non-modified composition. As follows from the data presented in
Figure 9a, a sudden increase in the concentration of Ca
10(PO
4)
6CO
3 complex is observed at pH 7.3. Then, with increasing pH, the concentration of this complex increases and reaches a maximum at pH 8.4. From the data presented in
Figure 9a it can be inferred that starting from pH 7.8, Ca
10(PO
4)
6(OH)
2 complex begins to form. With increasing pH, its concentration gradually increases, not reaching the state of saturation. The amount of CA formed is greater only for pH lower than 8.8. For pH 8.8, the amounts of CA and HAP formed are the same. For pH higher than 8.8 the amount of HAP systematically increases and for pH higher than 9.1 the amount of HAP exceeds the amount of CA. By comparing the maximum values achieved in the pH range up to 10, one can conclude that the maximum amount of CA complex formed is significantly lower than that of the HAP complex. Assuming the amount of HAP complex at pH = 10 as 100%, the maximum amount of CA complex is only 54% (
Figure 9a, right vertical axis). It is also worth noting that the CA complex is formed earlier (at lower pH) than the HAP complex. CA complex begins to form at pH 7.3 while HAP complex at pH 7.8. This conclusion is compatible with the results of Raman and FTIR investigation presented in paragraphs 5 and 6. For the sake of recollection, it was found that CA is formed before HAP.
Figure 9b presents the percentage content of Ca
10(PO
4)
6CO
3 (CA complex) and Ca
10(PO
4)
6(OH)
2 (HAP complex) complexes depending on the pH of the artificial urine of modified composition (without magnesium chloride hexahydrate). As follows from this figure, the formation of both CA and HAP complexes is shifted towards higher pH as compared to the case of non-modified urine. CA complex starts forming from pH 8.1 and HAP from pH 8.2. In addition, the amount of CA complex produced is considerably lower compared to non-modified urine. In the case of non-modified composition of artificial urine the maximum percentage content of CA complex relative to Ca
2+ is on a level of 1.25% (
Figure 9a), while in the case of modified composition of artificial urine on a level of 0.65% only (
Figure 9b). In the case of modified composition of artificial urine the relation between the maximum amounts of CA and HAP complexes is also different to that in the case of non-modified artificial urine. In the case of modified composition of artificial urine, assuming that the content of HAP at pH = 10 is 100%, the maximum amount of CA complex is only 27% (right vertical axis). According to these results, in the case of non-modified urine, the amount of forming CA is much higher. This observation may suggest that the appearance of solid phases with carbonate (CO
32−) requires the presence of magnesium. It is in agreement with literature data, for example in Refs. [
7,
48,
49,
50,
51] it is reported that magnesium affects the formation of HAP. The results obtained in this work suggest that this may also be the case for CA. In addition, our results suggest that the presence of magnesium (non-modified urine) is responsible for the formation of both HAP and CA at lower pH. Accurate determination of the effect of magnesium on the formation of CA and HAP requires analysis of chemical complexes formed in the urine in the presence of Mg and without Mg and chemical equilibria between them. However, this issue goes beyond the scope of the presented work.
The formation of CA in artificial urine runs according to Equation (3). Let us analyze what could be the reaction for HAP formation. In the urine of non-modified composition the synthesis of hydroxylapatite begins from pH 7.8. As shown in Ref. [
17], in the pH range in which hydroxylapatite can be formed, calcium ions Ca
2+ are present as free ions and in a form bounded in various complexes including such dominating complexes as CaSO
4, CaHPO
4, CaCit
−, CaPO
4− or CaOH
−. Additionally, the phosphate groups within the pH range from 7 to 10 are present mainly in the form of HPO
42− complexes [
17], and when the pH >10 they occur as PO
43− anions [
17]. These particular ions and complexes can become potential substrates for hydroxylapatite forming in the urine. Finally, the following reactions of hydroxylapatite formation can be proposed:
where the abbreviation Cit in the names of complexes stands for citrate group, C
6H
5O
7.
8. EDX Analysis
From the analysis carried out so far it appears that CA and HAP are present in the analyzed precipitates. At the same time the research shows that in artificial urine non-stoichiometric CA and HAP can form, in which Ca
2+ ions are replaced by Na
+, and OH
− and/or CO
32− groups by Cl
− ions. In order to check the atomic composition and the percentage of elements of the precipitate formed in artificial urine we performed EDX measurements. The tested samples were obtained in artificial urine of modified composition at pH of 9. The examined samples are shown in
Figure 1d,e. The obtained results are presented in
Table 2 (experimental results). The experimental results (see
Table 2) are mean values from several measurements. At the beginning it should be noted that the amount of carbon is overestimated for two reasons. Firstly, the samples were tested on a carbon substrate; and secondly, the collimator of the device is made of carbon which can give an additional signal.
In order to determine which chemical compounds can form a precipitate of the specific atomic composition, theoretical calculations were performed. The calculation procedure includes: (1) calculation of the starting composition of the sample on the basis of the above mentioned experimental results; (2) the calculation of percentage content of each element in the starting composition; and (3) comparison of the results with those obtained by the use of the EDX method. The results of calculations are presented in
Table 2; cases 1–4. In case 1 it is assumed that Ca
10(PO
4)
6(OH)
2 (HAP) and Ca
10(PO
4)
6CO
3 (CA) are formed at a molar ratio of 1:1. One can see that in this case the content of calcium (Ca) is higher than given by the experimental data. The overestimated calcium amount suggests that CA and HAP may precipitate with calcium deficiency. Therefore, case 2 shows CA and HAP with deficiency of calcium in the forms: Ca
10−x(PO
4)
6(OH)
2 and Ca
10−x(PO
4)
6CO
3 (where
x = 2 and means that Ca
2+ ion deficiency is compensated by 4 Na
+ ions incorporated into the structure of CA and HAP). It is assumed that these two compounds are formed at a molar ratio of 1:1. In this case, the contents of calcium, oxygen, and phosphorus are consistent with the experimental EDX results. However, it should be noted that the EDX results do not confirm the presence of sodium, although the presence of Na
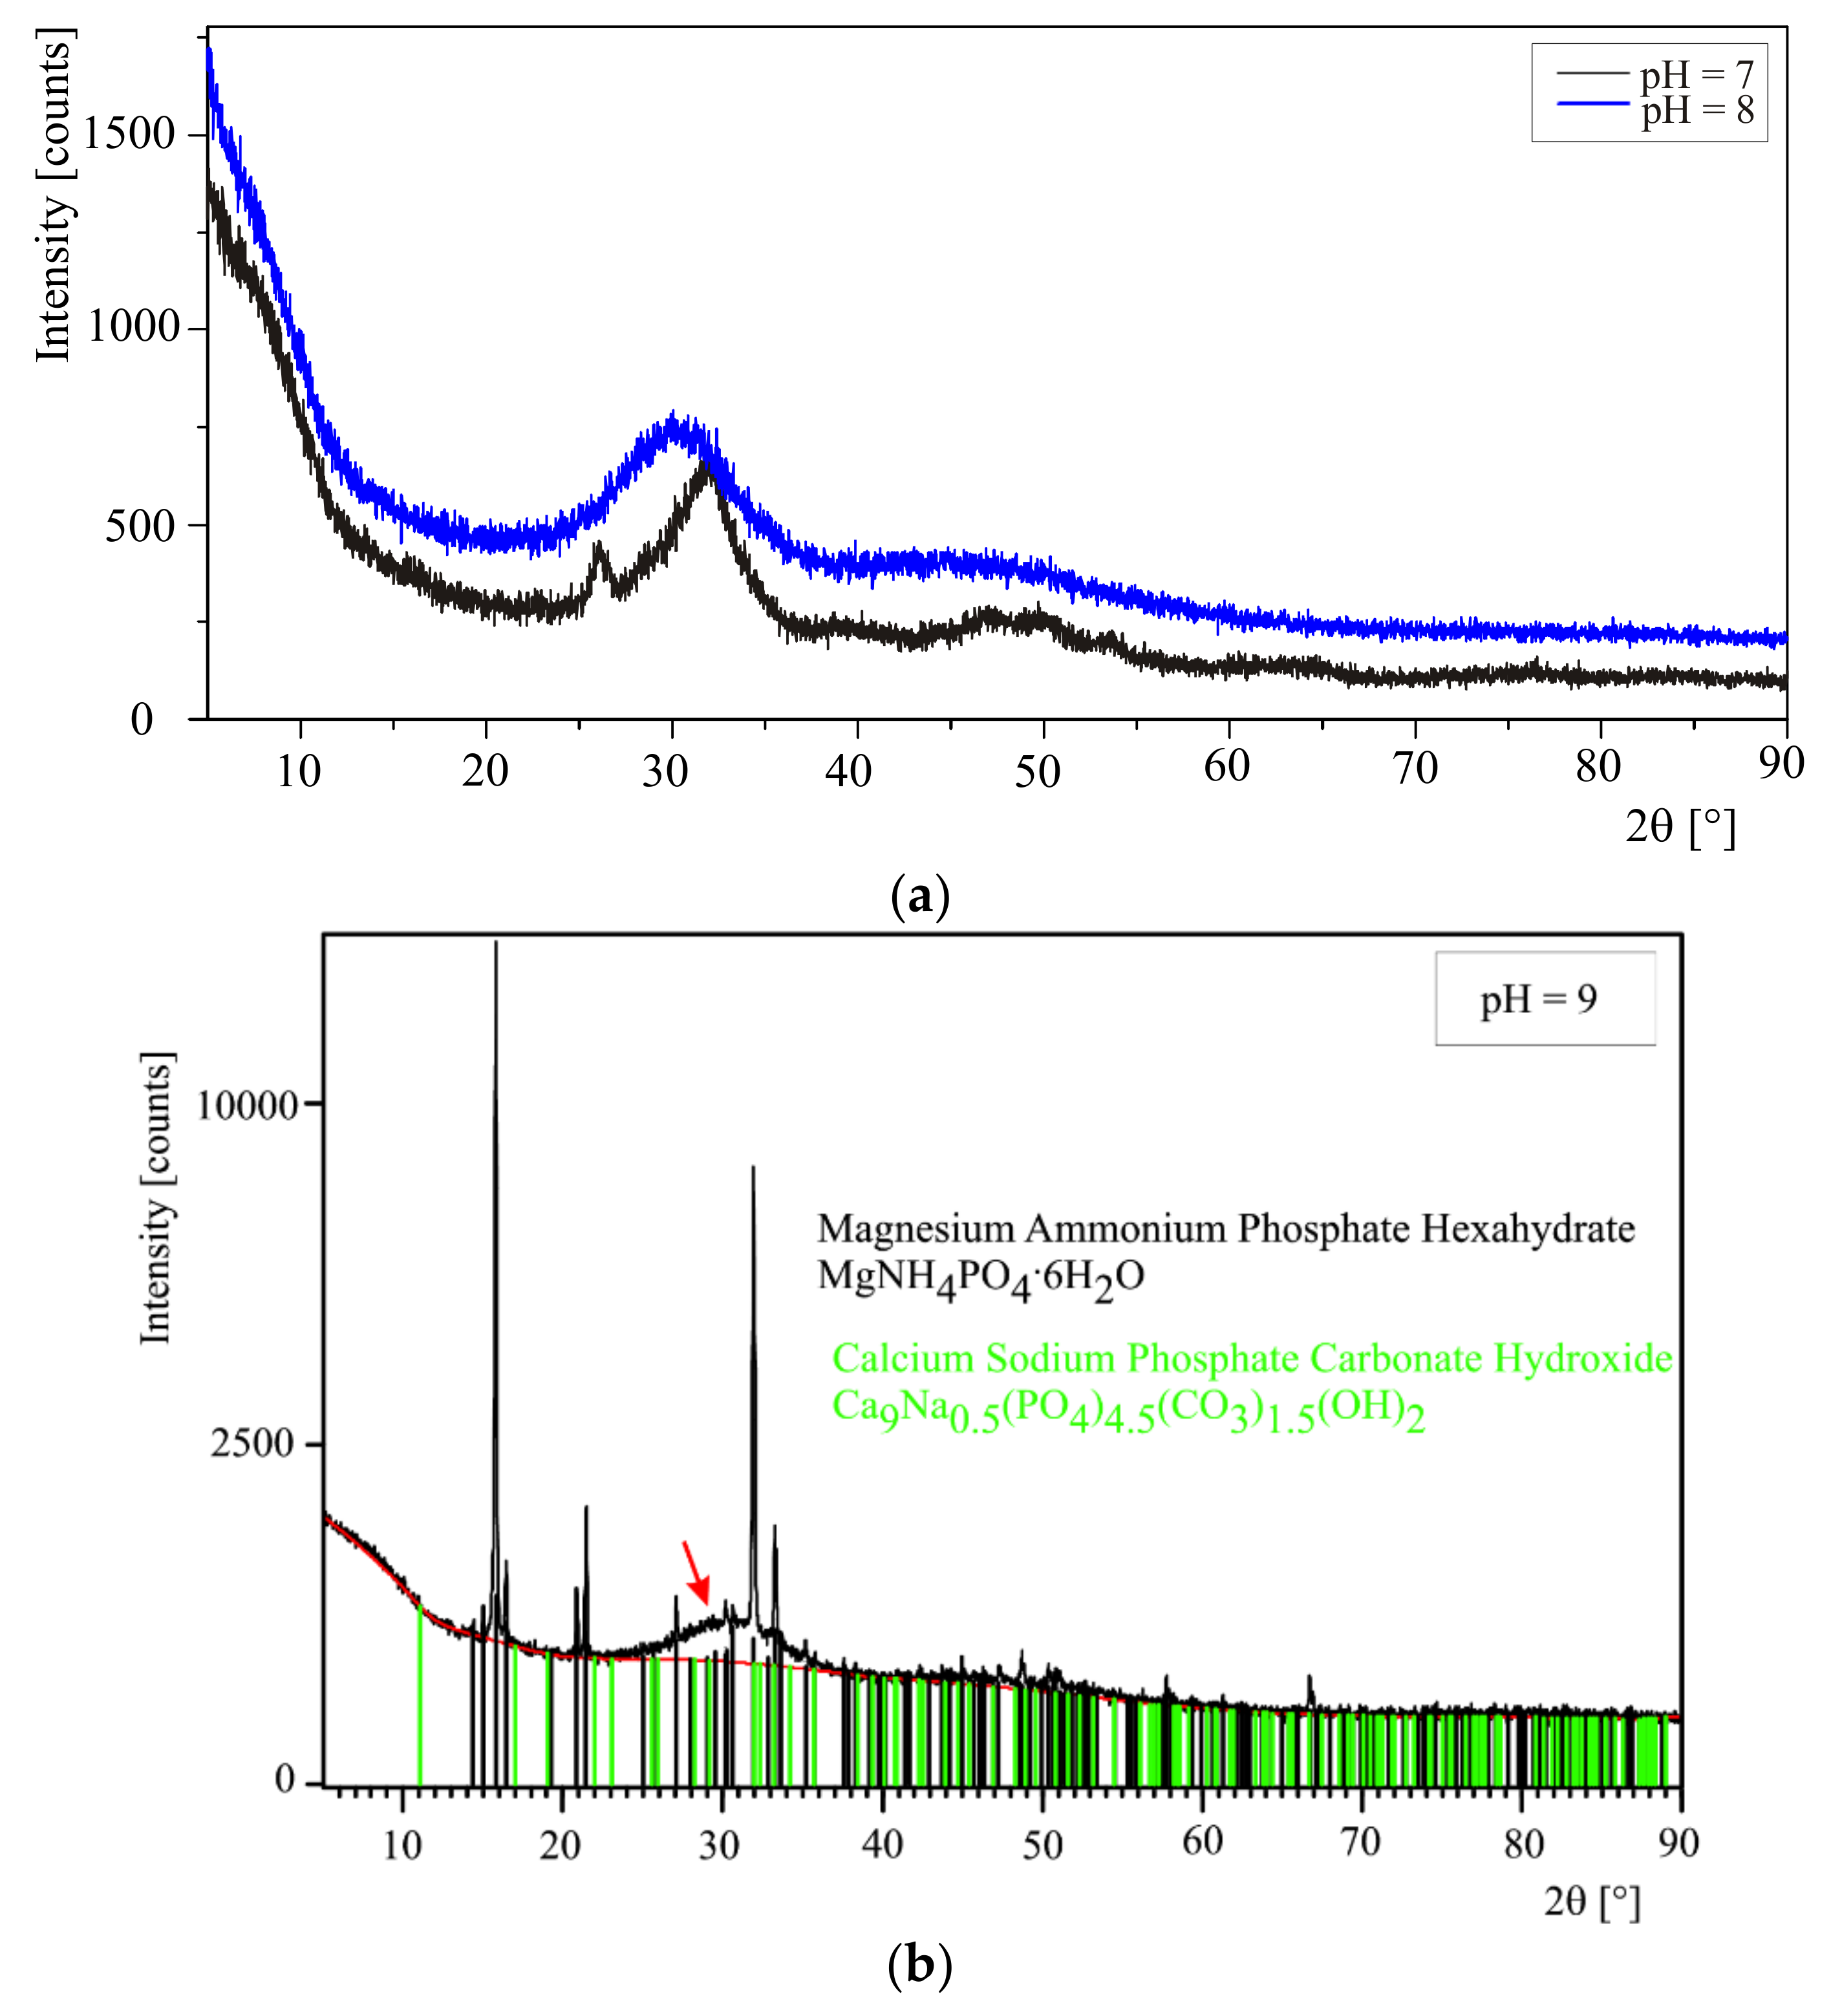
+ in the CA and HAP structure was confirmed by the XRD method (
Figure 3b).
In case 3, it was assumed that Cl− ion is introduced instead of OH− or CO32− group. In such a way one gets a mixture of three compounds: Ca10−x(PO4)6(OH)2, Ca10-x(PO4)6CO3, and Ca10−x(PO4)6Cl2 at a molar ratio of 1:1:1. However, it should be noted that if OH− and CO32− are actually replaced by Cl− ion, this is not the case for all molecules because the amount of Cl− is too high when compared with experimental results. Therefore, in case 4 it is assumed that a mixture of three compounds: Ca10−x(PO4)6(OH)2, Ca10−x(PO4)6CO3, and Ca10−x(PO4)6Cl2 is formed, however only 10% of mass of this sample is in the form of Ca10−x(PO4)6Cl2. In this case, the amount of Cl agrees with the experiment.
As follows from the comparison of the calculations for the above four cases with the experimental values, the tested samples contain CA and HAP. However, part of the CA and HAP precipitates with calcium deficiency (case 2). In addition, some of the OH− groups and CO32− ions are replaced by Cl− ion and thus chlorapatite (Ca10−x(PO4)6Cl2) is formed. These results are compatible with XRD results which show that non-stoichiometric HAP and/or CA may be formed. Non-stoichiometry lies in the fact that the respective ions, such as Na+ or Cl−, substitute for the Ca2+, OH− groups and/or CO32− ions in HAP and/or CA.
It should also be taken into account that CA and HAP may exist in amorphous form as amorphous calcium carbonate (ACC) and amorphous calcium phosphate (ACP), respectively. The existence of amorphous carbonated calcium phosphate (ACCP) is also possible [
24].
9. Conclusions
The results presented in this article demonstrate that CA, HAP and/or non-stoichiometric CA and HAP with different ion substitutions for PO43−, CO32−, and OH− groups are formed in the artificial urine of modified (without Mg2+ cations) and non-modified compositions. The results demonstrate also that non-stoichiometric CA and HAP can be formed with calcium deficit. In such a case, the XRD result indicates that calcium Ca2+ ions are replaced by sodium ions Na+. Specifically, the presence of chlorapatite, Ca10(PO4)6Cl2, and calcium sodium phosphate carbonate hydroxide, Ca9Na0.5(PO4)4.5(CO3)1.5(OH)2, is found. All of these compounds exhibit poor crystallinity. In addition, XRD and Raman results indicate the presence of amorphous phases. These may be amorphous calcium carbonate (ACC), amorphous calcium phosphate (ACP), and/or amorphous carbonated calcium phosphate (ACCP). It is suggested that the amorphous phases may exist as precursors of crystalline phases.
The theoretical speciation analysis shows that in the case of modified urine (without magnesium chloride hexahydrate) the amount of CA formed is much smaller than in the case of non-modified urine. In addition, in the case of non-modified urine, the formation of both CA and HAP is shifted towards lower pH values compared to the case for modified urine. In both cases, for the modified and non-modified urine, CA is formed first (at lower pH) and then HAP (at higher pH). Additionally the amount of CA is the dominant phase at low pH, while HAP is the dominant phase at pH = 9. These conclusions, resulting from the theoretical speciation analysis, are also confirmed by the spectroscopic analysis. Differences in the formation of CA and HAP in modified and non-modified urine indicate that the presence of magnesium is crucial for the formation of these phases.


