Small Polaron Hopping in Fe:LiNbO3 as a Function of Temperature and Composition


1
Dipartimento di Fisica e Astronomia, Università di Padova, via Marzolo 8, 35131 Padova, Italy
2
School of Physics, Osnabrueck University, Barbarastrasse 7, 49076 Osnabrueck, Germany
*
Author to whom correspondence should be addressed.
Crystals 2018, 8(7), 294; https://doi.org/10.3390/cryst8070294
Submission received: 11 June 2018
/
Revised: 12 July 2018
/
Accepted: 13 July 2018
/
Published: 18 July 2018
(This article belongs to the Special Issue Lithium Niobate: Bulk Crystals, Composites, Thin Films and Nanocrystals)
Abstract
:Small-polaron hopping involved in charge transport in Fe-doped congruent lithium niobate is investigated as a function of temperature and composition by means of light-induced transient absorption spectroscopy. The relaxation dynamics of the light-induced polaron population is characterized by individual activation energies within different temperature ranges. A numerical investigation carried out by Monte Carlo simulations reveals that these findings may be understood in terms of the varying abundance of the different types of hops that the polarons may perform among regular or defective lattice sites. The role of the temperature and of the sample composition on the distribution of the different hop types is thus explored for a wide range of parameters, allowing one to preview the charge transport properties for a given set of experimental conditions.
1. Introduction
The study of small-polaron charge transport is emerging as a hot topic for the important ferroelectric crystal lithium niobate (, LN). In the field of nonlinear, ultra-fast and integrated optics, it is the physical mechanism determining how photo-excited charges redistribute in the material, giving rise to internal space charge fields that affect, via the electro-optic effect, the interaction of the material with laser beams [1,2]. This is the origin of the so-called optical damage that often constitutes a major problem for laser applications. On the other hand, in photorefractive optics and holography, those mechanisms allow for low-intensity optical interaction and for recording of high fidelity optical gratings and real-time holograms [3]. In analogous materials, polaron formation and transport play a key role as well in a number of important applications such as ferroelectric photovoltaics [4,5,6] and in oxide catalysis [7,8,9].
As demonstrated in [10], by increasing the temperature and/or changing the sample composition, the conduction of LN increases by orders of magnitude, canceling out any photo-generated internal field. Analogous effects may be obtained by doping the crystal with the so-called Optical Damage-Resistant Ions (ODRIs) such as Mg, Zn or Zr. This is obviously of great importance for practical applications because it allows one to control the material response against light. However, to date, there has not been a quantitative interpretation of those phenomena in terms of polaron transport, so that it appears mandatory to check the dependence of the above-mentioned properties in this framework.
Polarons are quasiparticles made up of an electrical charge that, by the interaction with the polar crystalline environment, is able to distort the neighboring lattice, creating a local potential well. As a net result, the particle becomes self-localized. If the confinement effect is strong, the charge is concentrated on a single lattice site (small strong-coupling polaron) and moves by randomly hopping among different sites in response to lattice thermal motion. The hopping frequency of the polaron can be computed by the Marcus–Holstein theory [11,12,13]. In an ideal, defect-free material, the polaron mobility can be then calculated using the standard Einstein relation [14]:
where e is the elementary charge, d is the characteristic hopping length (here equal to the anionic distance), is the thermal energy and U is the hopping barrier, which in standard polaron theory is equal to one half of the polaron energy . The term is thus the hopping frequency among equally-spaced identical sites. The pre-factor can be also obtained by the Marcus–Holstein theory, as will be explained in the following.
Unfortunately, in real materials, this situation is hardly realized: standard LN crystals of congruent composition contain a high density of point defects, such as the substitutional “antisite” defect or the Li vacancy , bothextrinsic (dopants or impurities). Those defects constitute preferential sites for the formation of polarons, so that three types of small electron polarons are intrinsically recognized in LN [15]: the free polaron FPforming on regular sites; the bound polaron GPforming on antisite defects ; the bipolaron BP, which is a combination of a free and of a bound polaron on neighboring sites . LN may also host holes, created when energetic photons capable of band-to-band excitation are involved. In this case, hole polarons HPare formed. Finally, impurities with two valence, states such as the prototypical case of , have the possibility to capture an electron with a potential that is a mixture of Coulomb attraction and polaronic lattice deformation. Those charged defects can be described in the polaron formalism, as well [15]. The energy barriers for hopping processes involving those sites are quite different from each other, so that there now is a set of possible activation energies instead of a single one. Moreover, the term in Equation (1) depends on the distance between the hopping sites, and if direct hopping among defective sites is considered, this may entail an anomalous diffusion regime for which Einstein’s relation is no longer valid [16]. As a consequence, the relation (1) cannot be used in real crystals. Nevertheless, in recent works [17,18], it was shown that by an appropriate choice of a few microscopic parameters, the problem can be tackled numerically by resorting to Monte Carlo simulations incorporating the presence of defects in the lattice structure of LN. In line with those studies, one may expect that depending on the temperature and composition of the crystal, one type of hop may dominate the transport process.
The aim of this work is thus to quantify the number and type of hops among the different polaronic centers upon variation of the temperature and composition. We will focus on the case of Fe doping in LN, because here, we can assume that, under the experimental conditions used, all the charges are generated by photoexcitation of centers. This allows us to neglect the presence of hole polarons (that would have been present in undoped material [19]) for which the polaronic parameters are not well known yet. At the same time, can be assumed to be the sole deep trap state. The situation herein addressed is of practical importance because it corresponds to the typical situation encountered in photorefractive experiments. The problem is attacked both experimentally and numerically. Transient absorption data are collected as a function of temperature to provide direct evidence of a change in the activation energy of the transport, hinting at the activation of different hopping processes with temperature. The situation is then explored in greater detail with the help of a dedicated simulation software based on the Monte Carlo approach.
2. Experiment
2.1. Samples
Three Fe:CLN crystal boules were Czochralski-grown at the University of Padova mixing together congruent (Sigma Aldrich, St. Louis, MO, USA) and powders, with Fe contents in the melt of 0.02%, 0.05% and 0.1% mol, respectively. Being grown in congruent conditions, the Li/Nb ratio of the final crystals was assumed to be 0.94 (neglecting the compensation of intrinsic defects by Fe impurities). We verified that small deviations from this value and yet below the typical compositional uncertainties of the samples produced in our laboratories had no effect on the results presented in the following paragraphs. Parallelepipeds cut from these crystals were optically polished. The sample with the highest doping level was chemically reduced under a mixture of atmosphere at for several hours. The absorption coefficient at 532 nm was measured for samples Fe:LN 0.02 mol % and Fe:LN 0.05 mol %, from which the concentration was obtained [20]. For sample Fe:LN 0.1 mol %, instead, due to the high absorption level, we preferred to use the datum at 1128 nm [21] from which the concentration was also deduced. The total Fe content was assumed for simplicity to be the same as in the melt, and the concentration was obtained by the difference. The samples compositions are given in Table 1.
2.2. Transient Absorption
The polaron decays were studied by light-induced Transient Absorption Spectroscopy (TAS) using the setup described elsewhere [22,23] based on a Q-switched, frequency-doubled Nd:YAG laser at a wavelength of nm with a pulse duration of ns and a maximum pulse energy of mJ. The pump intensities in the various experiments were adjusted to maximize the signal to noise ratio of the experimental decay: for Fe:LN 0.02 mol %, I ∼ 60 MW/cm; for Fe:LN 0.05 mol %, I ∼ 200 MW/cm; and for Fe:LN 0.1 mol %, I ∼ 40 MW/cm. Four ordinarily-polarized continuous-wave probe lasers enabled a time-resolved detection of changes in the absorption simultaneously at different wavelengths ( nm, 488 nm, 785 nm and 633 nm or 1310 nm). The sample temperature was set by a cryostat equipped with four plane-parallel optical windows for all-optical access.
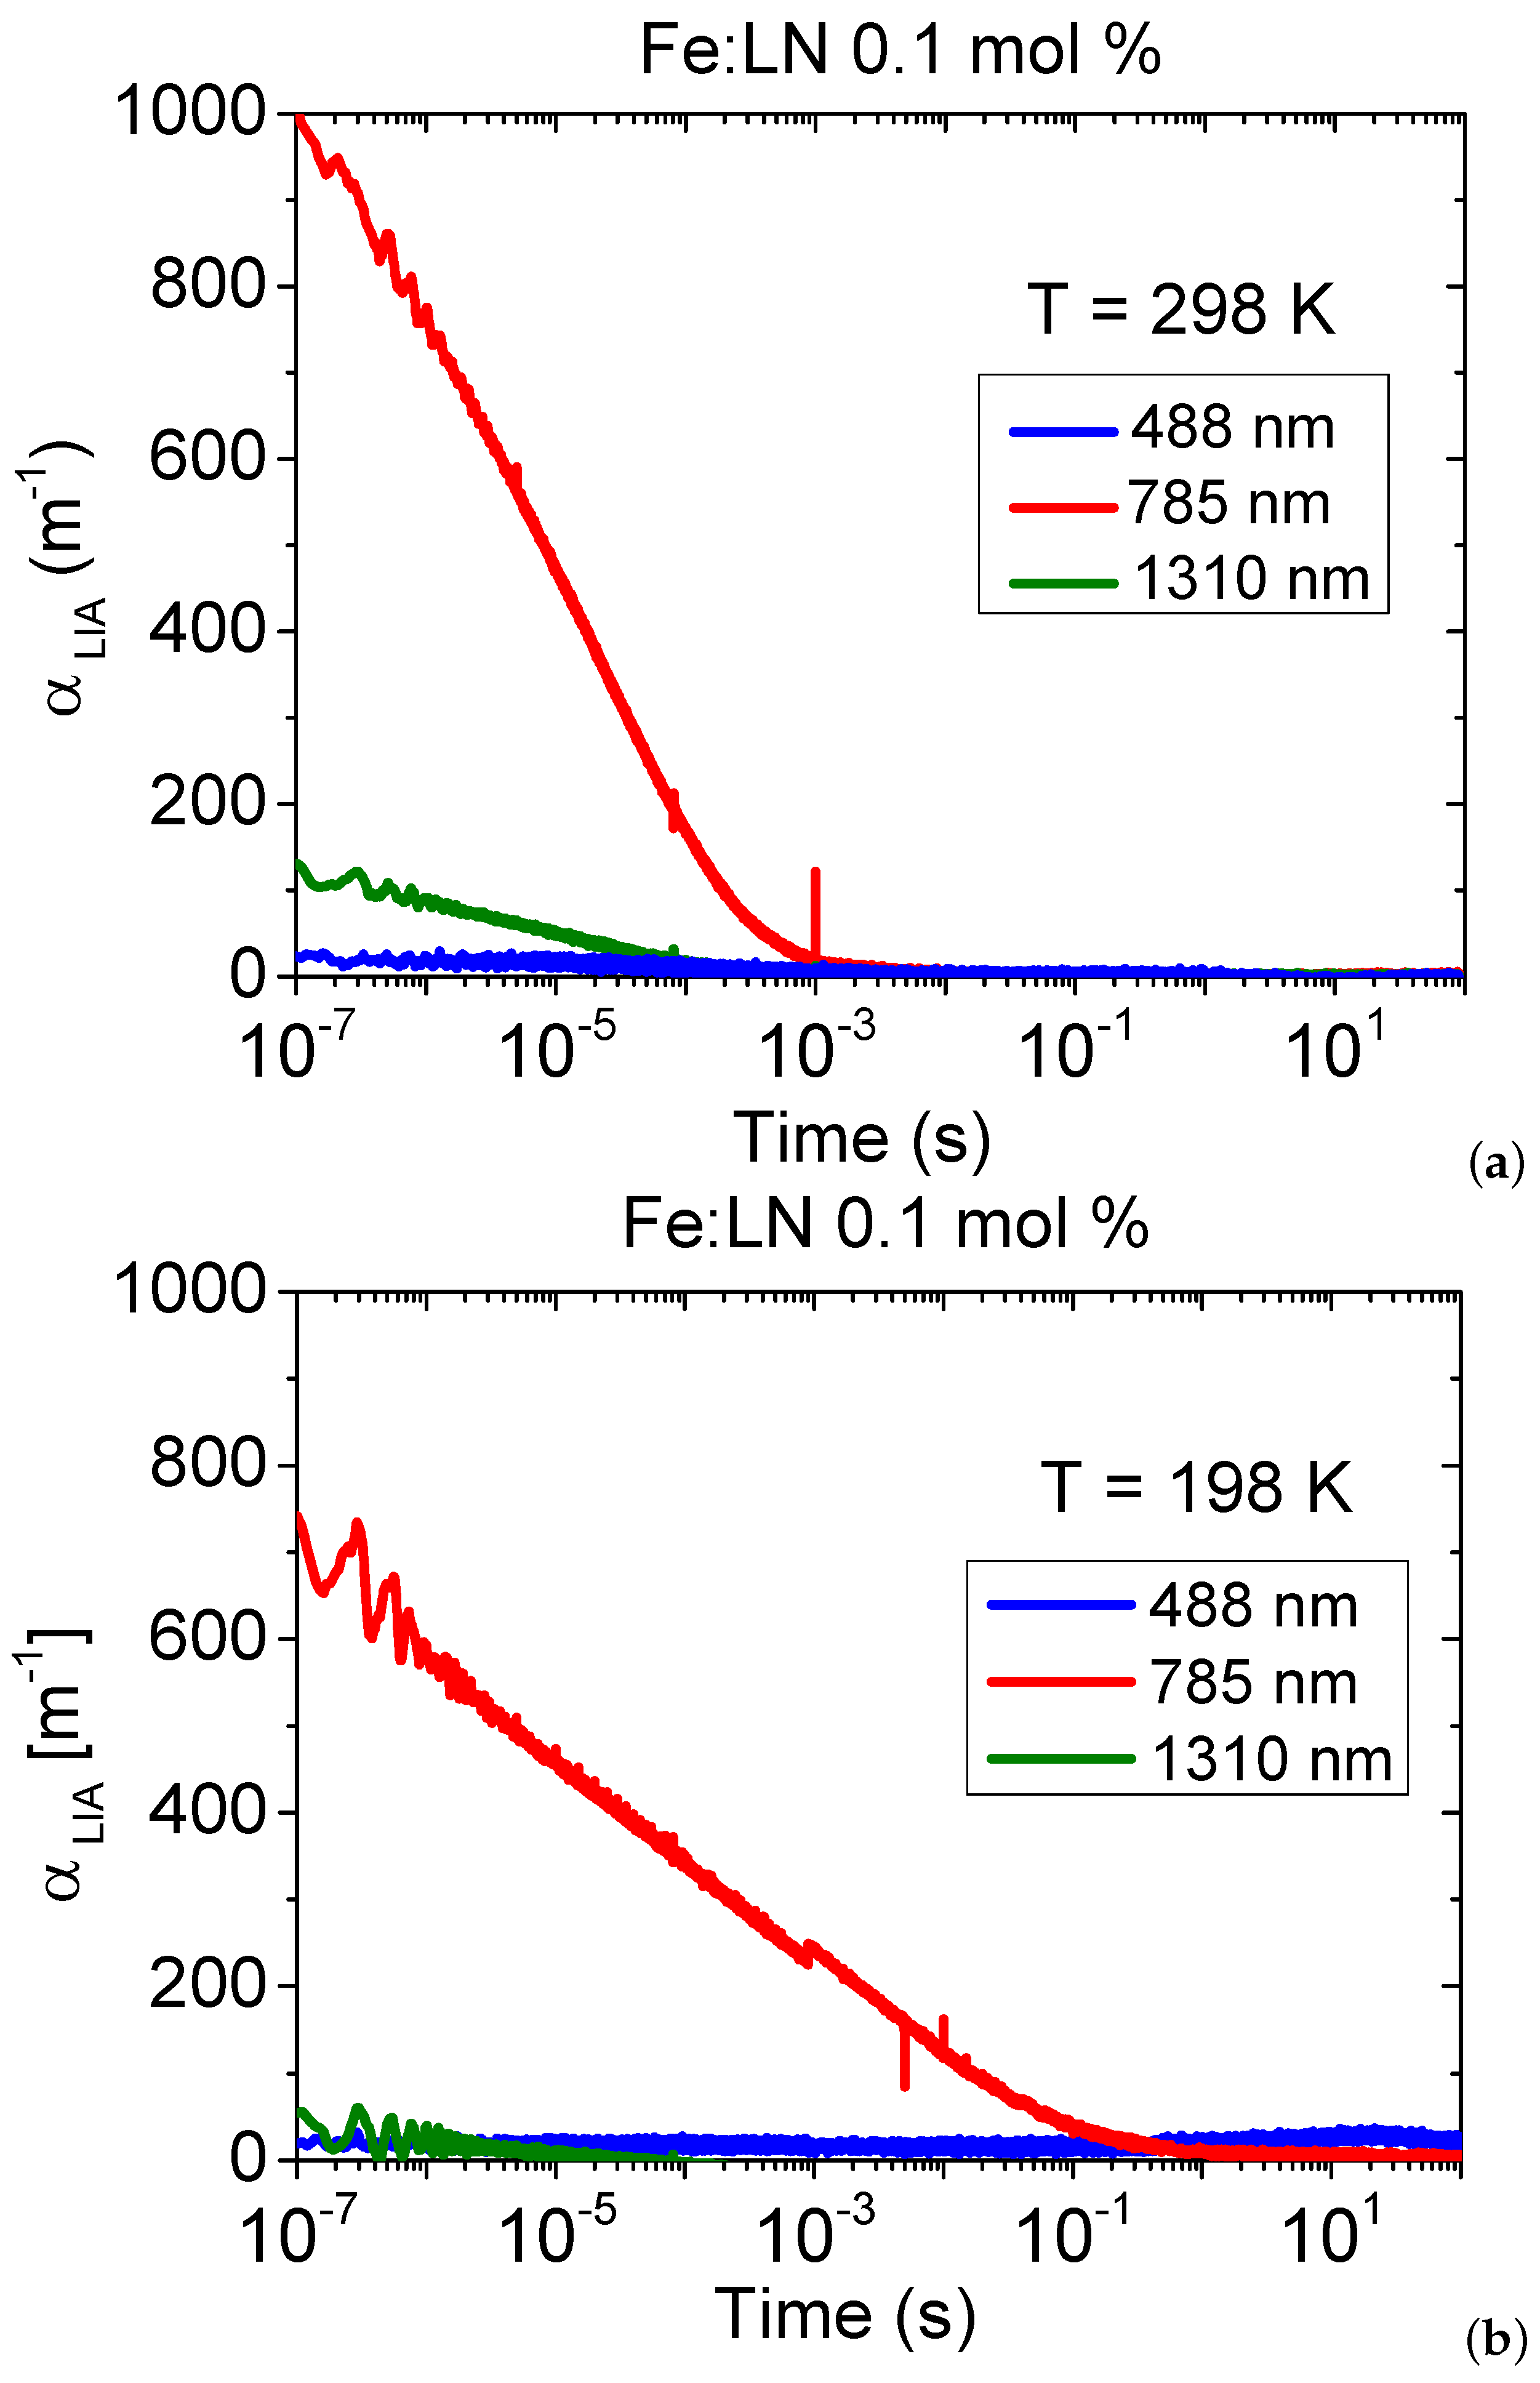
In Figure 1, typical TA measurements obtained on sample Fe:LN 0.1 mol % are shown at and , probing simultaneously the transient absorption at different combinations of the wavelengths: .
All the data demonstrated the previously-reported behavior [22,23]: after the pulse, a marked increase of the absorption was detected for some of the probe wavelengths, which decay to their dark value after some time, with a dynamics that depends on the probe. The signal at 785 nm was attributed mainly to bound polaron absorption, in view of the spectral dependence of the polaron cross-section, and to a minor extent, to the absorption tail of the free polaron at this wavelength. In the following, we will therefore consider that this signal is essentially proportional to the instantaneous concentration of GP decaying towards Fe traps, with a possible correction for the presence of free polarons. Similar considerations indicated that the signal at 1310 nm can be attributed essentially to free polarons with a contribution due to the bound polarons’ absorption. The initial amplitude of the TA signal in the red/infrared correlated directly with the concentration present in the samples (see Table 1), suggesting that was the main source for photoexcitation of the centers probed at 785 and 1310 nm [22]. In the following, we will restrict our attention to these probes and to free and bound polarons.
At room temperature, the absorption signals decayed to zero in the range of milliseconds, while at a low temperature, the processes were slowed down. The observed decay spectra can in general be described using an empirical stretched exponential function, named after Kohlrausch, Williams and Watts (KWW) [24,25]. This so-called KWW function is given by:
where is the absorption coefficient for (not to be confused with the signal amplitude at the beginning of the time window of our data), is the stretching factor , where denotes the case of a mono-exponential relaxation, and is the characteristic decay time.
3. Monte Carlo Simulations
3.1. Decay Model
The pump pulse generated an initial polaron population by direct excitation from donors. Due to the moderate pump pulse intensity, the photo-excitation of electrons from the valence to the conduction band by the two-photon processes was disfavored [22], so that the presence of hole polarons was neglected here. Furthermore, by comparing the absorption coefficients with the peak photon fluence of our pump, we may consider that in samples Fe:LN 0.02 mol % and Fe:LN 0.05 mol %, all ions were likely to be ionized after the pulse so that the initial concentration of deep traps can be assumed to be equal to the total concentration. In sample Fe:LN 0.1 mol %, instead, due to the high content, the absorption of the pump beam along the sample thickness cannot be neglected so that the number of photo-excited carriers became depth-dependent. To deal with this, we considered in this case an effective initial population calculated from the amplitude of the absorption signal by comparison with the other samples. Finally, since the polaron formation time (<1 ps, see [1]) was much shorter than our pulse duration, we can assume that the polarons’ position after the pulse was completely uncorrelated from the initial photogeneration site [26]. The so-produced polaron population performed a random walk hopping either among defective sites (bound polarons) or regular sites (free polarons) until they were trapped by a ion. Both bound and free polarons contributed to the absorption at 785 nm [23].
3.2. Simulation Code
According to the Marcus–Holstein polaron hopping model [11,12,13], the non-adiabatic hopping frequency for a () hop was:
In Equation (3), r is the distance between initial and final sites and the absolute temperature (in energy units). is the reorganization energy of Marcus’ theory corresponding to the energy paid to rearrange the lattice, here equal to , the sum of the elastic energies of the two polarons. is an orbital parameter describing the overlap between the electronic wavefunctions at site i and f. is the hopping barrier, given by [17,27]:
with and the binding energies of the electron at zero deformation. When the hopping was between sites of the same type (), , recovering the standard result that the hopping activation energy was one half of the polaron stabilization energy [1,14,15]. The pre-exponential factor describes the intrinsic hopping rate between the two sites and was determined by the choice of the combination. Using the data reported in [15,18] the hopping barrier (4) for any process and the hopping rates (3) can be calculated. This result was used in a dedicated Monte Carlo code based on a classical Gillespie algorithm. The LN structure was generated at the beginning of the code with a randomly-placed set of and Fe defects, the concentration of which was set according to Table 1, assuming that they were the same as in the melt. The and population decays were computed by an MC code in a 80 × 80 × 80 super-cell of the LN structure with periodic boundary conditions.
4. Results and Discussion
4.1. Activation Energies Deduced via TAS
According to the discussion reported elsewhere [17,18,22,23] it can be considered that was proportional to the weighted sum of the bound and free polarons populations. Since the signal at 1310 nm remained always much smaller than the one at 785 nm and in general proportional to it, we may in a first approximation consider that the signal at 785 nm was proportional to the instantaneous bound polaron concentration and that the signal at 1310 was due essentially to the absorption tail of the bound polaron. From the measured KWW parameters, the average bound polaron lifetime can thus be computed:
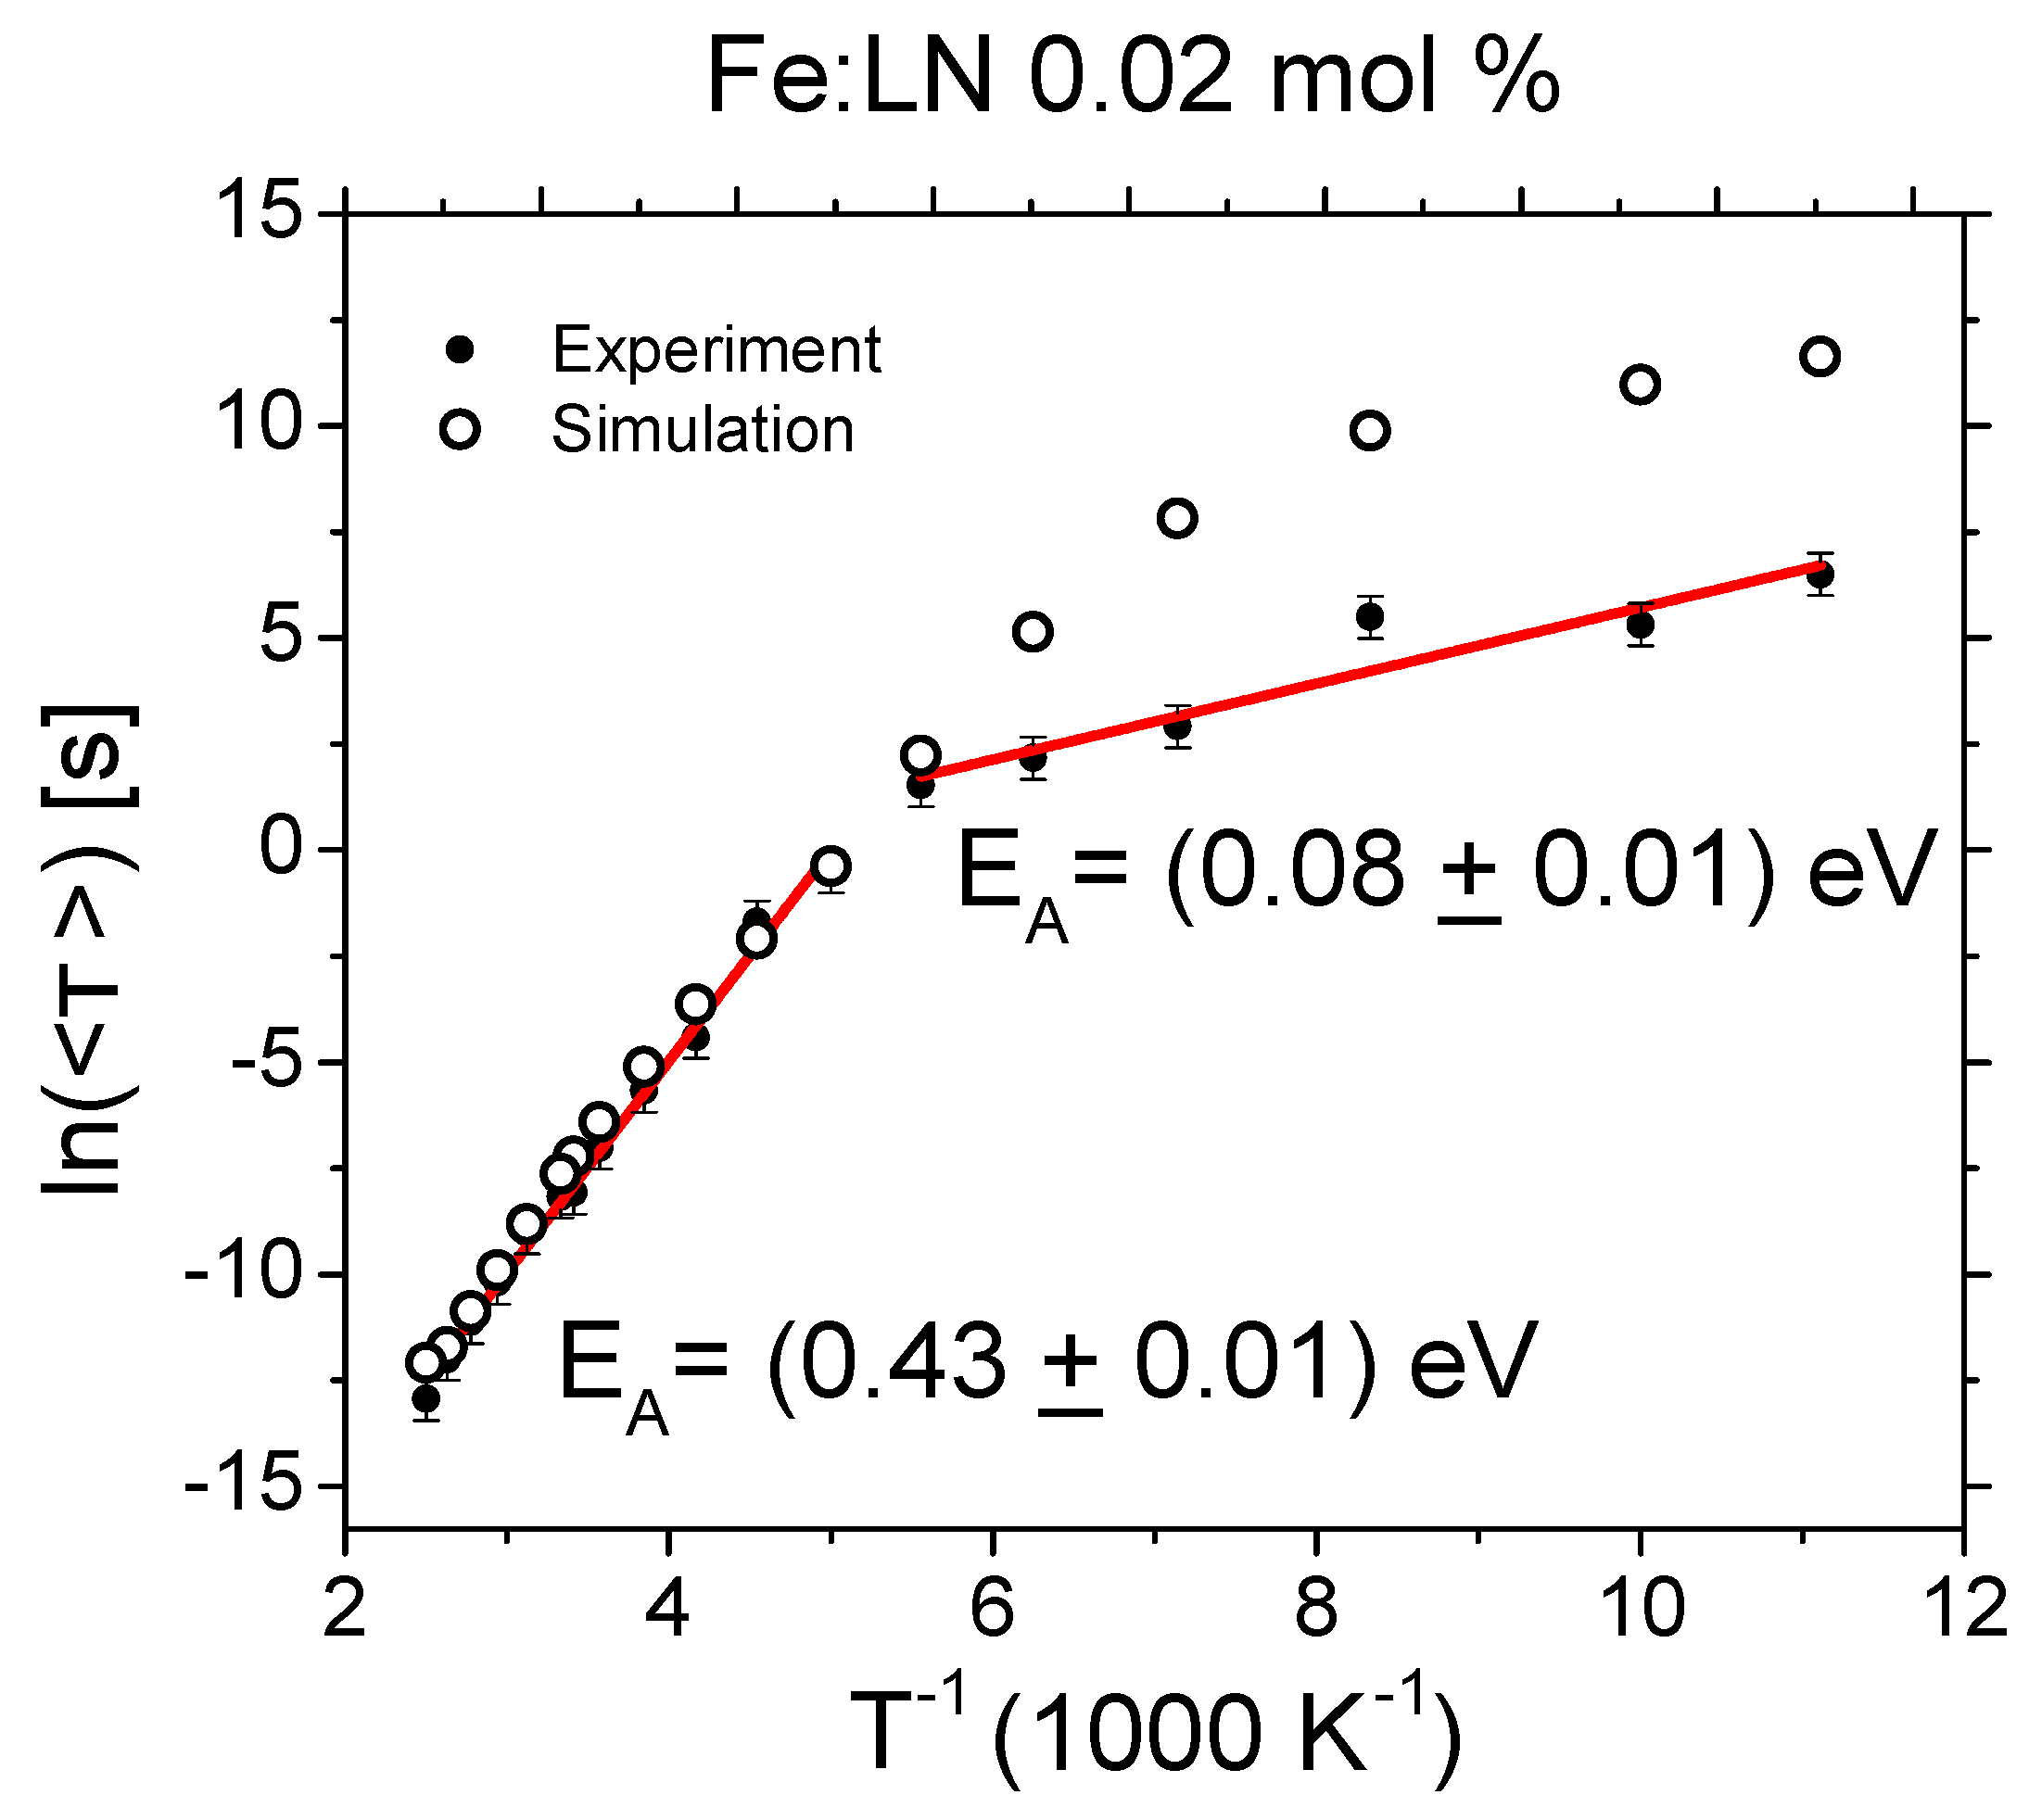
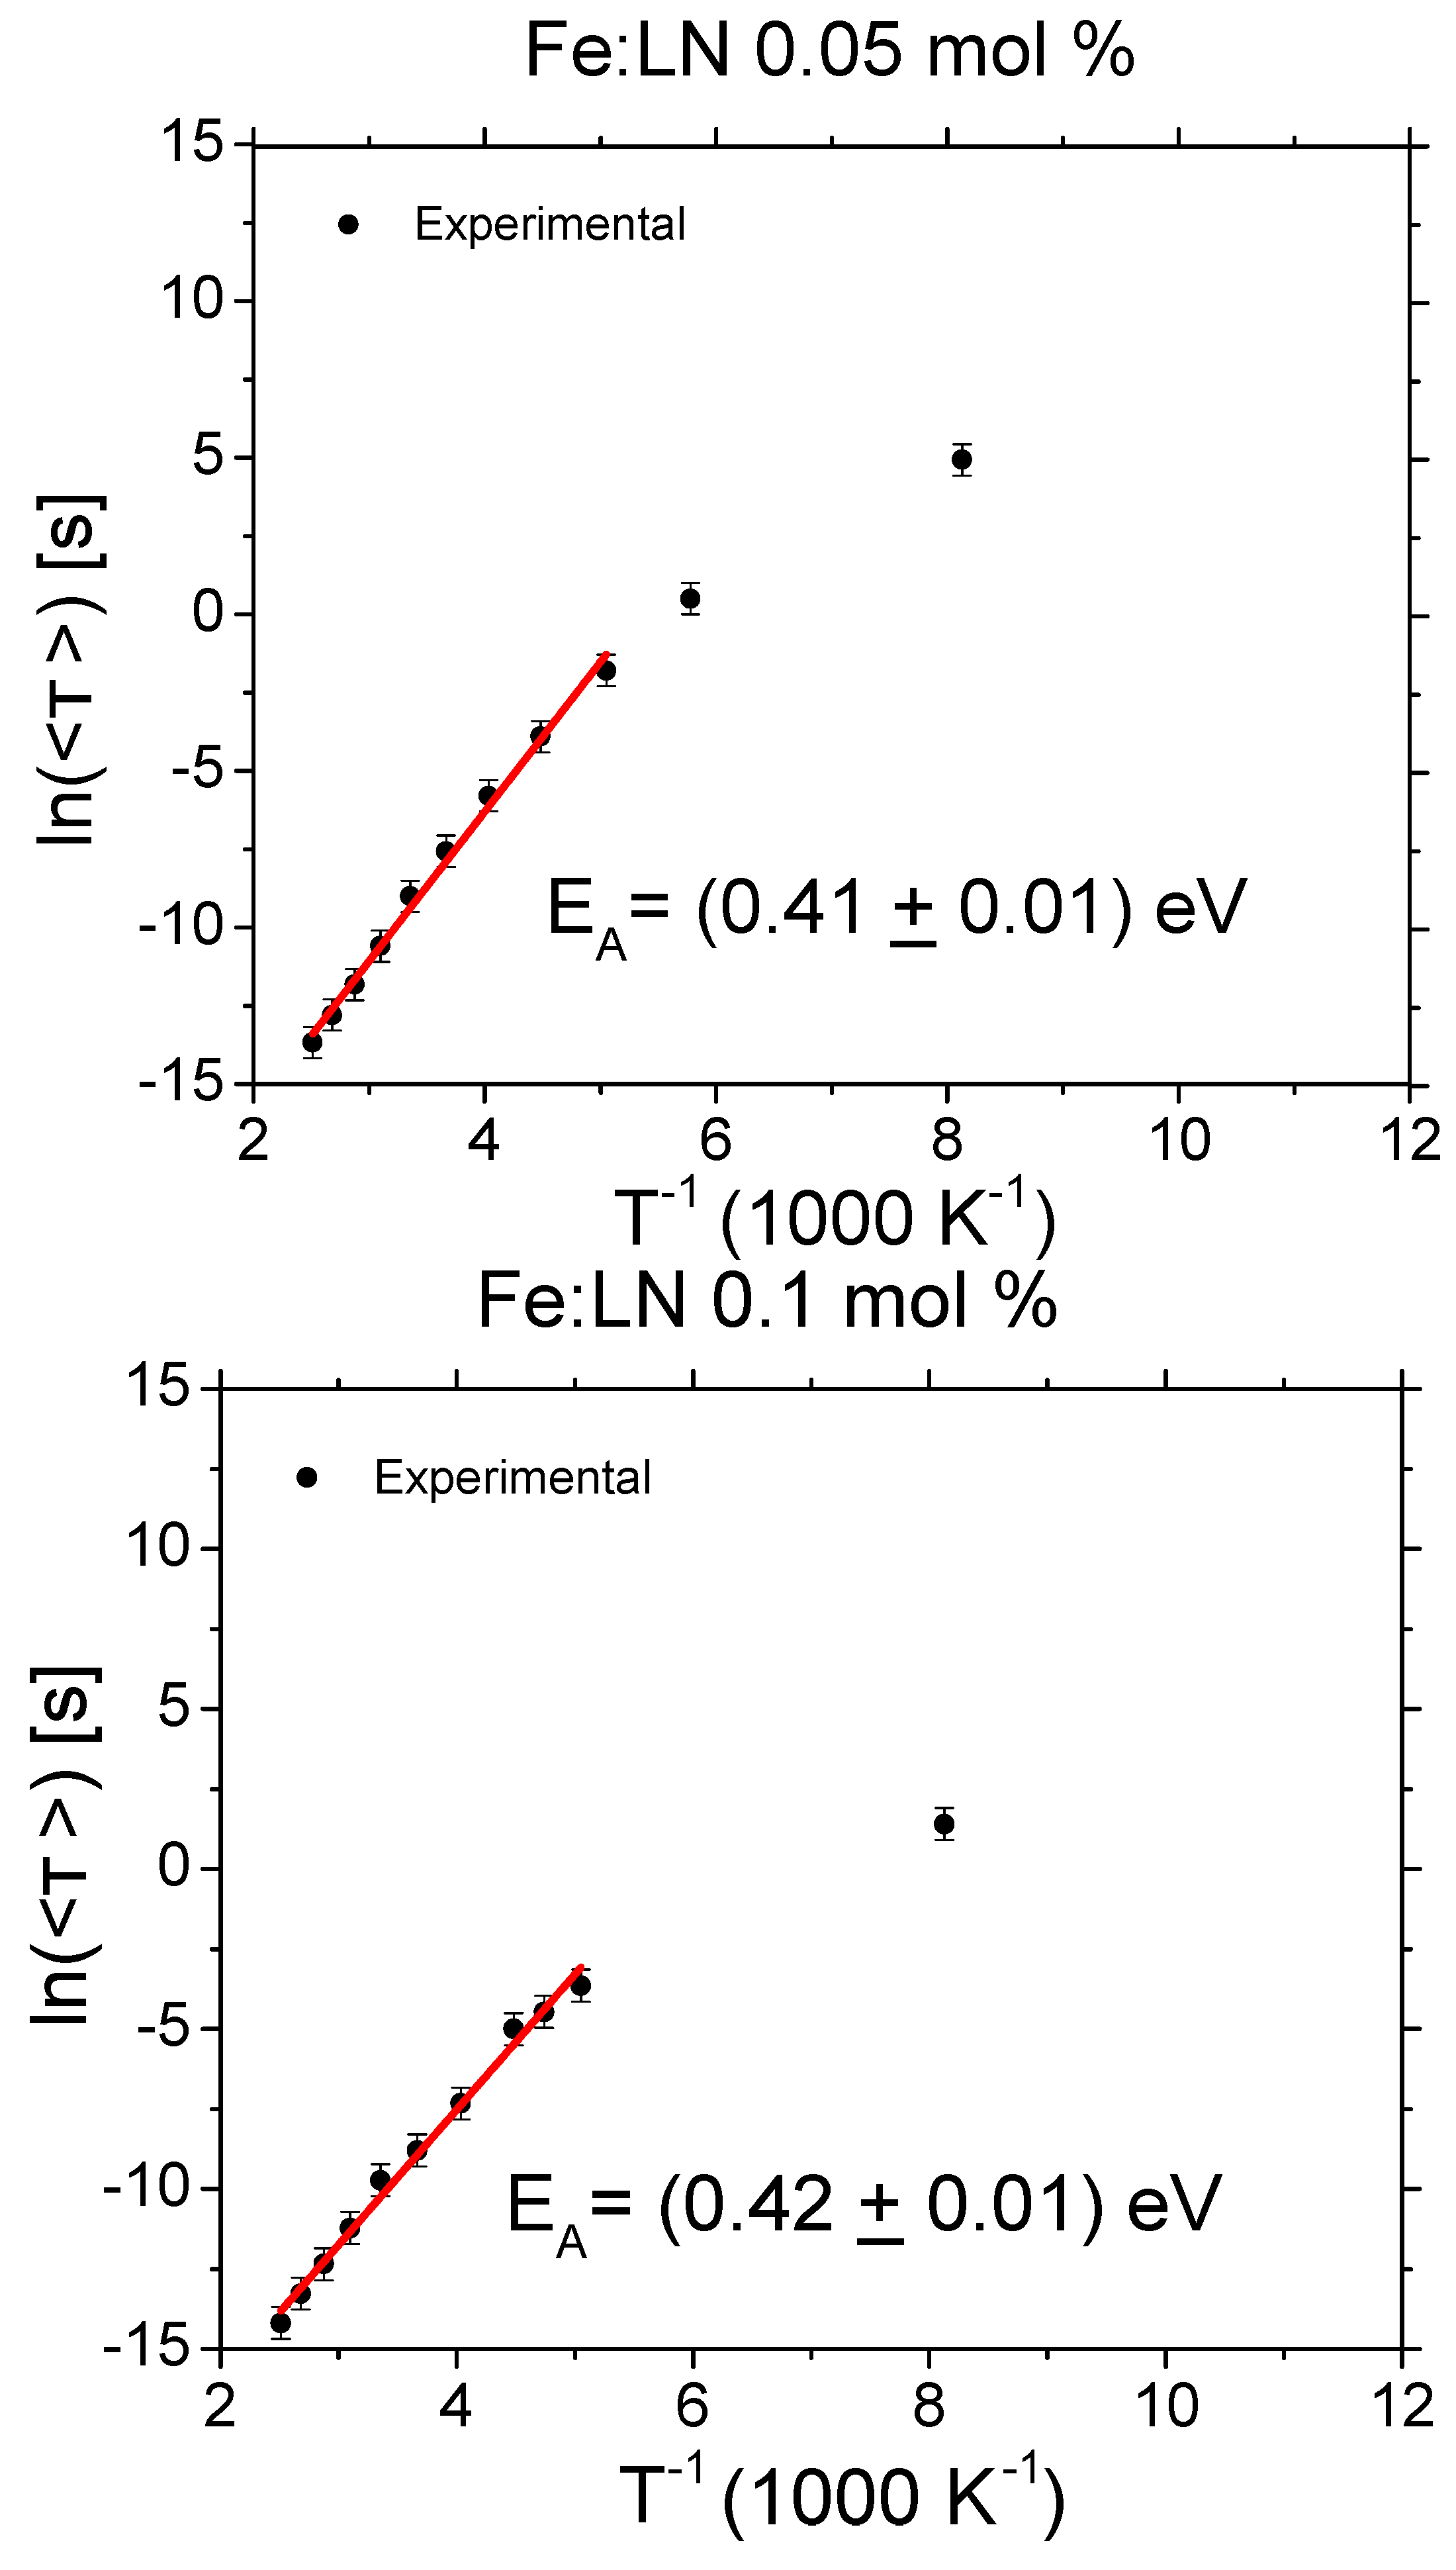
where is the gamma Euler function. This approach has the advantage of considering both the parameters and , allowing for a comparison between decays with different stretching exponents [28]. The result of the calculation for the three samples is shown in Figure 2 as a function of the temperature in an Arrhenius plot. The results gave evidence of two distinct activation energies with a transition temperature around for all samples. The high temperature activation energy was the same for all three samples U(T > 200 K) = (0.42 ± 0.01) eV. At low T, it was possible to measure an activation energy only for the less doped sample, providing U(T < 200 K) = (0.08 ± 0.01) eV. Nevertheless, all the samples appeared to follow the same qualitative behavior.
What was the origin of the observed slope change? The total mean lifetime defined in Equation (5) was determined mainly by the slowest processes leading to the bound polaron population disappearance. In this vision, the slope of the Arrhenius plot corresponded to the activation energy of the slowest hopping process. However, if more processes with similar hopping frequency occurred in a comparable amount, the observed activation energy would somehow lie in the middle.
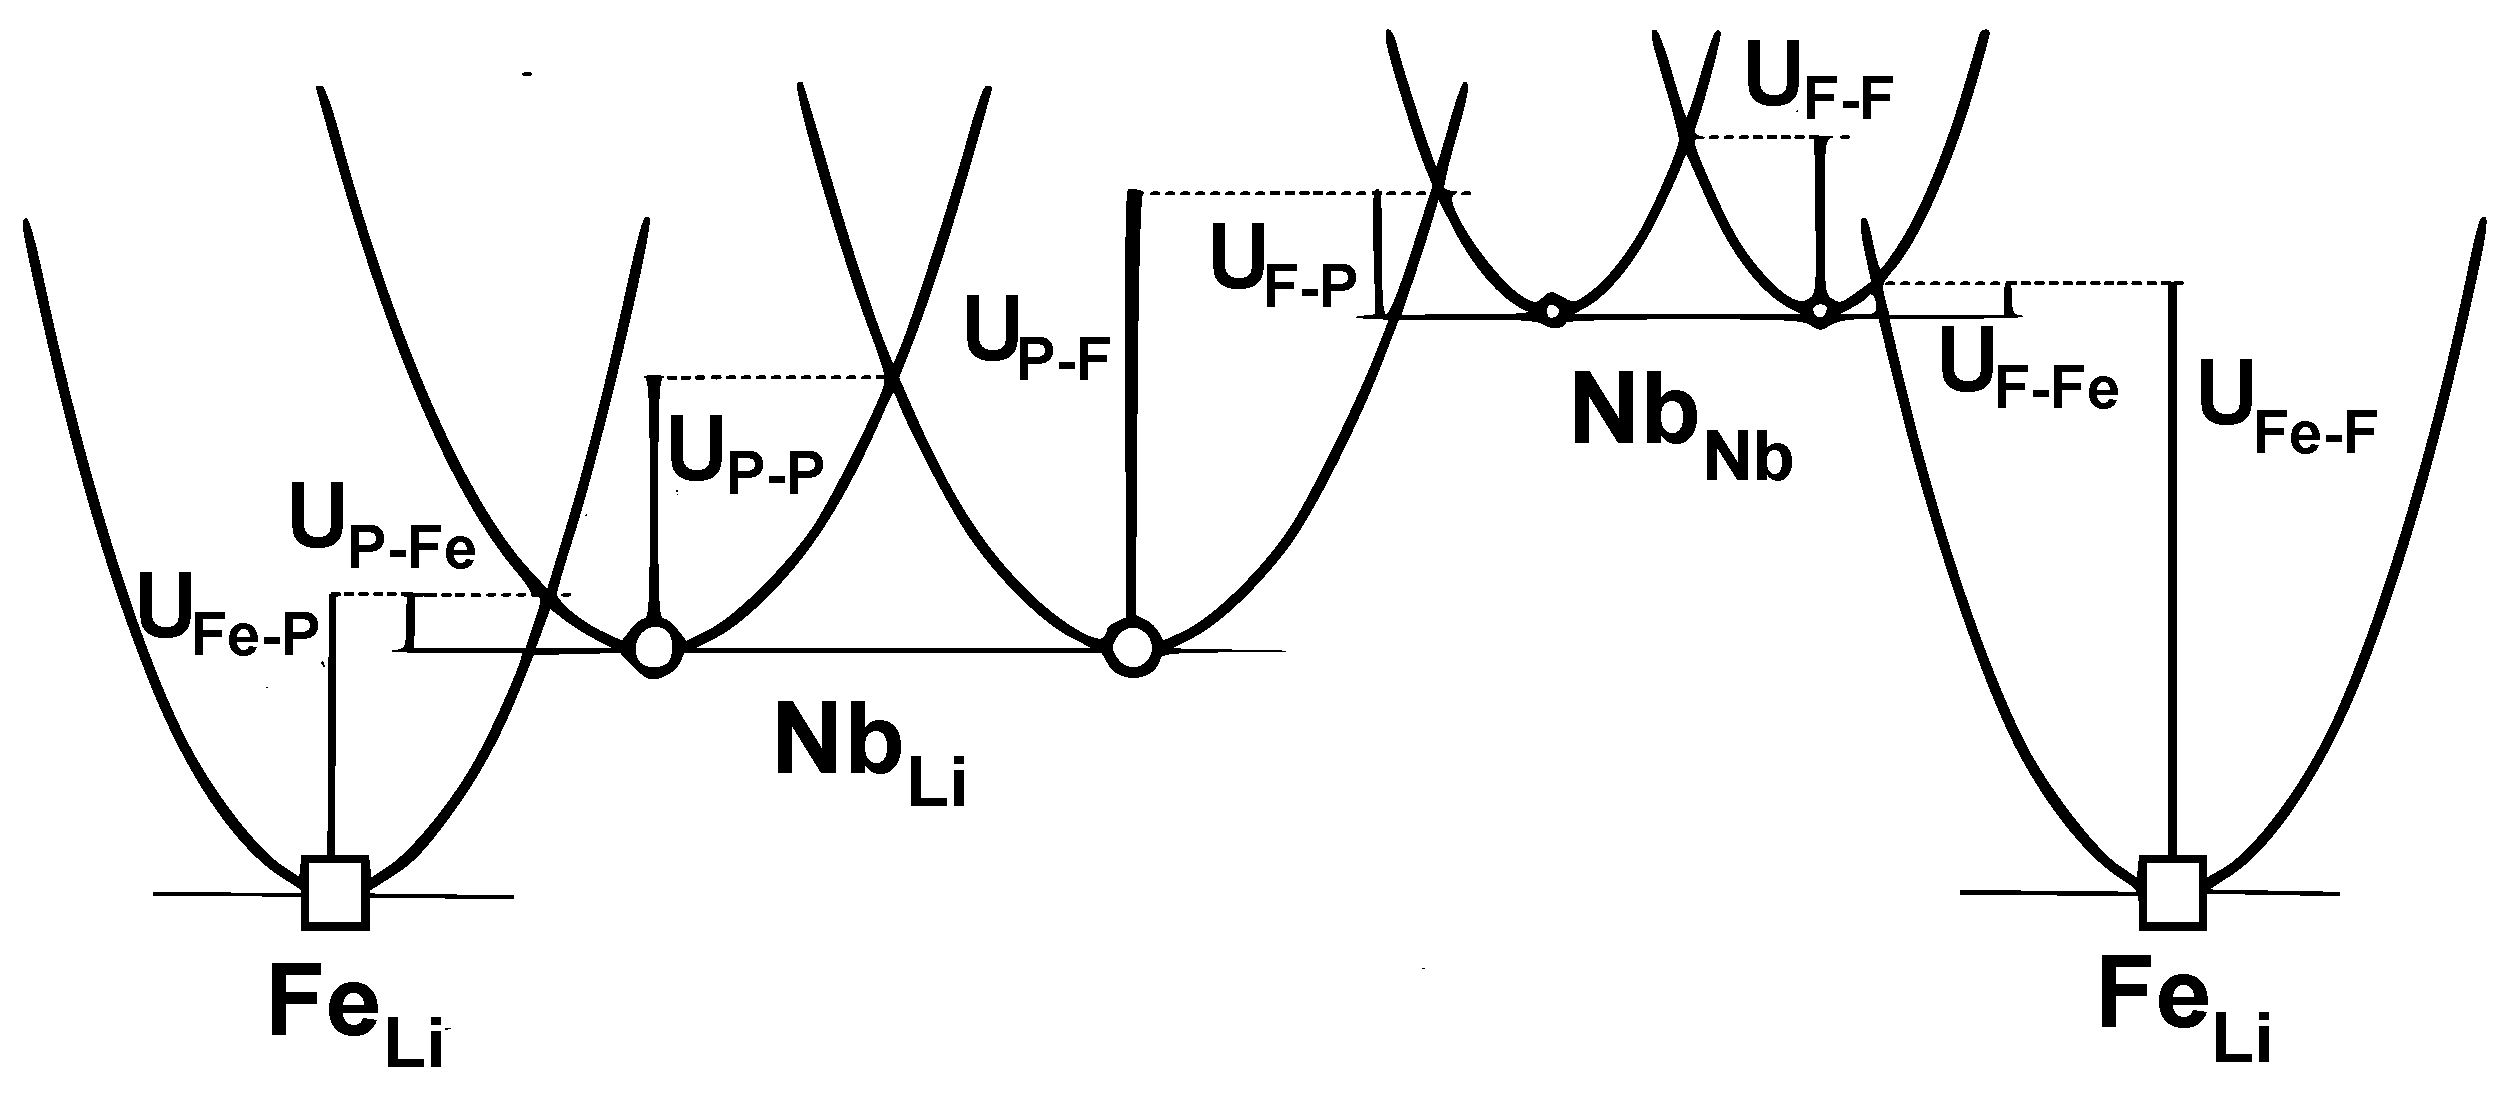
Using Equation (4) and the known values of the polaron energies (see [18] and the references therein), it is possible to compute the characteristic hopping barriers for the different processes, reported in Figure 3. As can be verified by inserting some typical values in Equation (3), the processes requiring the longest time to hop away from an antisite were the and hops, characterized by an activation energy of 0.375 eV and 0.55 eV. The measured activation energy was found in between (0.42 eV), accordingly. This means that the polaron, initially stuck on an antisite defect, either hopped directly towards another antisite or became a free polaron (which can eventually move on the lattice or re-captured by an antisite, but since those processes were very fast, they did not significantly affect the polaron lifetime).
Those claims were quantitatively checked against the numerical simulations for the sample Fe:LN 0.02 mol %, for which two distinct slopes are clearly visible in the Arrhenius plot. An initial population of 5000 polarons, all forming on a site just after the pulse, were considered. The TAS signal at 785 nm was computed by considering the weighted sum of the FP and GP populations , where and were the bound and free polaron cross-sections at 785 nm, respectively [23]. The numerically-computed decays were fitted by a KWW function in the experimental range starting from , and the average lifetime was calculated using Equation (5). The results are plotted in Figure 2. It can be seen that in the range between 180 and 400 K, the agreement between the simulated and experimental data was excellent, and the same situation was obtained for the other samples (not shown). Below 180 K, however, the agreement is less satisfactory: although the simulated data correctly reproduced the fact that the activation energy passed from to , the experimentally-measured transition appeared to be sharper, and the simulated decays were several times slower than the experimental ones. One possible explanation for this disagreement was that at low temperatures, the Marcus–Holstein hopping frequency became inaccurate [13,14]. Another reason may stem from the fact that in our simulation, we disregarded the presence of holes, and this assumption may be not be fully adequate in sample Fe:LN 0.02 mol %, which contained the lowest concentration of Fe. A third possible explanation was that the absorption at 785 nm may have contained an additional contribution from some other center than GP and FP, decaying by an alternative relaxation channel. This problem was already apparent also in [18] in which the sample Fe:LN 0.02 mol % was analyzed from the point of view of the decay shape, obtaining a set of parameters somehow different from that in other samples, especially concerning the trapping parameter .
Despite the partial agreement, our simulations reproduced qualitatively the observed activation energy change. An inspection of the results indicated that at low temperatures, the number of hops decreased significantly to a few units and, in many cases, even to a single trapping event. Therefore, the change in the activation energy can be associated with what we may call the “trapping” regime, in which the polaron performed a very limited hop number, so that the pertinent activation energy was somehow in between the energy barrier for the different trapping processes: and (see Figure 3).
4.2. Hopping Regimes’ Landscapes Inspected by Monte Carlo Simulations
One of the most intriguing question concerns the understanding of the role played by the different types of polarons, according to temperature, antisites and concentration. With the analysis of the activation energy of the mean lifetime, we obtained an indication that, depending on the temperature, different hopping processes can take place. It was only possible to conclude that at a high temperature, a mixed transport made by free and bound polarons occurred, while at a low temperature, the iron had a greater impact on the results. These respective parts in light-induced transport are still an open question. The present section aims to study the interplay between these species and predict which type of transport should predominate, depending on temperature and trap concentrations, with the help of the Monte Carlo simulation.
4.2.1. Free Polaron Transport
To evaluate quantitatively the role of FP in charge transport, we can calculate, for a polaron performing hops from its birth to its death, the fraction of hops performed as a free polaron. This quantity was then averaged over a large number of realizations. The calculation was performed by simulating 5000 polarons using the microscopic parameters reported in [18]. The experimental conditions (antisites and Fe traps concentration and temperature) were varied, to explore the typical range of parameters encountered in standard situations.
On the left side of Figure 4, we investigate the effect of the sample composition and of the temperature on the free polaron contribution to conduction. Here, the Fe concentration was set to zero. This situation therefore describes the impact of the stoichiometry or of doping with photorefractive-resistant ions (Mg, Zn, Zr) on the conduction. It can be seen that at room temperature, the reduction of the concentration initially had a small influence on the amount of FP-FP hops. It was necessary to eliminate about 90% of the antisites before observing a steep increase in the free polaron contribution to the conduction. This result explained quantitatively the origin of the so-called photorefractive threshold, which was necessary to surpass in order to observe a marked decrease of the photorefractive effect in undoped LN [29]. The situation was even more extreme at low temperatures and, conversely, more gradual by heating the sample.
On the right side of Figure 4, we consider now the impact of Fe doping from the point of view of free polaron conduction. We considered a stoichiometric sample to distinguish the effect of shallow traps. The qualitative behavior was obviously similar. In this case, it is interesting to note that at room temperature, even for high Fe concentrations (), the free polarons were always able to perform on average several hops before being trapped. This is in contrast, as we will show below, with the behavior of bound polarons.
4.2.2. Bound Polaron Transport
As has been shown in the above paragraph, when some antisites were present and for not too elevated temperatures (Figure 4 (left)), only a limited percentage of the hops that a polaron performed during its life were of the type. In Figure 5 (left), the same analysis is carried out for hops. Here, the situation was reversed: if the temperature was not too high and the antisite concentration was close to the congruent one, a large (on average) percentage of the total hops was constituted by direct hops among antisite defects. This led us to the important conclusion that in standard conditions, i.e., a congruent material at room temperature (and below), the dominating polaronic species was the bound polaron, hopping directly among antisite defects. This situation was completely different with respect to the free polaron case, because bound polarons hopped on a disordered lattice, for which standard diffusion equations may not be valid [16]. Two important remarks are necessary: (i) the fact that a large percentage of hops was performed as a bound polaron does not necessarily mean that charge transport was ruled by bound polarons: free polarons were so much more mobile than bound ones that, even if they were scarce, they could carry charge in a very efficient way; (ii) even if some hops were performed as free polarons, their concentration remained small, because they performed their hops very quickly before being recaptured very soon either by a shallow trap or by a deep trap. Therefore, the rate at which they were produced was much slower than the rate at which they disappeared, so that their equilibrium concentration remained very limited. This was confirmed by our experimental TAS results showing that the signal at 1310 nm remained small or close to zero, especially at a low temperature.
The influence of iron traps on polarons is shown in Figure 5 (right). In this case, the contribution of free polaron can be disregarded because this analysis was performed at a low temperature for congruent composition, to reduce the computational cost of this simulation. Here, the situation was even more dramatic if compared to the free polarons case, because at a low temperature, even with a relatively low concentration of deep traps, the bound polaron could perform at most one single jump. The data shown in Figure 5 (right) may be taken as an overestimation because of the so-called “soft pair” effect. In other words, the polaron can perform in some cases a large number of hops back and forth between two close-by antisite defects, without contributing effectively to the transport. In any case, this graph can be used to look for the conditions for which the number of hops becomes smaller than one. This corresponds to the situation for which at a low temperature, the bound polarons were directly trapped by a , and the transport process was no longer based on hops, but on ones. This is in qualitative agreement with the results of Figure 2, which show the gradual change in the activation energy of the average hopping frequency by cooling down the sample. The measured activation energy () at a low temperature in sample Fe:LN 0.02 mol % corresponded to a mix of hopping processes of the type and , with an apparent activation energy in between the ones of the corresponding processes reported in Equation (4) ( and , respectively).
5. Conclusions
In this work, we investigated how the relative weight of the different hopping processes for small polarons in Fe:LN was influenced by sample composition and temperature. A change in the hopping processes was evidenced experimentally by measuring the activation energy of the photo-generated electron polarons’ lifetime for different trap concentrations and different temperatures. The activation energy passes from about 0.42 eV at room temperature to 0.08 eV at a low temperature. By a numerical analysis based on the Marcus–Holstein theory, we were able to ascribe the transport to a mix of hop (GP–GP) and (FP–FP) types. At high temperatures and low antisite concentrations, the number of hops performed as free polarons was dominant, so that the effective mobility approached the ideal “free polaron” case described by Equation (1). In standard conditions, i.e., at room temperature and congruent composition, the “antisite” hopping GP-GP occurred more frequently than free polaron hopping FP–FP, and by cooling down the sample, it became preponderant. Still, the role of free polaron conduction cannot be neglected: because of their much higher mobility, even a scarce presence of free polarons may significantly affect the conductivity. Finally, at very low temperatures (below 150 K) and for the range of compositions herein considered, one entered another regime in which the polarons typically performed only one or two hops before being captured by a deep trap. In these conditions, the activation energy of the transport process was close to the one of the trapping event, which was . We point out that in recent works [17,18], a useful scheme, based on the idea of associating a finite volume with deep and shallow traps, has been proposed that allows for a semi-quantitative description of our findings without resorting to numerical simulations.
Our results confirmed that in real materials, the situation was much more intricate than in the ideal case, and that numerical studies can effectively be used to investigate the role of the different polaronic species. As a future perspective, we plan to apply this approach to the practically important topic of transport processes under continuous illumination. As shown here, the effective polaron mobility resulted in general from a mix between free and bound polarons contributions. While for the former, a standard theoretical description is available, for the latter, the situation is more complicated, because they can be considered as particles hopping on the disordered lattice constituted by antisite defects, for which standard diffusion equations may not be valid. This may ultimately lead to a revision of the theoretical description of polaron conduction in lithium niobate and related materials.
Author Contributions
Conceptualization, M.B. Data curation, L.V. and S.M. Formal analysis, L.V. Investigation, L.V. and S.M. Methodology, M.B. Resources, M.I. Supervision, M.B. and M.I. Writing, original draft, M.B. Writing, review and editing, S.M. and M.I.
Funding
This research was funded by the University of Padova grant number BIRD174398 and by the Deutsche Forschungsgemeinschaft (DFG) via Projects IM37/11-1 and INST190/165-1 FUGG.
Acknowledgments
M.B. thanks Laurent Guilbert from LMOPS laboratory at Université Lorraine and CentraleSupéléc (Metz, France) for providing useful ideas and discussions.
Conflicts of Interest
The authors declare no conflict of interest.
References
- Imlau, M.; Badorreck, H.; Merschjann, C. Optical nonlinearities of small polarons in lithium niobate. Appl. Phys. Rev. 2015, 2, 040606. [Google Scholar] [CrossRef]
- Bazzan, M.; Sada, C. Optical waveguides in lithium niobate: Recent developments and applications. Appl. Phys. Rev. 2015, 2, 040603. [Google Scholar] [CrossRef]
- Günter, P.; Huignard, J.-P. Photorefractive Materials and Their Applications 1; Springer: New York, NY, USA, 2006; Volume 113. [Google Scholar]
- He, J.; Franchini, C.; Rondinelli, J.M. Lithium niobate-type oxides as visible light photovoltaic materials. Chem. Mater. 2016, 28, 25–29. [Google Scholar] [CrossRef]
- Schirmer, O.F.; Imlau, M.; Merschjann, C. Bulk photovoltaic effect of LiNbO3: Fe and its small-polaron-based microscopic interpretation. Phys. Rev. B 2011, 83, 165106. [Google Scholar] [CrossRef]
- Tisdale, W.A.; Williams, K.J.; Timp, B.A.; Norris, D.J.; Aydil, E.S.; Zhu, X.-Y. Hot-electron transfer from semiconductor nanocrystals. Science 2010, 328, 1543–1547. [Google Scholar] [CrossRef] [PubMed]
- Nolan, M. First-principles prediction of new photocatalyst materials with visible-light absorption and improved charge separation: Surface modification of rutile TiO2 with nanoclusters of MgO and Ga2O3. ACS Appl. Mater. Interfaces 2012, 4, 5863–5871. [Google Scholar] [CrossRef] [PubMed]
- Migani, A.; Blancafort, L. Excitonic interfacial proton-coupled electron transfer mechanism in the photocatalytic oxidation of methanol to formaldehyde on TiO2(110). J. Am. Chem. Soc. 2016, 138, 16165–16173. [Google Scholar] [CrossRef] [PubMed]
- Sezen, H.; Shang, H.; Bebensee, F.; Yang, C.; Buchholz, M.; Nefedov, A.; Heissler, S.; Carbogno, C.; Scheffler, M.; Rinke, P.; et al. Evidence for photogenerated intermediate hole polarons in ZnO. Nat. Commun. 2015, 6, 6901. [Google Scholar] [CrossRef] [PubMed] [Green Version]
- Volk, T.; Wöhlecke, M. Lithium Niobate: Defects, Photorefraction and Ferroelectric Switching; Springer Science & Business Media: Berlin/Heidelberg, Germany, 2008; Volume 115. [Google Scholar]
- Marcus, R.A. On the theory of oxidation-reduction reactions involving electron transfer. I. J. Chem. Phys. 1956, 24, 966–978. [Google Scholar] [CrossRef]
- Holstein, T. Studies of polaron motion: Part II. The “small” polaron. Ann. Phys. 1959, 8, 343–389. [Google Scholar] [CrossRef]
- Emin, D. Polarons; Cambridge University Press: Cambridge, UK, 2013. [Google Scholar]
- Austin, I.G.; Mott, N.F. Polarons in crystalline and non-crystalline materials. Adv. Phys. 2001, 50, 757–812. [Google Scholar] [CrossRef]
- Schirmer, O.F.; Imlau, M.; Merschjann, C.; Schoke, B. Electron small polarons and bipolarons in LiNbO3. J. Phys. Condens. Matter 2009, 21, 123201. [Google Scholar] [CrossRef] [PubMed]
- Metzler, R.; Klafter, J. The random walk’s guide to anomalous diffusion: A fractional dynamics approach. Phys. Rep. 2000, 339, 1–77. [Google Scholar] [CrossRef]
- Mhaouech, I.; Guilbert, L. Temperature dependence of small polaron population decays in iron-doped lithium niobate by monte carlo simulations. Solid State Sci. 2016, 60, 28–36. [Google Scholar] [CrossRef]
- Guilbert, L.; Vittadello, L.; Bazzan, M.; Mhaouech, I.; Messerschmidt, S.; Imlau, M. The elusive role of NbLi bound polaron energy in hopping charge transport in Fe:LiNbO3. J. Phys. Condens. Matter 2018, 30, 125701. [Google Scholar] [CrossRef] [PubMed]
- Herth, P.; Granzow, T.; Schaniel, D.; Woike, T.; Imlau, M.; Krätzig, E. Evidence for light-induced hole polarons in LiNbO3. Phys. Rev. Lett. 2005, 95, 067404. [Google Scholar] [CrossRef] [PubMed]
- Ciampolillo, M.V.; Zaltron, A.; Bazzan, M.; Argiolas, N.; Sada, C. Quantification of iron (Fe) in lithium niobate by optical absorption. Appl. Spectrosc. 2011, 65, 216–220. [Google Scholar] [CrossRef]
- Kurz, H.; Krätzig, E.; Keune, W.; Engelmann, H.; Gonser, U.; Dischler, B.; Räuber, A. Photorefractive centers in LiNbO3, studied by optical-, mössbauer-and epr-methods. Appl. Phys. A Mater. Sci. Process. 1977, 12, 355–368. [Google Scholar] [CrossRef]
- Merschjann, C.; Schoke, B.; Imlau, M. Influence of chemical reduction on the particular number densities of light-induced small electron and hole polarons in nominally pure LiNbO3. Phys. Rev. B 2007, 76, 085114. [Google Scholar] [CrossRef]
- Merschjann, C.; Schoke, B.; Conradi, D.; Imlau, M.; Corradi, G.; Polgar, K. Absorption cross sections and number densities of electron and hole polarons in congruently melting LiNbO3. J. Phys. Condens. Matter 2008, 21, 015906. [Google Scholar] [CrossRef] [PubMed]
- Kohlrausch, R. Ueber das dellmann’sche elektrometer. Annalen der Physik 1847, 148, 353–405. [Google Scholar] [CrossRef]
- Berben, D.; Buse, K.; Wevering, S.; Herth, P.; Imlau, M.; Woike, T. Lifetime of small polarons in iron-doped lithium-niobate crystals. J. Appl. Phys. 2000, 87, 1034–1041. [Google Scholar] [CrossRef]
- Carnicero, J.; Carrascosa, M.; García, G.; Agulló-López, F. Site correlation effects in the dynamics of iron impurities Fe2+/Fe3+ and antisite defects after a short-pulse excitation in LiNbO3. Phys. Rev. B 2005, 72, 245108. [Google Scholar] [CrossRef]
- Zylbersztejn, A. Thermally activated trapping in Fe-doped LiNbO3. Appl. Phys. Lett. 1976, 29, 778–780. [Google Scholar] [CrossRef]
- Sheri, L.; Shamblin, B.C.; Hancock, Y.D.; Michael, J.P. Interpretation of relaxation time constants for amorphous pharmaceutical systems. J. Pharm. Sci. 2000, 89, 417–427. [Google Scholar]
- Wöhlecke, M.; Volk, T. Lithium Niobate; Springer: Berlin/Heidelberg, Germany, 2009. [Google Scholar]
Figure 1.
Typical experimental results of TA spectroscopy on the sample Fe:LN 0.1 mol %. (a) Room temperature; (b) Low temperature.
Figure 1.
Typical experimental results of TA spectroscopy on the sample Fe:LN 0.1 mol %. (a) Room temperature; (b) Low temperature.

Figure 2.
Arrhenius plot of the mean decay time of the signal at 785 nm, calculated using the parameters of the Kohlrausch, Williams and Watts (KWW) fit of the Transient Absorption Spectroscopy (TAS) data. The plots evidence a change in the transport mechanism around . The high temperature regime is described by an activation energy of [U ∼ 0.42] eV and is well matched by numerical simulations in sample Fe:LN 0.02 mol %.


Figure 3.
Hopping energy barrier (Equation (4)) calculated using the values for the different polaron energies detailed in [18]. FP, free polaron.

| Final site | ||||
| Energy in eV | Free (FP) | Antisite (GP) | Fe | |
| Free (FP) | 0.273 | 0.156 | 0.003 | |
| Initial site | Antisite (GP) | 0.551 | 0.375 | 0.038 |
| Fe | 1.378 | 1.018 | 0.350 | |
Figure 4.
(Left) Fraction of hops as a free polaron as a function of temperature and concentration for an undoped sample . (Right) Total number of hops as a function of the temperature and concentration for a stoichiometric sample ().
Figure 4.
(Left) Fraction of hops as a free polaron as a function of temperature and concentration for an undoped sample . (Right) Total number of hops as a function of the temperature and concentration for a stoichiometric sample ().

Figure 5.
(Left) as a function of temperature and antisite concentration for an undoped sample (). (Right) as a function of the temperature and concentration for a congruent sample (). Free polaron contribution has been disregarded for simplicity. Note the different temperature range in the two plots.


Table 1.
Defect concentrations for the samples under study determined by optical absorption (see the text).
Table 1.
Defect concentrations for the samples under study determined by optical absorption (see the text).
| [Fe] | [] | [] | []/[] | [] | |
|---|---|---|---|---|---|
| Fe:LN 0.02 mol % | 3.8 | 0.1 | 3.7 | 0.04 | 190.9 |
| Fe:LN 0.05 mol % | 9.5 | 0.8 | 7.9 | 0.1 | 190.9 |
| Fe:LN 0.1 mol % | 18.90 | 13.7 | 5.2 | 2.62 | 190.9 |
© 2018 by the authors. Licensee MDPI, Basel, Switzerland. This article is an open access article distributed under the terms and conditions of the Creative Commons Attribution (CC BY) license (http://creativecommons.org/licenses/by/4.0/).
Share and Cite
MDPI and ACS Style
Vittadello, L.; Bazzan, M.; Messerschmidt, S.; Imlau, M. Small Polaron Hopping in Fe:LiNbO3 as a Function of Temperature and Composition. Crystals 2018, 8, 294. https://doi.org/10.3390/cryst8070294
AMA Style
Vittadello L, Bazzan M, Messerschmidt S, Imlau M. Small Polaron Hopping in Fe:LiNbO3 as a Function of Temperature and Composition. Crystals. 2018; 8(7):294. https://doi.org/10.3390/cryst8070294
Chicago/Turabian StyleVittadello, Laura, Marco Bazzan, Simon Messerschmidt, and Mirco Imlau. 2018. "Small Polaron Hopping in Fe:LiNbO3 as a Function of Temperature and Composition" Crystals 8, no. 7: 294. https://doi.org/10.3390/cryst8070294
Note that from the first issue of 2016, this journal uses article numbers instead of page numbers. See further details here.