Grafting onto an Appropriate Rootstock Reduces the Impact on Yield and Quality of Controlled Deficit Irrigated Pepper Crops

 , , , ,
Abstract
:1. Introduction
2. Materials and Methods
2.1. Experimental Site
2.2. Plant Material
2.3. Irrigation Strategies
2.4. Soil Moisture
2.5. Physiological Measurements
2.6. Biomass and Fruit Yield
2.7. Statistical Analysis
3. Results
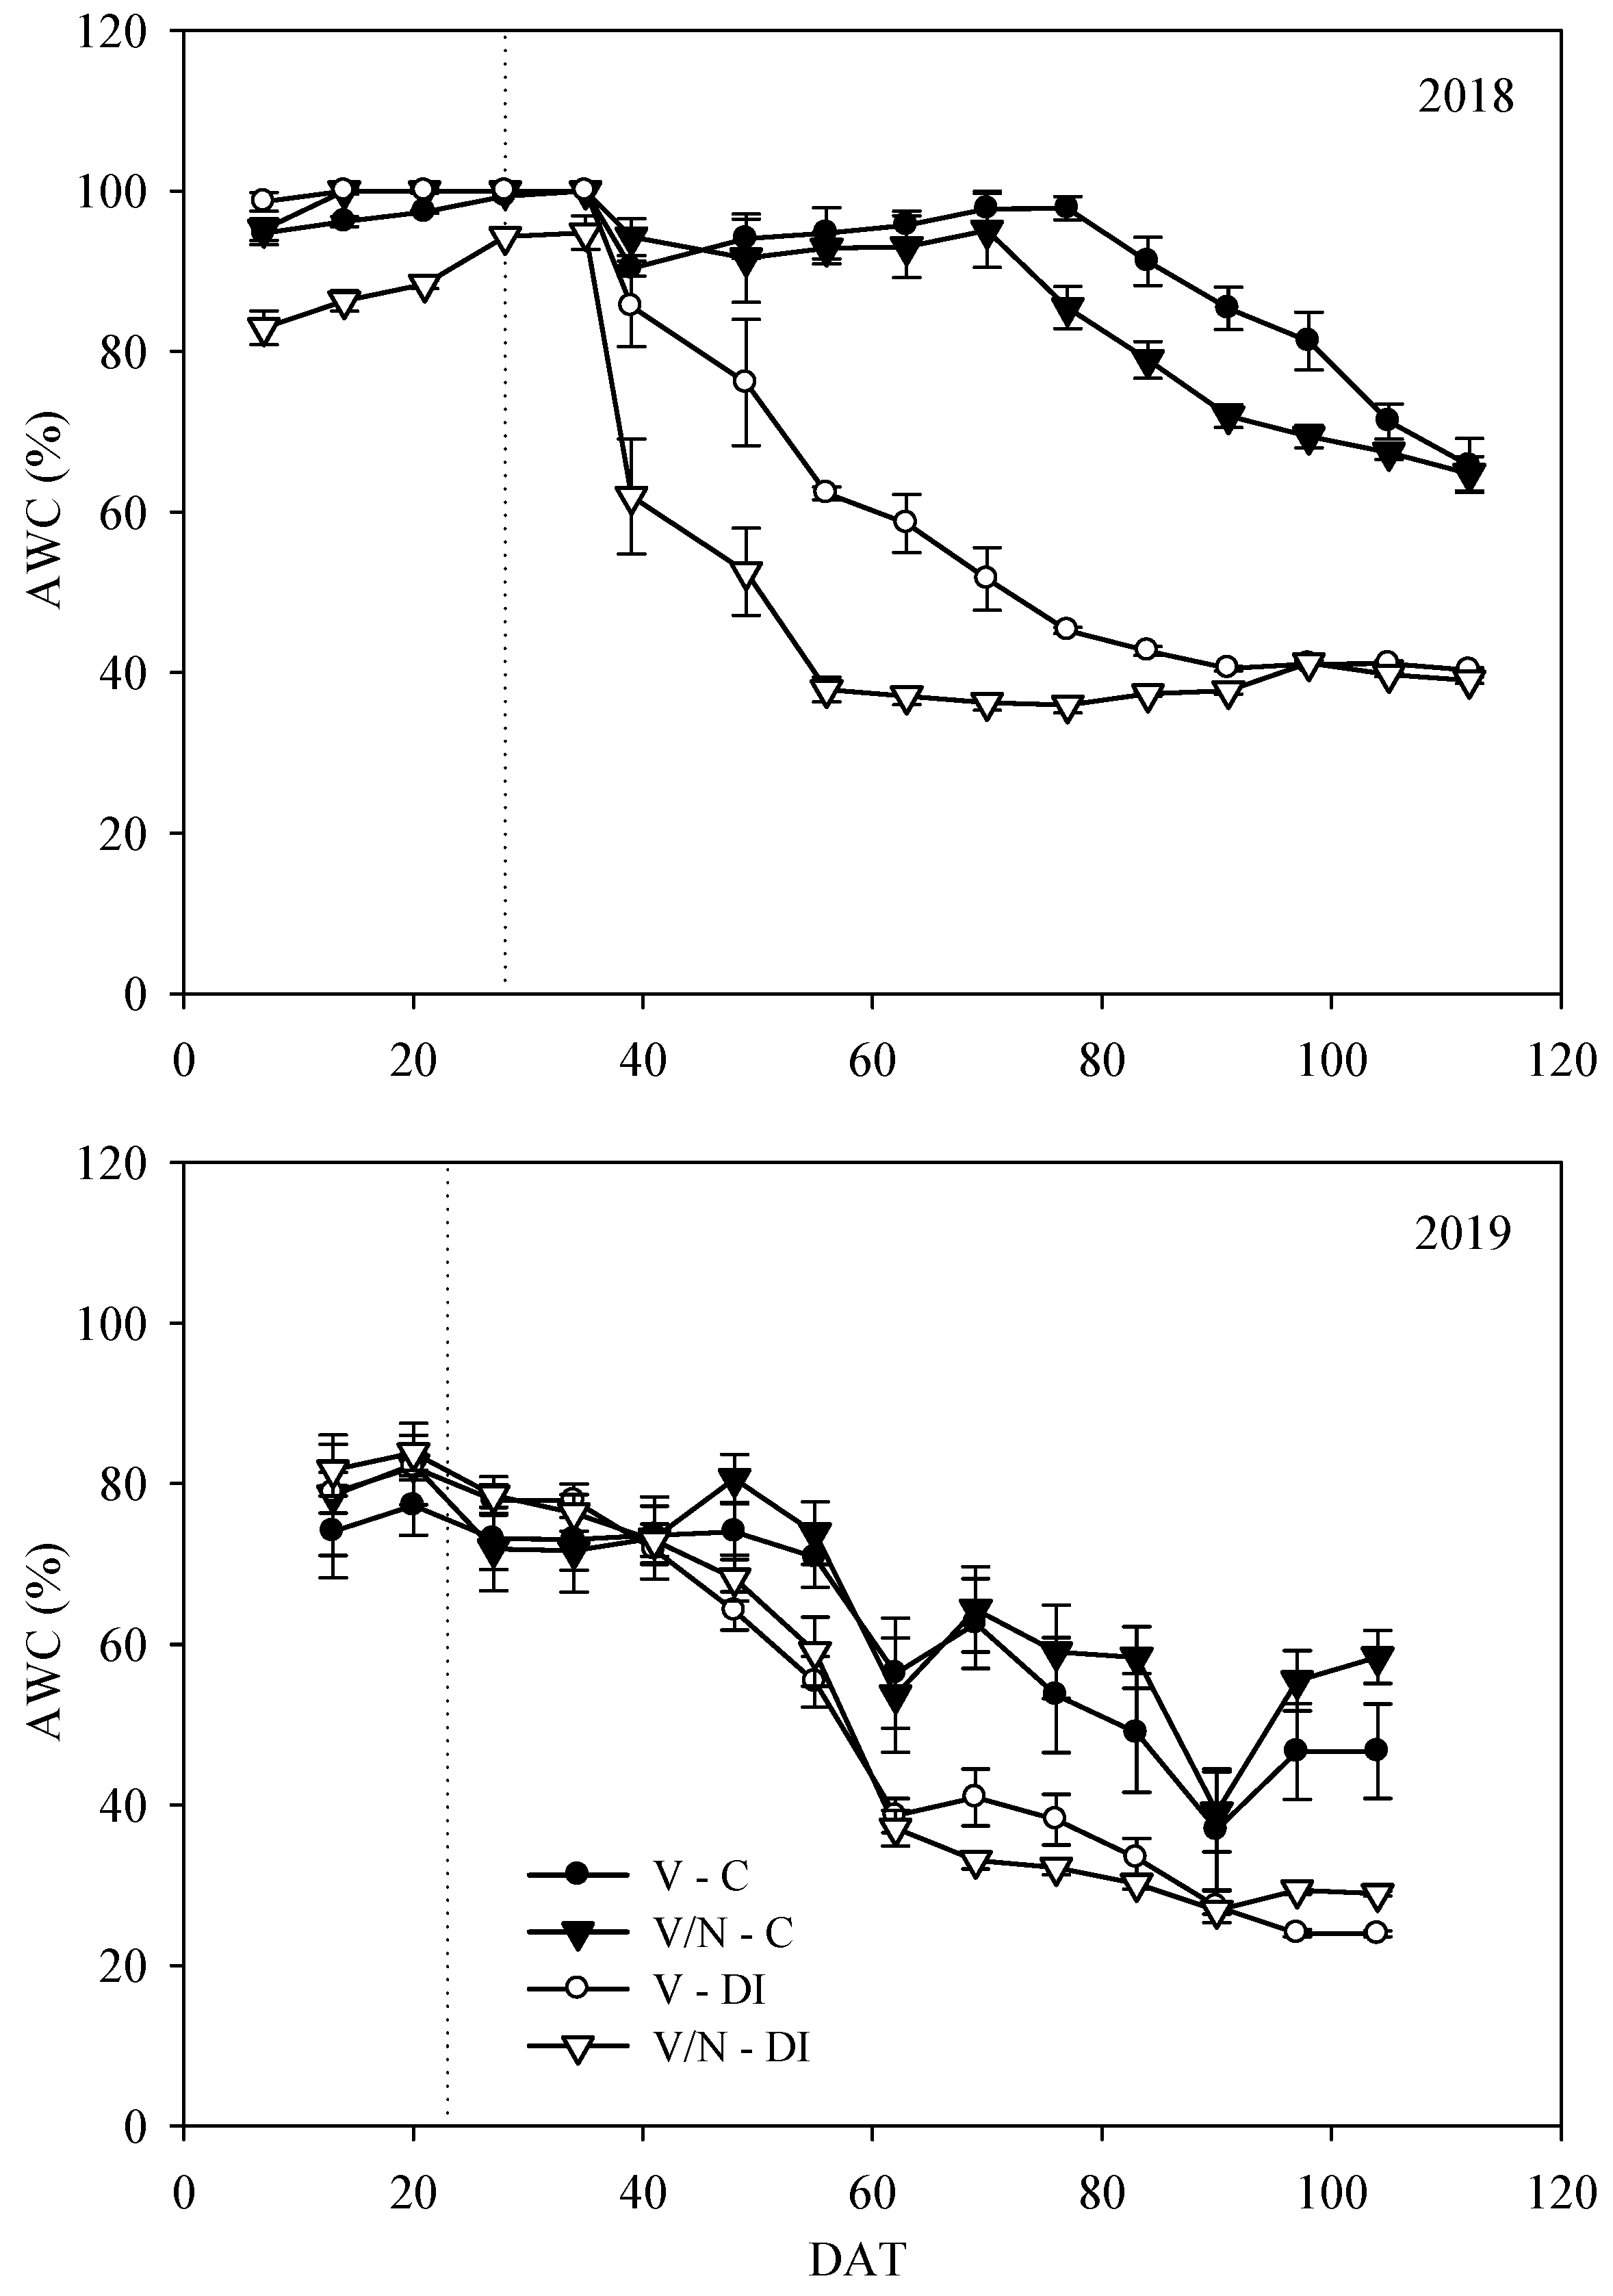
3.1. Soil Moisture
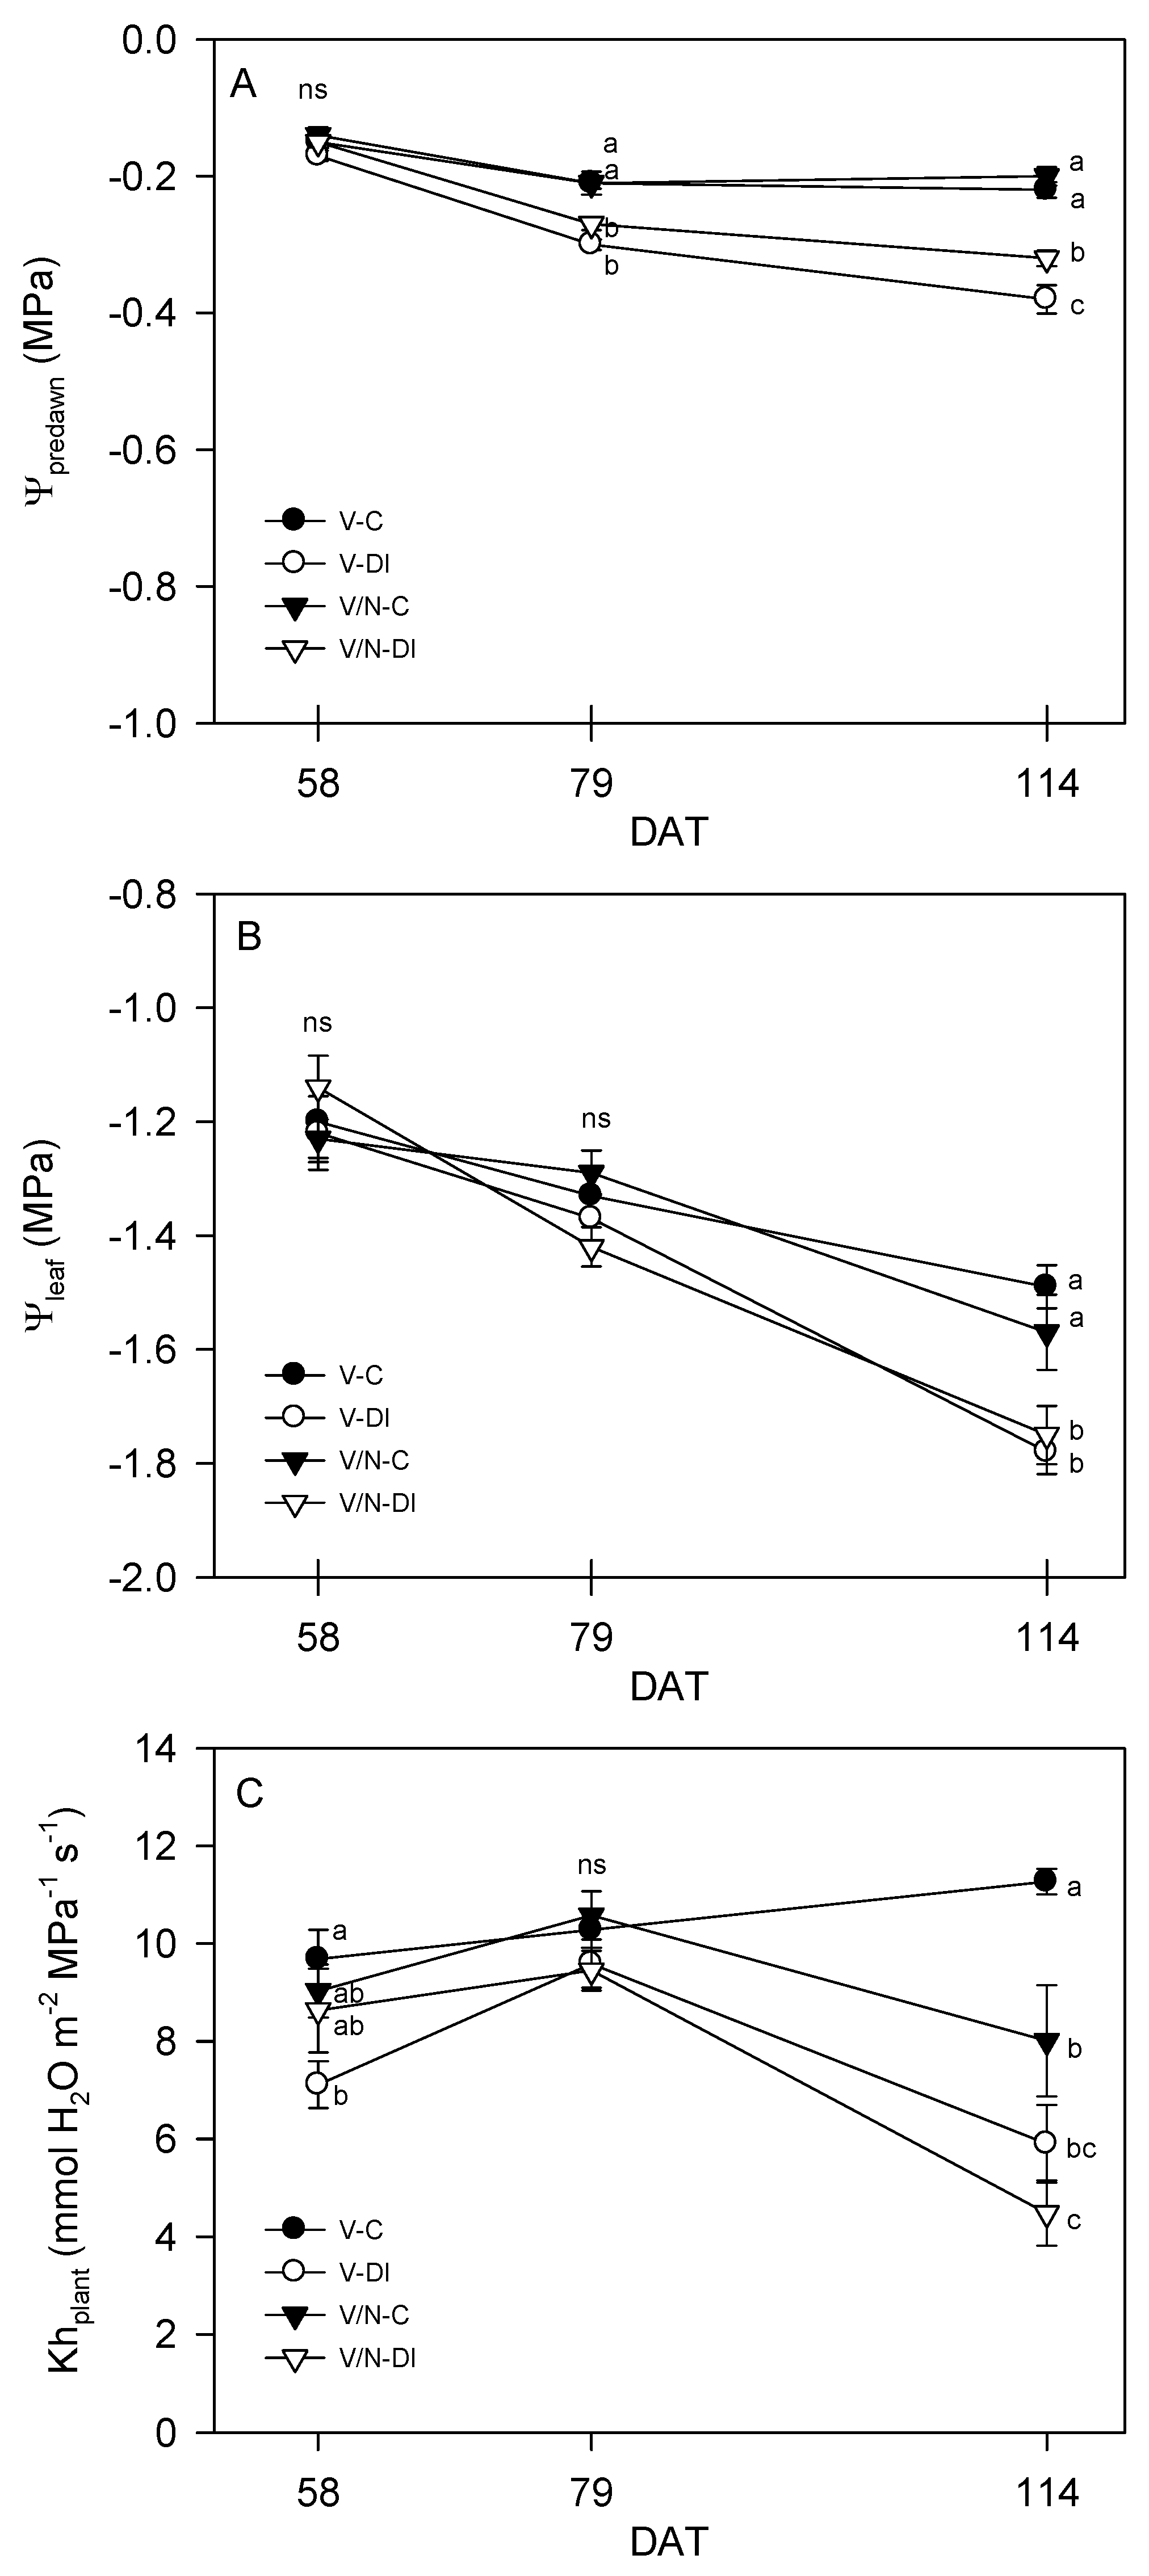
3.2. Plant Water Relations
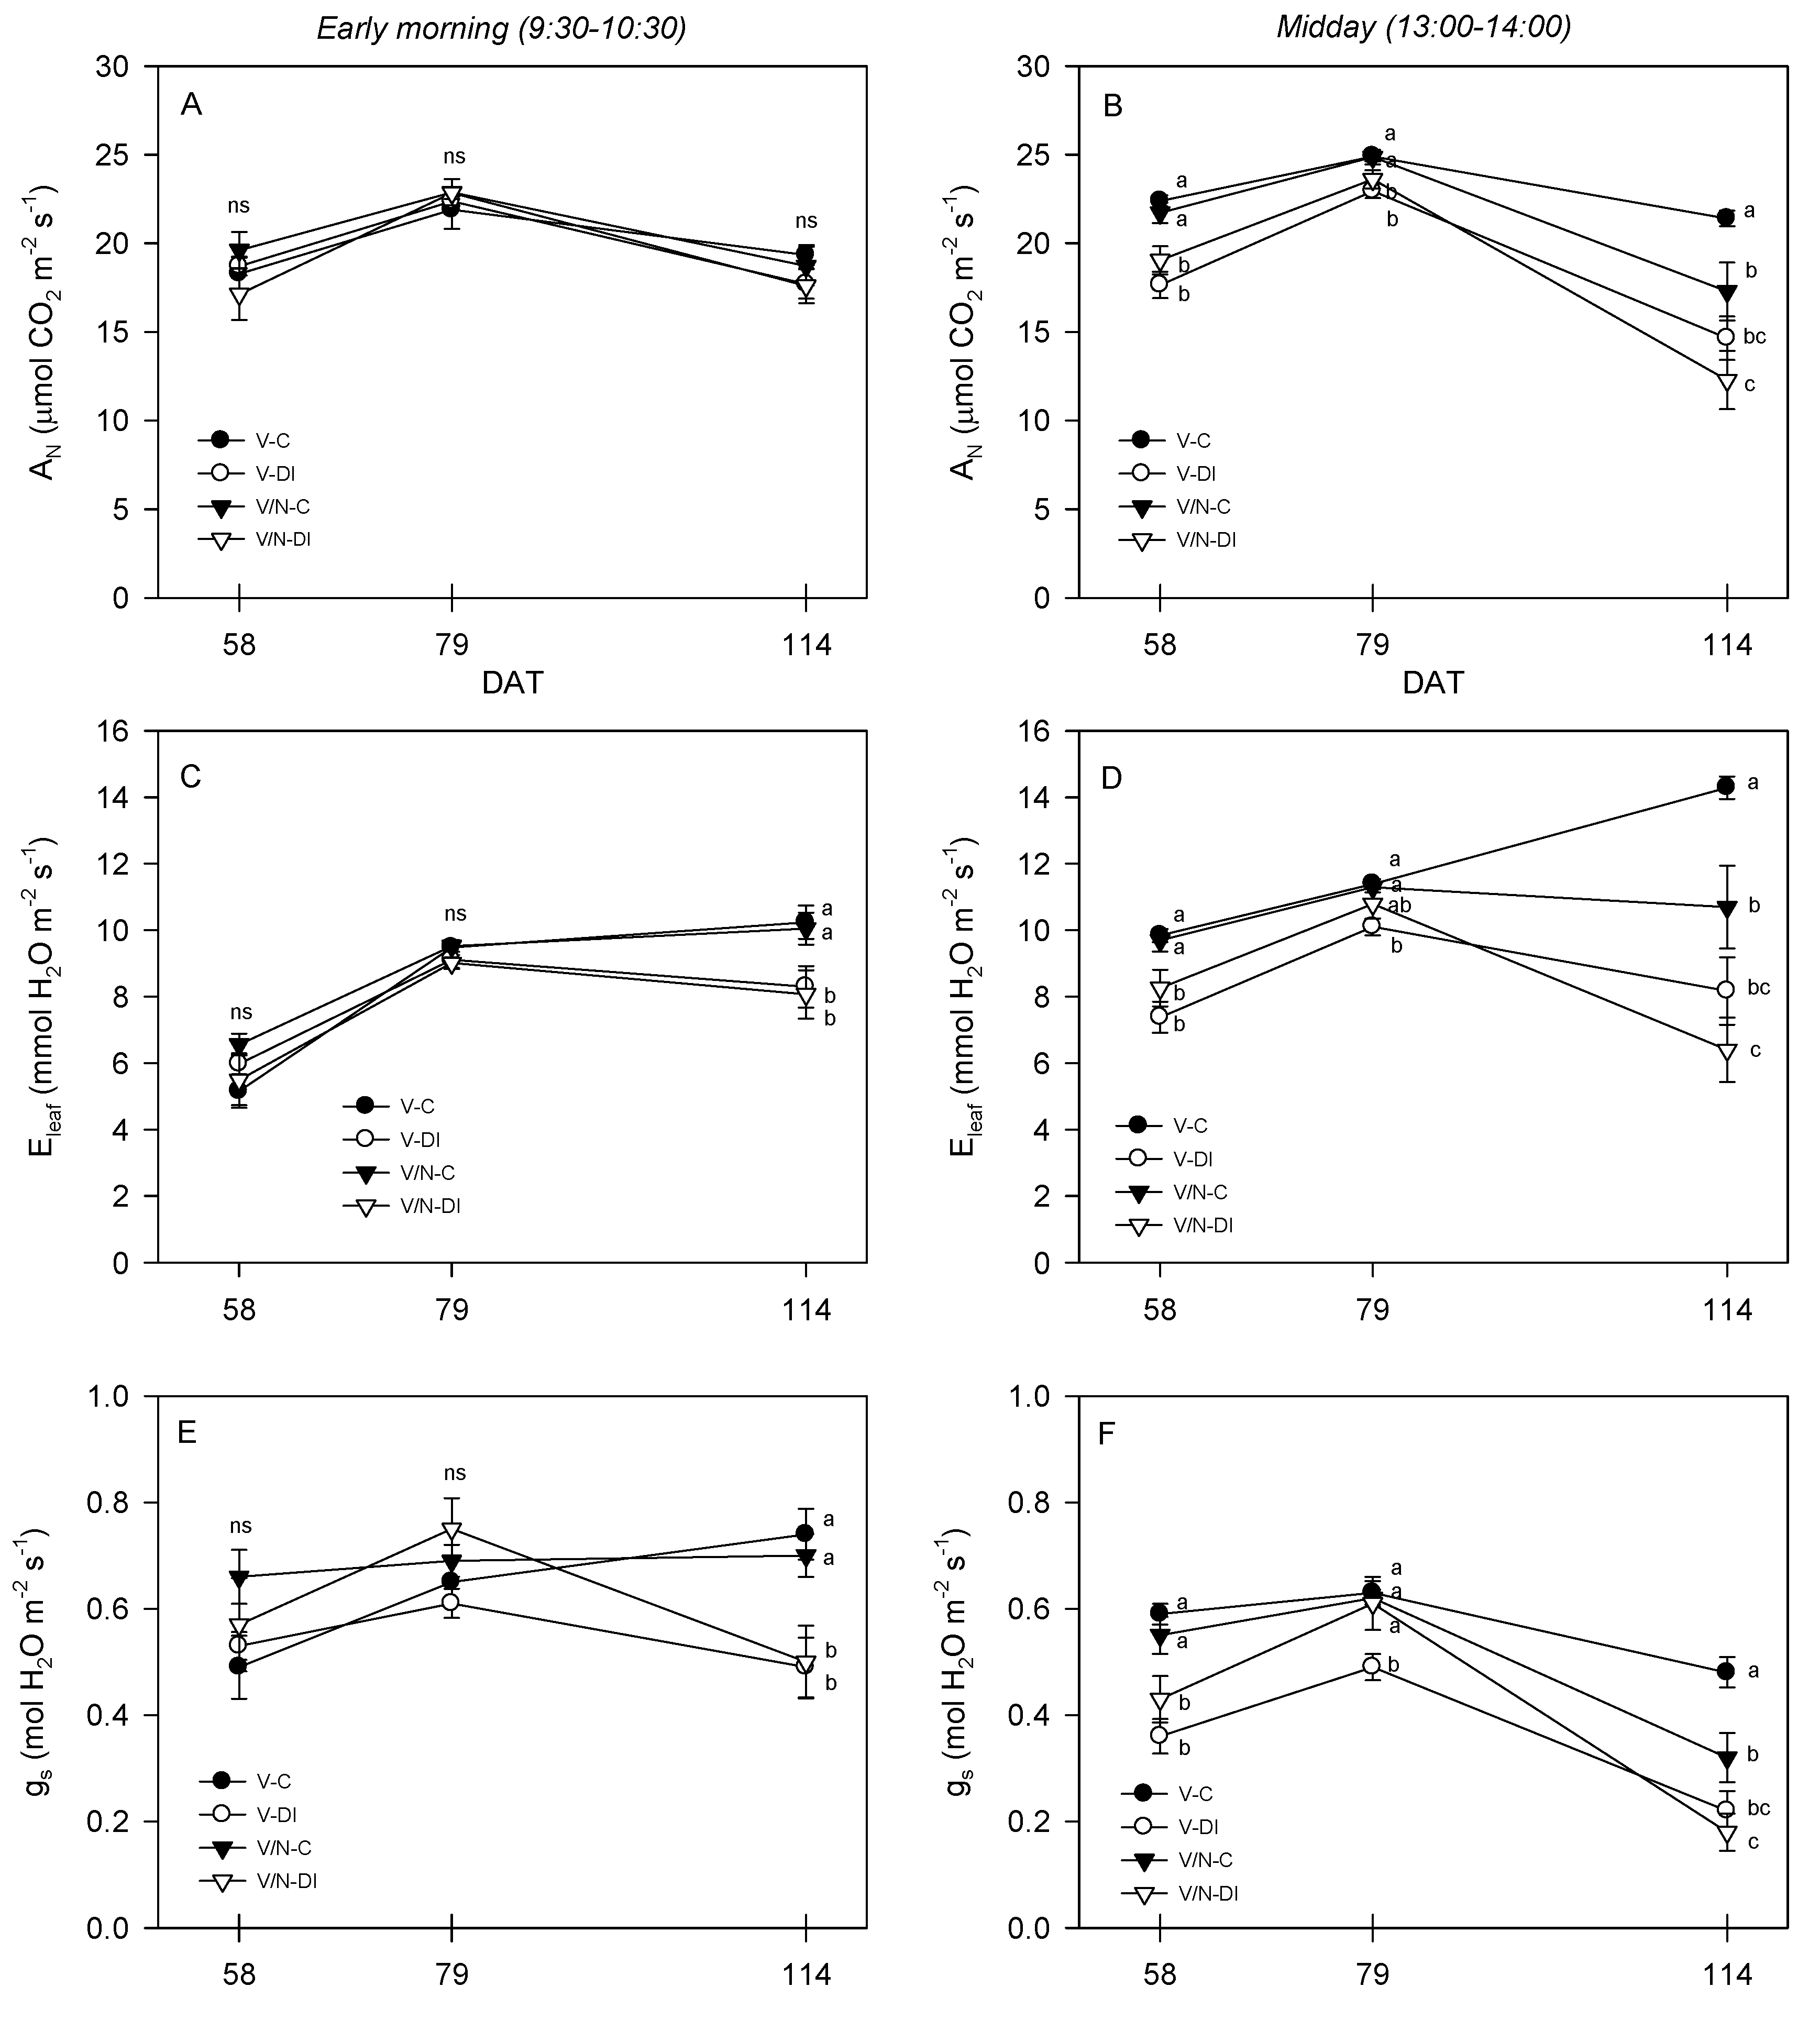
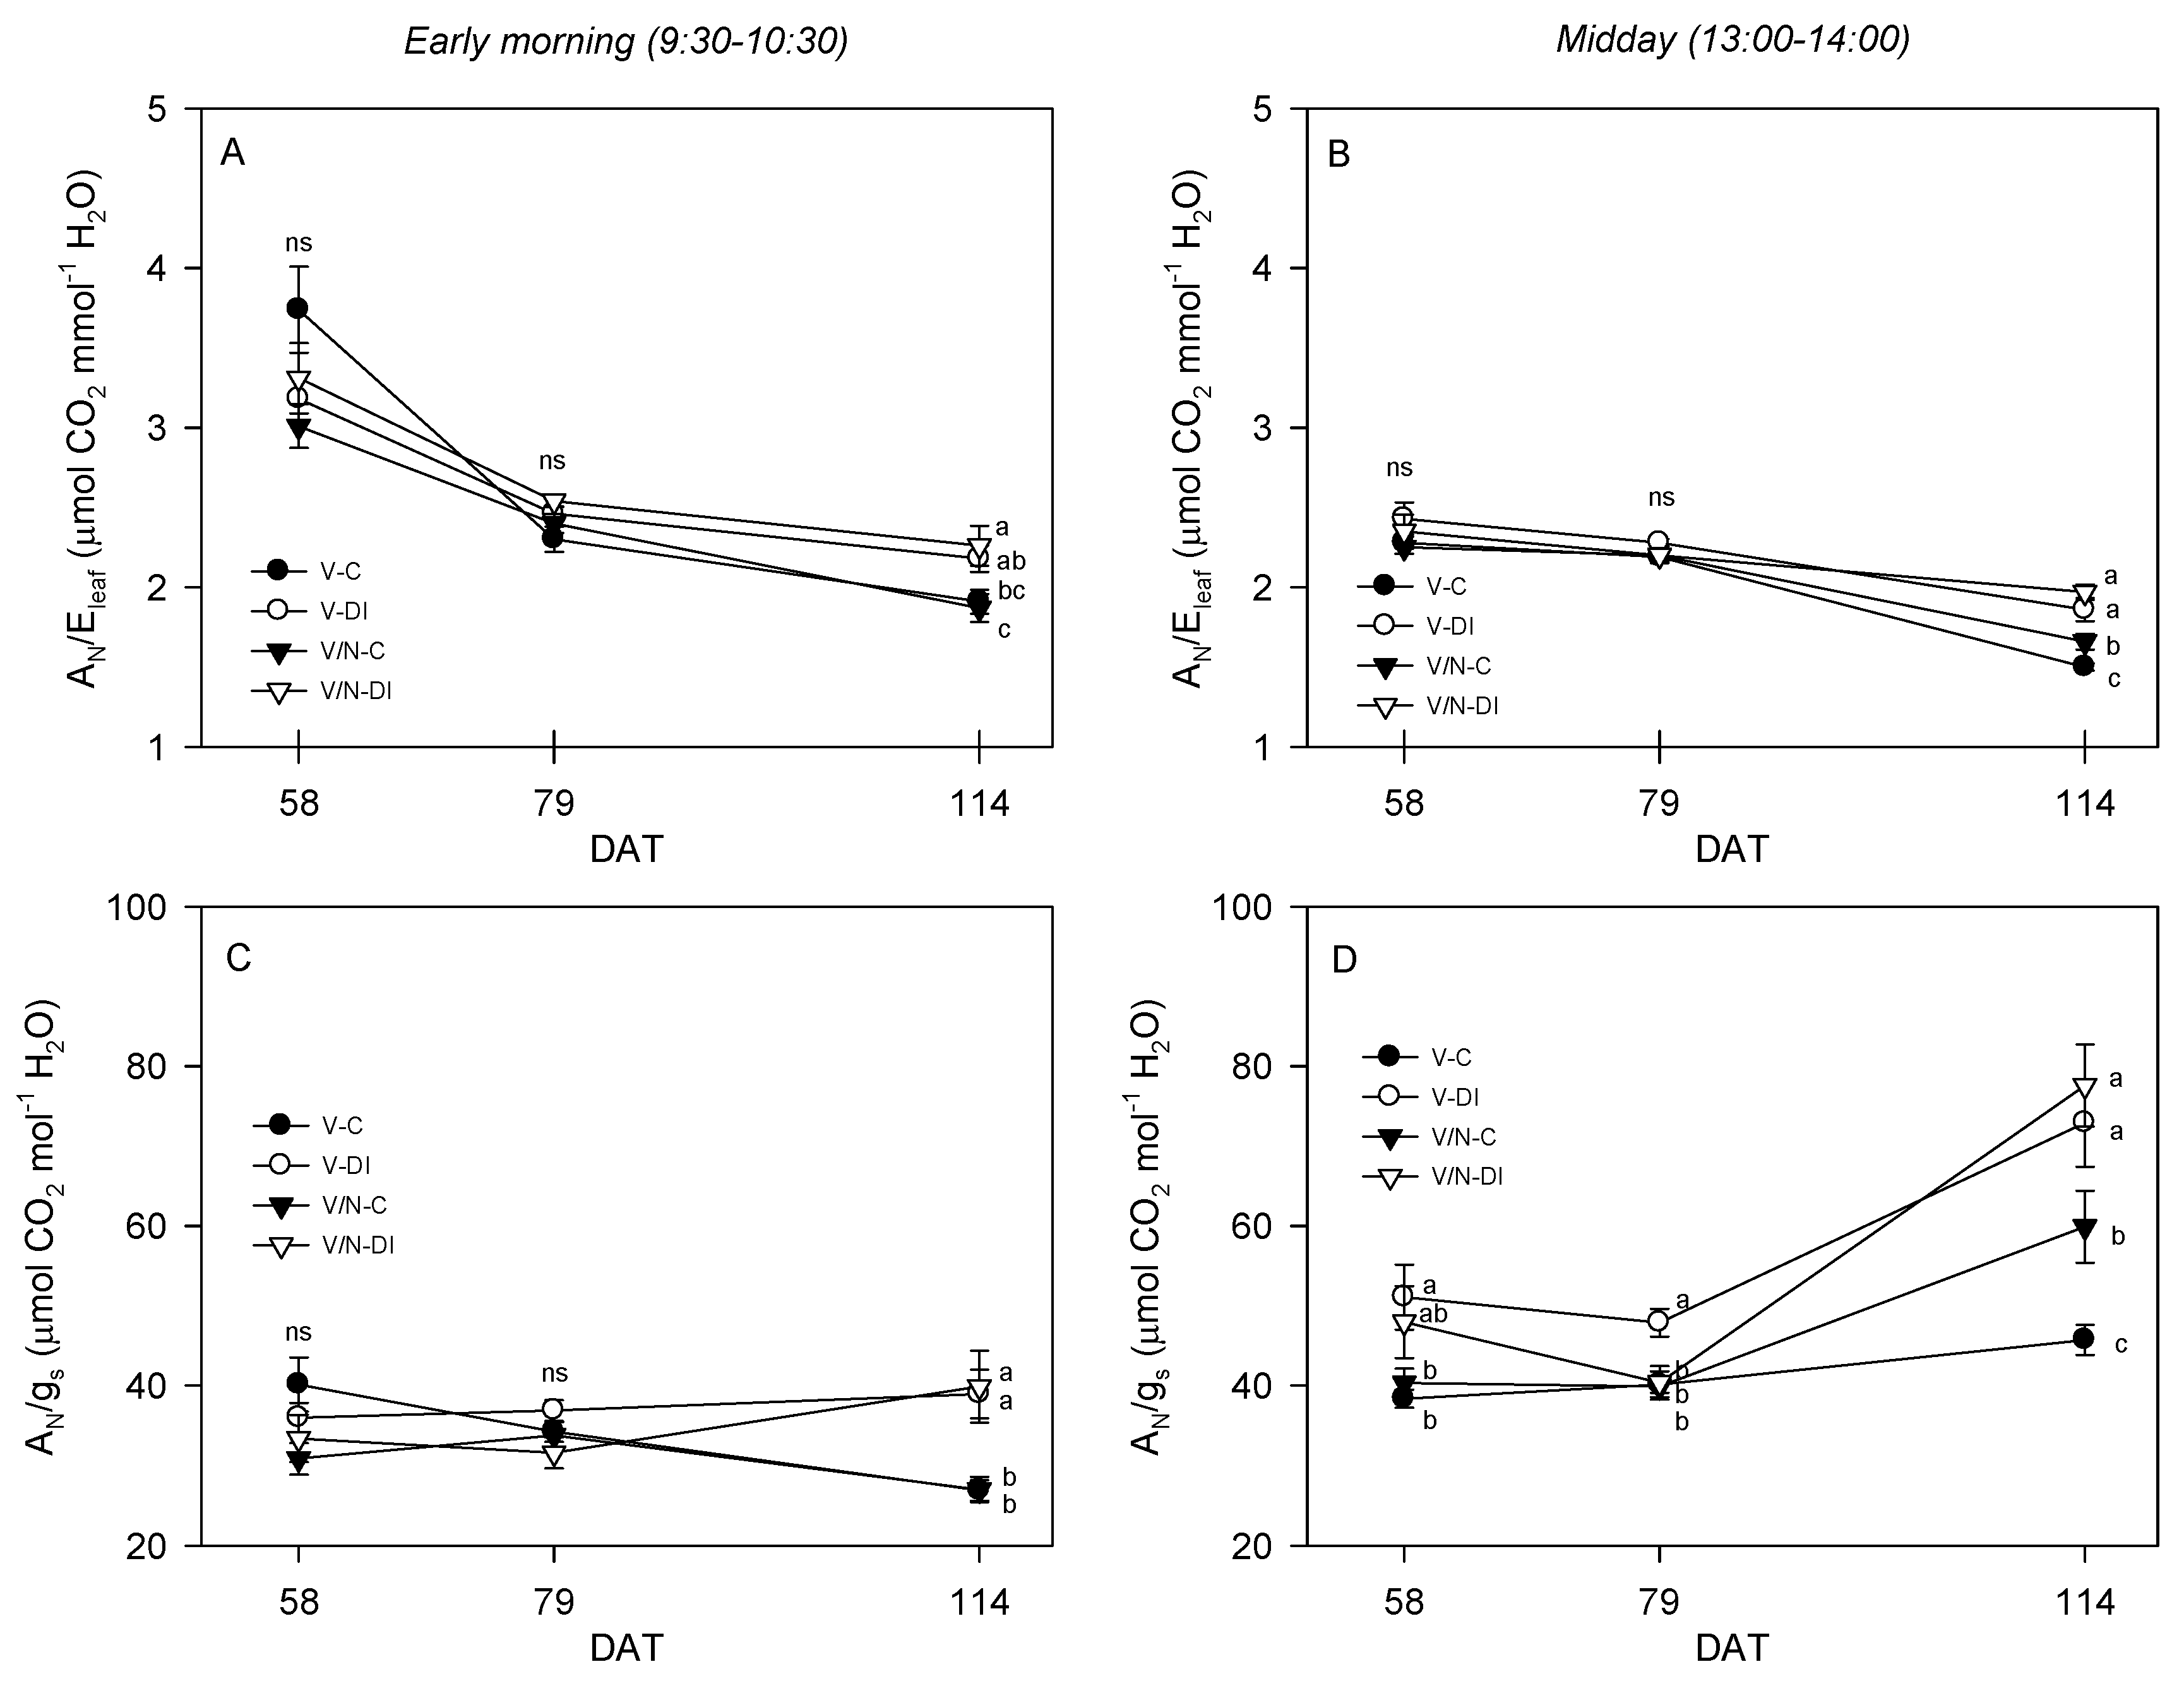
3.3. Photosynthetic Parameters
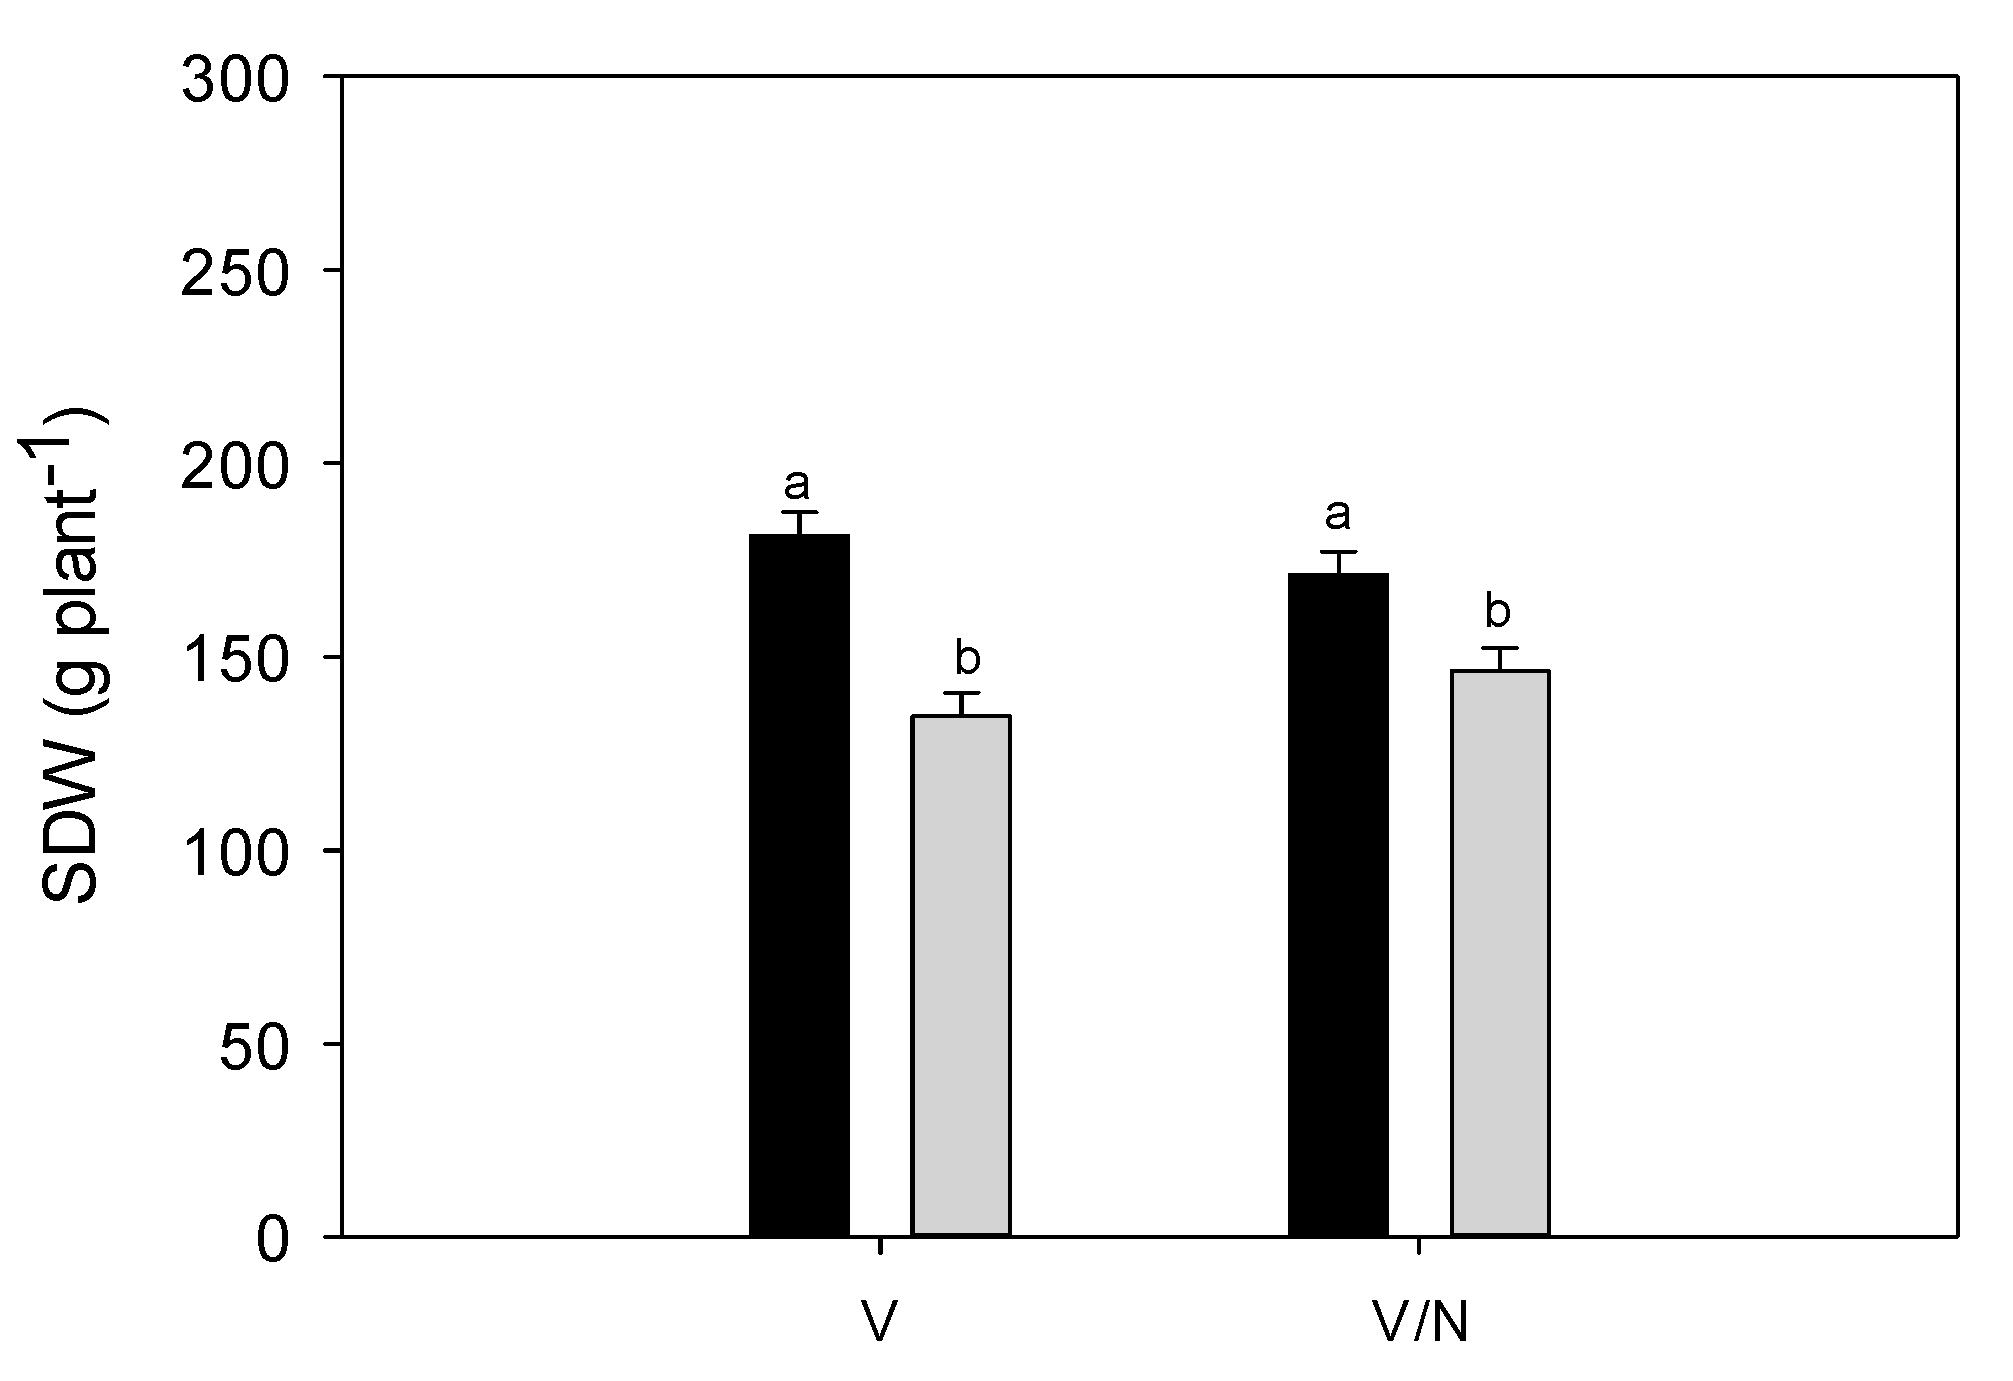
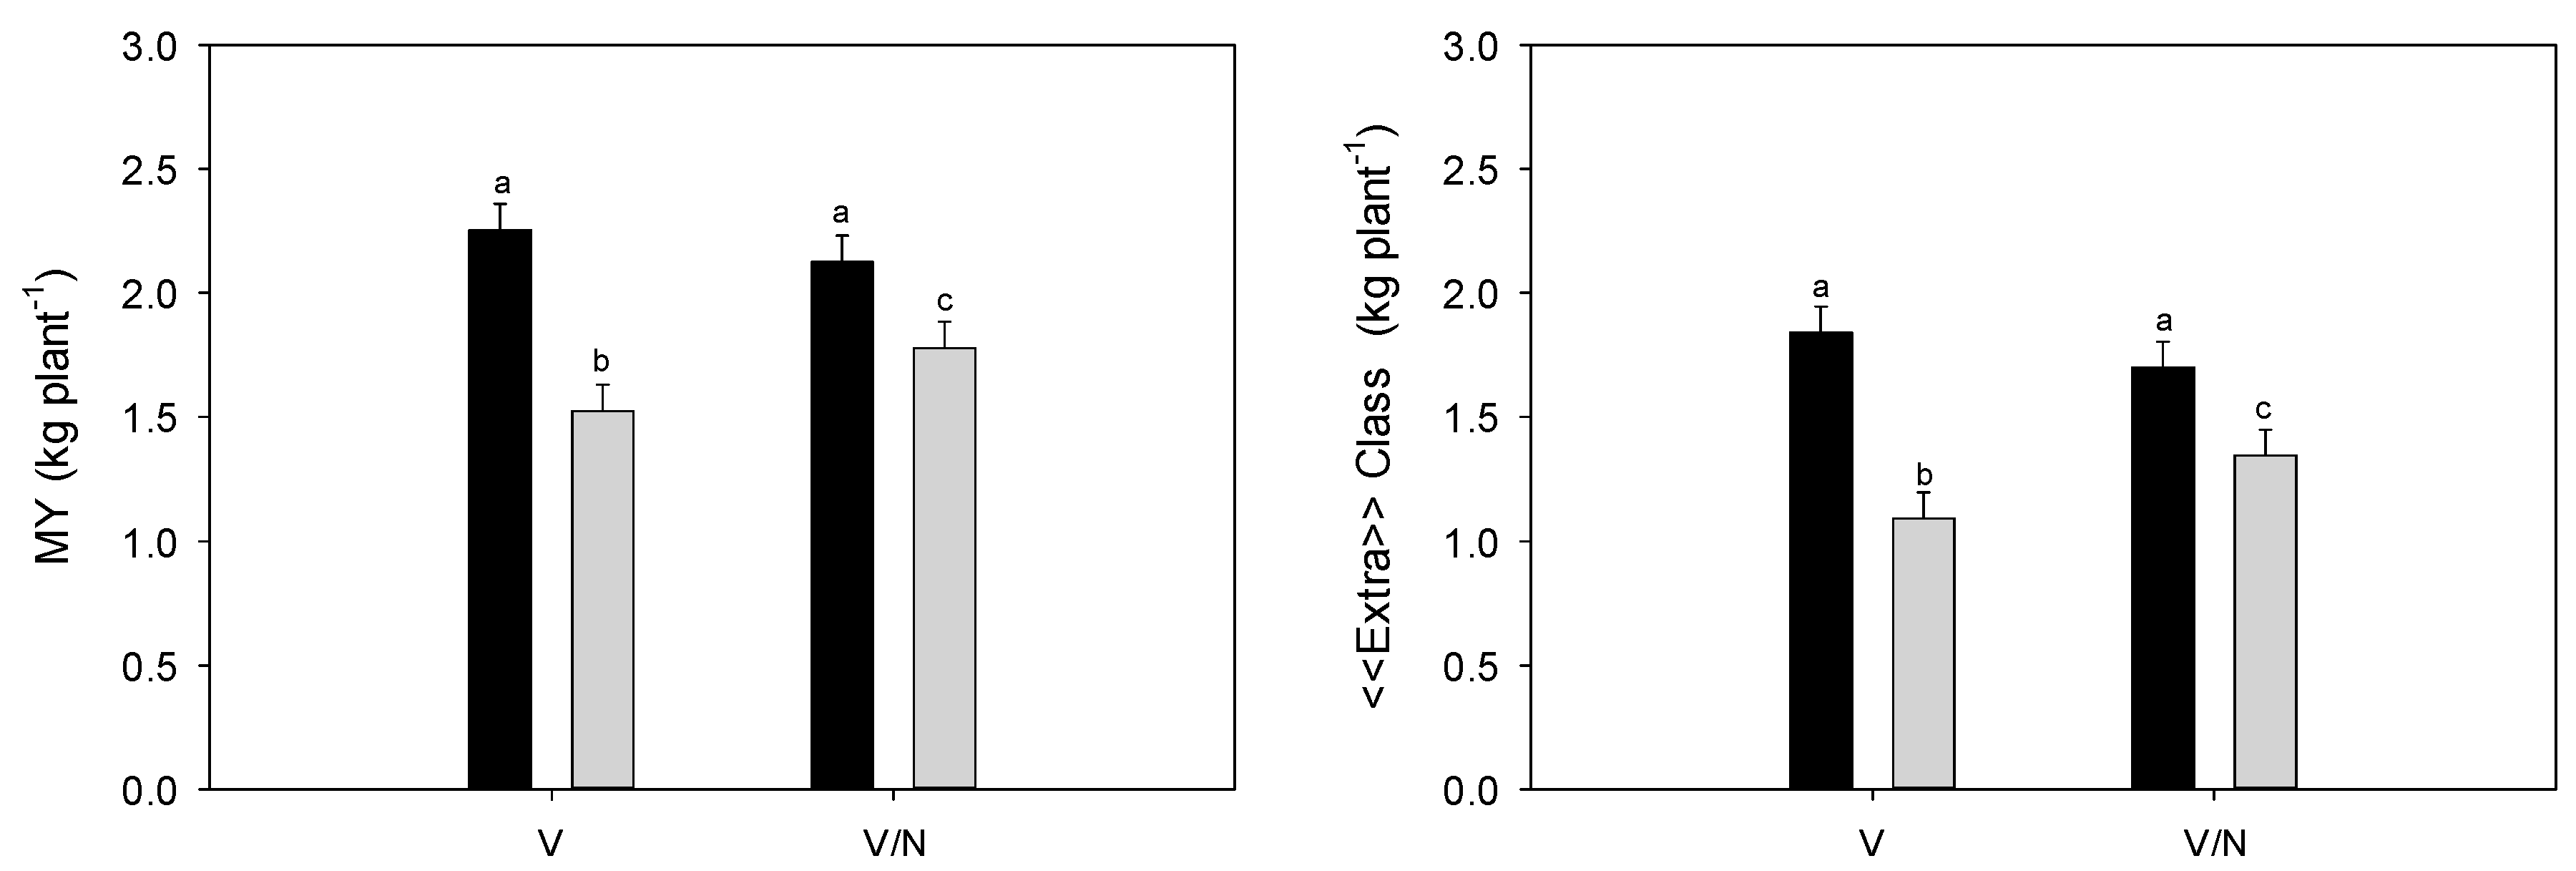
3.4. Plant Biomass and Fruit Yield
4. Discussion
5. Conclusions
Supplementary Materials
Author Contributions
Funding
Conflicts of Interest
References
- Food and Agriculture Organization. Faostat, Food and Agriculture Data. 2018. Available online: http://www.fao.org/faostat/es/#home (accessed on 28 July 2020).
- Mancosu, N.; Snyder, R.; Kyriakakis, G.; Spano, D. Water Scarcity and Future Challenges for Food Production. Water 2015, 7, 975–992. [Google Scholar] [CrossRef]
- Chai, Q.; Gan, Y.; Zhao, C.; Xu, H.L.; Waskom, R.M.; Niu, Y.; Siddique, K.H.M. Regulated deficit irrigation for crop production under drought stress. A review. Agron. Sustain. Dev. 2016, 36, 1–21. [Google Scholar] [CrossRef] [Green Version]
- Turral, H.; Burke, J.; Faures, J.M.; Faures, J.M. Climate Change, Water and Food Security; Food and Agriculture Organization: Rome, Italy, 2011; ISBN 9251067953. [Google Scholar]
- IPPC Intergovernmental Panel on Climate Change (IPCC). Available online: https://www.ipcc.ch/ (accessed on 28 July 2020).
- Kahil, M.T.; Dinar, A.; Albiac, J. Modeling water scarcity and droughts for policy adaptation to climate change in arid and semiarid regions. J. Hydrol. 2015, 522, 95–109. [Google Scholar] [CrossRef] [Green Version]
- Iglesias, A.; Garrote, L. Adaptation strategies for agricultural water management under climate change in Europe. Agric. Water Manag. 2015, 155, 113–124. [Google Scholar] [CrossRef] [Green Version]
- Turner, N.C. Agronomic options for improving rainfall-use efficiency of crops in dryland farming systems. J. Exp. Bot. 2004, 55, 2413–2425. [Google Scholar] [CrossRef] [Green Version]
- Daccache, A.; Ciurana, J.S.; Rodriguez Diaz, J.A.; Knox, J.W. Water and energy footprint of irrigated agriculture in the Mediterranean region. Environ. Res. Lett. 2014, 9, 124014. [Google Scholar] [CrossRef]
- Galindo, A.; Collado-González, J.; Griñán, I.; Corell, M.; Centeno, A.; Martín-Palomo, M.J.; Girón, I.F.; Rodríguez, P.; Cruz, Z.N.; Memmi, H.; et al. Deficit irrigation and emerging fruit crops as a strategy to save water in Mediterranean semiarid agrosystems. Agric. Water Manag. 2018, 202, 311–324. [Google Scholar] [CrossRef]
- Food and Agriculture Organization Aquastat. AQUASTAT-FAO’s Global Information System on Water and Agriculture; Food and Agriculture Organization: Rome, Italy, 2018; Available online: http://www.fao.org/nr/water/aquastat/data/query/index.html?lang=en (accessed on 18 August 2020).
- WWAP (United Nations World Water Assessment Programme). The United Nations World Water Development Report 2015: Water for a Sustainable World; United Nations Educational, Scientific and Cultural Organization: Paris, France, 2015. [Google Scholar]
- Molden, D.; Oweis, T.; Steduto, P.; Bindraban, P.; Hanjra, M.A.; Kijne, J. Improving agricultural water productivity: Between optimism and caution. Agric. Water Manag. 2010, 97, 528–535. [Google Scholar] [CrossRef]
- Levidow, L.; Zaccaria, D.; Maia, R.; Vivas, E.; Todorovic, M.; Scardigno, A. Improving water-efficient irrigation: Prospects and difficulties of innovative practices. Agric. Water Manag. 2014, 146, 84–94. [Google Scholar] [CrossRef] [Green Version]
- Kang, S.; Hao, X.; Du, T.; Tong, L.; Su, X.; Lu, H.; Li, X.; Huo, Z.; Li, S.; Ding, R. Improving agricultural water productivity to ensure food security in China under changing environment: From research to practice. Agric. Water Manag. 2017, 179, 5–17. [Google Scholar] [CrossRef]
- Ruiz-Sanchez, M.C.; Domingo, R.; Castel, J.R. Deficit irrigation in fruit trees and vines in spain. Spanish J. Agric. Res. 2010, 8, 5–20. [Google Scholar] [CrossRef] [Green Version]
- Farooq, M.; Wahid, A.; Kobayashi, N.; Fujita, D.; Basra, S.M.A. Plant drought stress: Effects, mechanisms and management. Agron. Sustain. Dev. 2009, 29, 185–212. [Google Scholar] [CrossRef] [Green Version]
- Fereres, E.; Soriano, M.A. Deficit irrigation for reducing agricultural water use. J. Exp. Bot. 2007, 58, 147–159. [Google Scholar] [CrossRef] [PubMed] [Green Version]
- Colla, G.; Rouphael, Y.; Leonardi, C.; Bie, Z. Role of grafting in vegetable crops grown under saline conditions. Sci. Hortic. (Amsterdam) 2010, 127, 147–155. [Google Scholar] [CrossRef]
- Huang, Y.; Bie, Z.; He, S.; Hua, B.; Zhen, A.; Liu, Z. Improving cucumber tolerance to major nutrients induced salinity by grafting onto Cucurbita ficifolia. Environ. Exp. Bot. 2010, 69, 32–38. [Google Scholar] [CrossRef]
- Martínez-Ballesta, M.C.; Alcaraz-López, C.; Muries, B.; Mota-Cadenas, C.; Carvajal, M. Physiological aspects of rootstock-scion interactions. Sci. Hortic. (Amsterdam) 2010, 127, 112–118. [Google Scholar] [CrossRef]
- Sánchez-Rodríguez, E.; Romero, L.; Ruiz, J.M. Accumulation on free polyamines enhanced antioxidant response in fruit of grafting tomato plants under water stress. J. Plant Physiol. 2016, 190, 72–78. [Google Scholar] [CrossRef]
- Rouphael, Y.; Cardarelli, M.; Colla, G.; Rea, E. Yield, Mineral Composition, Water Relations, and Water Use Efficiency of Grafted Mini-watermelon Plants Under Deficit Irrigation. HortScience 2008, 43, 730–736. [Google Scholar] [CrossRef] [Green Version]
- López-Marín, J.; Gálvez, A.; del Amor, F.M.; Albacete, A.; Fernández, J.A.; Egea-Gilabert, C.; Pérez-Alfocea, F. Selecting vegetative/generative/dwarfing rootstocks for improving fruit yield and quality in water stressed sweet peppers. Sci. Hortic. (Amsterdam) 2017, 214, 9–17. [Google Scholar] [CrossRef]
- Penella, C.; Nebauer, S.G.; López-Galarza, S.; San Bautista, A.; Rodríguez-Burruezo, A.; Calatayud, A. Evaluation of some pepper genotypes as rootstocks in water stress conditions. Hortic. Sci. 2014, 41, 192–200. [Google Scholar] [CrossRef] [Green Version]
- López-Serrano, L.; Penella, C.; Bautista, A.S.; López-Galarza, S.; Calatayud, A. Physiological changes of pepper accessions in response to salinity and water stress. Spanish J. Agric. Res. 2017, 15. [Google Scholar] [CrossRef] [Green Version]
- Penella, C.; Nebauer, S.G.; Bautista, A.S.; López-Galarza, S.; Calatayud, Á. Rootstock alleviates PEG-induced water stress in grafted pepper seedlings: Physiological responses. J. Plant Physiol. 2014, 171, 842–851. [Google Scholar] [CrossRef] [PubMed]
- Penella, C.; Nebauer, S.G.; López-Galarza, S.; Quiñones, A.; San Bautista, A.; Calatayud, Á. Grafting pepper onto tolerant rootstocks: An environmental-friendly technique overcome water and salt stress. Sci. Hortic. (Amsterdam) 2017, 226, 33–41. [Google Scholar] [CrossRef]
- López-Serrano, L.; Canet-Sanchis, G.; Selak, G.V.; Penella, C.; Bautista, A.S.; López-Galarza, S.; Calatayud, Á. Pepper rootstock and scion physiological responses under drought stress. Front. Plant Sci. 2019, 10, 1–13. [Google Scholar] [CrossRef] [PubMed] [Green Version]
- Maroto, J.V. Horticultura Herbácea Especial; Mundi-Prensa: Madrid, Spain, 2002. [Google Scholar]
- Allen, R.G.; Pereira, L.S.; Raes, D. Crop Evapotranspiration-Guidelines for Computing Crop Water Requirements-FAO Irrigation and Drainage Paper 56 Table of Contents; Food and Agriculture Organization: Rome, Italy, 1998. [Google Scholar]
- Bonachela, S.; González, A.M.; Fernández, M.D. Irrigation scheduling of plastic greenhouse vegetable crops based on historical weather data. Irrig. Sci. 2006, 25, 53–62. [Google Scholar] [CrossRef]
- Orgaz, F.; Fernández, M.D.; Bonachela, S.; Gallardo, M.; Fereres, E. Evapotranspiration of horticultural crops in an unheated plastic greenhouse. Agric. Water Manag. 2005, 72, 81–96. [Google Scholar] [CrossRef]
- Veihmeyer, F.J.; Hendrickson, A.H. The moisture equivalent as a measure of the field capacity of soils. Soil Sci. 1931, 32, 181–193. [Google Scholar] [CrossRef]
- Thompson, R.B.; Gallardo, M.; Agüera, T.; Valdez, L.C.; Fernández, M.D. Evaluation of the Watermark sensor for use with drip irrigated vegetable crops. Irrig. Sci. 2006, 24, 185–202. [Google Scholar] [CrossRef]
- Richards, L.A. Physical conditions of water in soils. In Methods of Soil Analysis: Part 1 Physical and Mineralogical Properties; Including Statistics of Measurement and Sampling; John Wiley & Sons, Ltd.: Hoboken, NJ, USA, 1965; pp. 128–152. [Google Scholar]
- Fernández, M.D.; Gallardo, M.; Bonachela, S.; Orgaz, F.; Thompson, R.B.; Fereres, E. Water use and production of a greenhouse pepper crop under optimum and limited water supply. J. Hortic. Sci. Biotechnol. 2005, 80, 87–96. [Google Scholar] [CrossRef]
- Van Den Honert, T.H. Water transport in plants as a catenary process. Discuss. Faraday Soc. 1948, 3, 146–153. [Google Scholar] [CrossRef]
- Ofcial Journal of the European Union (2011) Commission Implementing Regulation (EU) No 543/2011 of 7 June 2011 Laying Down Detailed Rules for the Application of Council Regulation (EC) No 1234/2007 in Respect of the Fruit and Vegetables and Processed Fruit and Vegetables Sectors. Part 8: Marketing Standard for Sweet Peppers. Available online: https://eur-lex.europa.eu/LexUriServ/LexUriServ.do?uri=OJ:L:2011:157:0001:0163:EN:PDF (accessed on 28 July 2020).
- Sezen, S.M.; Yazar, A.; Tekin, S. Physiological response of red pepper to different irrigation regimes under drip irrigation in the Mediterranean region of Turkey. Sci. Hortic. (Amsterdam) 2019, 245, 280–288. [Google Scholar] [CrossRef]
- Abdelkhalik, A.; Pascual, B.; Nájera, I.; Domene, M.A.; Baixauli, C.; Pascual-Seva, N. Effects of deficit irrigation on the yield and irrigation water use efficiency of drip-irrigated sweet pepper (Capsicum annuum L.) under Mediterranean conditions. Irrig. Sci. 2020, 38. [Google Scholar] [CrossRef]
- Pogonyi, Á.; Pék, Z.; Helyes, L.; Lugasi, A. Effect of grafting on the tomato’s yield, quality and main fruit components in spring forcing. Acta Aliment. 2005, 34, 453–462. [Google Scholar] [CrossRef]
- Lee, J.M.; Kubota, C.; Tsao, S.J.; Bie, Z.; Echevarria, P.H.; Morra, L.; Oda, M. Current status of vegetable grafting: Diffusion, grafting techniques, automation. Sci. Hortic. (Amsterdam) 2010, 127, 93–105. [Google Scholar] [CrossRef]
- López-Serrano, L.; Canet-Sanchis, G.; Selak, G.V.; Penella, C.; San Bautista, A.; López-Galarza, S.; Calatayud, Á. Physiological characterization of a pepper hybrid rootstock designed to cope with salinity stress. Plant Physiol. Biochem. 2020, 148, 207–219. [Google Scholar] [CrossRef]
- Agele, S.; Cohen, S. Effect of genotype and graft type on the hydraulic characteristics and water relations of grafted melon. J. Plant Interact. 2009, 4, 59–66. [Google Scholar] [CrossRef]
- Delfine, S.; Tognetti, R.; Loreto, F.; Alvino, A. Physiological and growth responses to water stress in field-grown bell pepper (Capsicum annuum L.). J. Hortic. Sci. Biotechnol. 2002, 77, 697–704. [Google Scholar] [CrossRef]
- Nilsen, E.T.; Freeman, J.; Grene, R.; Tokuhisa, J. A Rootstock Provides Water Conservation for a Grafted Commercial Tomato (Solanum lycopersicum L.) Line in Response to Mild-Drought Conditions: A Focus on Vegetative Growth and Photosynthetic Parameters. PLoS ONE 2014, 9, e115380. [Google Scholar] [CrossRef]
- Munns, R. Why measure osmotic adjustment? Aust. J. Plant Physiol. 1988, 15, 717–726. [Google Scholar] [CrossRef]
- Sánchez-Rodríguez, E.; Rubio-Wilhelmi, M.D.M.; Blasco, B.; Leyva, R.; Romero, L.; Ruiz, J.M. Antioxidant response resides in the shoot in reciprocal grafts of drought-tolerant and drought-sensitive cultivars in tomato under water stress. Plant Sci. 2012, 188–189, 89–96. [Google Scholar] [CrossRef]
- Gaion, L.A.; Monteiro, C.C.; Cruz, F.J.R.; Rossatto, D.R.; López-Díaz, I.; Carrera, E.; Lima, J.E.; Peres, L.E.P.; Carvalho, R.F. Constitutive gibberellin response in grafted tomato modulates root-to-shoot signaling under drought stress. J. Plant Physiol. 2018, 221, 11–21. [Google Scholar] [CrossRef] [PubMed] [Green Version]


| Growth Stages | Duration (days) | ETc (mm) | Irrigation Water Applied (mm) | ||
|---|---|---|---|---|---|
| Control | Deficit Irrigation | ||||
| 2018 | |||||
| Vegetative growth | 34 | 22.1 | 25.7 | 21.9 | |
| Fruit development | 29 | 45.0 | 54.0 | 27.0 | |
| Harvesting period | 49 | 163.4 | 136.6 | 76.5 | |
| Total | 112 | 230.5 | 216.3 | 125.4 | |
| 2019 | |||||
| Vegetative growth | 34 | 19.7 | 20.2 | 22.6 | |
| Fruit development | 43 | 82.9 | 76.2 | 33.3 | |
| Harvesting period | 38 | 125.8 | 110.4 | 60.5 | |
| Total | 115 | 228.4 | 206.8 | 116.4 | |
| Plant Type | 2018 | 2019 | |||
|---|---|---|---|---|---|
| FC | PWP | FC | PWP | ||
| Control | V-C | 0.19 | 0.08 | 0.24 | 0.13 |
| V/N-C | 0.17 | 0.08 | 0.23 | 0.13 | |
| Deficit irrigation | V-DI | 0.23 | 0.08 | 0.19 | 0.13 |
| V/N-DI | 0.22 | 0.08 | 0.19 | 0.13 | |
| SDW (g plant−1) | TDW (g plant−1) | HI (-) | |||||
|---|---|---|---|---|---|---|---|
| Irrigation strategy (IS) | |||||||
| C | 176.3 | a | 311.7 | a | 0.437 | ||
| DI | 140.5 | b | 240.8 | b | 0.416 | ||
| Plant type (PT) | |||||||
| V | 158.0 | 270.8 | 0.418 | ||||
| V/N | 158.8 | 281.7 | 0.434 | ||||
| Growing season (GS) | |||||||
| 2018 | 157.8 | 272.5 | 0.421 | ||||
| 2019 | 158.9 | 280.0 | 0.432 | ||||
| ANOVA (df) | % Sum of the Squares | ||||||
| IS (1) | 69.85 | ** | 81.01 | ** | 13.18 | n.s. | |
| PT (1) | 0.03 | n.s. | 1.89 | n.s. | 7.61 | n.s. | |
| GS (1) | 0.06 | n.s. | 0.91 | n.s. | 3.56 | n.s. | |
| IS*PT (1) | 6.51 | * | 1.89 | n.s. | 0.00 | n.s. | |
| IS*GS (1) | 3.57 | n.s. | 0.55 | n.s. | 9.30 | n.s. | |
| PT*GS (1) | 2.74 | n.s. | 2.52 | n.s. | 9.30 | n.s. | |
| IS*PT*GS (1) | 3.01 | n.s. | 1.89 | n.s. | 0.19 | n.s. | |
| Residuals (16) | 14.22 | 9.33 | 0.53 | ||||
| Std. Dev.(+) | 9.9 | 14.7 | 0.026 | ||||
| MY (kg plant−1) | «Extra» Class (kg plant−1) | Class I (kg plant−1) | |||||
|---|---|---|---|---|---|---|---|
| Irrigation strategy (IS) | |||||||
| C | 2.189 | a | 1.770 | a | 0.421 | ||
| DI | 1.652 | b | 1.219 | b | 0.432 | ||
| Plant type (PT) | |||||||
| V | 1.889 | 1.466 | 0.425 | ||||
| V/N | 1.952 | 1.523 | 0.428 | ||||
| Growing season (GS) | |||||||
| 2018 | 1.906 | 1.484 | 0.423 | ||||
| 2019 | 1.935 | 1.505 | 0.430 | ||||
| ANOVA (df) | % Sum of the Squares | ||||||
| IS (1) | 66.03 | ** | 66.19 | ** | 0.04 | n.s. | |
| PT (1) | 0.89 | n.s. | 0.69 | n.s. | 0.74 | n.s. | |
| GS (1) | 0.19 | n.s. | 0.09 | n.s. | 0.36 | n.s. | |
| IS*PT (1) | 8.32 | * | 8.52 | * | 0.22 | n.s. | |
| IS*GS (1) | 3.62 | n.s. | 4.10 | n.s. | 20.93 | n.s. | |
| PT*GS (1) | 0.00 | n.s. | 0.67 | n.s. | 0.99 | n.s. | |
| IS*PT*GS (1) | 2.48 | n.s. | 2.75 | n.s. | 0.53 | n.s. | |
| Residuals (16) | 18.45 | 16.98 | 76.19 | n.s. | |||
| Std. Dev. (+) | 0.174 | 0.171 | 0.067 | n.s. | |||
| No. «Extra» Class (fruits plant−1) | AFW «Extra» Class (g fruit−1) | ||||
|---|---|---|---|---|---|
| Irrigation strategy (IS) | |||||
| C | 8.16 | a | 218.5 | a | |
| DI | 6.06 | b | 201.0 | b | |
| Plant type (PT) | |||||
| V | 7.11 | 204.6 | |||
| V/N | 7.11 | 214.9 | |||
| Growing season (GS) | |||||
| 2018 | 6.91 | 213.7 | |||
| 2019 | 7.31 | 205.7 | |||
| ANOVA (df) | % Sum of Squares | ||||
| IS (1) | 50.43 | ** | 26.15 | * | |
| PT (1) | 0.00 | n.s. | 9.07 | n.s. | |
| GS (1) | 1.80 | n.s. | 5.41 | n.s. | |
| IS*PT (1) | 8.06 | n.s. | 0.96 | n.s. | |
| IS*GS (1) | 5.45 | n.s. | 0.04 | n.s. | |
| PT*GS (1) | 0.08 | n.s. | 2.73 | n.s. | |
| IS*PT*GS (1) | 4.26 | n.s. | 0.14 | n.s. | |
| Residuals (16) | 29.93 | 55.49 | |||
| Std. Dev. (+) | 0.99 | 15.6 | |||
© 2020 by the authors. Licensee MDPI, Basel, Switzerland. This article is an open access article distributed under the terms and conditions of the Creative Commons Attribution (CC BY) license (http://creativecommons.org/licenses/by/4.0/).
Share and Cite
Gisbert-Mullor, R.; Pascual-Seva, N.; Martínez-Gimeno, M.A.; López-Serrano, L.; Badal Marín, E.; Pérez-Pérez, J.G.; Bonet, L.; Padilla, Y.G.; Calatayud, Á.; Pascual, B.; et al. Grafting onto an Appropriate Rootstock Reduces the Impact on Yield and Quality of Controlled Deficit Irrigated Pepper Crops. Agronomy 2020, 10, 1529. https://doi.org/10.3390/agronomy10101529
Gisbert-Mullor R, Pascual-Seva N, Martínez-Gimeno MA, López-Serrano L, Badal Marín E, Pérez-Pérez JG, Bonet L, Padilla YG, Calatayud Á, Pascual B, et al. Grafting onto an Appropriate Rootstock Reduces the Impact on Yield and Quality of Controlled Deficit Irrigated Pepper Crops. Agronomy. 2020; 10(10):1529. https://doi.org/10.3390/agronomy10101529
Chicago/Turabian StyleGisbert-Mullor, Ramón, Nuria Pascual-Seva, María Amparo Martínez-Gimeno, Lidia López-Serrano, Eduardo Badal Marín, Juan Gabriel Pérez-Pérez, Luis Bonet, Yaiza Gara Padilla, Ángeles Calatayud, Bernardo Pascual, and et al. 2020. "Grafting onto an Appropriate Rootstock Reduces the Impact on Yield and Quality of Controlled Deficit Irrigated Pepper Crops" Agronomy 10, no. 10: 1529. https://doi.org/10.3390/agronomy10101529