Article

Comprehensive In Silico Characterization and Expression Profiling of Nine Gene Families Associated with Calcium Transport in Soybean

1
College of Life and Environmental Sciences, Hangzhou Normal University, Hangzhou 311121, China
2
College of Resources and Environmental Sciences, Nanjing Agricultural University, Nanjing 210095, China
3
Institute of Industrial Crops, Jiangsu Academy of Agricultural Sciences, Nanjing 210014, China
*
Authors to whom correspondence should be addressed.
Agronomy 2020, 10(10), 1539; https://doi.org/10.3390/agronomy10101539
Submission received: 10 September 2020 / Revised: 5 October 2020 / Accepted: 8 October 2020 / Published: 10 October 2020
(This article belongs to the Section Soil and Plant Nutrition)

Abstract

:
Calcium (Ca2+) plays a critical role in the regulation of growth and development and environmental stress responses in plants. The membrane-associated Ca2+ transport proteins are required to mediate Ca2+ signaling and maintain Ca2+ homeostasis. Ca2+ channels, pumps (ATPases), and antiporters are three major classes of Ca2+ transporters. Although the genome-wide analysis of Ca2+ transporters in model plants Arabidopsis and rice have been well documented, the identification, classification, phylogenesis, expression profiles, and physiological functions of Ca2+ transport proteins in soybean are largely unknown. In this study, a comprehensive in silico analysis of gene families associated with Ca2+ transport was conducted, and a total of 207 putative Ca2+ transporter genes have been identified in soybean. These genes belong to nine different families, such as Ca2+-ATPase, Ca2+/cation antiporter, cyclic nucleotide-gated ion channel (CNGC), and hyperosmolality induced cytosolic Ca2+ concentration channel (OSCA). Detailed analysis of these identified genes was performed, including their classification, phylogenesis, protein domains, chromosomal distribution, and gene duplication. Expression profiling of these genes was conducted in different tissues and developmental stages, as well as under stresses using publicly available RNA-seq data. Some genes were found to be predominantly expressed in specific tissues like flowers and nodules, and some genes were found to be expressed strongly during seed development. Seventy-four genes were found to be significantly and differentially expressed under abiotic and biotic stresses, such as salt, phosphorus deficiency, and fungal pathogen inoculation. In addition, hormonal signaling- and stress response-related cis-elements and potential microRNA target sites were analyzed. This study suggests the potential roles of soybean Ca2+ transporters in stress responses and growth regulation, and provides a basis for further functional characterization of putative Ca2+ transporters in soybean.

1. Introduction

Calcium (Ca2+) is an essential macronutrient required for various physiological and biochemical processes in plants [1]. As the divalent cation, Ca2+ is indispensable for plant growth and development by playing a structural role in the cell wall, acting as a counter-cation for inorganic and organic anions in the vacuole, and functioning as a universal intracellular second messenger in the cytosol [2]. A high ratio of total Ca2+ in plant tissues is located in cell walls, which is required for cell wall stabilization [1]. Within plant cells, a high amount of Ca2+ is usually sequestered in vacuoles and endoplasmic reticulum (ER), but the concentration of Ca2+ in the cytoplasm and nucleus is always very low (~100–200 nM). High levels of cytosolic Ca2+ are toxic to cells by forming a complex with macromolecules and forming insoluble compounds with phosphate derivatives [1,2]. Plants have thus evolved Ca2+-transporting and Ca2+-buffering systems that work in concert to tightly regulate cytosolic Ca2+ concentration ([Ca2+]cyt) [3,4].
Ca2+ signal plays a critical role in plant responses to environmental stresses, as well as hormonal and developmental cues [5,6,7,8]. The typical Ca2+ signaling process can be divided into several steps: A stimulus activates Ca2+-permeable channels to generate specific Ca2+ signals after it is detected by its receptor; then Ca2+ binds to specific proteins (Ca2+ sensors), and in turn, modulates the effector proteins and elicits changes in cellular activities; and finally, the resting state of Ca2+ is restored by removing Ca2+ from the cytoplasm [9,10]. It is well-known that various environmental and developmental cues can trigger specific and distinct spatial-temporal patterns of changes of [Ca2+]cyt [6,11,12]. The [Ca2+]cyt changes triggered by stimuli are stimulus-specific in terms of frequency, amplitude, duration, and location, which is designated as “Ca2+ signature” [9,13]. Stimuli-specific Ca2+ signature is generated by spatial and temporal Ca2+ fluxes [3,5,14]. Diverse Ca2+ transporters are involved in the establishment of the Ca2+ signature and Ca2+ gradient across the plasma membrane and the inner membranes of plant cells, and thus, play important roles in plant growth and development, and plant responses to various stresses [2,9,15,16]. Ca2+ channels, Ca2+ pumps (also named Ca2+-ATPases), and Ca2+ antiporters (also named Ca2+ exchangers) are three major kinds of Ca2+ transport proteins [2,3].
Ion channels can be broadly classified into voltage-gated, ligand-gated, and mechanical-gated ion channels. A voltage-gated ion channel is regulated by voltage difference across a membrane, a ligand-gated ion channel responds to a ligand-receptor interaction, and a mechanosensitive (MS) ion channel responds to mechanical stimuli [14]. The cyclic nucleotide-gated ion channels (CNGCs) belonging to the superfamily of voltage-gated ion channels, are Ca2+-permeable cation-conducting channels that transport Ca2+, sodium, and potassium cations across membranes. They have been demonstrated to be involved in Ca2+-conducting signal transduction pathways, and are essential for many physiological functions, such as tip growth of pollen tubes and root hairs, leaf senescence, pathogen defense, and abiotic stress tolerance [9,17,18]. There are 20 and 16 CNGC members in Arabidopsis (Arabidopsis thaliana) and rice (Oryza sativa), respectively [19,20].
Hyperosmolality-induced [Ca2+]cyt channel 1 (OSCA1) is a recently identified unique Ca2+ channel that was indicated to be an osmosensor by mediating the elevation of [Ca2+]cyt via activation of Ca2+ influx conductance in Arabidopsis [15]. Its homolog OSCA1.3 was also indicated to be a Ca2+-permeable channel controlling stomatal closure during immunity [21]. OSCA1 belongs to a gene family with 15 members in Arabidopsis and 11 members in rice [15,22]. Two-pore cation channel (TPC) is a special class of voltage-gated Ca2+ channels [16]. Arabidopsis genome has a single TPC1 gene, which has been described as a tonoplast localized channel responsible for the Ca2+ triggered slow vacuolar current [16]. There is also only one TPC1 gene in rice genome; it was demonstrated to be a putative voltage-gated Ca2+-permeable channel [23]. Glutamate receptor-like (GLR) proteins are nonselective cation channels that can be activated by amino acids like glutamate and glycine [24]. Arabidopsis GLR3.4 was identified to be Ca2+ selective channel, and GLR1.2 and GLR3.3 were found to be closely related to the generation of Ca2+ signals [25,26,27]. In Arabidopsis and rice, 15 and 13 GLR family members have been identified, respectively [24,28].
MS channels respond to a wide range of mechanical stimuli, and play an important role in many physiological functions like osmotic pressure, touch and pain sensation, cell volume regulation, and gravity sense [29]. The first family of putative MS ion channels in plants was identified based on the channels’ similarity to the E. coli MS channel of small conductance (MscS) [30]. Plant MscS like proteins (MSLs) have been suggested to be involved in mechanical osmotic stimuli-triggered Ca2+ signals [3]. MSL family genes have been characterized in Arabidopsis and rice, wherein ten and six MSL genes have been found, respectively [31,32]. The yeast Mid1 is a stretch-activated MS ion channel required for Ca2+ influx [30]. Mid1-complementing activity (MCA) proteins in plants were identified by a functional screen for cDNAs capable of rescuing the mid1 mutant strain of yeast Saccharomyces cerevisiae [33]. In Arabidopsis, there are two MCA members, while there is only one MCA in rice [33,34]. These MCAs were found to be required for Ca2+ influx in response to mechanical events and mediate Ca2+ homeostasis [30,33,34,35]. Annexins (ANNs) are multifunctional lipid-binding proteins, encoded by a large multigene family spread through the Eukaryote and Prokaryote domains [36]. Plant ANN family proteins have been suggested to function as unconventional Ca2+-permeable channels, with roles in linking Ca2+, redox, and lipid signaling to coordinate development with environmental stress response [37,38,39,40]. Eight genes encoding putative ANNs were detected in Arabidopsis; 11 and 25 genes were found in rice and wheat, respectively [41,42,43].
Elevation of [Ca2+]cyt is triggered by various stimuli, and the recovery of basal [Ca2+]cyt is mediated by Ca2+ extrusion and sequestration mechanisms, which requires energy-consuming Ca2+ transporters that work against the electrochemical gradient [3]. Plant Ca2+-ATPases are members of the P-type ATPase superfamily implicated in the restoration and maintenance of ion homeostasis by pumping Ca2+ out of the cytosol [44]. Plant P-type Ca2+-ATPases are divided into two groups, type IIA (ER-type Ca2+-ATPase, ECA) and type IIB (autoinhibited Ca2+-ATPase, ACA). ACAs contain an N-terminal autoinhibitory domain that binds to calmodulin and activates the Ca2+ pump [45,46]. Plant genomes encode multiple isoforms of both ECAs and ACAs: four ECA genes in Arabidopsis and three in rice, and 10 ACA genes in Arabidopsis and 11 in rice have been detected [47,48]. The Ca2+/cation antiporter (CaCA) is also involved in Ca2+ transport and homeostasis. The CaCA superfamily can be classified in four distinct subfamilies in higher plants: The H+/cation exchanger (CAX), the cation/Ca2+ exchanger (CCX), the Na+/Ca2+ exchanger (NCX) related Mg2+/H+ exchanger (MHX), and the CAX-related Na+/Ca2+ exchanger-like (NCL) proteins [49]. Thirteen CaCA genes in Arabidopsis and 16 genes in rice have been identified [49,50].
Soybean (Glycine max) is an important economic crop which provides protein- and oil-rich foods for us human. Soybean is also an important crop for producing renewable fuel of biodiesel. However, the yield of soybean all over the world is frequently affected by environmental stresses [51,52,53]. Although the roles of diverse Ca2+ transporters in abiotic and biotic stress responses, hormone signaling, and development have been well documented [9,15,54,55], the majority of these studies were carried out in model plants like Arabidopsis and rice. The identification, classification, phylogenesis, expression profile, and physiological functions of Ca2+ transport proteins in soybean are largely unknown. In this study, we performed a genome-wide survey, identified and analyzed all the families encoding putative Ca2+ transport proteins in the soybean genome.

2. Materials and Methods

2.1. Identification of Ca2+ Transport Proteins in the Soybean Genome

Proteins encoding putative transport proteins in the soybean genome were searched from the Phytozome’s soybean database (https://phytozome.jgi.doe.gov/pz/portal.html) using different keywords, such as “calcium transporter”, “calcium channel”, “calcium pump”, “calcium exchanger”, “cyclic nucleotide-gated channel”, “glutamate receptor”, “annexin”, “two-pore cation channel”, and “mechanosensitive-like channel”. In addition, the amino acid sequences of Arabidopsis CNGCs, Ca2+-ATPases, Ca2+/cation antiporters, OSCAs, TPCs, ANNs, GLRs, MSLs, and MCAs were used as queries to blast against the soybean genome database using the BlastP program. The nucleotide and protein sequences were obtained and analyzed for protein domains using HMMScan (https://www.ebi.ac.uk/Tools/hmmer/search/hmmscan) [56], and InterPro database (http://www.ebi.ac.uk/interpro/) [57]. Proteins without the characteristic domains and motifs of these calcium transporter families were eliminated. The genes encoding putative Ca2+ transport proteins in each family were named according to Arabidopsis orthologues and their positions in the phylogenetic trees.

2.2. Phylogenetic Analysis and Chromosomal Mapping

Sequences of Ca2+ transport proteins of Arabidopsis, rice, and soybean were obtained from TAIR (http://www.arabidopsis.org/), RGAP (http://rice.plantbiology.msu.edu/index.shtml), and SoyBase (http://www.soybase.org/), respectively. The amino acid sequences of Ca2+ transport proteins were aligned using ClustalW, and a phylogenetic tree was constructed by the neighbor-joining method using the software MEGA6 [58]. The genes encoding putative Ca2+ transport proteins were mapped on these 20 soybean chromosomes based on their physical positions on chromosomes. If the distance between two neighboring paralogous genes were less than 100 kb and separated by five or fewer genes, they were considered to be tandemly duplicated genes [59].

2.3. Gene Duplication and Calculation of Ka/Ks Values

The duplication of putative Ca2+ transporter genes on segmentally duplicated regions was determined by searching using the plant genome duplication database [60], and according to the results of phylogenetic trees. Non-synonymous (Ka) to synonymous (Ks) substitution rates were used to estimate the selection mode for all putative gene pairs of Ca2+ transporter families in soybean. TBtools was used to calculate Ks and Ka [61]. The divergence time (T) was calculated by T = Ks/(2 × 6.1 × 10−9) × 10−6 MYA, where 6.1 × 10⁻⁹ is the divergence rate in millions of years translated from Ks value [62].

2.4. Identification of Conserved Domains and Cis-Acting Regulatory Elements

Conserved domains of Ca2+ transport proteins were predicted using HMMScan (https://www.ebi.ac.uk/Tools/hmmer/search/hmmscan) [56], and InterPro database (http://www.ebi.ac.uk/interpro/) [57]. Promoter sequences of 1.5 kb upstream to the transcription start site of the genes encoding Ca2+ transport proteins were retrieved from SoyBase (http://www.soybase.org/), and the location of cis-acting regulatory elements was analyzed using Regulatory Sequence Analysis Tools (http://rsat.eead.csic.es/plants/) [63].

2.5. RNA-Seq Datasets

Genome-wide public RNA-seq datasets (Reads/Kb/Million (RPKM) normalized data) in different tissues of soybean were retrieved from two soybean RNA-seq datasets [64,65]. High-throughput sequencing datasets for soybean in responses to salt, dehydration, flooding, drought, deficiencies of phosphorus and zinc, and inoculations of pathogenic (Fusarium oxysporum) isolate and symbiotic bacteria (Bradyrhizobium japonicum) were also retrieved from published datasets [66,67,68,69,70,71].

3. Results

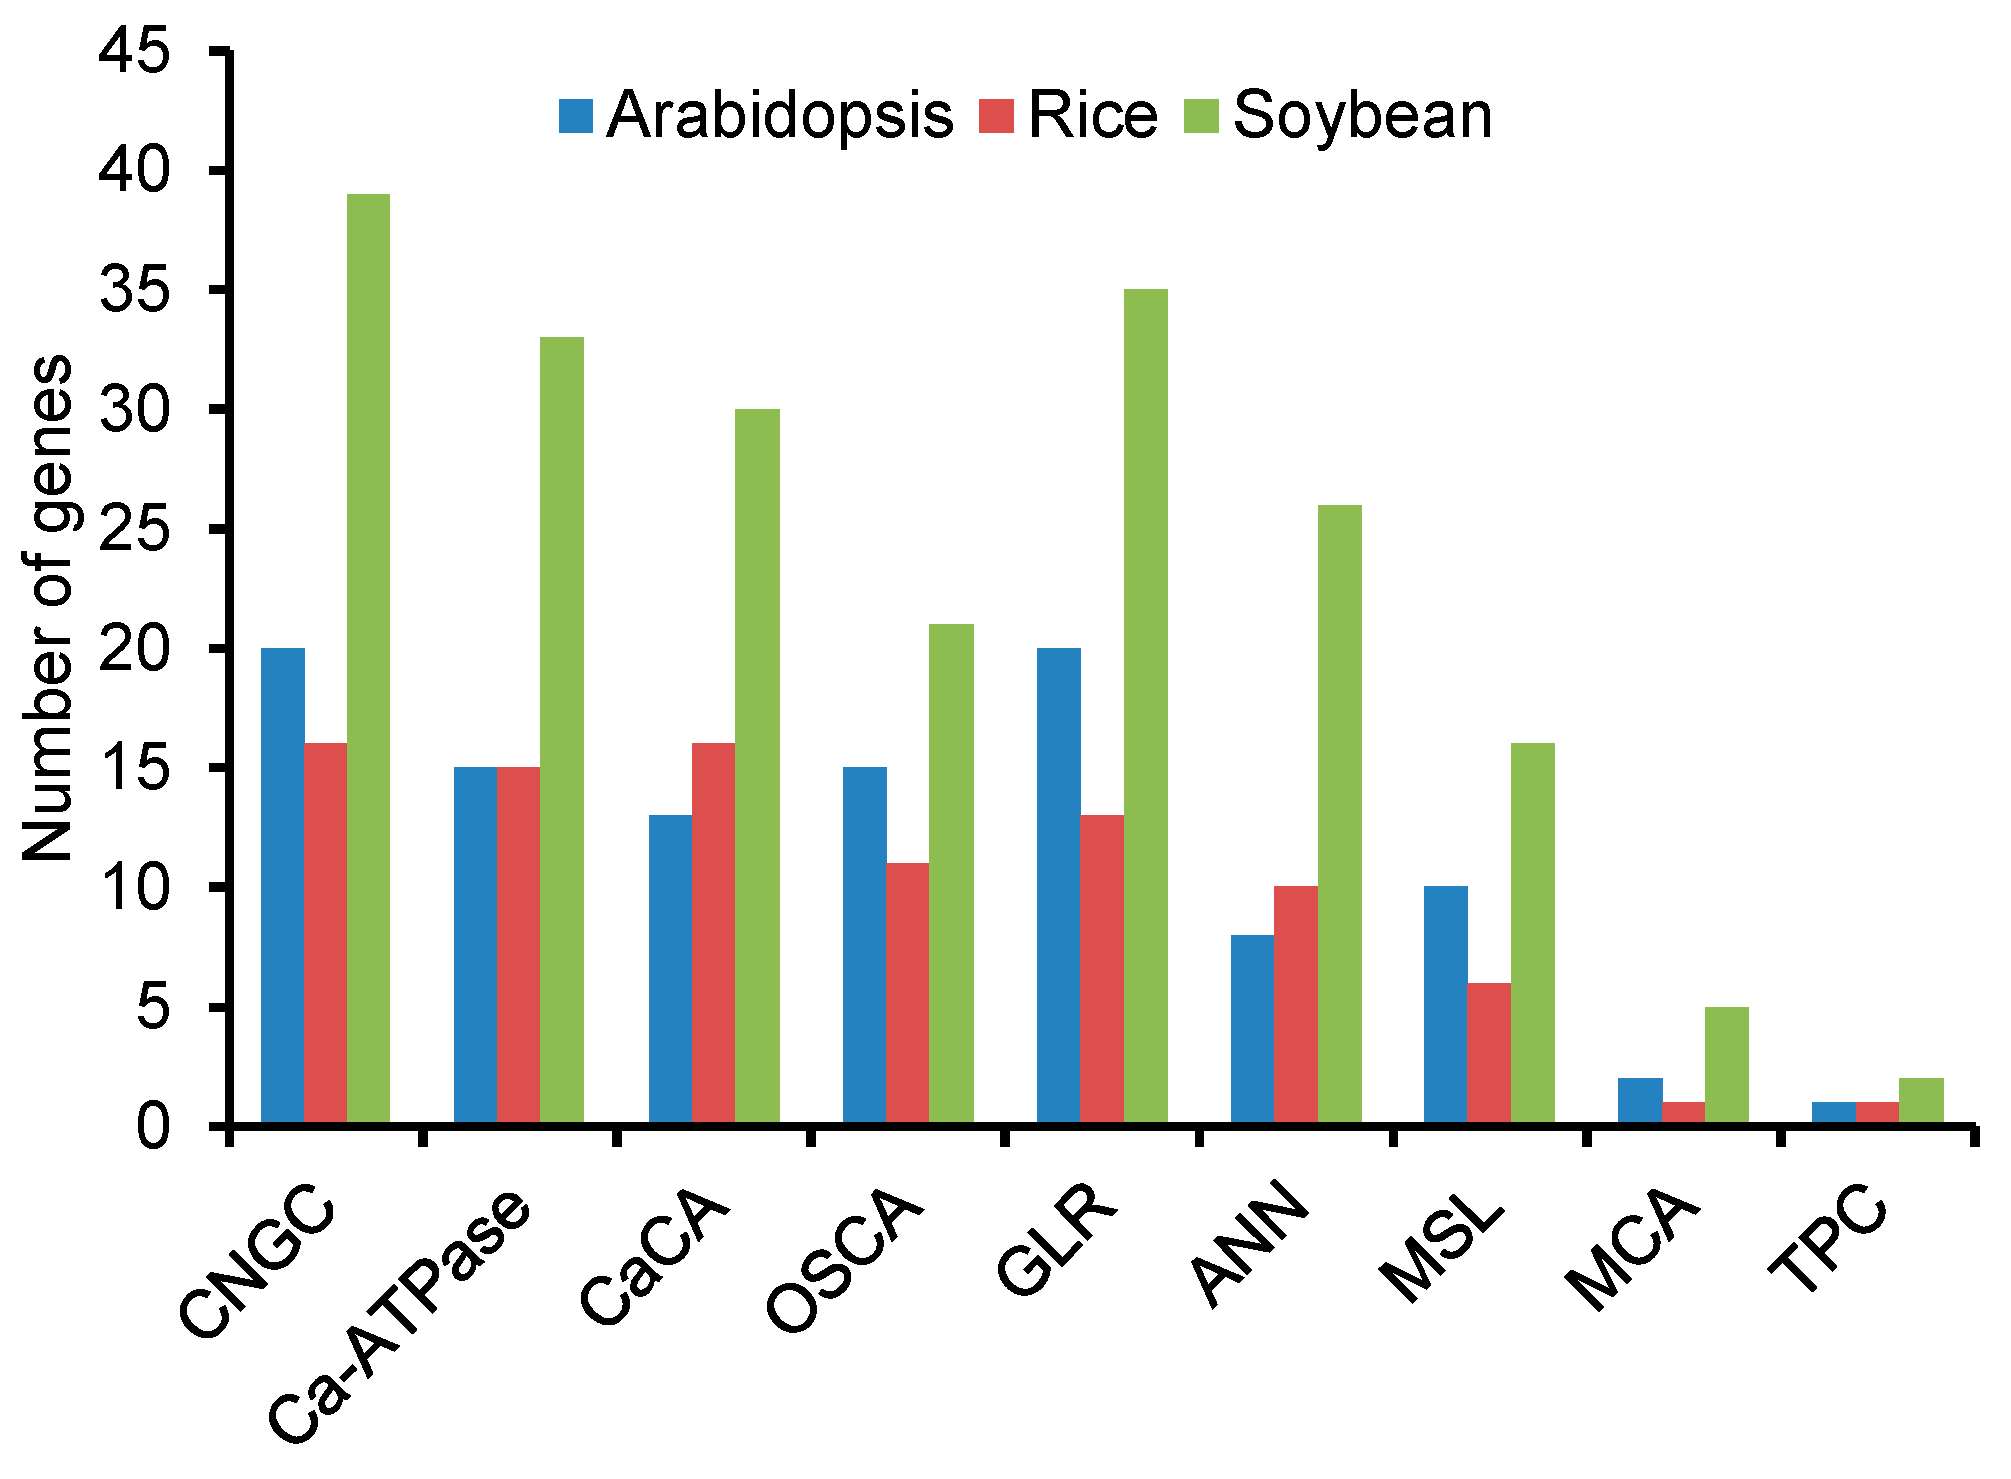
3.1. Identification of Putative Ca2+ Transport Proteins in the Soybean Genome

By keyword searching and using the blast tool as described in the “materials and method” section, a total of 207 proteins were identified to be potential Ca2+ transport proteins, including 39 CNGCs, 33 Ca2+-ATPases, 30 CaCAs, 21 OSCAs, 35 GLRs, 26 ANNs, 16 MSLs, two TPCs, and five MCAs (Tables S1–S11 (Supplementary Materials)). The total number of Ca2+ transport proteins belonging to nine different families in soybean is about 2.0 and 2.3 folds that of Arabidopsis and rice, respectively (Figure 1).

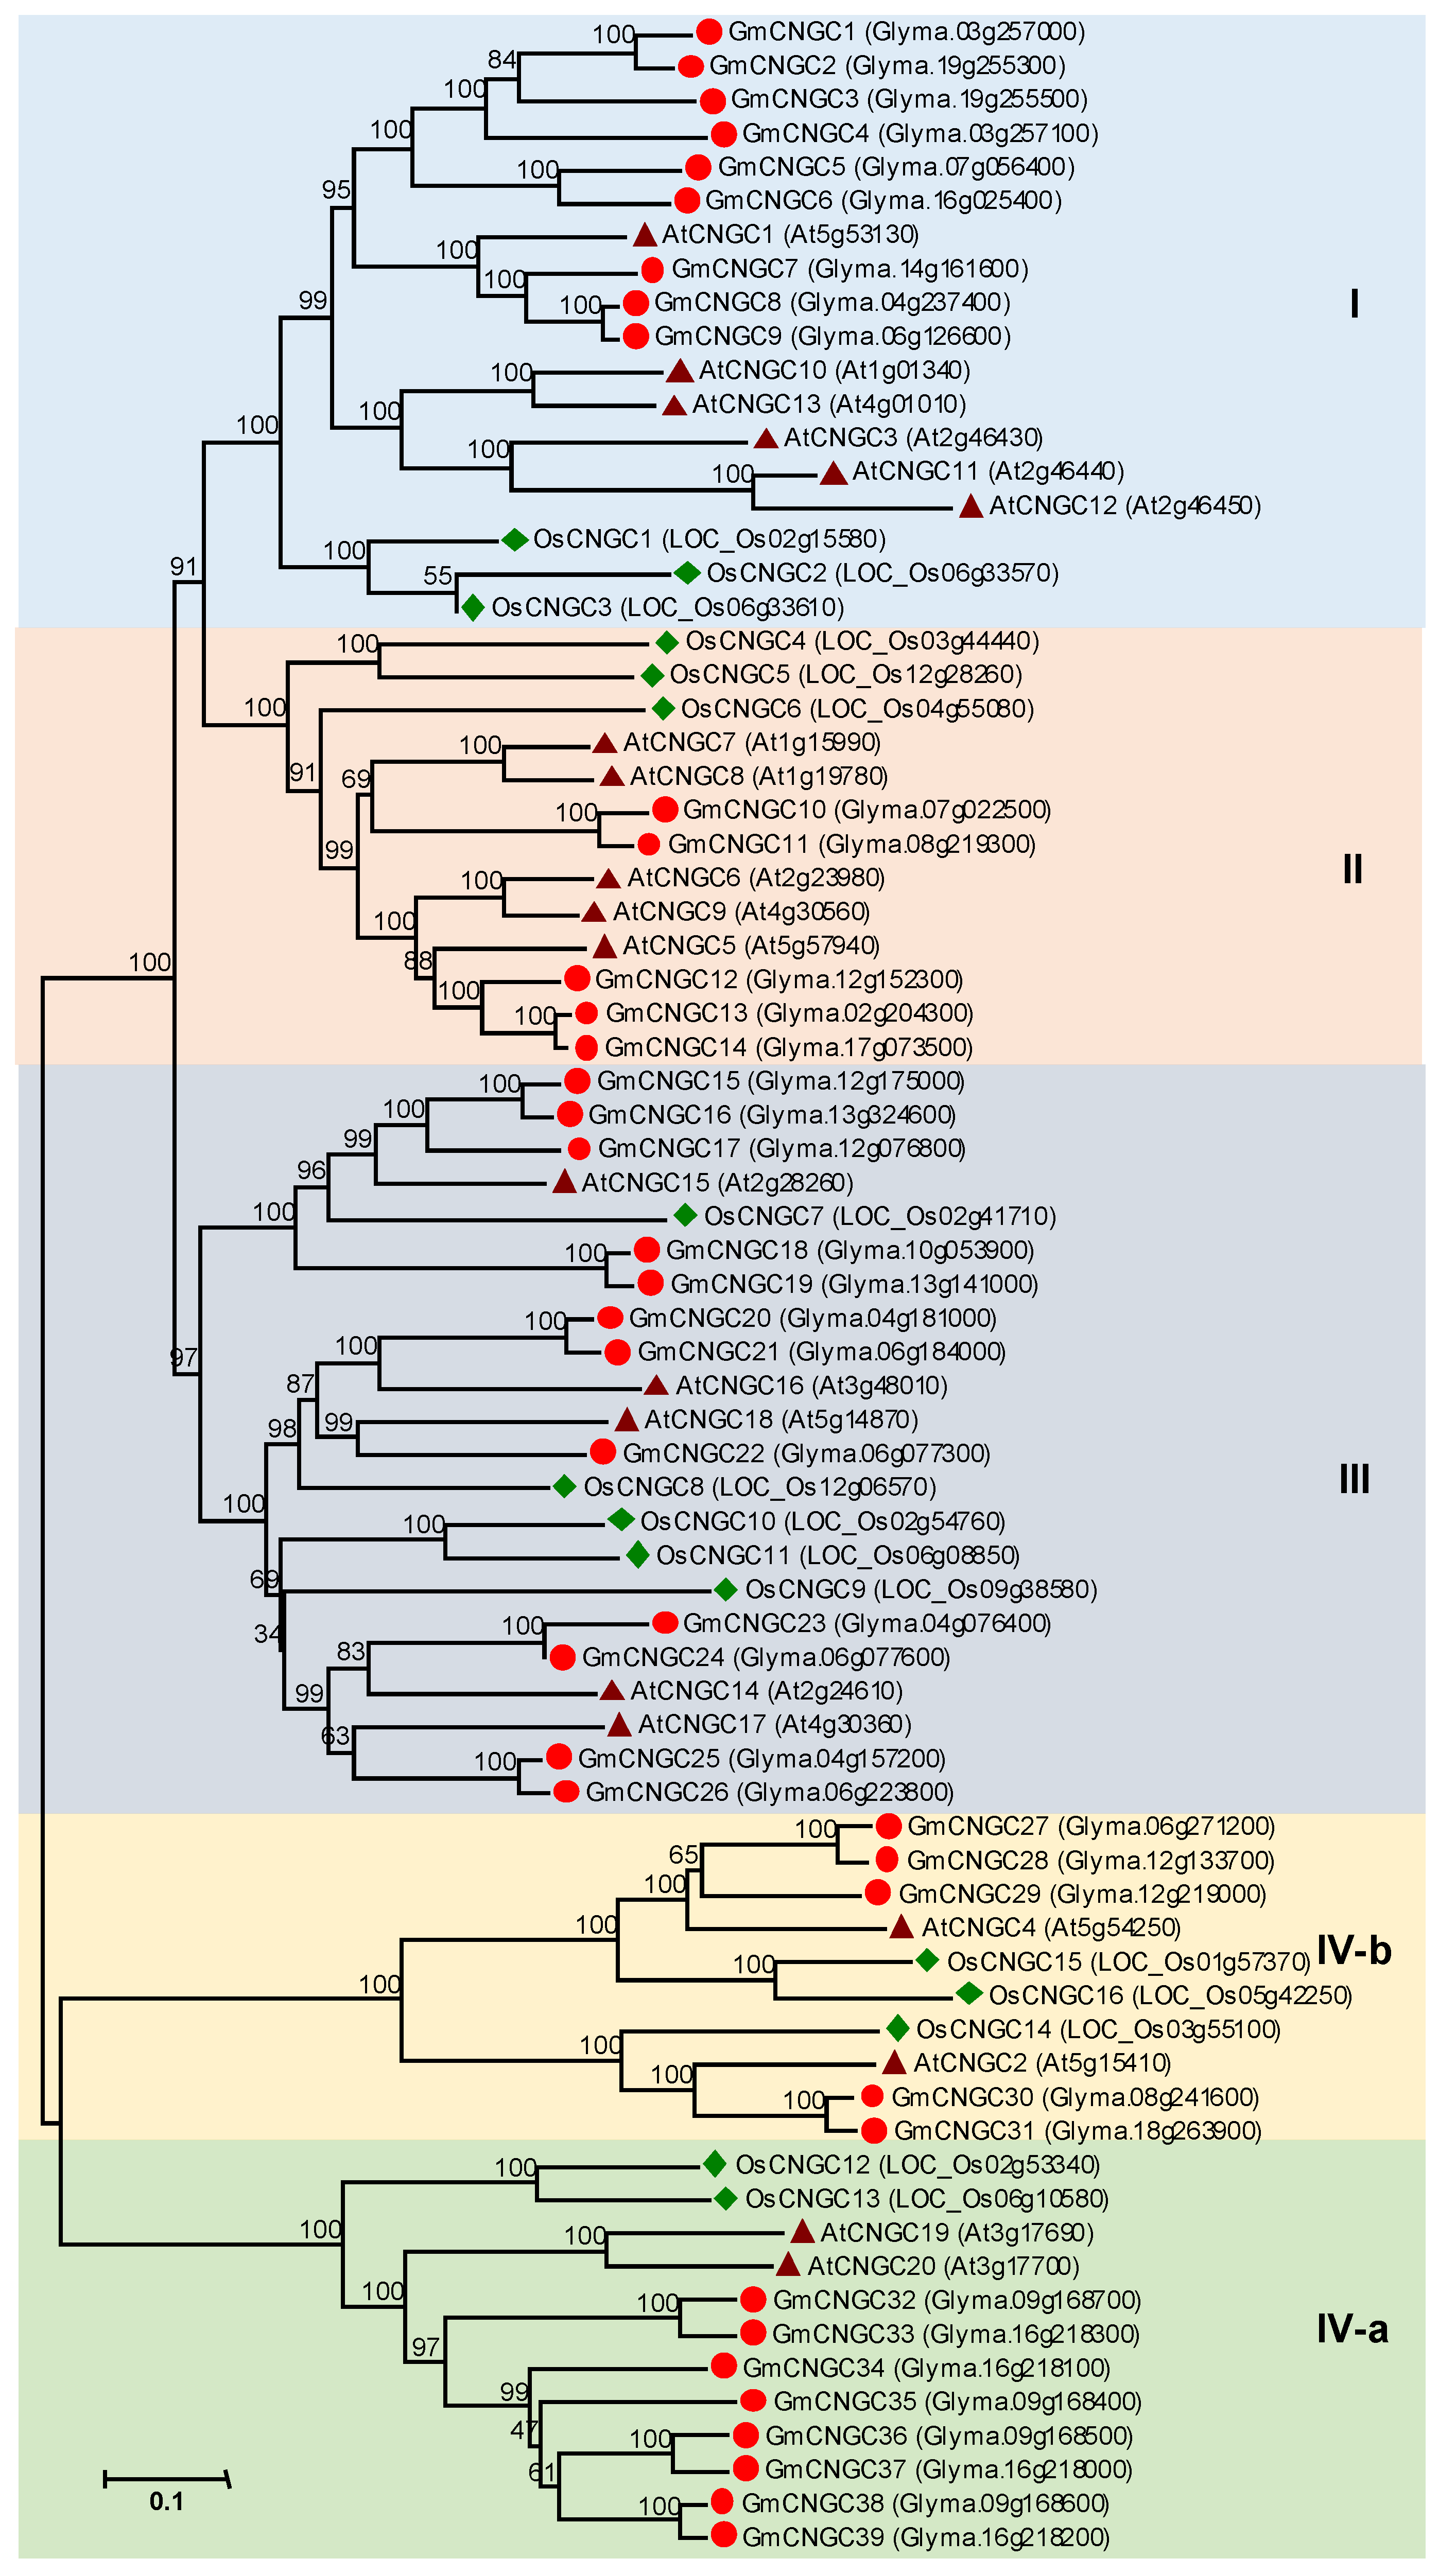
3.2. CNGC Gene Family in Soybean

In this study, 39 CNGC gene members were identified in the soybean genome (Table S2 (Supplementary Materials)). CNGC protein sequences from soybean, Arabidopsis, and rice were aligned using ClustalW, and a phylogenetic tree was constructed using the neighbor-joining method to determine the similarity and homology between the CNGC families of these plants. The topology of the phylogenetic tree revealed that the GmCNGC gene family can be divided into four major groups (Groups I-IV) (Figure 2), which is based on the Arabidopsis groups [20]. Groups I-III are monophyletic, whereas Group IV is subdivided into two distinct clades (Groups IV-a and IV-b). Group IV contains 13 GmCNGC genes, while the other groups contain five to 12 members. Most of these proteins contained a cyclic nucleotide-binding domain (CNBD) and an ion transport domain (Figure S1 (Supplementary Materials)). The sequence alignment of the 39 GmCNGC proteins indicated that the two most conserved regions within the CNBD domain are a phosphate-binding cassette (PBC), and an adjacent hinge region (Figure S2 (Supplementary Materials)), which is the characteristics of CNBD [72]. Additionally, a relatively conserved IQ motif was shown in all the 39 GmCNGC proteins.

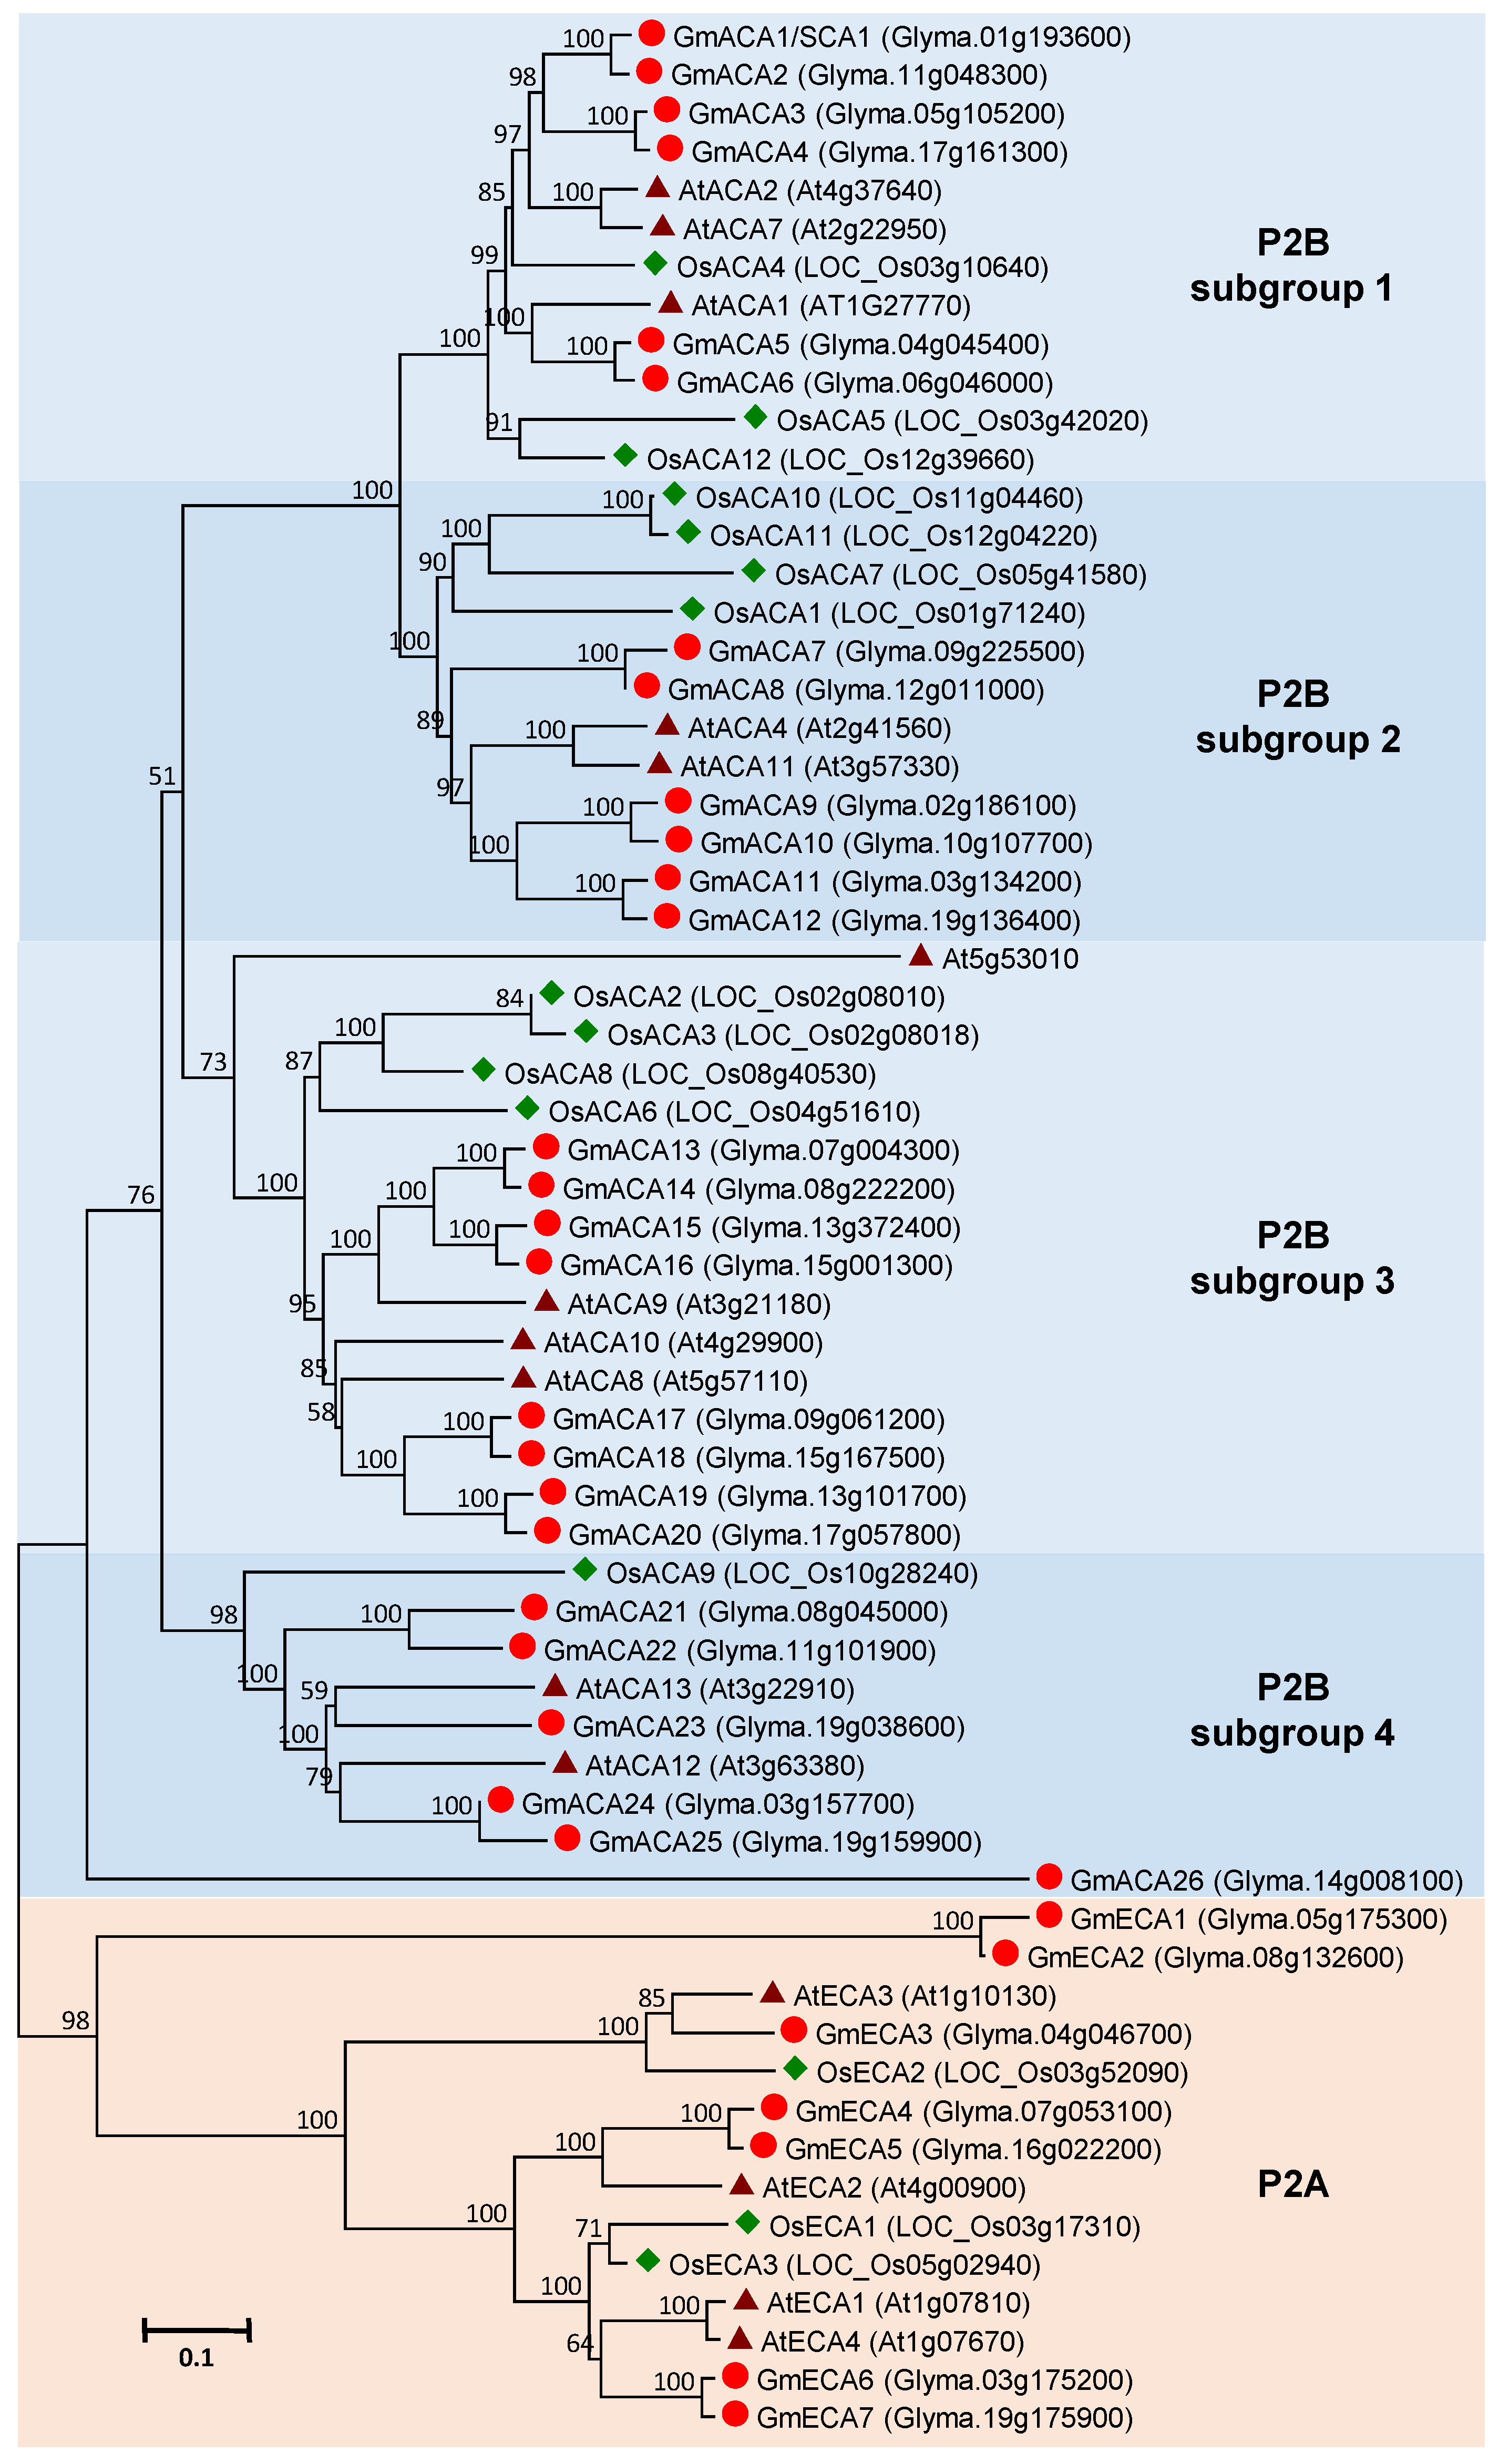
3.3. Ca2+-ATPase Gene Family in Soybean

The Ca2+-ATPases are P-type ATPases that can be classified in two distinct groups: Type IIA (ECA) and type IIB (ACA). Here, we identified eight ECA genes and 25 ACA genes in the soybean genome (Table S3 (Supplementary Materials)). The soybean Ca2+-ATPase family exhibited little sequence variation in terms of amino acid length (752 to 1103 aa), but presented high variation in terms of intron number (from 0 to 36) (Table S3 (Supplementary Materials)). All the soybean Ca2+-ATPase proteins were predicted to contain five to ten transmembrane domains (Table S3 (Supplementary Materials)). Domain analysis showed that five domains characteristic for Ca2+-ATPases were found to be conserved among most of the soybean Ca2+-ATPase proteins. These domains include the N-terminal autoinhibitory domain, N-terminus cation transporter/ATPase, E1-E2 ATPase, haloacid dehalogenase-like hydrolase, and C-terminus cation transporter/ATPase (Figure S3 (Supplementary Materials)). Most of the soybean ACAs were predicted to contain an N-terminal autoinhibitory domain, with the exception of six GmACAs (Figure S3 (Supplementary Materials)). To analyze the evolutionary relatedness among the members of Ca2+-ATPases from soybean, rice, and Arabidopsis, a phylogenetic tree was constructed using the deduced amino acid sequences. The phylogenetic analysis revealed that Ca2+-ATPases formed two distinct groups, namely, type IIA and type IIB (Figure 3). Type IIB is divided into four subgroups, based on the groups of Arabidopsis. The Ca2+-ATPases of the same group seemed to have a high degree of evolutionary relatedness. The investigation for the evolution of Ca2+-ATPases among these plant species revealed that the gene members in the same clade have a high degree of similarity (Figure 3), suggesting the common ancestry of P-type II Ca2+-ATPases in these plant species.

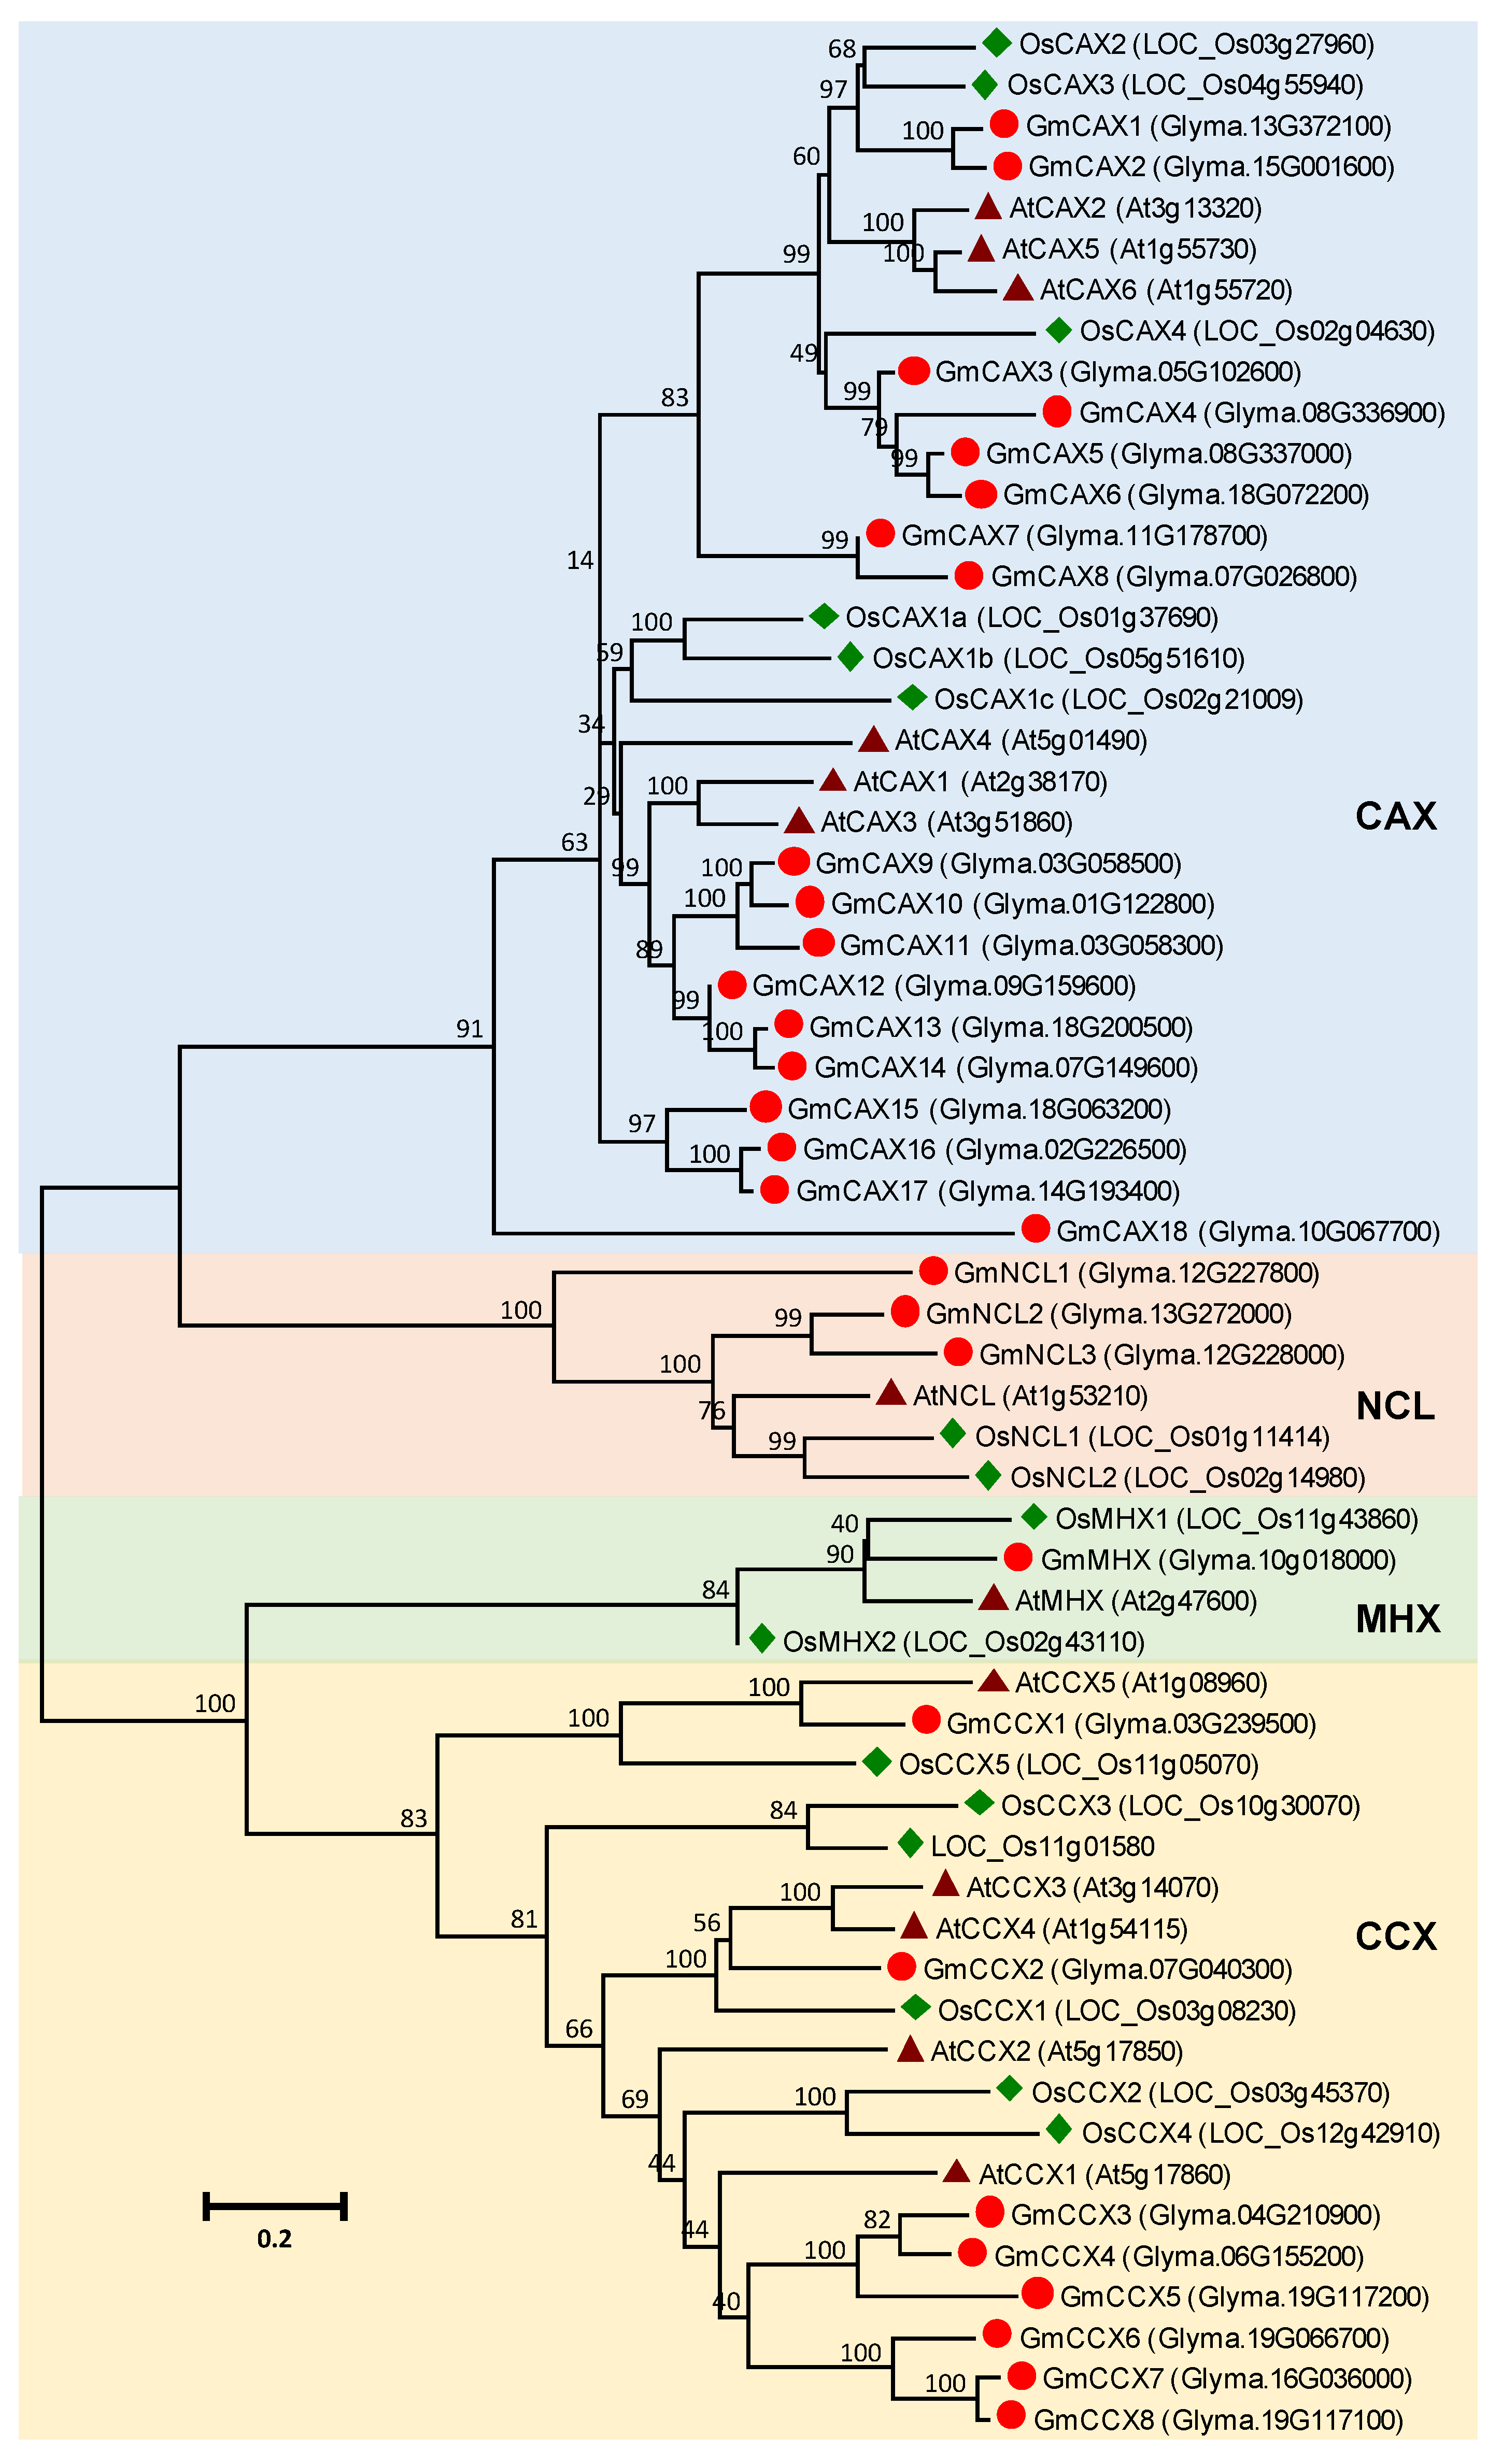
3.4. CaCA Gene Family in Soybean

Here, a total of 30 genes encoding putative CaCAs were identified in the soybean genome, including 18 CAX genes, eight CCX genes, three NCL genes, and one MHX gene (Table S4 (Supplementary Materials)). The intron number of GmCaCA family genes varied from 0 to 11. The protein length of the GmCaCA family ranged from 182 to 718 amino acids (Table S4 (Supplementary Materials)). All the GmCaCA proteins were predicted to contain three to 14 transmembrane domains (Table S4 (Supplementary Materials)). All the GmCaCA proteins contain NCX domains with the exception of GmNCL3, which has a high sequence and phylogenetic similarity to other NCL members (Figure 4, Figures S4 and S5 (Supplementary Materials)). In addition, all the GmNCLs were predicted to contain EF-hand motifs (Figure S4 (Supplementary Materials)), which is similar to the NCL proteins in Arabidopsis and rice [73]. The presence of EF-hand motifs suggests that these proteins may bind Ca2+ and regulate cellular Ca2+ homeostasis. Phylogenetic analysis indicated that GmCaCA members are closely related to the CaCA proteins in Arabidopsis and rice (Figure 4).

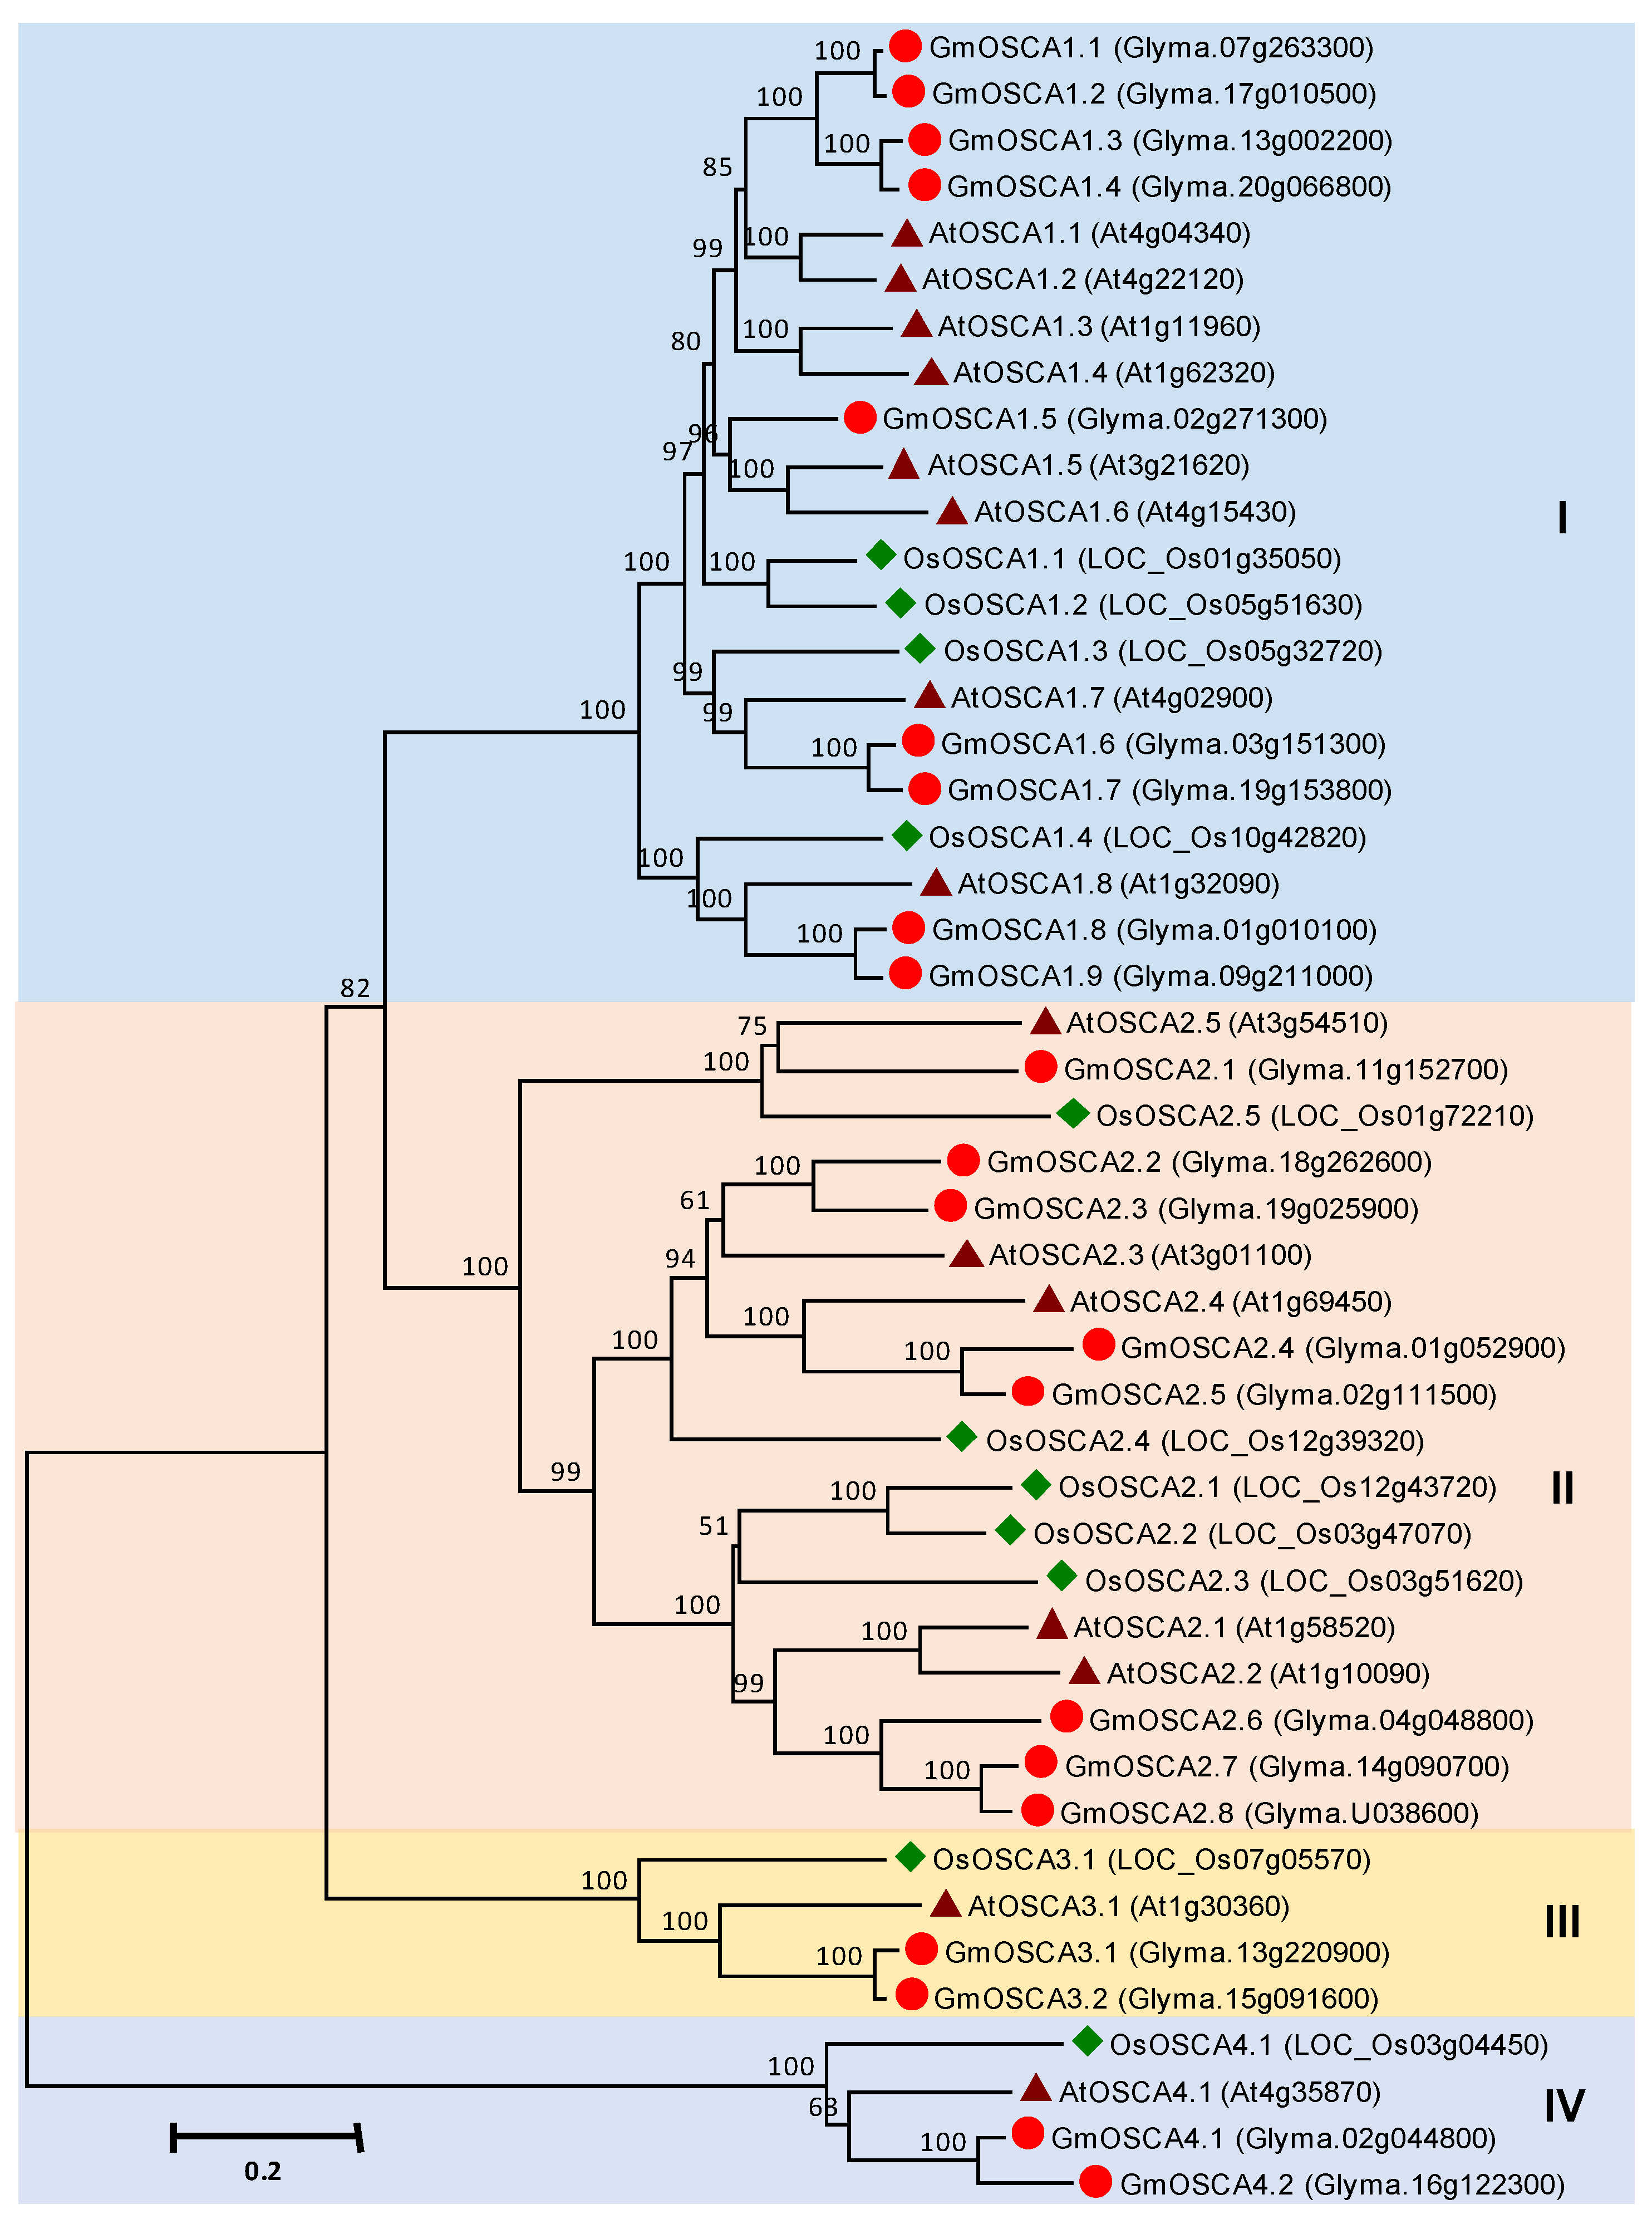
3.5. OSCA Gene Family in Soybean

A total of 21 putative OSCA genes were identified, and they were named GmOSCA1.1 to GmOSCA4.2 in accordance with Arabidopsis orthologues (Table S5 (Supplementary Materials)). A phylogenetic tree was generated to compare the evolutionary relationship of OSCA proteins among Arabidopsis, rice, and soybean. The OSCA family members were separated into four distinct clades, designated I, II, III, and IV (Figure 5). Clade I, II, III, and IV in soybean contained nine, eight, two, and two members, respectively. The amino acid number of GmOSCAs varied from 500 to 803 (Table S5 (Supplementary Materials)). Seven to 11 transmembrane domains were predicted for the different GmOSCAs (Table S5 (Supplementary Materials)). In addition, Ca2+ dependent channel domains, late exocytosis domains, and cytosolic domains were contained by most of the GmOSCAs (Figure S6 (Supplementary Materials)).

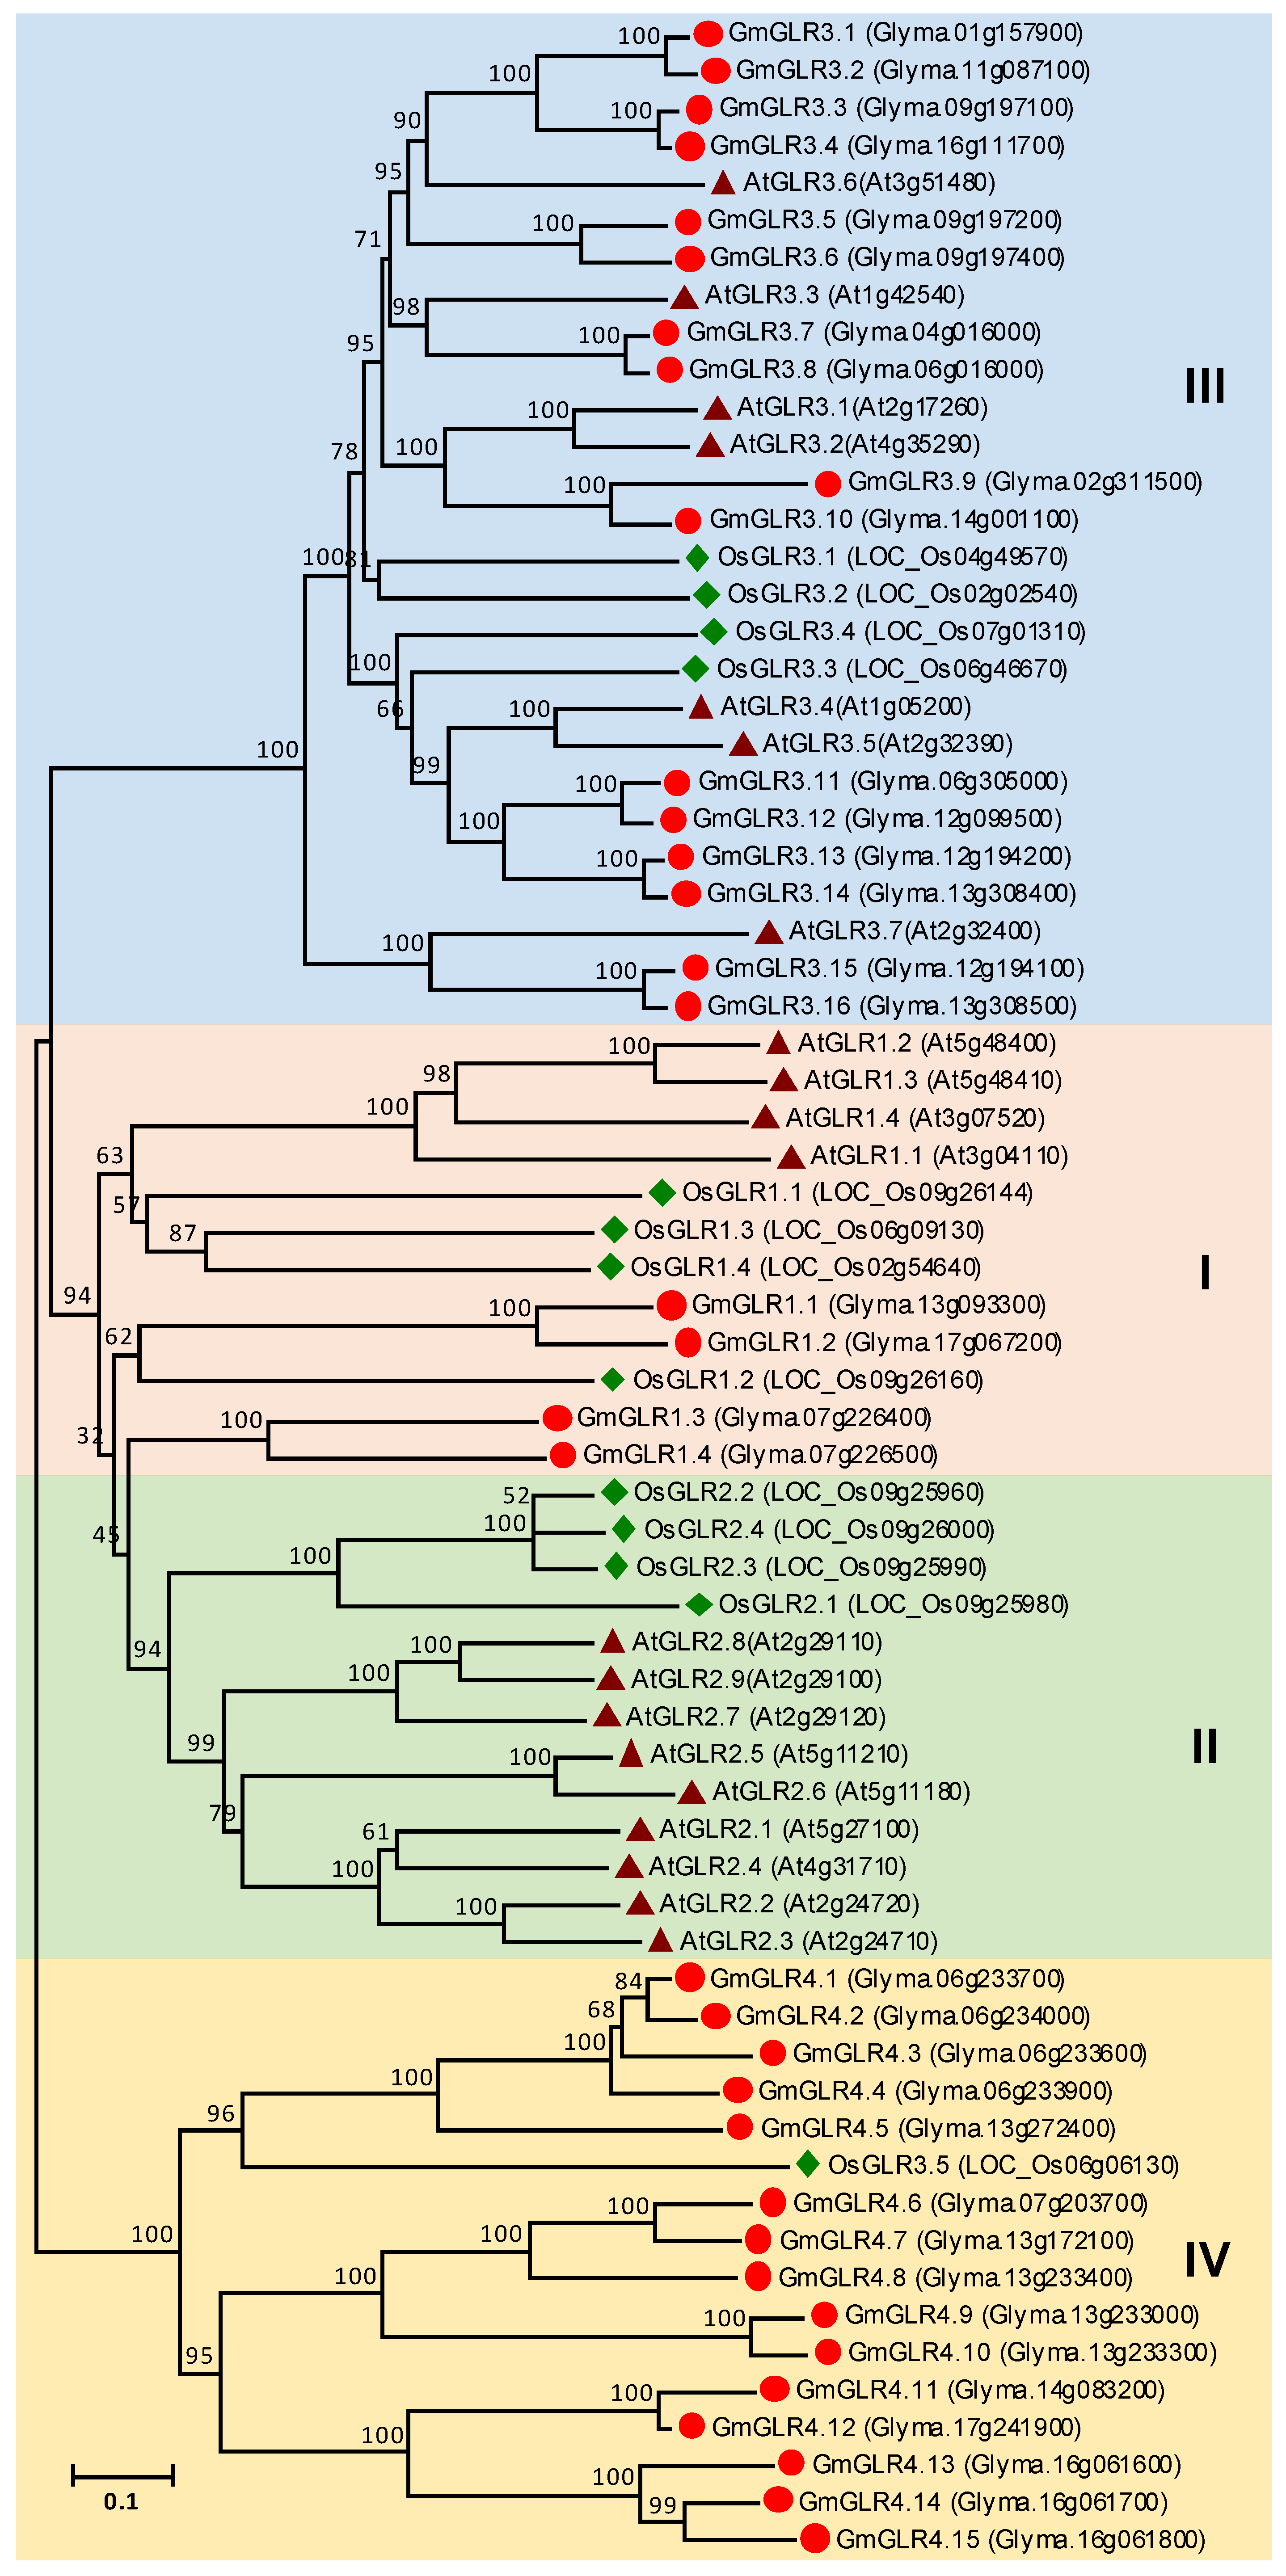
3.6. GLR Gene Family in Soybean

Thirty-five putative GLR genes were identified in the soybean genome (Table S6 (Supplementary Materials)). The encoded proteins were predicted to contain three to eight transmembrane domains (Table S6 (Supplementary Materials)). All the proteins were predicted to contain a ligand-gated ion channel, and most of them contain a receptor family ligand-binding domain (Figure S7 (Supplementary Materials)). To detect the evolutionary relationships of GmGLRs, a phylogenetic tree was generated from alignments of all the GLRs in soybean, Arabidopsis, and rice (Figure 6). These GLRs could be grouped into four clades, namely, I, II, III, and IV. There were 4, 16, and 15 GmGLR members in clade I, III, and IV. In clade II, there were nine Arabidopsis GLR members and four rice GLR members, but no soybean GLR member was found. In clade IV, only one rice GLR was shown, and no Arabidopsis GLR was found (Figure 6). Therefore, the phylogenetic relationships among these plants are different in clade II and clade IV, suggesting a diverging trend in the evolution of GLR family across different species.

3.7. ANN Gene Family in Soybean

A total of 26 ANN genes were identified in the soybean genome; they were designated as GmANN1 to GmANN26 (Table S7 (Supplementary Materials)). Three to seven introns were found in these genes, and their protein length ranged from 141 to 362 amino acids, with a typical length of 296 amino acids (Table S7 (Supplementary Materials)). All the GmANN proteins were predicted to contain annexin domains, and their sequences are highly conserved (Figures S8 and S9 (Supplementary Materials)). A phylogenetic tree was constructed using full-length amino acid sequences of all the ANNs in soybean, Arabidopsis, and rice. These ANNs could be grouped into six clades (Figure 7). Clade I contains 11 GmANN members, clade V contains five GmANN members, while other clades contain one to four members. In each clade, proteins from soybean, Arabidopsis, and rice are included, with the exception that there is no Arabidopsis ANN in clade VI (Figure 7). These results suggest the similar clustering of ANN proteins in these three plants.

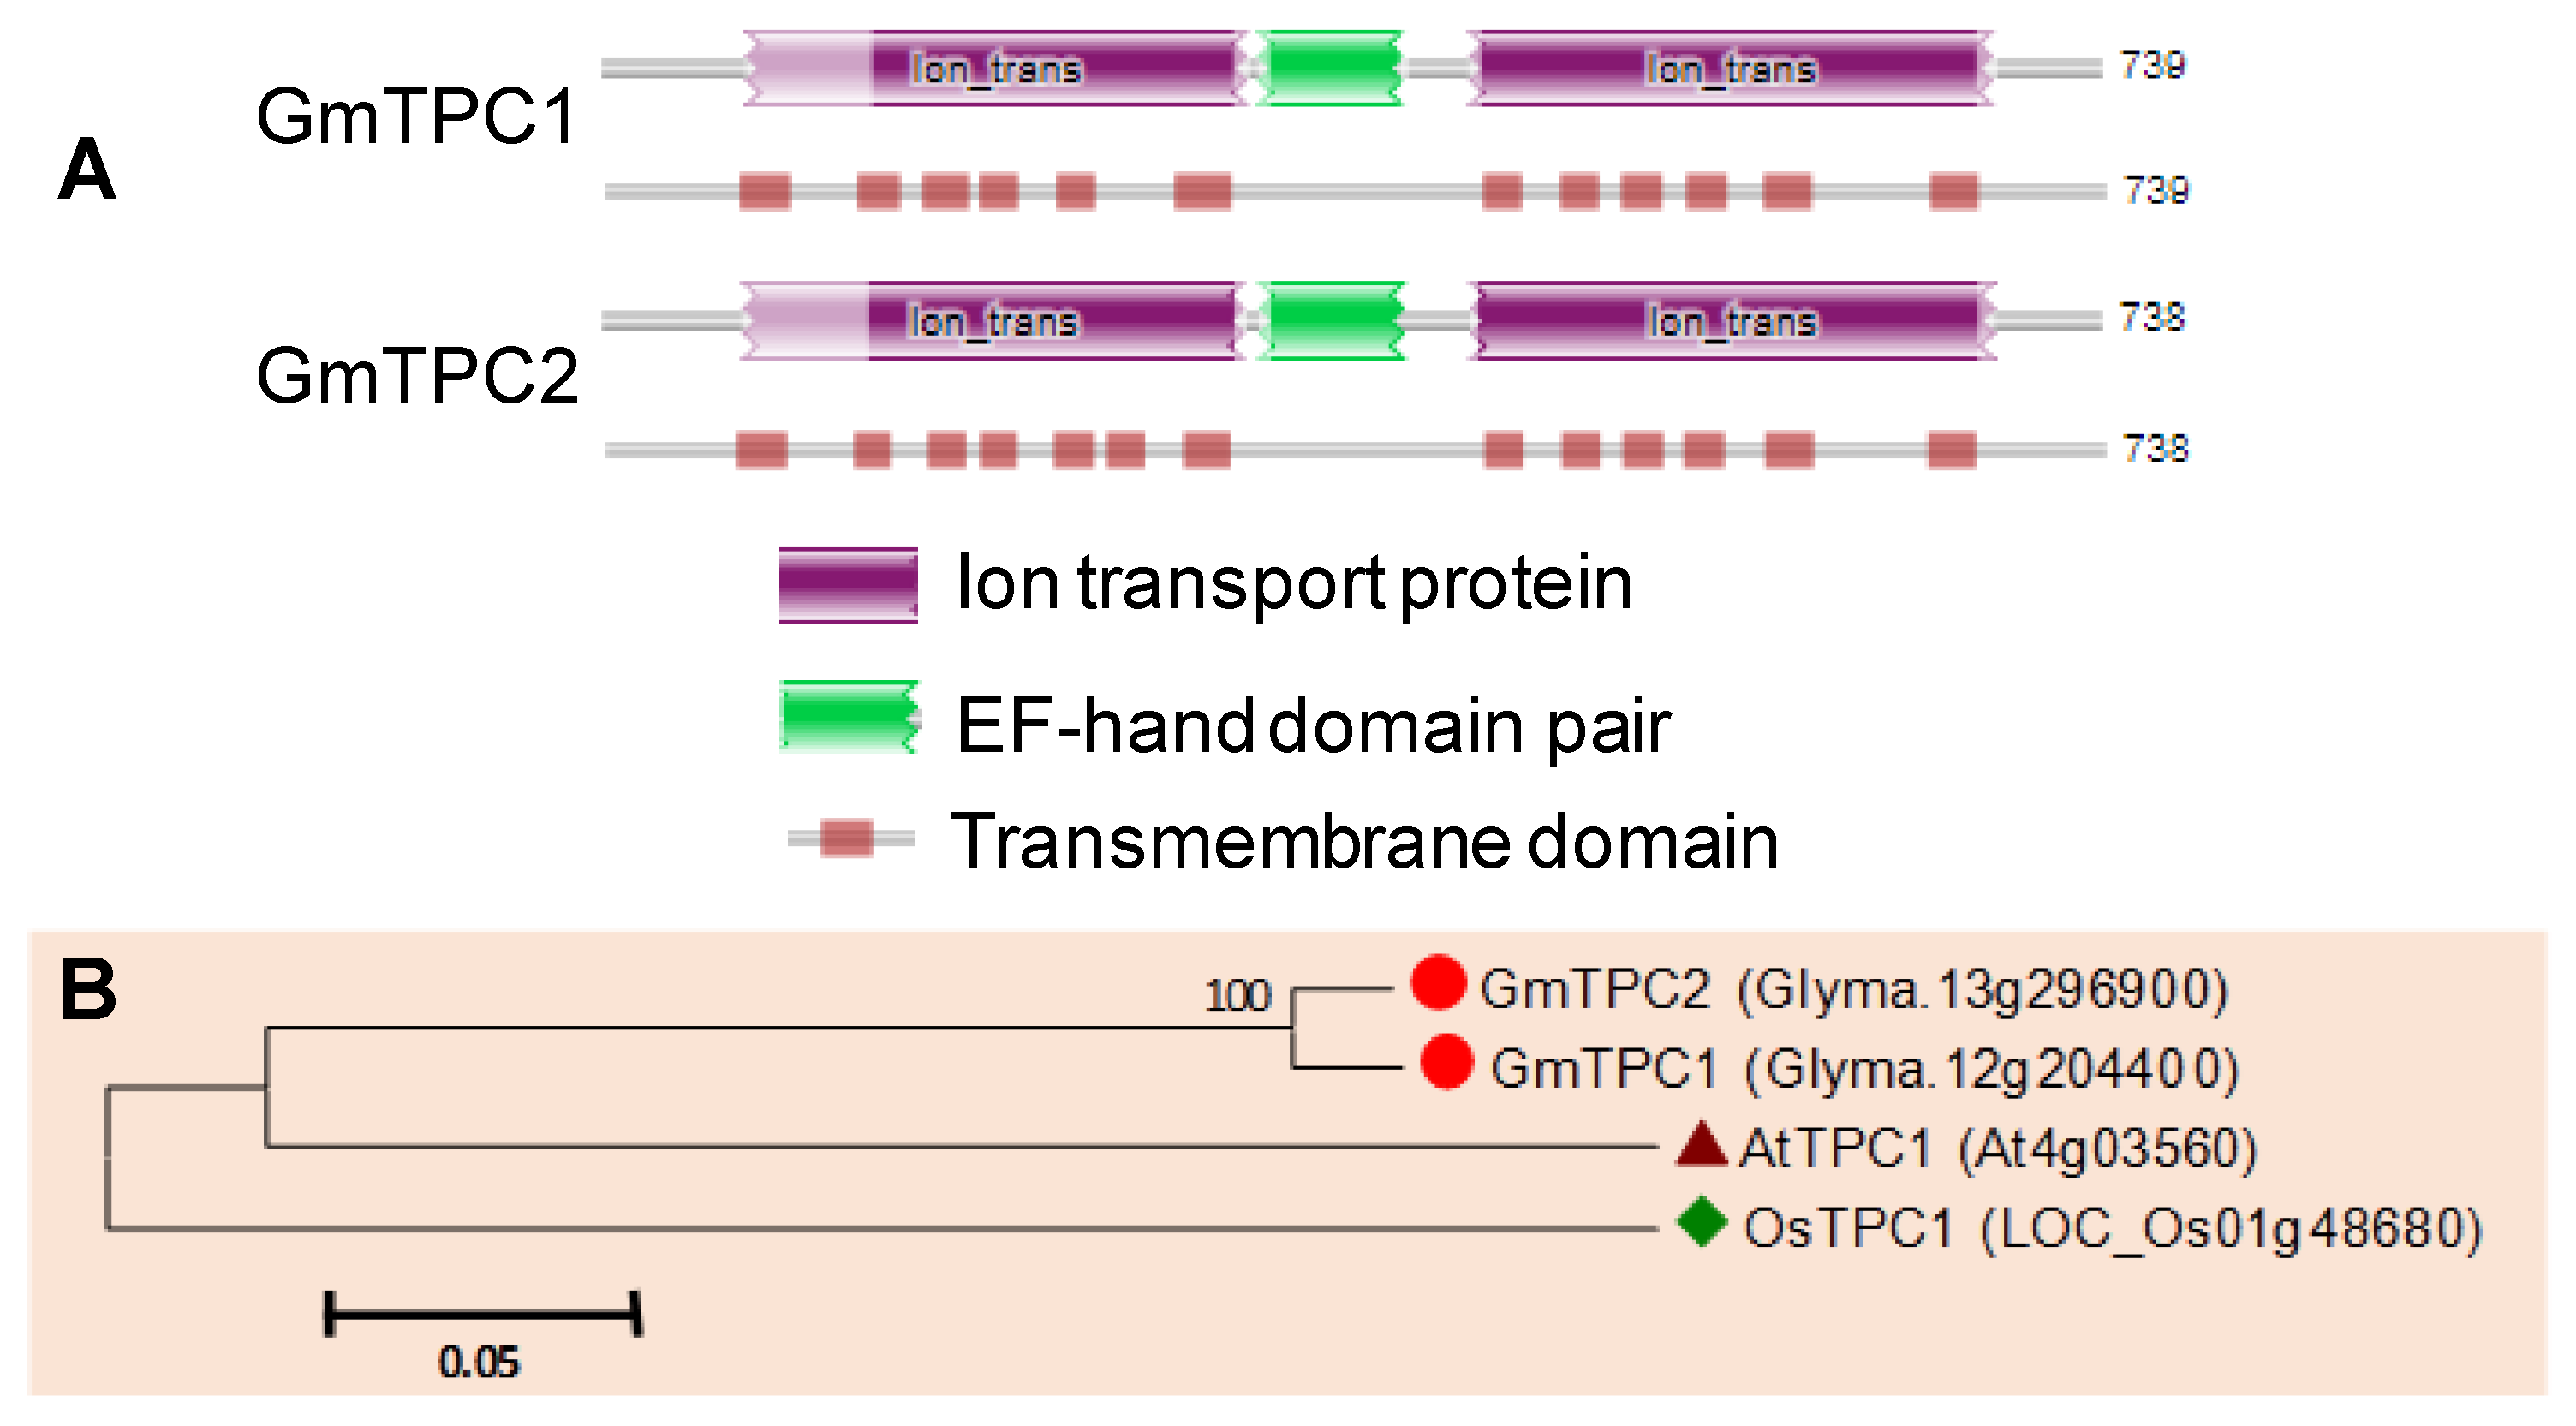
3.8. TPC Proteins in Soybean

Although there is only one TPC member in Arabidopsis and rice, two orthologues were identified in the soybean genome, and designated as GmTPC1 and GmTPC2 (Table S8 (Supplementary Materials)). These two genes both contain 23 introns and encode proteins with an amino acid length of 738–739. Twelve to thirteen transmembrane domains were predicted for these two proteins (Figure 8A). Similar to AtTPC1 and OsTPC1, ion transport protein domain and EF-hand pair were found in GmTPC1 and GmTPC2 (Figure 8A). Phylogenetic analysis indicated that GmTPC1 and GmTPC2 are closely related to the AtTPC1 and OsTPC1 (Figure 8B).

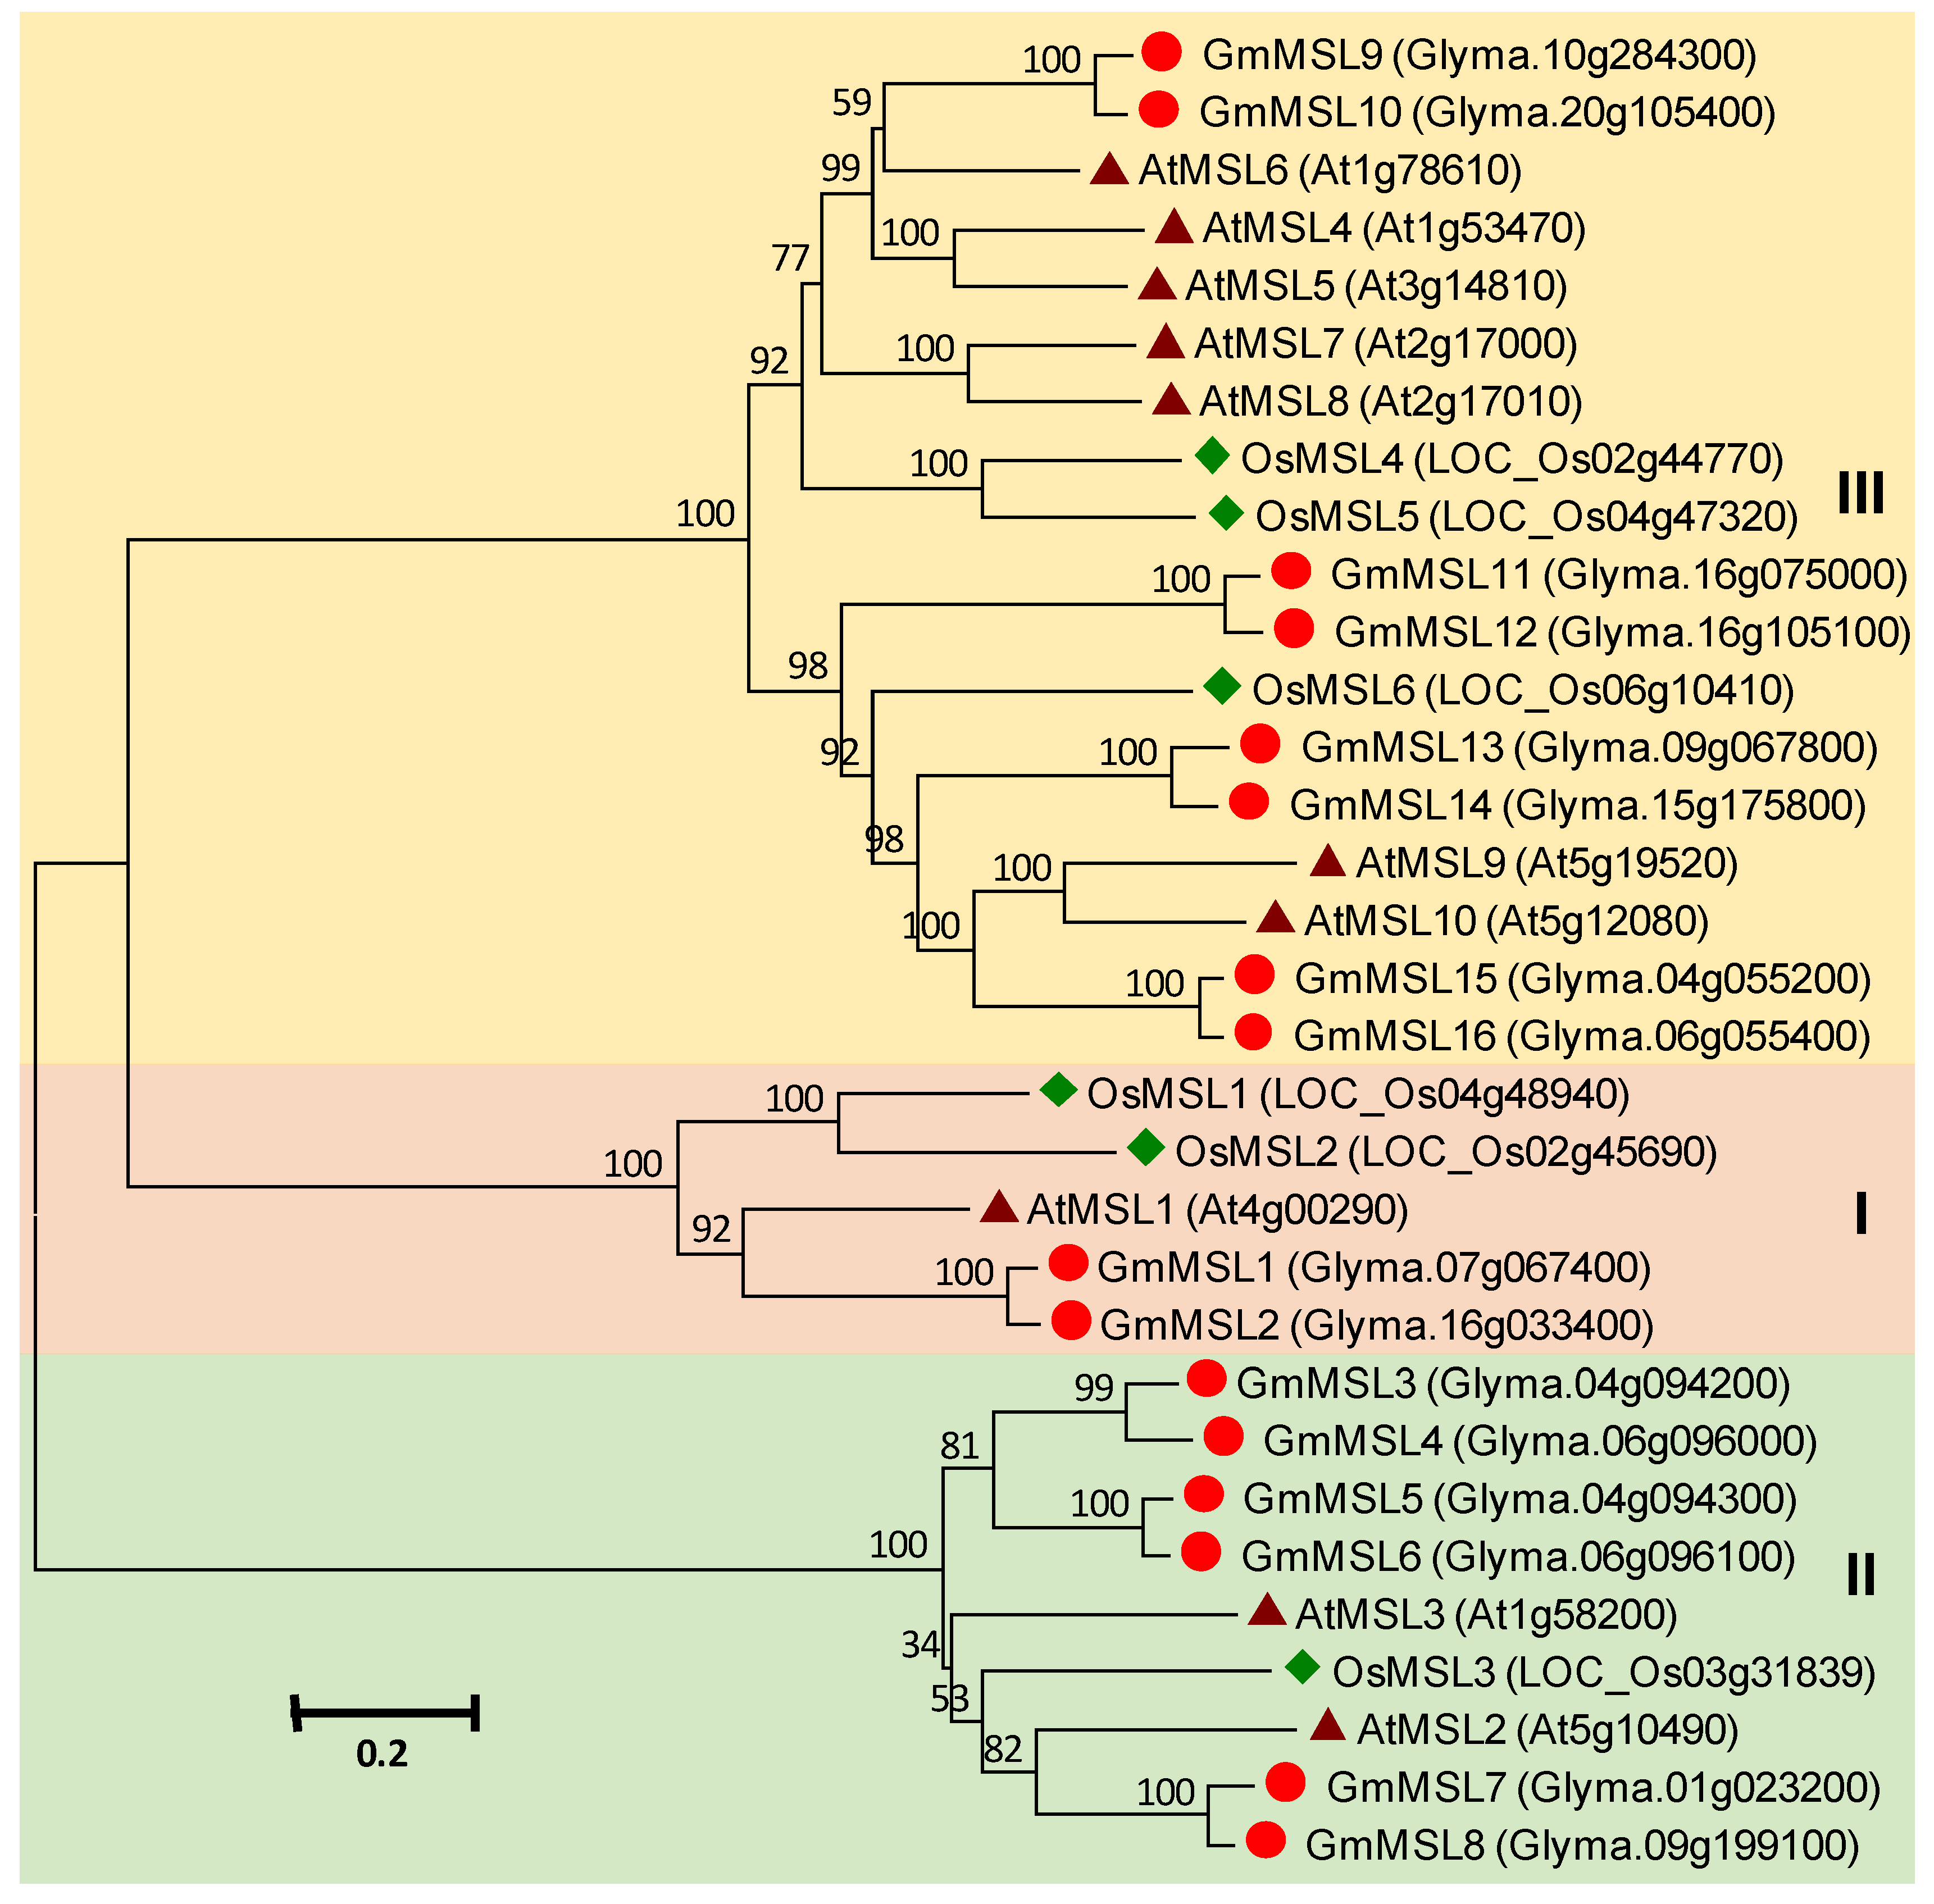
3.9. MSL Gene Family in Soybean

A total of 16 genes were identified to be putative MSL proteins in the soybean genome (Table S9 (Supplementary Materials)). These proteins have a length from 387 to 947 were predicted to contain three to seven transmembrane domains (Table S9 (Supplementary Materials)). All the soybean MSL proteins were predicted to contain a mechanosensitive ion channel domain (Figure S10 (Supplementary Materials)). A phylogenetic tree constructed to analyze the evolutionary relationships among MSL proteins in soybean, Arabidopsis, and rice, showed that the MSLs could be classified into three clades. There were two, six, and eight GmMSL members in clade I, II, and III, respectively (Figure 9).

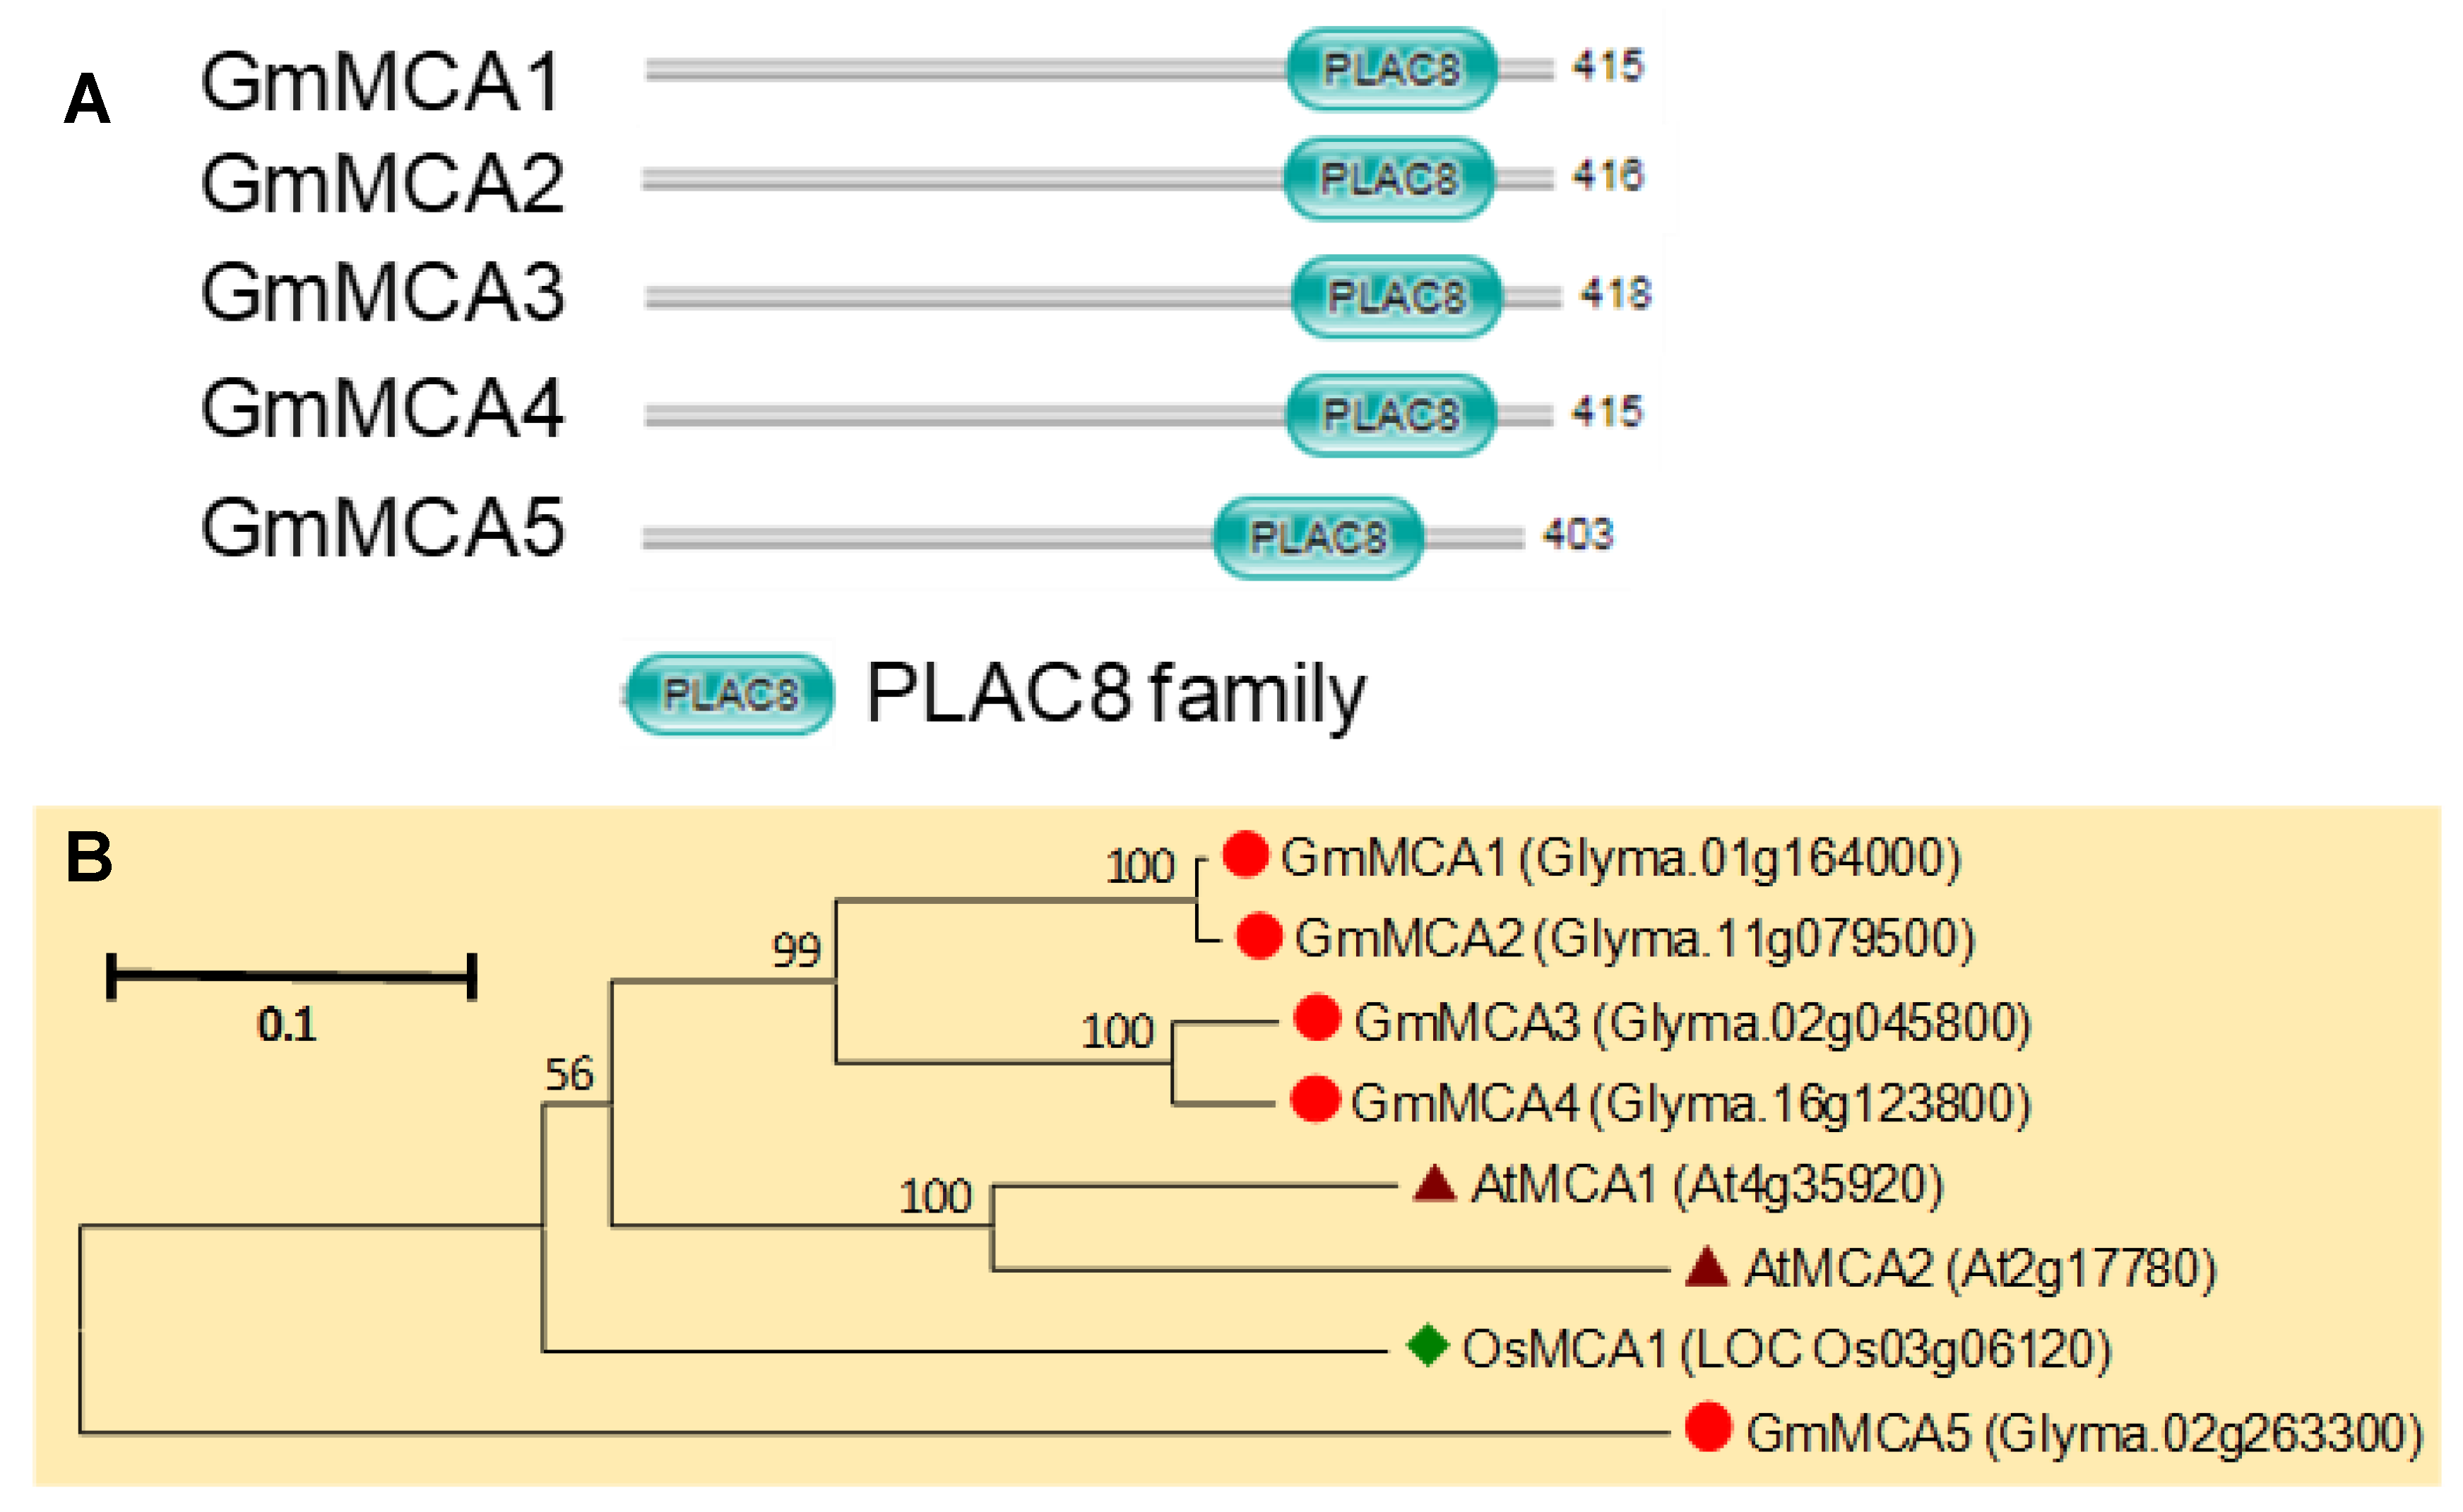
3.10. MCA Gene Family in Soybean

Five loci were found to be potential MCA genes; these genes designated as GmMCA1 to GmMCA5 contain five to eight introns and encode proteins with a length of 403 to 418 amino acids (Table S10 (Supplementary Materials)). The protein sequences of MCAs are very conserved (Figure S11 (Supplementary Materials)). All the GmMCAs contain a putative transmembrane domain and a Cys-rich domain of the unknown function, called the PLAC8 motif (Figure 10A). A phylogenetic tree indicated that GmMCAs are closely related to the three proteins in Arabidopsis and rice (AtMCA1, AtMCA2, and OsMCA1) (Figure 10B).

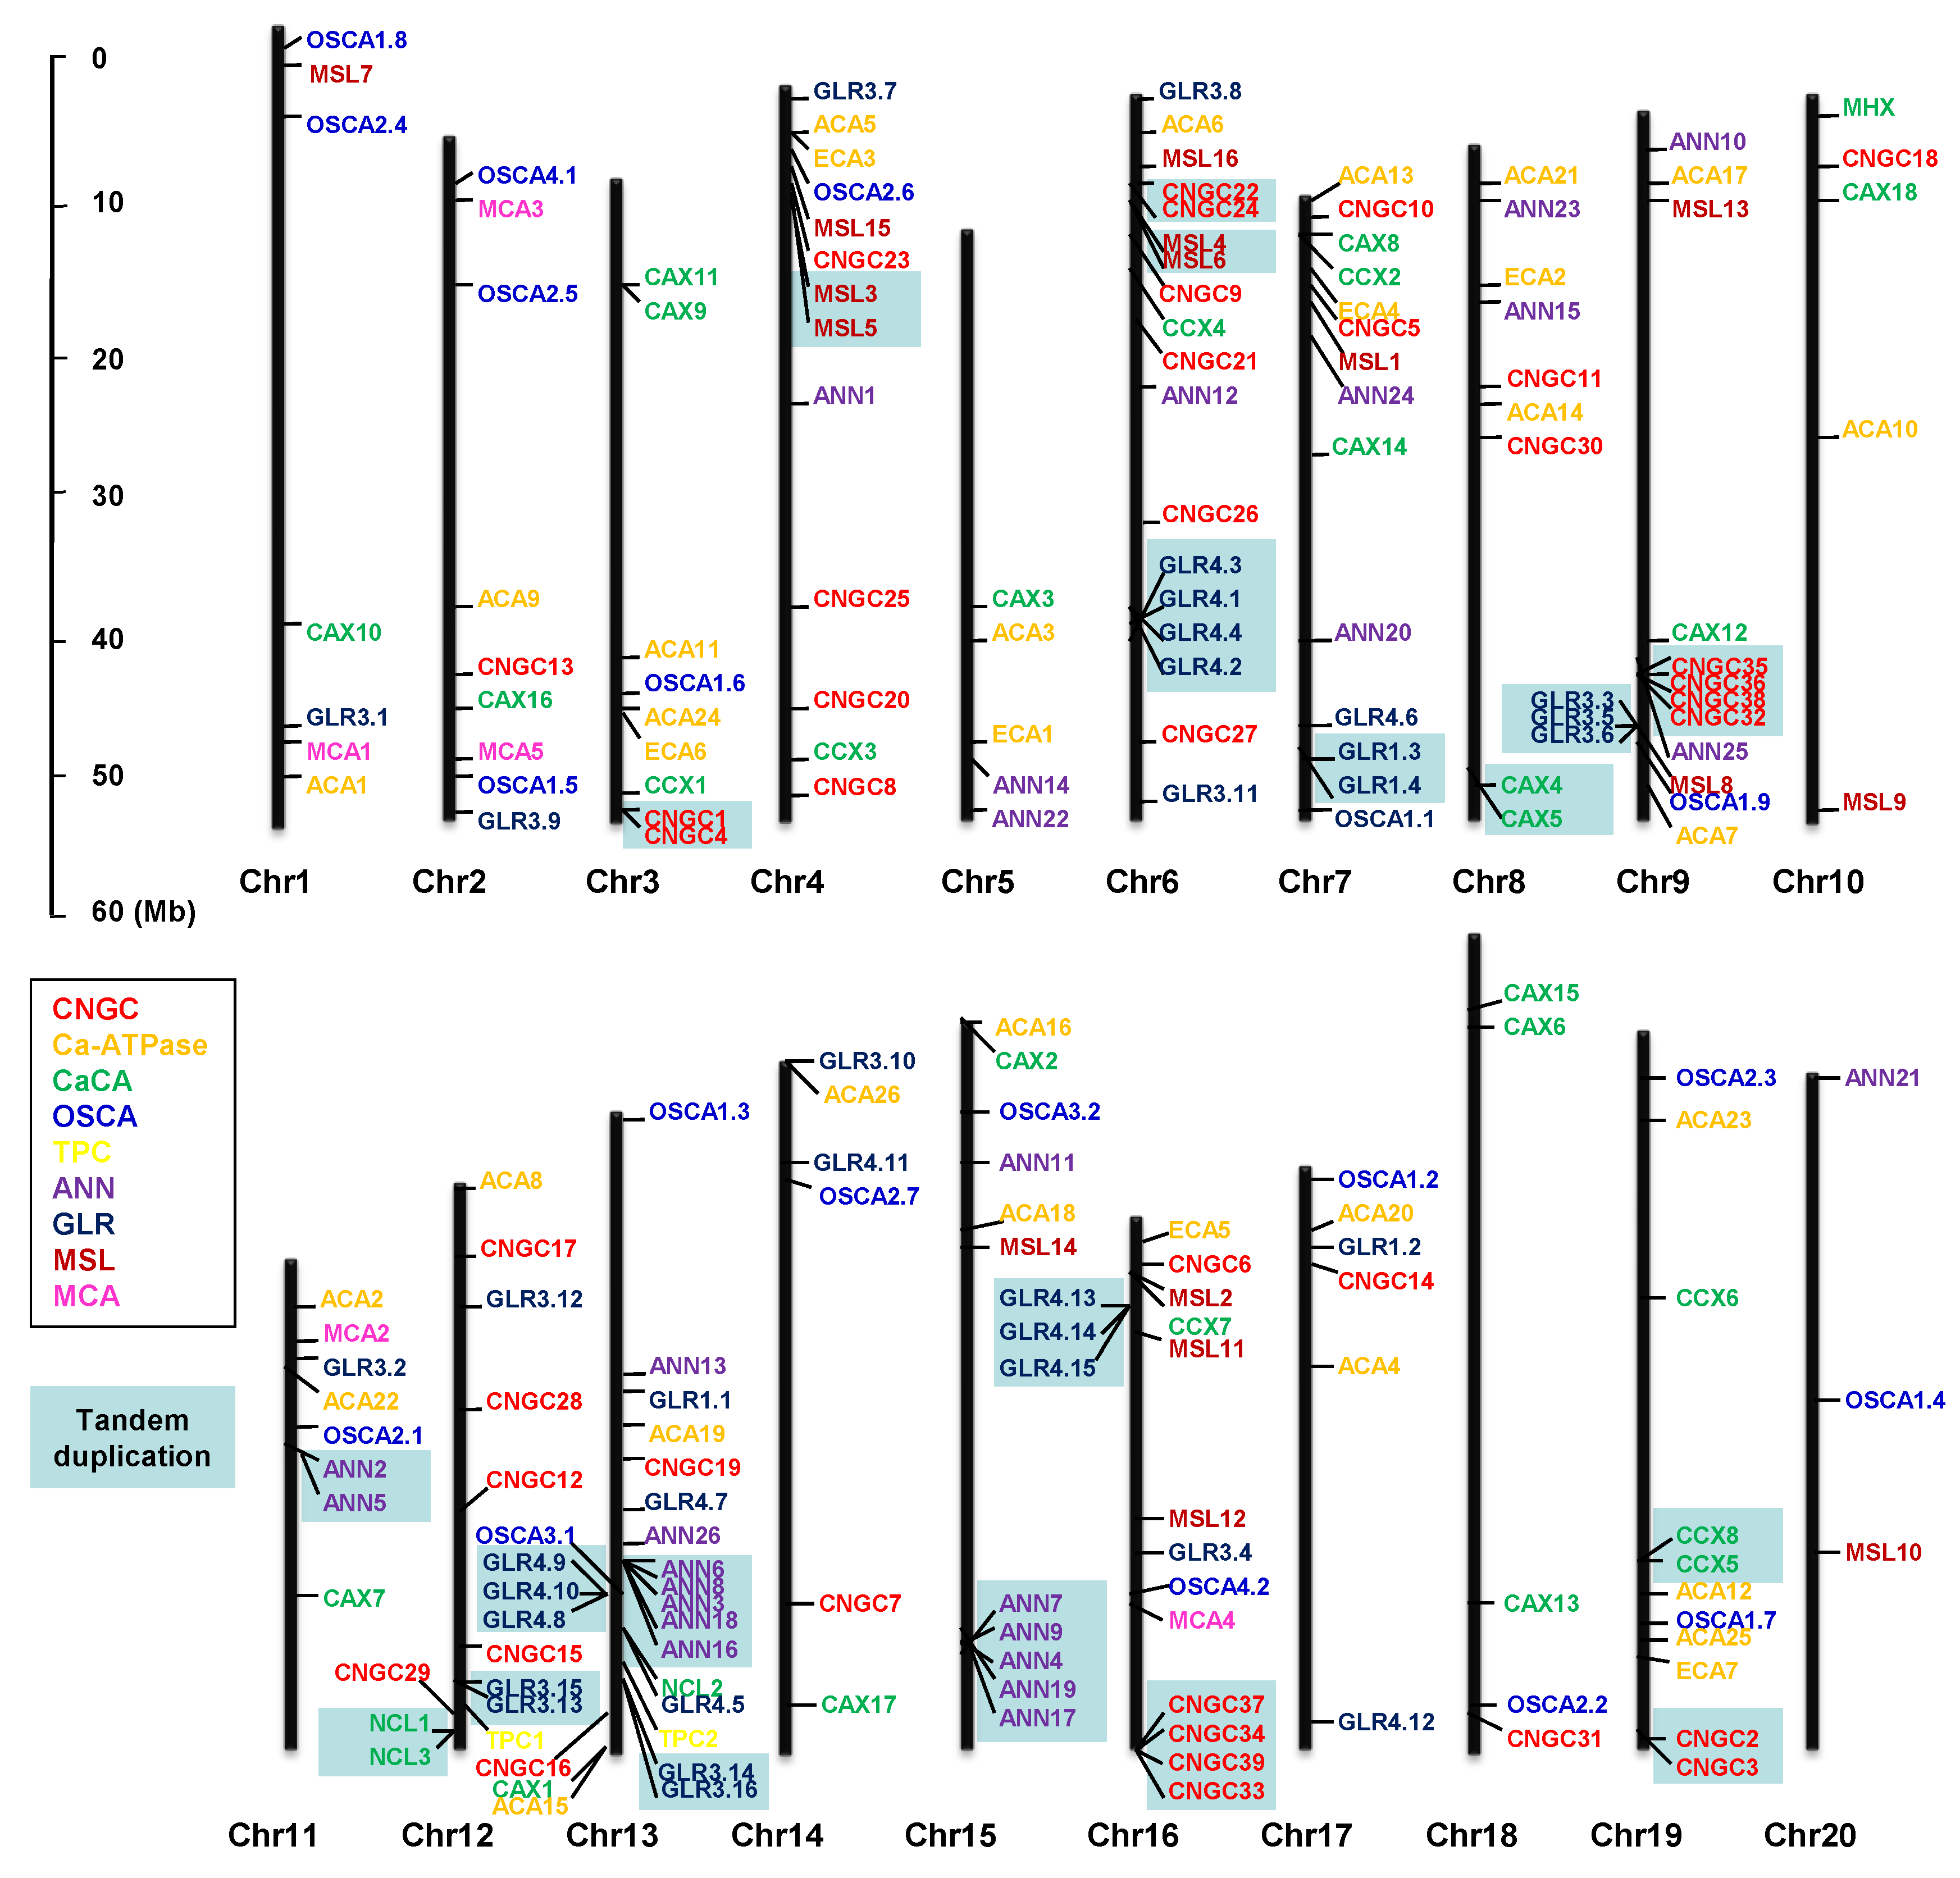
3.11. Chromosomal Distribution and Gene Duplication

The identified 207 genes encoding putative Ca2+ transport proteins were variously distributed on all the 20 chromosomes of soybean (Figure 11). The number of genes on each chromosome ranged from 3 to 24. A maximum of 24 genes was found on chromosome 13, while only three genes were found on chromosome 20. Meeting the criteria of distance less than 100 kb and separation less than five intervening genes, 20 groups of genes exhibited tandem duplication (Figure 11). Out of the 20 groups, six groups had two genes, each duplicated; the remaining groups had three to five genes duplicated, thus forming clusters on the chromosomes. The GLR, CNGC, and ANN gene family members formed four, two, and two clusters, respectively.
In this study, 79 duplicated gene pairs of putative Ca2+ transporters were identified with higher bootstrap values (<90%) (Table S11 (Supplementary Materials)). The duplication of genes resulted in gene family expansion. The synonymous substitution rates (Ks), the non-synonymous substitution rates (Ka), and the Ka/Ks ratio for the 79 duplicated gene pairs revealed high similarities in their coding sequence alignments. The Ks values of these 79 genes ranged from 0.05 for gene pair GmCNGC13/GmCNGC14 to 0.48 for gene pair GmANN3/GmANN4 with an average Ks of 0.139 (Table S11 (Supplementary Materials)). According to the Ka/Ks ratio, the evolutionary history of selection acting on different genes could be measured [74]. The direction and magnitude of natural selection enforcing on the different protein-coding genes could be interpreted by the Ka/Ks ratio. A pair of sequences having Ka/Ks < 1 indicates purifying selection; Ka/Ks = 1 implies both sequences are drifting neutrally; and Ka/Ks > 1 indicates positive or Darwinian selection [62]. The Ka/Ks of 79 duplicated gene pairs was found to be less than 0.64 (Table S11 (Supplementary Materials))—which indicates the influence of purifying selection on the evolution of these gene pairs. Based on the divergence rate of λ = 6.1 × 10⁻⁹ proposed for soybean [62], the duplication time for each gene pairs was calculated. It is observed that all the segmental duplicated pairs showed a time frame between 4.49 and 39.39 Mya, with an average of 11.38 Mya (Table S11 (Supplementary Materials)).

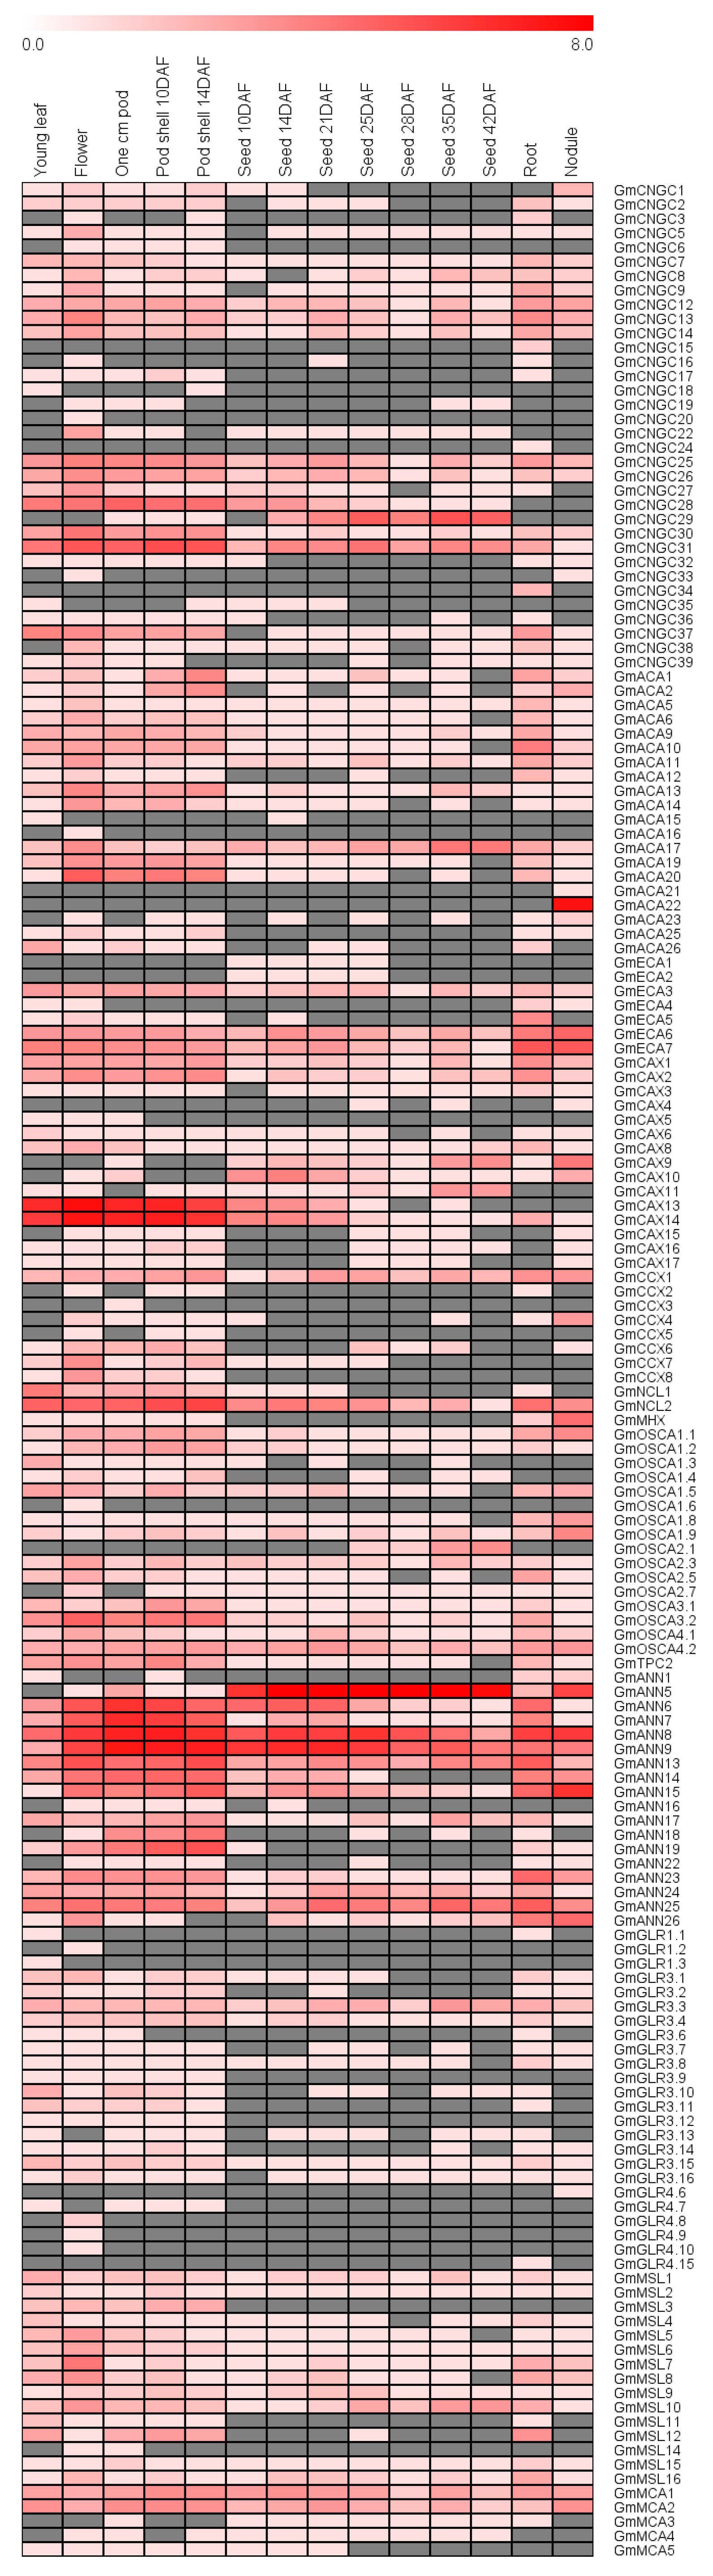
3.12. Expression Profile of Genes Encoding Putative Ca2+ Transport Proteins during Development

The expression profiles of genes encoding putative Ca2+ transport proteins in different developmental stages of soybean were analyzed by using two publicly available RNA-seq datasets. The first dataset contains 14 tissues, including three vegetative tissues (leaves, root, and nodules) and whole seed at 11 stages of reproductive tissue development (flower, pod, and seeds) [64]. The second dataset contains nine tissues (root hair cells isolated 84 and 120 h after sowing (HAS), root tip, root, mature nodules, leaves, shoot apical meristem (SAM), flower and green pods) [65]. A total of 166 and 194 genes had detectable expression in at least one tissue in the first and second datasets, respectively (Figure 12 and Figure S12 (Supplementary Materials)). There is no corresponding locus name of version 1.0 (Wm82.a1.v1 used by the RNA-seq data) for 13 genes (GmCNGC23, GmACA18, GmACA24, GmCAX7, GmCAX12, GmOSCA2.4, GmOSCA2.8, GmTPC1, GmANN2, GmANN12, GmANN20, GmGLR4.1, GmGLR4.2). In addition, the expression of 28 genes could not be found in the first dataset (Figure 12). These genes could be expressed exclusively under specific developmental stages or environmental conditions. Consistently, these genes showed very low expression levels in tissues of soybean in the second dataset, such as GmCNGC4/10/11/21, GmACA3/4/7/8, and GmOSCA1.7/2.2/2.6 (Figure S12 (Supplementary Materials)). As shown in both datasets, some genes were expressed ubiquitously in diverse tissues, whereas some genes are tissue-specific. For example, GmCNGC12/13/14/25/26, GmACA5/9/11/13/17, GmCAX1/2/8, and GmOSCA3.1/3.2/4.1/4.2 were ubiquitously expressed in various tissues, GmCNGC33, GmACA21/22, GmCAX4, GmCCX4, and GmGLR4.6 were predominantly expressed in root nodule; GmCNGC20, GmACA16, GmOSCA1.6, and GmGLR1.2/4.8/4.9/4.10 were expressed exclusively in the flowers; GmCNGC29 and GmANN5 had strong expression during seed development (Figure 12 and Figure S12 (Supplementary Materials)).

3.13. Responses of Genes Encoding Putative Ca2+ Transport Proteins to Stresses and Rhizobia Infection

To investigate the transcriptional responses of putative Ca2+ transport genes to abiotic and biotic stresses, we retrieved the published transcriptome data reflecting soybean responses to various stresses, like dehydration, salt, drought, flooding, phosphate deficiency, zinc deficiency, and inoculations of pathogenic isolates of Fusarium oxysporum [66,67,68,69,70]. Among the Ca2+ transport genes, 74 of them (35.7%) were found to be differentially expressed under one or multiple stresses (Figure 13). For example, GmOSCA1.1/1.2/2.5/2.7/3.1/3.2, GmCNGC17, and GmNCL2, GmMHX were induced by drought stress; GmCNGC2/3/32/33/36, GmGLR1.1/3.11/4.3/4.5/4.9/4.10/4.15, and GmACA12/13/22/26 were induced by short-term salt stress; GmACA1/2/25 and GmOSCA1.5 were induced by both dehydration and salt stresses; GmCNGC30 and GmANN10 were repressed by both dehydration and salt stresses. In addition, six genes were found to be responsive to rhizobia (Bradyrhizobium japonicum) infection (12–48 h after inoculation, HAI) [71] (Figure 13). GmCNGC15, GmCNGC34, and GmANN24 were induced, whereas GmGLR3.13 and GmACA19 were repressed by rhizobia infection. GmCNGC27 was induced at 12 HAI, but repressed at 24 HAI, suggesting its dynamic response to rhizobia infection.

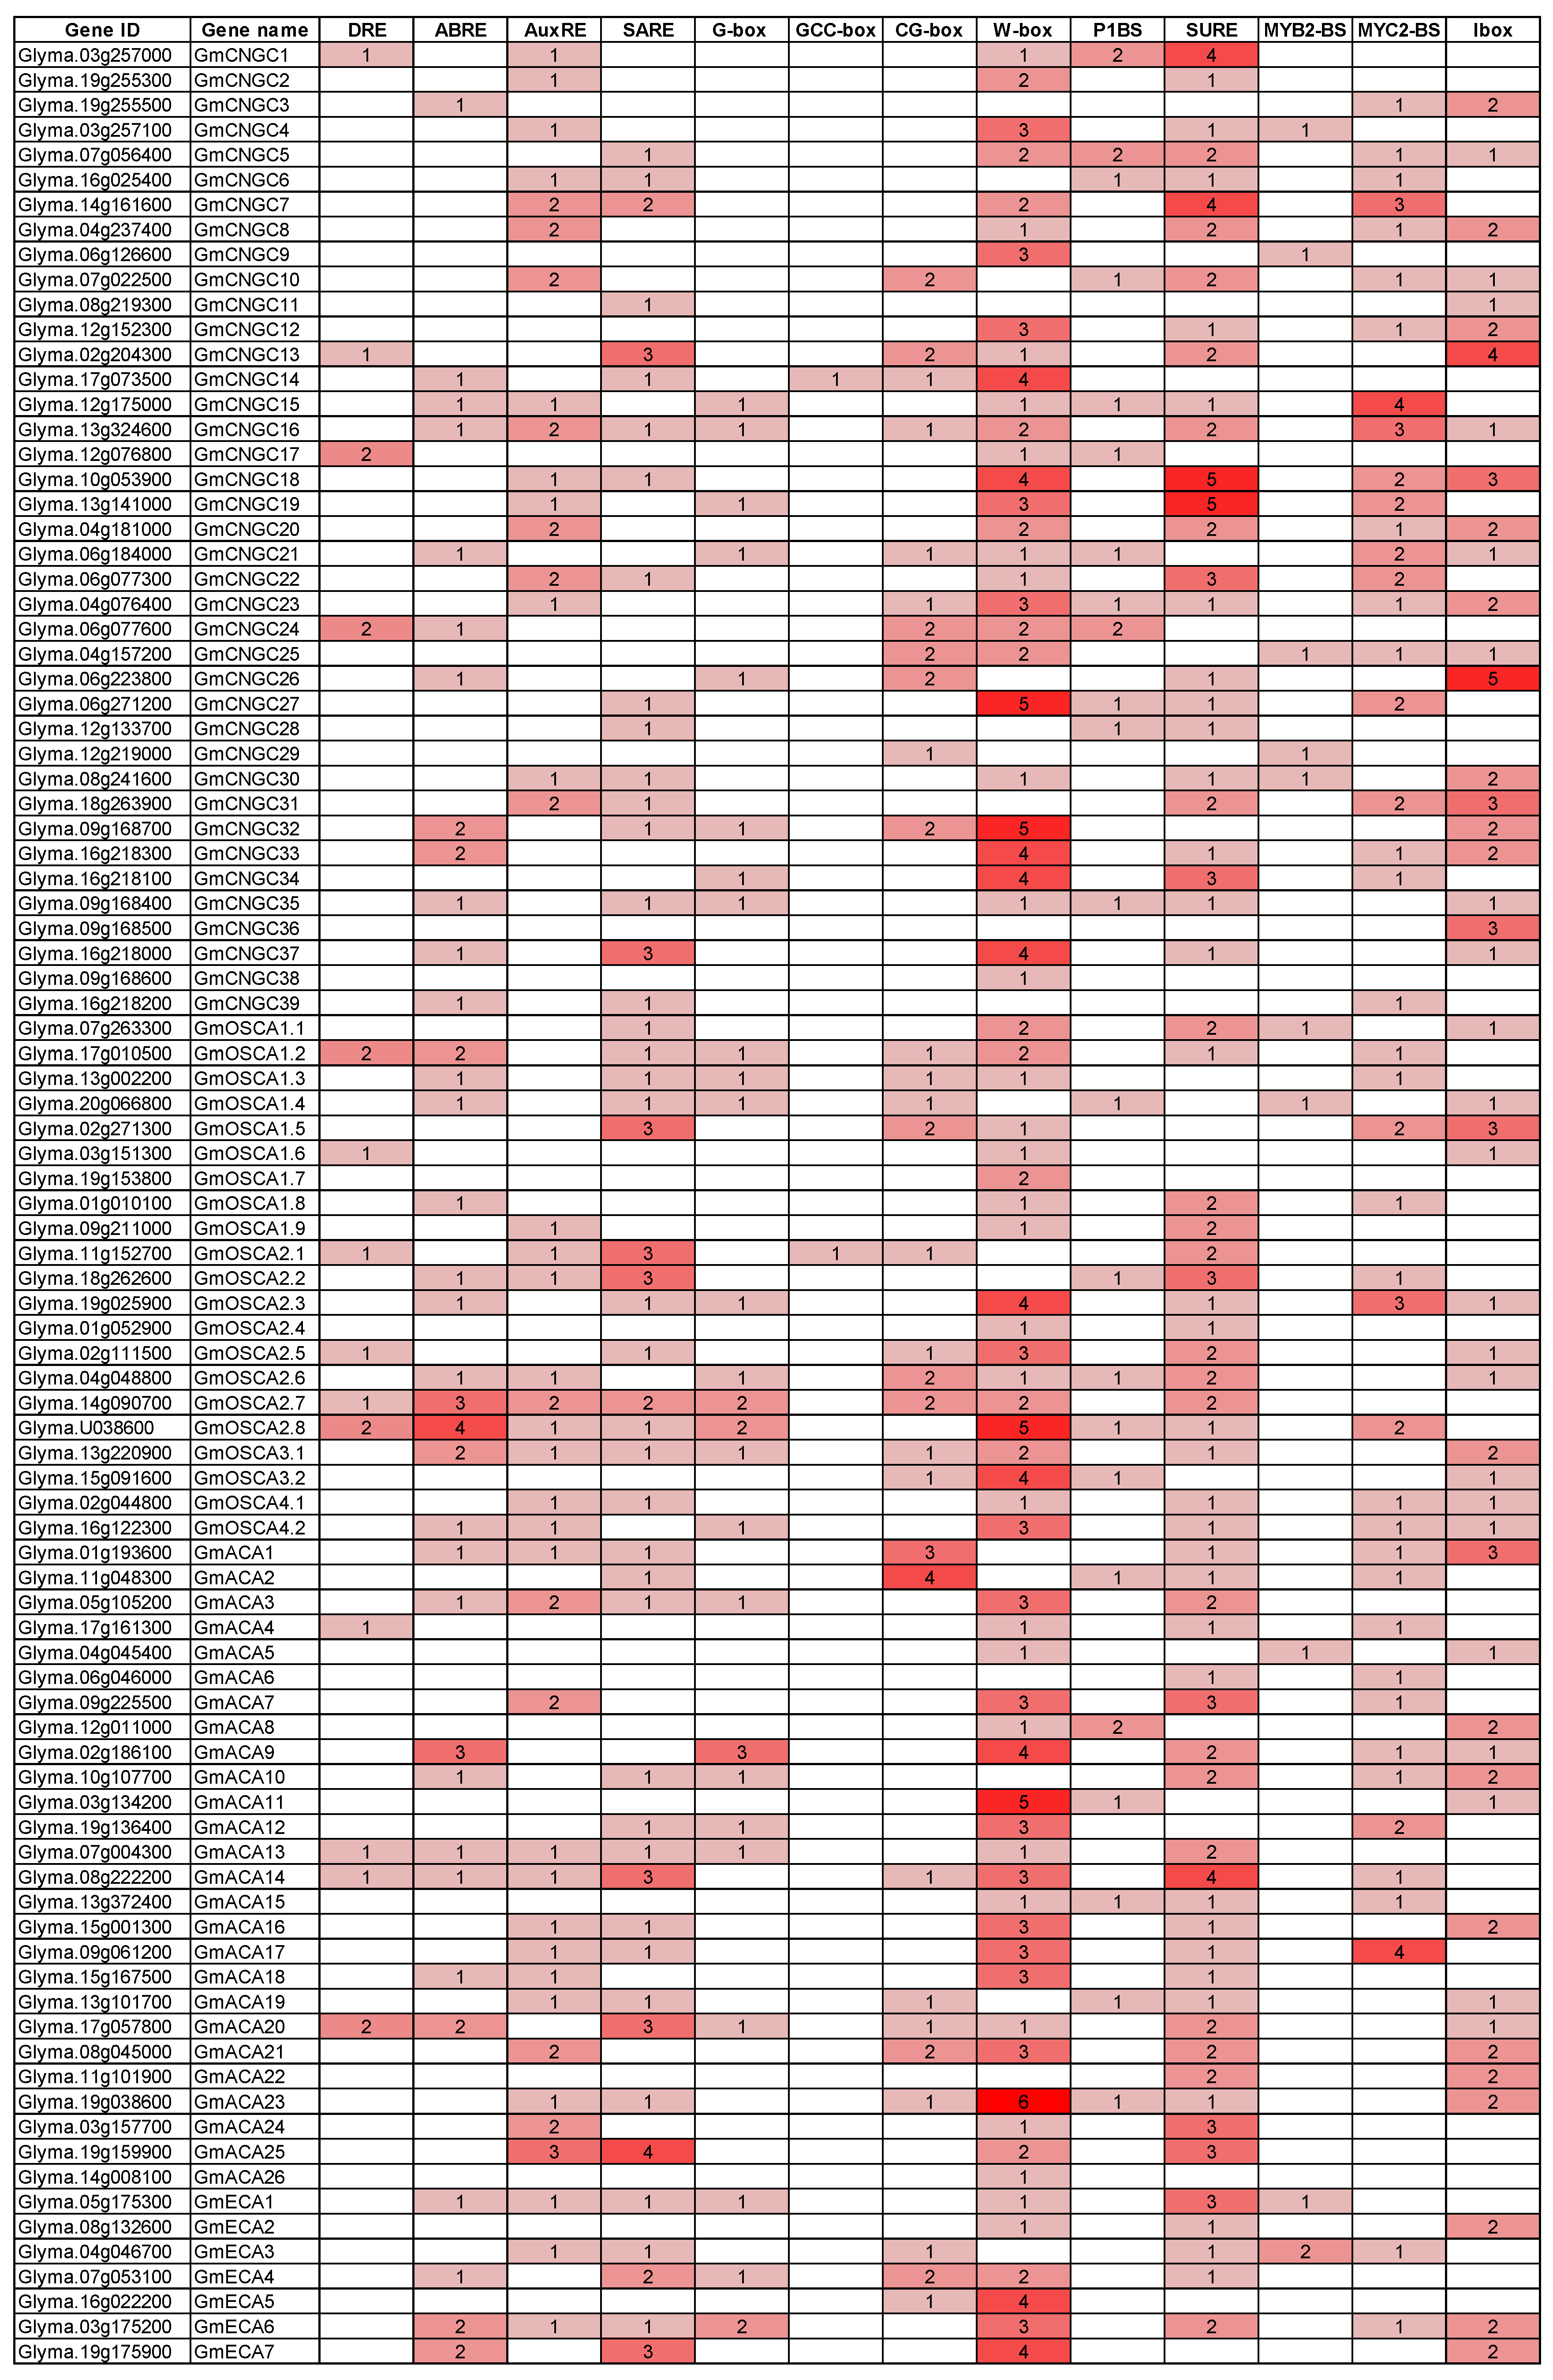
3.14. Hormone and Stress-Related Cis-Elements in the Promoters

The presence of cis-elements associated with hormonal signal and stress responses were surveyed in the −1500 bp promoter regions upstream to the predicted transcription start sites of these putative Ca2+ transport genes. A total of 13 cis-elements have been surveyed, such as dehydration and cold response element DRE/CRT, ABA response element ABRE, ethylene-responsive element GCC-box, SA-responsive element SARE, and WRKY-binding site W-box (Table S12 (Supplementary Materials)). The exact positions of cis-elements located in the promoters were shown in Table S13 (Supplementary Materials). All of the Ca2+ transport genes contain at least one kind of cis-element; some genes contain up to nine kinds of cis-elements, like GmCNGC16, GmOSCA2.8, GmCAX18, GmANN4, GLR3.3, and GmMCA2 (Table S13 (Supplementary Materials)). Among the Ca2+ transport genes, most of them contain W-box and/or sulfur-responsive element SURE, around half of them contain SARE, MYC2-binding site, and/or I-box, 36 of them contain ABRE, 68 of them contain DRE, while only 8 of them contain GCC-box (Figure S13 (Supplementary Materials)). It is notable that some cis-elements have many copies in the promoter regions (Figure 14 and Figure S14 (Supplementary Materials)). For example, three and four ABRE elements were found in the promoter of GmOSCA2.7 and GmOSCA2.8, respectively; five DRE elements were found in the promoter of GmCAX18; five W-boxes, two CG-boxes, and two I-boxes were found in the promoter of GmCNGC32 (Figure 14 and Figure S14 (Supplementary Materials)). It is interesting that the drought-responsive element DRE/CRT is more enriched in the drought/dehydration-responsive genes encoding putative Ca2+ transporters (Figure 13); the percentage of drought/dehydration-responsive genes containing DRE/CRT element is about 1.6 times more than that of the total Ca2+ transporter genes and about 1.8 times more than that of drought/dehydration-irresponsive genes (Figure S15 (Supplementary Materials)), suggesting the possible involvement of DRE/CRT-binding transcription factors in the drought/dehydration response of Ca2+ transporter genes in soybean.

3.15. Analysis of Potential MicroRNA Target Sites

microRNAs (miRNAs) have been indicated to be involved in growth and development control, stress response, and nutrient homeostasis by mediating post-transcriptional regulation [75,76]. To detect potential miRNA target sites within the putative Ca2+ transporter genes, the mRNA sequences of putative Ca2+ transporter genes were acquired from SoyBase (http://www.soybase.org/) and analyzed with the psRNATarget server (http://plantgrn.noble.org/psRNATarget/) [77]. To decrease the number of false-positive predictions, miRNA/target site pairs with an expectation score, and cut-off threshold of 3.0 were considered. Consequently, 61 miRNA members belonging to 37 families were predicted to target 47 genes (Table S14 (Supplementary Materials)). Many of these miRNAs have multiple target genes. For example, gma-miR156b has potential target sites on GmACA22 and GmOSCA2.2; gma-miR164 has potential target sites on GmMSL13 and GmMSL14; gma-miR9750 has potential target sites on GmMCA3 and GmMCA4 (Table S14 (Supplementary Materials)). These results suggest that miRNAs are potentially involved in Ca2+ signaling and Ca2+ homeostasis regulation.

4. Discussion

The physiological and biochemical functions of Ca2+ are enabled by its elaborate transportation across cell membranes, which is mediated by diverse Ca2+ transporters, including Ca2+ channels, pumps, and antiporters [3,5]. Ca2+ transporters, which differ in their cellular distribution and mechanism of transport, execute the complex and tight regulation of Ca2+ homeostasis [2]. Many proteins belonging to the families of CNGC, GLR, TPC, OSCA, and MCA have been identified to function as Ca2+ channels [15,16,17,26,33]. Some proteins belonging to protein families of ANN and MSL were also suggested to be Ca2+-permeable channels [3,37]. Although the physiological roles of many Ca2+ channels, pumps, and antiporters have been well documented in model plants like Arabidopsis and rice [12,18,21,34,78,79], there is still limited characterization of Ca2+ transport gene families in soybean. In the present study, we have performed a genome-wide in silico analysis of soybean to identify diverse Ca2+ transport gene families, including Ca2+-ATPase, CaCA, CNGC, OSCA, GLR, TPC, MCA, MSL, and ANN families. The chromosomal location, gene and protein structure, domain architecture, expression profiles, promoter cis-elements, and potential miRNA target sites of genes belonging to these families have been analyzed. The total number of putative Ca2+ transport protein-coding genes is 104 in Arabidopsis and 89 in rice, while a total of 207 genes encoding putative Ca2+ transport proteins were identified in soybean (Figure 1, Tables S1–S11 (Supplementary Materials)). The number of total Ca2+ transport protein-coding genes in soybean is about 2.0 and 2.3 times more than that of Arabidopsis and rice, respectively. For each of the nine Ca2+ transport protein families, the number of family members in soybeans was around 2.0 times more than that in Arabidopsis or in rice (Figure 1). For example, the number of CNGC genes in Arabidopsis and rice is 20 and 16, respectively, while the number in soybean is 39, which includes 15 segmentally duplicated gene pairs and five tandem duplicated gene groups (Figure 11, Table S11 (Supplementary Materials)). The possible reason behind this significant increase in gene number might be the two duplication events of soybean that has occurred after the monocot/dicot split approximately 59 and 13 million years ago [80]. In this study, phylogenetic trees were constructed to study the phylogenesis and the expansion of Ca2+ transport protein gene families in the course of evolution (Figure 2, Figure 3, Figure 4, Figure 5, Figure 6, Figure 7, Figure 8, Figure 9 and Figure 10). The Ca2+ transport protein-coding genes from Arabidopsis, rice, and soybean form common sub-clades with high bootstrap values (Figure 2, Figure 3, Figure 4, Figure 5, Figure 6, Figure 7, Figure 8, Figure 9 and Figure 10), suggesting the conserved evolution of these gene families in monocots and eudicots via common ancestors [4,55]. There are three principal patterns of gene duplications, such as tandem duplication, segmental duplication, and transposition. A total of 79 segmentally duplicated gene pairs were identified in all the putative Ca2+ transporter families (Table S11 (Supplementary Materials)). In addition, 20 gene groups showed tandem duplication (Figure 11). The expansion of putative Ca2+ transport protein-coding genes by gene duplication could be associated with the adaptation to various adverse environmental conditions during the evolution of soybean.
It is clear that various Ca2+ transport proteins play important roles in plant growth and development by mediating the generation of Ca2+ signaling. For example, Arabidopsis CNGC5, CNGC6, CNGC9, and CNGC14 function as central regulators of Ca2+ oscillations in root hair tip growth [9,81]; Arabidopsis CNGC7, CNGC8, CNGC18, GLR1.2, and GLR3.3 are required for pollen tube growth [26,82]; GLR3.2 and GLR3.4 were indicated to form heteromeric channels to regulate lateral root development via Ca2+ signaling in the phloem of Arabidopsis [83]; Ca2+-ATPase genes, ACA8, ACA10, ACA12, and ACA13, were suggested to be involved in vegetative growth, inflorescence growth, and seed setting [84,85]. In the present study, the tissue expression patterns of putative Ca2+ transporter genes showed that these genes were differentially expressed in diverse tissues of soybean during growth and development (Figure 12 and Figure S12 (Supplementary Materials)). Some ubiquitously expressed genes like GmCNGC12/13/14/25/26, GmACA5/9/11/13/17, GmCAX1/2/8, and GmOSCA3.1/3.2/4.1/4.2 may function in diver tissues during the whole life of soybean. Some genes showed strong expression during seed development, such as GmCNGC29 and GmANN5 (Figure 12 and Figure S12 (Supplementary Materials)), suggesting their potential roles in seed setting. Some genes expressed distinctively in the flowers, such as GmCNGC20, GmACA16, GmOSCA1.6, and GmGLR1.2/4.8/4.9/4.10, which may be associated with the reproductive growth of soybean. It is interesting that some genes, such as GmCNGC33, GmACA21/22, GmCAX4, GmCCX4, and GmGLR4.6, were predominantly expressed in root nodule. In addition, GmCNGC15, GmCNGC27, GmCNGC34, and GmANN24 were found to be induced by the inoculation of rhizobia (B. japonicum) (Figure 13). These results suggest their putative roles in symbiosis establishment and nodule development. In Medicago truncatula, the Ca2+-ATPase MCA8 and Ca2+ channel CNGC15 have been indicated to be required for the generation of Ca2+ spiking in the nucleus, where the Ca2+ spiking is induced by symbiosis [86,87].
In this study, 35.7% of the putative Ca2+ transporter genes in the soybean genome were found to be significantly and differentially regulated under diverse abiotic and biotic stresses, such as short-term salt, short-term dehydration, flooding, drought, phosphorus deficiency, zinc deficiency, and fungal pathogen inoculation (Figure 13). These differentially expressed genes included members from all groups of Ca2+ transport proteins. All of the putative Ca2+ transporter genes contain diverse stress- and/or hormone-related cis-elements in their promoter regions (Figure 14 and Figure S14 (Supplementary Materials)). The stress-responsive expression patterns of the putative Ca2+ transporter genes suggest the involvement of diverse Ca2+ transporters in abiotic and biotic stress responses. It is well-known that numerous environmental and developmental cues can trigger fluctuations of [Ca2+]cyt, and various Ca2+ transporters are involved in these processes [13]. It is notable that 48 genes are responsive to short-term salt stress treatment and most of them are Ca2+-ATPase genes and GLR genes (Figure 13). In soybean, eight Ca2+-ATPase genes (GmACA1/2/12/13/22/23/25/26) were found to be quickly induced by salt stress (Figure 13). This is similar to previous findings that some plant Ca2+-ATPase genes were up-regulated by salt stress [45,78,88]. AtACA2 and AtACA4 in Arabidopsis, PCA1 in the moss Physcomitrella patens, and OsACA6 in rice have been identified to be involved in salt stress tolerance [44,78,89,90,91]. The enhanced capacity of Ca2+-ATPase could help in restoring [Ca2+]cyt, which is transiently elevated by salt treatment, and thus, maintaining Ca2+ homeostasis.
In addition to salt stress, various genes of Ca2+ channels, pumps, and antiporters were also indicated to be involved in responses and tolerance to numerous stresses [12,15,21,79,92,93]. However, whether the stress-responsive Ca2+ transporter genes are possibly involved in stress response and tolerance in soybean deserves further researches.

5. Conclusions

In this study, a total of 207 genes encoding putative Ca2+ transporters have been identified in soybean genome, including 33 Ca2+-ATPase genes, 30 CaCA genes, 39 CNGC genes, 21 OSCA genes, 35 GLR genes, two TPC genes, 26 ANN genes, 16 MSL genes, and 5 MCA genes. A comprehensive analysis of these genes was preformed, including phylogenetic relationships, chromosomal distribution, protein domains, gene duplication, promoter cis-elements, potential miRNA target sites, and tissue and stress-responsive expression patterns. The comprehensive in silico characterization and expression analyses would provide preliminary evidence of the potential of role of Ca2+ transporter genes in growth and development, symbiosis, and responses to multiple environmental stresses in soybean. Considering the important roles of diverse Ca2+ transporters in developmental regulation and environmental stress adaptation that have been documented in model plants, further in-depth functional characterization of the orthologous genes in soybean through the combination of biochemical, molecular, physiological and genetic approaches would facilitate the development of high-yielding and stress-resistant crops.

Supplementary Materials

The following are available online at https://www.mdpi.com/2073-4395/10/10/1539/s1. Figure S1: Schematic representation of functional domains of soybean cyclic nucleotide-gated ion channel (CNGC) family proteins. Figure S2: Multiple sequence alignment of GmCNGC-specific motifs. Figure S3: Schematic representation of functional domains of soybean Ca2+-ATPase family proteins. Figure S4: Schematic representation of functional domains of soybean Ca2+/cation antiporter (CaCA) superfamily proteins. Figure S5: Multiple sequence alignment of NCL proteins of Arabidopsis, rice and soybean. Figure S6: Schematic representation of functional domains of soybean OSCA family proteins. Figure S7: Schematic representation of functional domains of soybean GLR family proteins. Figure S8: Schematic representation of functional domains of soybean ANN family proteins. Figure S9: Multiple sequence alignment of AtANN1 and GmANNs. Figure S10: Schematic representation of functional domains of soybean MSL family proteins. Figure S11: Multiple sequence alignment of MCA proteins in soybean, Arabidopsis and rice. Figure S12: Heat map representation for tissue-specific expression patterns of the predicted calcium transport genes according to Illumina transcriptome data. Figure S13: Number of genes containing the corresponding cis-element in their promoter regions. Figure S14: The distribution of cis-elements in the promoters of soybean Ca2+ transport genes. Figure S15: The occurrence of DRE/CRE cis-element in the promoter regions (1500 bp) of the total soybean Ca2+ transporter genes, Ca2+ transporter genes that are responsive to drought/dehydration, and Ca2+ transporter genes that are irresponsive to drought/dehydration. Table S1: A list of all the putative genes encoding Ca2+ transport proteins in soybean genome. Table S2: A list of putative CNGC genes and their sequence details in soybean. Table S3: A list of putative Ca2+-ATPase genes and their sequence details in soybean. Table S4: A list of putative CaCA genes and their sequence details in soybean. Table S5: A list of putative OSCA genes and their sequence details in soybean. Table S6: A list of putative GLR genes and their sequence details in soybean. Table S7: A list of putative ANN genes and their sequence details in soybean. Table S8: A list of putative TPC genes and their sequence details in soybean. Table S9: A list of putative MSL genes and their sequence details in soybean. Table S10: A list of putative MCA genes and their sequence details in soybean. Table S11: Identification of substitution rates for soybean Ca2+ transport gene pairs. Table S12: Summary of cis-acting elements that are related to plant hormone and stress response. Table S13: Distribution of hormone- and stress-related cis-elements in promoters of putative Ca2+ transporter genes in soybean. Table S14: Putative microRNA targets predicted in the putative Ca2+ transporter genes.

Author Contributions

H.Z. and H.C. conceived the study and wrote the manuscript. H.Z., B.Z. and H.W. performed the bioinformatic analysis. H.Z., B.Z. and Y.Z. analyzed the data. All authors read and approved the final manuscript.

Funding

This research was funded by the Zhejiang Provincial Natural Science Foundation of China (No. LY20C150002), the National Key Research and Development Program of China (No. 2018YFE0112200), and the Innovation and Entrepreneurship Project for Returned Overseas Scholars in Hangzhou.

Conflicts of Interest

The authors declare no conflict of interest.

References

  1. Hawkesford, M.; Horst, W.; Kichey, T.; Lambers, H.; Schjoerring, J.; Møller, I.S.; White, P. Functions of macronutrients. In Marschner’s Mineral Nutrition of Higher Plants; Elsevier: Amsterdam, The Netherlands, 2012; pp. 135–189. [Google Scholar]
  2. White, P.J.; Broadley, M.R. Calcium in plants. Ann. Bot. 2003, 92, 487–511. [Google Scholar] [CrossRef] [PubMed]
  3. Demidchik, V.; Shabala, S.; Isayenkov, S.; Cuin, T.A.; Pottosin, I. Calcium transport across plant membranes: Mechanisms and functions. New Phytol. 2018, 220, 49–69. [Google Scholar] [CrossRef] [PubMed] [Green Version]
  4. Edel, K.H.; Kudla, J. Increasing complexity and versatility: How the calcium signaling toolkit was shaped during plant land colonization. Cell Calcium 2015, 57, 231–246. [Google Scholar] [CrossRef]
  5. Reddy, A.S. Calcium: Silver bullet in signaling. Plant Sci. 2001, 160, 381–404. [Google Scholar] [CrossRef]
  6. Kudla, J.; Becker, D.; Grill, E.; Hedrich, R.; Hippler, M.; Kummer, U.; Parniske, M.; Romeis, T.; Schumacher, K. Advances and current challenges in calcium signaling. New Phytol. 2018, 218, 414–431. [Google Scholar] [CrossRef]
  7. Yuan, P.; Jauregui, E.; Du, L.; Tanaka, K.; Poovaiah, B.W. Calcium signatures and signaling events orchestrate plant–microbe interactions. Curr. Opin. Plant Biol. 2017, 38, 173–183. [Google Scholar] [CrossRef]
  8. Aldon, D.; Mbengue, M.; Mazars, C.; Galaud, J.P. Calcium signalling in plant biotic interactions. Int. J. Mol. Sci. 2018, 19, 665. [Google Scholar] [CrossRef] [Green Version]
  9. Tian, W.; Wang, C.; Gao, Q.; Li, L.; Luan, S. Calcium spikes, waves and oscillations in plant development and biotic interactions. Nat. Plants 2020, 6, 750–759. [Google Scholar] [CrossRef]
  10. Zeng, H.; Xu, L.; Singh, A.; Wang, H.; Du, L.; Poovaiah, B.W. Involvement of calmodulin and calmodulin-like proteins in plant responses to abiotic stresses. Front. Plant Sci. 2015, 6, 600. [Google Scholar] [CrossRef] [Green Version]
  11. Jiang, Z.; Zhou, X.; Tao, M.; Yuan, F.; Liu, L.; Wu, F.; Wu, X.; Xiang, Y.; Niu, Y.; Liu, F.; et al. Plant cell-surface GIPC sphingolipids sense salt to trigger Ca(2+) influx. Nature 2019, 572, 341–346. [Google Scholar] [CrossRef]
  12. Hilleary, R.; Paez-Valencia, J.; Vens, C.; Toyota, M.; Palmgren, M.; Gilroy, S. Tonoplast-localized Ca(2+) pumps regulate Ca(2+) signals during pattern-triggered immunity in Arabidopsis thaliana. Proc. Natl. Acad. Sci. USA 2020, 117, 18849–18857. [Google Scholar] [CrossRef] [PubMed]
  13. McAinsh, M.R.; Pittman, J.K. Shaping the calcium signature. New Phytol. 2009, 181, 275–294. [Google Scholar] [CrossRef] [PubMed]
  14. Jammes, F.; Hu, H.C.; Villiers, F.; Bouten, R.; Kwak, J.M. Calcium-permeable channels in plant cells. FEBS J. 2011, 278, 4262–4276. [Google Scholar] [CrossRef] [PubMed]
  15. Yuan, F.; Yang, H.; Xue, Y.; Kong, D.; Ye, R.; Li, C.; Zhang, J.; Theprungsirikul, L.; Shrift, T.; Krichilsky, B.; et al. OSCA1 mediates osmotic-stress-evoked Ca2+ increases vital for osmosensing in Arabidopsis. Nature 2014, 514, 367–371. [Google Scholar] [CrossRef]
  16. Peiter, E.; Maathuis, F.J.; Mills, L.N.; Knight, H.; Pelloux, J.; Hetherington, A.M.; Sanders, D. The vacuolar Ca2+-activated channel TPC1 regulates germination and stomatal movement. Nature 2005, 434, 404–408. [Google Scholar] [CrossRef]
  17. Dietrich, P.; Moeder, W.; Yoshioka, K. Plant cyclic nucleotide-gated channels: New insights on their functions and regulation. Plant Physiol. 2020, 184, 27–38. [Google Scholar] [CrossRef] [PubMed]
  18. Gao, Q.F.; Gu, L.L.; Wang, H.Q.; Fei, C.F.; Fang, X.; Hussain, J.; Sun, S.J.; Dong, J.Y.; Liu, H.; Wang, Y.F. Cyclic nucleotide-gated channel 18 is an essential Ca2+ channel in pollen tube tips for pollen tube guidance to ovules in Arabidopsis. Proc. Natl. Acad. Sci. USA 2016, 113, 3096–3101. [Google Scholar] [CrossRef] [Green Version]
  19. Nawaz, Z.; Kakar, K.U.; Saand, M.A.; Shu, Q.-Y. Cyclic nucleotide-gated ion channel gene family in rice, identification, characterization and experimental analysis of expression response to plant hormones, biotic and abiotic stresses. BMC Genom. 2014, 15, 853. [Google Scholar] [CrossRef] [Green Version]
  20. Mäser, P.; Thomine, S.; Schroeder, J.I.; Ward, J.M.; Hirschi, K.; Sze, H.; Talke, I.N.; Amtmann, A.; Maathuis, F.J.M.; Sanders, D.; et al. Phylogenetic relationships within cation transporter families of Arabidopsis. Plant Physiol. 2001, 126, 1646. [Google Scholar] [CrossRef] [Green Version]
  21. Thor, K.; Jiang, S.; Michard, E.; George, J.; Scherzer, S.; Huang, S.; Dindas, J.; Derbyshire, P.; Leitao, N.; DeFalco, T.A.; et al. The calcium-permeable channel OSCA1.3 regulates plant stomatal immunity. Nature 2020, 585, 569–573. [Google Scholar] [CrossRef]
  22. Li, Y.; Yuan, F.; Wen, Z.; Li, Y.; Wang, F.; Zhu, T.; Zhuo, W.; Jin, X.; Wang, Y.; Zhao, H.; et al. Genome-wide survey and expression analysis of the OSCA gene family in rice. BMC Plant Biol. 2015, 15, 261. [Google Scholar] [CrossRef] [PubMed] [Green Version]
  23. Kurusu, T.; Sakurai, Y.; Miyao, A.; Hirochika, H.; Kuchitsu, K. Identification of a putative voltage-gated Ca2+-permeable channel (OsTPC1) involved in Ca2+ influx and regulation of growth and development in rice. Plant Cell Physiol. 2004, 45, 693–702. [Google Scholar] [CrossRef] [PubMed] [Green Version]
  24. Davenport, R. Glutamate receptors in plants. Ann. Bot. 2002, 90, 549–557. [Google Scholar] [CrossRef] [PubMed]
  25. Vincill, E.D.; Bieck, A.M.; Spalding, E.P. Ca(2+) conduction by an amino acid-gated ion channel related to glutamate receptors. Plant Physiol. 2012, 159, 40–46. [Google Scholar] [CrossRef] [Green Version]
  26. Michard, E.; Lima, P.T.; Borges, F.; Silva, A.C.; Portes, M.T.; Carvalho, J.E.; Gilliham, M.; Liu, L.H.; Obermeyer, G.; Feijo, J.A. Glutamate receptor-like genes form Ca2+ channels in pollen tubes and are regulated by pistil D-serine. Science 2011, 332, 434–437. [Google Scholar] [CrossRef] [Green Version]
  27. Li, F.; Wang, J.; Ma, C.; Zhao, Y.; Wang, Y.; Hasi, A.; Qi, Z. Glutamate receptor-like channel3.3 is involved in mediating glutathione-triggered cytosolic calcium transients, transcriptional changes, and innate immunity responses in Arabidopsis. Plant Physiol. 2013, 162, 1497. [Google Scholar] [CrossRef] [Green Version]
  28. Ni, J.; Yu, Z.; Du, G.; Zhang, Y.; Taylor, J.L.; Shen, C.; Xu, J.; Liu, X.; Wang, Y.; Wu, Y. Heterologous expression and functional analysis of rice glutamate receptor-like family indicates its role in glutamate triggered calcium flux in rice roots. Rice 2016, 9, 9. [Google Scholar] [CrossRef] [Green Version]
  29. Hamill, O.P.; Martinac, B. Molecular basis of mechanotransduction in living cells. Physiol. Rev. 2001, 81, 685–740. [Google Scholar] [CrossRef]
  30. Hamilton, E.S.; Schlegel, A.M.; Haswell, E.S. United in diversity: Mechanosensitive ion channels in plants. Annu. Rev. Plant Biol. 2015, 66, 113–137. [Google Scholar] [CrossRef] [Green Version]
  31. Pivetti, C.D.; Yen, M.R.; Miller, S.; Busch, W.; Tseng, Y.H.; Booth, I.R.; Saier, M.H., Jr. Two families of mechanosensitive channel proteins. Microbiol. Mol. Biol. Rev. MMBR 2003, 67, 66–85. [Google Scholar] [CrossRef] [Green Version]
  32. Saddhe, A.A.; Kumar, K. In silico identification and expression analysis of MscS like gene family in rice. Plant Gene 2015, 1, 8–17. [Google Scholar] [CrossRef] [Green Version]
  33. Nakagawa, Y.; Katagiri, T.; Shinozaki, K.; Qi, Z.; Tatsumi, H.; Furuichi, T.; Kishigami, A.; Sokabe, M.; Kojima, I.; Sato, S.; et al. Arabidopsis plasma membrane protein crucial for Ca2+ influx and touch sensing in roots. Proc. Natl. Acad. Sci. USA 2007, 104, 3639–3644. [Google Scholar] [CrossRef] [PubMed] [Green Version]
  34. Kurusu, T.; Nishikawa, D.; Yamazaki, Y.; Gotoh, M.; Nakano, M.; Hamada, H.; Yamanaka, T.; Iida, K.; Nakagawa, Y.; Saji, H.; et al. Plasma membrane protein OsMCA1 is involved in regulation of hypo-osmotic shock-induced Ca2+ influx and modulates generation of reactive oxygen species in cultured rice cells. BMC Plant Biol. 2012, 12, 11. [Google Scholar] [CrossRef] [PubMed] [Green Version]
  35. Yamanaka, T.; Nakagawa, Y.; Mori, K.; Nakano, M.; Imamura, T.; Kataoka, H.; Terashima, A.; Iida, K.; Kojima, I.; Katagiri, T.; et al. MCA1 and MCA2 that mediate Ca2+ uptake have distinct and overlapping roles in Arabidopsis. Plant Physiol. 2010, 152, 1284–1296. [Google Scholar] [CrossRef] [PubMed] [Green Version]
  36. Laohavisit, A.; Davies, J.M. Annexins. New Phytol. 2011, 189, 40–53. [Google Scholar] [CrossRef] [PubMed]
  37. Davies, J.M. Annexin-mediated calcium signalling in plants. Plants 2014, 3, 128–140. [Google Scholar] [CrossRef] [Green Version]
  38. Laohavisit, A.; Richards, S.; Shabala, L.; Chen, C.; Colaco, R.; Swarbreck, S.; Shaw, E.; Dark, A.; Shabala, S.; Shang, Z.; et al. Salinity-induced calcium signaling and root adaptation in Arabidopsis thaliana require the calcium regulatory protein annexin1. Plant Physiol. 2013, 163, 253–262. [Google Scholar] [CrossRef] [Green Version]
  39. Richards, S.L.; Laohavisit, A.; Mortimer, J.C.; Shabala, L.; Swarbreck, S.M.; Shabala, S.; Davies, J.M. Annexin 1 regulates the H2O2-induced calcium signature in Arabidopsis thaliana roots. Plant J. 2014, 77, 136–145. [Google Scholar] [CrossRef]
  40. Laohavisit, A.; Mortimer, J.C.; Demidchik, V.; Coxon, K.M.; Stancombe, M.A.; Macpherson, N.; Brownlee, C.; Hofmann, A.; Webb, A.A.; Miedema, H.; et al. Zea mays annexins modulate cytosolic free Ca2+ and generate a Ca2+-permeable conductance. Plant Cell 2009, 21, 479–493. [Google Scholar] [CrossRef] [Green Version]
  41. Clark, G.B.; Morgan, R.O.; Fernandez, M.P.; Roux, S.J. Evolutionary adaptation of plant annexins has diversified their molecular structures, interactions and functional roles. New Phytol. 2012, 196, 695–712. [Google Scholar] [CrossRef]
  42. Jami, S.K.; Clark, G.B.; Ayele, B.T.; Roux, S.J.; Kirti, P.B. Identification and characterization of annexin gene family in rice. Plant Cell Rep. 2012, 31, 813–825. [Google Scholar] [CrossRef] [PubMed]
  43. Xu, L.; Tang, Y.; Gao, S.; Su, S.; Hong, L.; Wang, W.; Fang, Z.; Li, X.; Ma, J.; Quan, W.; et al. Comprehensive analyses of the annexin gene family in wheat. BMC Genom. 2016, 17, 415. [Google Scholar] [CrossRef] [PubMed] [Green Version]
  44. Bonza, M.C.; De Michelis, M.I. The plant Ca2+-ATPase repertoire: Biochemical features and physiological functions. Plant Biol. 2011, 13, 421–430. [Google Scholar] [CrossRef] [PubMed]
  45. Chung, W.S.; Lee, S.H.; Kim, J.C.; Heo, W.D.; Kim, M.C.; Park, C.Y.; Park, H.C.; Lim, C.O.; Kim, W.B.; Harper, J.F.; et al. Identification of a calmodulin-regulated soybean Ca(2+)-ATPase (SCA1) that is located in the plasma membrane. Plant Cell 2000, 12, 1393–1407. [Google Scholar] [CrossRef]
  46. Huda, K.M.K.; Banu, M.S.A.; Tuteja, R.; Tuteja, N. Global calcium transducer P-type Ca2+-ATPases open new avenues for agriculture by regulating stress signalling. J. Exp. Bot. 2013, 64, 3099–3109. [Google Scholar] [CrossRef]
  47. Baxter, I.; Tchieu, J.; Sussman, M.R.; Boutry, M.; Palmgren, M.G.; Gribskov, M.; Harper, J.F.; Axelsen, K.B. Genomic comparison of P-type ATPase ion pumps in Arabidopsis and rice. Plant Physiol. 2003, 132, 618–628. [Google Scholar] [CrossRef] [Green Version]
  48. Kamrul Huda, K.M.; Yadav, S.; Akhter Banu, M.S.; Trivedi, D.K.; Tuteja, N. Genome-wide analysis of plant-type II Ca2+ ATPases gene family from rice and Arabidopsis: Potential role in abiotic stresses. Plant Physiol. Biochem. 2013, 65, 32–47. [Google Scholar] [CrossRef]
  49. Pittman, J.K.; Hirschi, K.D. Phylogenetic analysis and protein structure modelling identifies distinct Ca2+/Cation antiporters and conservation of gene family structure within Arabidopsis and rice species. Rice 2016, 9, 3. [Google Scholar] [CrossRef] [Green Version]
  50. Emery, L.; Whelan, S.; Hirschi, K.; Pittman, J. Protein phylogenetic analysis of Ca2+/cation antiporters and insights into their evolution in plants. Front. Plant Sci. 2012, 3, 1. [Google Scholar] [CrossRef] [Green Version]
  51. Deshmukh, R.; Sonah, H.; Patil, G.; Chen, W.; Prince, S.; Mutava, R.; Vuong, T.; Valliyodan, B.; Nguyen, H.T. Integrating omic approaches for abiotic stress tolerance in soybean. Front. Plant Sci. 2014, 5, 244. [Google Scholar] [CrossRef]
  52. Zeng, H.; Zhang, X.; Zhang, X.; Pi, E.; Xiao, L.; Zhu, Y. Early Transcriptomic response to phosphate deprivation in soybean leaves as revealed by RNA-sequencing. Int. J. Mol. Sci. 2018, 19, 2145. [Google Scholar] [CrossRef] [PubMed] [Green Version]
  53. Hasanuzzaman, M.; Nahar, K.; Rahman, A.; Mahmud, J.A.; Hossain, M.S.; Fujita, M. 4-soybean production and environmental stresses. In Environmental Stresses in Soybean Production; Miransari, M., Ed.; Academic Press: Cambridge, MA, USA, 2016; pp. 61–102. [Google Scholar]
  54. Frietsch, S.; Wang, Y.-F.; Sladek, C.; Poulsen, L.R.; Romanowsky, S.M.; Schroeder, J.I.; Harper, J.F. A cyclic nucleotide-gated channel is essential for polarized tip growth of pollen. Proc. Natl. Acad. Sci. USA 2007, 104, 14531–14536. [Google Scholar] [CrossRef] [PubMed] [Green Version]
  55. Singh, A.; Kanwar, P.; Yadav, A.K.; Mishra, M.; Jha, S.K.; Baranwal, V.; Pandey, A.; Kapoor, S.; Tyagi, A.K.; Pandey, G.K. Genome-wide expressional and functional analysis of calcium transport elements during abiotic stress and development in rice. FEBS J. 2014, 281, 894–915. [Google Scholar] [CrossRef] [PubMed]
  56. Potter, S.C.; Luciani, A.; Eddy, S.R.; Park, Y.; Lopez, R.; Finn, R.D. HMMER web server: 2018 update. Nucleic Acids Res. 2018, 46, W200–W204. [Google Scholar] [CrossRef] [PubMed] [Green Version]
  57. Hunter, S.; Apweiler, R.; Attwood, T.K.; Bairoch, A.; Bateman, A.; Binns, D.; Bork, P.; Das, U.; Daugherty, L.; Duquenne, L.; et al. InterPro: The integrative protein signature database. Nucleic Acids Res. 2009, 37 (Suppl. S1), D211–D215. [Google Scholar] [CrossRef] [Green Version]
  58. Tamura, K.; Stecher, G.; Peterson, D.; Filipski, A.; Kumar, S. MEGA6: Molecular evolutionary genetics analysis version 6.0. Mol. Biol. Evol. 2013, 30, 2725–2729. [Google Scholar] [CrossRef] [Green Version]
  59. Zeng, H.; Zhang, Y.; Zhang, X.; Pi, E.; Zhu, Y. Analysis of EF-Hand proteins in soybean genome suggests their potential roles in environmental and nutritional stress signaling. Front. Plant Sci. 2017, 8, 877. [Google Scholar] [CrossRef] [Green Version]
  60. Lee, T.-H.; Tang, H.; Wang, X.; Paterson, A.H. PGDD: A database of gene and genome duplication in plants. Nucleic Acids Res. 2013, 41, D1152–D1158. [Google Scholar] [CrossRef]
  61. Chen, C.; Chen, H.; Zhang, Y.; Thomas, H.R.; Frank, M.H.; He, Y.; Xia, R. TBtools: An integrative toolkit developed for interactive analyses of big biological data. Mol. Plant 2020, 13, 1194–1202. [Google Scholar] [CrossRef]
  62. Lynch, M.; Conery, J.S. The evolutionary fate and consequences of duplicate genes. Science 2000, 290, 1151–1155. [Google Scholar] [CrossRef] [Green Version]
  63. Medina-Rivera, A.; Defrance, M.; Sand, O.; Herrmann, C.; Castro-Mondragon, J.A.; Delerce, J.; Jaeger, S.; Blanchet, C.; Vincens, P.; Caron, C.; et al. RSAT 2015: Regulatory sequence analysis tools. Nucleic Acids Res. 2015, 43, W50–W56. [Google Scholar] [CrossRef] [PubMed]
  64. Severin, A.J.; Woody, J.L.; Bolon, Y.-T.; Joseph, B.; Diers, B.W.; Farmer, A.D.; Muehlbauer, G.J.; Nelson, R.T.; Grant, D.; Specht, J.E. RNA-Seq Atlas of Glycine max: A guide to the soybean transcriptome. BMC Plant Biol. 2010, 10, 160. [Google Scholar] [CrossRef] [Green Version]
  65. Libault, M.; Farmer, A.; Joshi, T.; Takahashi, K.; Langley, R.J.; Franklin, L.D.; He, J.; Xu, D.; May, G.; Stacey, G. An integrated transcriptome atlas of the crop model Glycine max, and its use in comparative analyses in plants. Plant J. 2010, 63, 86–99. [Google Scholar] [CrossRef] [PubMed]
  66. Zeng, H.; Zhang, X.; Ding, M.; Zhang, X.; Zhu, Y. Transcriptome profiles of soybean leaves and roots in response to zinc deficiency. Physiol. Plant 2019, 167, 330–351. [Google Scholar] [CrossRef] [PubMed] [Green Version]
  67. Zeng, H.Q.; Wang, G.P.; Zhang, Y.Q.; Hu, X.Y.; Pi, E.X.; Zhu, Y.Y.; Wang, H.Z.; Du, L.Q. Genome-wide identification of phosphate-deficiency-responsive genes in soybean roots by high-throughput sequencing. Plant Soil 2016, 398, 207–227. [Google Scholar] [CrossRef]
  68. Belamkar, V.; Weeks, N.T.; Bharti, A.K.; Farmer, A.D.; Graham, M.A.; Cannon, S.B. Comprehensive characterization and RNA-Seq profiling of the HD-Zip transcription factor family in soybean (Glycine max) during dehydration and salt stress. BMC Genom. 2014, 15, 950. [Google Scholar] [CrossRef] [Green Version]
  69. Chen, W.; Yao, Q.; Patil, G.B.; Agarwal, G.; Deshmukh, R.K.; Lin, L.; Wang, B.; Wang, Y.; Prince, S.J.; Song, L.; et al. Identification and comparative analysis of differential gene expression in soybean leaf tissue under drought and flooding stress revealed by RNA-Seq. Front. Plant Sci. 2016, 7, 1044. [Google Scholar] [CrossRef] [PubMed] [Green Version]
  70. Lanubile, A.; Muppirala, U.K.; Severin, A.J.; Marocco, A.; Munkvold, G.P. Transcriptome profiling of soybean (Glycine max) roots challenged with pathogenic and non-pathogenic isolates of Fusarium oxysporum. BMC Genom. 2015, 16, 1089. [Google Scholar] [CrossRef] [Green Version]
  71. Libault, M.; Farmer, A.; Brechenmacher, L.; Drnevich, J.; Langley, R.J.; Bilgin, D.D.; Radwan, O.; Neece, D.J.; Clough, S.J.; May, G.D.; et al. Complete transcriptome of the soybean root hair cell, a single-cell model, and its alteration in response to Bradyrhizobium japonicum infection. Plant Physiol. 2010, 152, 541–552. [Google Scholar] [CrossRef] [Green Version]
  72. Zelman, A.K.; Dawe, A.; Gehring, C.; Berkowitz, G.A. Evolutionary and structural perspectives of plant cyclic nucleotide-gated cation channels. Front. Plant Sci. 2012, 3, 95. [Google Scholar] [CrossRef] [Green Version]
  73. Singh, A.K.; Kumar, R.; Tripathi, A.K.; Gupta, B.K.; Pareek, A.; Singla-Pareek, S.L. Genome-wide investigation and expression analysis of Sodium/Calcium exchanger gene family in rice and Arabidopsis. Rice 2015, 8, 21. [Google Scholar] [CrossRef] [PubMed] [Green Version]
  74. Li, W.H.; Gojobori, T.; Nei, M. Pseudogenes as a paradigm of neutral evolution. Nature 1981, 292, 237–239. [Google Scholar] [CrossRef] [PubMed]
  75. Zeng, H.; Wang, G.; Hu, X.; Wang, H.; Du, L.; Zhu, Y. Role of microRNAs in plant responses to nutrient stress. Plant Soil 2014, 374, 1005–1021. [Google Scholar] [CrossRef]
  76. Li, S.; Castillo-Gonzalez, C.; Yu, B.; Zhang, X. The functions of plant small RNAs in development and in stress responses. Plant J. 2017, 90, 654–670. [Google Scholar] [CrossRef] [PubMed] [Green Version]
  77. Dai, X.; Zhao, P.X. psRNATarget: A plant small RNA target analysis server. Nucleic Acids Res. 2011, 39, W155–W159. [Google Scholar] [CrossRef] [Green Version]
  78. Huda, K.M.; Banu, M.; Akhter, S.; Garg, B.; Tula, S.; Tuteja, R.; Tuteja, N. OsACA6, a P-type IIB Ca2+ ATPase promotes salinity and drought stress tolerance in tobacco by ROS scavenging and enhancing stress-responsive genes. Plant J. 2013, 76, 997–1015. [Google Scholar] [CrossRef]
  79. Tian, W.; Hou, C.; Ren, Z.; Wang, C.; Zhao, F.; Dahlbeck, D.; Hu, S.; Zhang, L.; Niu, Q.; Li, L.; et al. A calmodulin-gated calcium channel links pathogen patterns to plant immunity. Nature 2019, 572, 131–135. [Google Scholar] [CrossRef]
  80. Schmutz, J.; Cannon, S.B.; Schlueter, J.; Ma, J.; Mitros, T.; Nelson, W.; Hyten, D.L.; Song, Q.; Thelen, J.J.; Cheng, J.; et al. Genome sequence of the palaeopolyploid soybean. Nature 2010, 463, 178–183. [Google Scholar] [CrossRef] [Green Version]
  81. Tan, Y.-Q.; Yang, Y.; Zhang, A.; Fei, C.-F.; Gu, L.-L.; Sun, S.-J.; Xu, W.; Wang, L.; Liu, H.; Wang, Y.-F. Three CNGC family members, CNGC5, CNGC6, and CNGC9, are required for constitutive growth of Arabidopsis root hairs as Ca2+-permeable channels. Plant Commun. 2020, 1, 100001. [Google Scholar] [CrossRef]
  82. Pan, Y.; Chai, X.; Gao, Q.; Zhou, L.; Zhang, S.; Li, L.; Luan, S. Dynamic interactions of plant CNGC subunits and calmodulins drive oscillatory Ca2+ channel activities. Dev. Cell 2019, 48, 710–725. [Google Scholar] [CrossRef] [Green Version]
  83. Vincill, E.D.; Clarin, A.E.; Molenda, J.N.; Spalding, E.P. Interacting glutamate receptor-like proteins in phloem regulate lateral root initiation in Arabidopsis. Plant Cell 2013, 25, 1304–1313. [Google Scholar] [CrossRef] [PubMed] [Green Version]
  84. Yu, H.; Yan, J.; Du, X.; Hua, J. Overlapping and differential roles of plasma membrane calcium ATPases in Arabidopsis growth and environmental responses. J. Exp. Bot. 2018, 69, 2693–2703. [Google Scholar] [CrossRef] [PubMed] [Green Version]
  85. George, L.; Romanowsky, S.M.; Harper, J.F.; Sharrock, R.A. The ACA10 Ca2+-ATPase regulates adult vegetative development and inflorescence architecture in Arabidopsis. Plant Physiol. 2008, 146, 716–728. [Google Scholar] [CrossRef] [PubMed] [Green Version]
  86. Charpentier, M.; Sun, J.; Vaz Martins, T.; Radhakrishnan, G.V.; Findlay, K.; Soumpourou, E.; Thouin, J.; Very, A.A.; Sanders, D.; Morris, R.J.; et al. Nuclear-localized cyclic nucleotide-gated channels mediate symbiotic calcium oscillations. Science 2016, 352, 1102–1105. [Google Scholar] [CrossRef]
  87. Capoen, W.; Sun, J.; Wysham, D.; Otegui, M.S.; Venkateshwaran, M.; Hirsch, S.; Miwa, H.; Downie, J.A.; Morris, R.J.; Ané, J.-M.; et al. Nuclear membranes control symbiotic calcium signaling of legumes. Proc. Natl. Acad. Sci. USA 2011, 108, 14348–14353. [Google Scholar] [CrossRef] [Green Version]
  88. Perez-Prat, E.; Narasimhan, M.L.; Binzel, M.L.; Botella, M.A.; Chen, Z.; Valpuesta, V.; Bressan, R.A.; Hasegawa, P.M. Induction of a putative Ca-ATPase mRNA in NaCl-adapted cells. Plant Physiol. 1992, 100, 1471–1478. [Google Scholar] [CrossRef] [Green Version]
  89. Qudeimat, E.; Faltusz, A.M.C.; Wheeler, G.; Lang, D.; Holtorf, H.; Brownlee, C.; Reski, R.; Frank, W. A PIIB-type Ca2+-ATPase is essential for stress adaptation in Physcomitrella patens. Proc. Natl. Acad. Sci. USA 2008, 105, 19555–19560. [Google Scholar] [CrossRef] [Green Version]
  90. Geisler, M.; Frangne, N.; Gomès, E.; Martinoia, E.; Palmgren, M.G. The ACA4 gene of Arabidopsis encodes a vacuolar membrane calcium pump that improves salt tolerance in yeast. Plant Physiol. 2000, 124, 1814–1827. [Google Scholar] [CrossRef] [Green Version]
  91. Anil, V.S.; Rajkumar, P.; Kumar, P.; Mathew, M.K. A plant Ca2+ pump, ACA2, relieves salt hypersensitivity in yeast. Modulation of cytosolic calcium signature and activation of adaptive Na+ homeostasis. J. Biol. Chem. 2008, 283, 3497–3506. [Google Scholar] [CrossRef] [Green Version]
  92. Konopka-Postupolska, D.; Clark, G.; Goch, G.; Debski, J.; Floras, K.; Cantero, A.; Fijolek, B.; Roux, S.; Hennig, J. The role of annexin 1 in drought stress in Arabidopsis. Plant Physiol. 2009, 150, 1394–1410. [Google Scholar] [CrossRef] [Green Version]
  93. Kang, J.; Mehta, S.; Turano, F.J. The putative glutamate receptor 1.1 (AtGLR1.1) in Arabidopsis thaliana regulates abscisic acid biosynthesis and signaling to control development and water loss. Plant Cell Physiol. 2004, 45, 1380–1389. [Google Scholar] [CrossRef] [PubMed]
Figure 1. The number of genes encoding diverse Ca2+ transport protein families in Arabidopsis, rice, and soybean.
Agronomy 10 01539 g001
Figure 2. Unrooted phylogenetic tree of the cyclic nucleotide-gated ion channel (CNGC) family proteins from soybean (Glycine max), rice (Oryza sativa), and Arabidopsis thaliana. The alignment for the phylogenetic tree was performed with ClustalW using full-length amino acid sequences. The phylogenetic tree was created with the MEGA6 software and the neighbor-joining method with 1000 bootstrap replications. GmCNGCs are marked with red circles, AtCNGCs were marked with purple triangles, while OsCNGCs were marked with green diamonds. The locus name of each gene is shown in brackets. The bar indicates the relative divergence of the sequences examined, and bootstrap values are displayed next to the branch. Roman numerals designate the subfamilies.
Agronomy 10 01539 g002
Figure 3. Unrooted phylogenetic tree of the Ca2+-ATPase family proteins from soybean (Glycine max), rice (Oryza sativa), and Arabidopsis thaliana. The alignment for the phylogenetic tree was performed with ClustalW using full-length amino acid sequences. Soybean Ca2+-ATPases are marked with red circles, Arabidopsis Ca2+-ATPases were marked with purple triangles, while rice Ca2+-ATPases were marked with green diamonds. The locus name of each gene is shown in brackets. The bar indicates the relative divergence of the sequences examined, and bootstrap values are displayed next to the branch.
Agronomy 10 01539 g003
Figure 4. Unrooted phylogenetic tree of the CaCA (Ca2+/Cation Antiporter) family proteins from soybean (Glycine max), rice (Oryza sativa), and Arabidopsis thaliana. The alignment for the phylogenetic tree was performed with ClustalW using full-length amino acid sequences. Soybean CaCAs are marked with red circles, Arabidopsis CaCAs were marked with purple triangles, while rice CaCAs were marked with green diamonds. The bar indicates the relative divergence of the sequences examined, and bootstrap values are displayed next to the branch.
Agronomy 10 01539 g004
Figure 5. Unrooted phylogenetic tree of the OSCA family proteins from soybean (Glycine max), rice (Oryza sativa), and Arabidopsis thaliana. Soybean OSCAs are marked with red circles, Arabidopsis OSCAs were marked with purple triangles, while rice OSCAs were marked with green diamonds. The bar indicates the relative divergence of the sequences examined, and bootstrap values are displayed next to the branch. Roman numerals designate the subfamilies.
Agronomy 10 01539 g005
Figure 6. Unrooted phylogenetic tree of the glutamate receptor-like (GLR) family proteins from soybean (Glycine max), rice (Oryza sativa), and Arabidopsis thaliana. Soybean GLRs are marked with red circles, Arabidopsis GLRs were marked with purple triangles, while rice GLRs were marked with green diamonds. The bar indicates the relative divergence of the sequences examined, and bootstrap values are displayed next to the branch. Roman numerals designate the subfamilies.
Agronomy 10 01539 g006
Figure 7. Unrooted phylogenetic tree of the annexins (ANN) family proteins from soybean (Glycine max), rice (Oryza sativa), and Arabidopsis thaliana. Soybean ANNs are marked with red circles, Arabidopsis ANNs were marked with purple triangles, while rice ANNs were marked with green diamonds. The bar indicates the relative divergence of the sequences examined, and bootstrap values are displayed next to the branch. Roman numerals designate the subfamilies.
Agronomy 10 01539 g007
Figure 8. Schematic representation of functional domains of soybean two-pore channel (TPC) family proteins (A). Unrooted phylogenetic tree of the TPC family proteins from soybean (Glycine max), rice (Oryza sativa), and Arabidopsis thaliana (B). Soybean TPCs are marked with red circles, Arabidopsis TPC1 was marked with purple triangles, while rice TPC1 were marked with green diamonds. The bar indicates the relative divergence of the sequences examined, and bootstrap values are displayed next to the branch.
Agronomy 10 01539 g008
Figure 9. Unrooted phylogenetic tree of the MscS like protein (MSL) family proteins from soybean (Glycine max), rice (Oryza sativa), and Arabidopsis thaliana. Soybean MSLs are marked with red circles, Arabidopsis MSLs were marked with purple triangles, while rice MSLs were marked with green diamonds. The bar indicates the relative divergence of the sequences examined, and bootstrap values are displayed next to the branch. Roman numerals designate the subfamilies.
Agronomy 10 01539 g009
Figure 10. Schematic representation of functional domains of soybean Mid1-complementing activity (MCA) family proteins (A). Unrooted phylogenetic tree of the MCA family proteins from soybean (Glycine max), rice (Oryza sativa), and Arabidopsis thaliana (B). Soybean MCAs are marked with red circles, Arabidopsis MCAs were marked with purple triangles, while rice MCA1 were marked with green diamonds. The bar indicates the relative divergence of the sequences examined, and bootstrap values are displayed next to the branch.
Agronomy 10 01539 g010
Figure 11. Graphical representation of locations for all the Ca2+ transport genes on each chromosome of soybean. Genes within the same family were marked in the same color. Genes within a light blue box are putatively tandemly duplicated.
Agronomy 10 01539 g011
Figure 12. Heat map representation for tissue-specific expression patterns of the predicted calcium transporter genes according to Illumina RNA sequencing data (https://www.soybase.org/soyseq/). The Reads/Kb/Million (RPKM) normalized log2 transformed counts were visualized in the heat map. The red colors indicate expression intensity, and the gray color indicates no expression. DAF, days after flowering.
Agronomy 10 01539 g012
Figure 13. Heatmap representation for transcriptional responses of Ca2+ transport genes under environmental stresses like salt in roots, dehydration in roots, flooding in leaves, drought in leaves, phosphorus deficiency in roots, zinc deficiency in roots, and inoculation of pathogenic isolates of Fusarium oxysporum (72 h post-inoculation, hpi) in roots, and inoculation of symbiotic soil bacteria Bradyrhizobium japonicum (12–48 h after inoculation, HAI) in root hairs. The intensities of the color represent the relative magnitude of fold changes in log2 values according to high-throughput sequencing data (Fold change ≥ 2, p-value < 0.05). The red color indicates induction, the blue color indicates repression, and the gray color means there is no significant expressional change.
Agronomy 10 01539 g013
Figure 14. The distribution of cis-elements in the promoters of soybean CNGC, OSCA, and Ca2+-ATPase gene families. The intensities of the color represent the number of cis-elements.
Agronomy 10 01539 g014

