Agricultural Nitrogen Budget for a Long-Term Row Crop Production System in the Midwest USA


1
Department of Earth and Environment, Florida International University, Miami, FL 33199, USA
2
Department of Agricultural and Biological Engineering, University of Illinois at Urbana-Champaign, Urbana, IL 61801, USA
3
King Abdulaziz City for Science and Technology, Riyadh 12354, Saudi Arabia
4
Department of Soils, Punjab Agricultural University, Ludhiana 141027, Punjab, India
*
Author to whom correspondence should be addressed.
Agronomy 2020, 10(11), 1622; https://doi.org/10.3390/agronomy10111622
Submission received: 15 September 2020
/
Revised: 20 October 2020
/
Accepted: 20 October 2020
/
Published: 22 October 2020
(This article belongs to the Special Issue Long-Term Experiments for Sustainable Nutrient Management)
Abstract
:In the Midwestern United States, subsurface drainage (commonly known as tile drains) systems have been extensively used for sustaining agricultural production. However, the tile drains have raised concerns of facilitating the transport of agricultural chemicals from the fields to receiving waters. Data from a long-term field experiment in the Little Vermilion River (LVR) watershed of east-central Illinois, USA, shows that the tile drain systems have contributed to increased nitrate N (NO3-N) to the receiving water body, Georgetown Lake Reservoir, over time. We conducted more than 10 years of research on fate and transport of NO3-N in tile drain water, surface runoff and soil N. Corn (Zea mays L.) and soybean (Glycine max L.) were planted in rotation for this watershed. We evaluated N balance (inputs and outputs) and transfer (runoff and leaching) components from three sites with both surface and subsurface flow stations within this watershed, and N budgets for individual sites were developed. Nitrogen fertilizer application (average 192 kg ha−1 y−1) and soil N mineralization (average 88 kg ha−1 y−1) were the major N inputs for corn and soybean, respectively in this watershed. Plant N uptake was the major N output for both crops during this entire study period. Annual N uptake for the LVR watershed ranged from +39 to +148 (average +93) kg ha−1 and −63 to +5 (average −32) kg ha−1, respectively, for corn and soybeans. This data indicates that most of the soil mineralized N was used during soybean production years, while corn production years added extra N in the soil. Surface runoff from the watershed was negligible, however, subsurface leaching through tile drains removed about 18% of the total rainfall. Average NO3-N concentrations of leaching water at sites A (15 mg L−1) and B (16.5 mg L−1) exceeded maximum contaminant level (MCL; 10 mg L−1) throughout the experiment. However, NO3-N concentrations from site E (6.9 mg L−1) never exceeded MCL possibly because 15–22% lower N was received at this site. We estimated that the average corn grain yield would need to be 28% higher to remove the additional N from this watershed. Our study suggests that N application schemes of the LVR watershed need to be reevaluated for better N management, optimum crop production, and overall environmental sustainability.
1. Introduction
Nitrogen is the essential nutrient for plant growth and is often lost from the soil profile by runoff, leaching, denitrification, and volatilization [1,2] Nitrate (NO3-N), an available form of N for plant uptake, is highly soluble, mobile, and can easily leach down to groundwater under favorable soil [3] and climatic [4,5] conditions. Nitrate pollution has been a global water quality problem for decades, and an imperative area of concern for environmental scientists. Soluble NO3-N from agricultural fields easily run off to open water systems and can potentially cause the degradation of aquatic ecosystems which includes widespread eutrophication, increase growth of harmful algal blooms (HABs), reduction of bioavailable oxygen contents (increase biological oxygen demand; BOD), and loss of aquatic biodiversity [3,5,6]. Anthropogenic NO3-N sources in major water resources of the US (such as Lake Okeechobee, Lake Erie, Lake Michigan, etc.) also favored the growth of cyanobacterial HABs and release of cyanotoxins, which subsequently caused a threat to aquatic animals (pelicans, turtles, manatees, fish, sea lions, etc.) including an Alzheimer’s like disease in Dolphins [7]. High concentrations of NO3-N in drinking water are reported to cause human health problems such as methemoglobinemia or blue baby syndrome in infants, gastric cancer in adults [8,9,10,11], and linkages to non-Hodgkin’s Lymphoma [12,13]. The maximum contamination level (MCL) of NO3-N in drinking water is 10 mg L−1 [14], however, researchers found concentration of NO3-N much higher than the MCL in many drinking water resources in the US [15,16].
Agricultural crop production in the Midwestern US states (Illinois, Indiana, Iowa, Michigan, Minnesota, Missouri, Ohio, and Wisconsin) has generated significant revenue; about 75% of the total agricultural area (20.8 million hectares) is used for corn (Zea mays L.) and soybean (Glycine max L.) productions [17]. Agricultural exports (more than USD 43 billion) from the Midwestern US were about 32% of the national agricultural export in 2017 [18]. In terms of areas under agricultural production, Illinois ranked second (after Iowa) for corn grain (4.39 million ha) and ranked first for soybean (4.35 million ha) productions in the US in 2018. Corn and soybean productions in Illinois generated USD 7.10 and USD 4.87 billion in revenue, respectively, in 2019 [19]. Corn is a high biomass producing (C4 plant) row crop and needs an intensive application of N fertilizers during production. For example, [20] reported that the median economically optimal N fertilizer rate (EONR) for corn ranged from 63 to 208 kg N ha−1 y−1 for three major soil areas in the US. However, improper N management during corn–soybean rotations in the Midwest US has been reported to contaminate groundwater with NO3-N [21,22,23]. About 98% of the corn-producing areas in Illinois receive N fertilizers and in 2018, Illinois farmers used about 20 kg ha−1 higher N fertilizers for corn productions than the average N applied for other corn-producing states in the US [24]. David et al. [25] developed an agricultural N budget for Camargo watershed in Illinois and found low average N use efficiency during corn production years. Illinois Environmental Protection Agency (IEPA) [26] reported that agricultural operations itself generated more than 80% (152 million kg) of total riverine N (80% of the total as NO3-N) transport in Illinois River in 2015. It was also reported that an average riverine NO3-N load (25 kg ha−1 y−1) was highest in the Vermilion River Watershed [26] in Illinois.
A significant amount of agricultural land in the Midwestern US is artificially drained. It was estimated that 37% of the total agricultural lands benefitted from subsurface drainage [27,28] in terms of agricultural production. However, previous studies claimed that the Mississippi river received the greatest amount of NO3-N discharge from artificially drained agricultural watersheds of Illinois, Iowa, and Minnesota [29,30]. Subsurface drainage in Illinois was installed to convert millions of hectares of swamp areas into highly productive agricultural lands by removing excess soil water and providing a suitable environment for crop production. The Little Vermilion River (LVR) watershed in east-central Illinois is a perfect example of subsurface drained watershed that drains approximately 52,021 ha [31]. A small portion of this watershed was impounded to create Georgetown Lake Reservoir (18.6 ha) which served as a drinking water supply to more than 10,000 people living in Georgetown, Illinois. It has been reported that improper nutrient management in the LVR watershed that drained water into the reservoir contributed to drinking water quality problems [32]. Therefore, this study aimed to assess N estimation for row crop productions in the LVR watershed to identify the key factors affecting water quality on a long-term basis and reevaluate fertilizer application and N management schemes. This paper examined as many N input and output components as possible for a 10-year study period under corn–soybean crop rotations to investigate the fate and transport of soil N at the LVR watershed. This research experiment was specifically planned to (1) estimate different N inputs and outputs for developing agricultural N budget and (2) study the relationships between N balance in the watershed and transfer of NO3-N from soil profile through surface runoff and subsurface leaching.
2. Materials and Methods
2.1. Site Location and Characteristics
A long-term experiment (10 years) was conducted at three different sites (sites A, B, and E) of the LVR watershed, which is located in east-central Illinois, USA (Figure 1). Corn (var: Cargill 6888) and soybeans (var: Pioneer 9281) were planted in rotation during this 10-year study period. Experiments were conducted on private farmlands owned by individual producers living in the watershed. The area of the watershed was approximately 489 km2 in three counties (Champaign, Edgar, and Vermilion) and the major portion was in the Vermilion county [33]. The watershed had about seven tile drain stations (not all were operational), four surface runoff stations, seven river stations, and a wetland site nearby in the Vermilion county. Three sample collection sites (A, B, and E) had random and irregularly spaced subsurface drainage systems and the areas drained from these sites were highly variable (Table 1). Each site had one surface and one subsurface station. The watershed had flat topography, with a slope of approximately 1% or less [33,34]. The LVR watershed can typically be characterized as an altered hydrologic system with moderate to poorly drained hydrologic conditions. Subsurface drains were installed in low land (depressional) areas at a depth of 1.0–1.1 m. Water samples were collected from three surface stations (As, Bs, and Es) and three tile drained subsurface stations (At, Bt, and Et) for this study. The water sampling stations were installed with both automatic and grab sampling facilities. Water through subsurface drainage and ditches of this watershed eventually drains into Georgetown Lake Reservoir, an 18.6 ha freshwater lake situated in the village of Georgetown, Illinois. Drummer silty clay loam and Flanagan silt loam were the predominant soils of this watershed with Sabina and Xenia silt loam soil present in some places. The long-term average annual rainfall and temperature (range) for the watershed at station number 112140, Danville, Illinois, were approximately 1040 mm and −6 to 29 °C, respectively [35]. About 90% of the watershed was used for corn–soybean crop production [31,36,37].
2.2. Different N Inputs
Different inputs of N accounted for in this study were fertilizer application, soil mineralization of N, and atmospheric deposition. The project aimed to obtain more realistic data from the experiment and therefore, the landowners (growers) of the LVR watershed made crop and fertilizer management decisions. Thus, this experiment was unique in a way that a realistic approach was modified and further developed into a sustainable agricultural production system.
Data on fertilizer application rates, methods, and timings were collected through personal communications with the landowners (that was mutually agreed upon with memoranda of understanding with each landowner and the research team at the University of Illinois) during the entire study period. Only inorganic N fertilizer was used during this period. Nitrogen was mainly applied (knifed in) before corn was planted, and some amount of N was applied after corn and soybeans were harvested. To estimate N mineralization, we collected literature data from other experiments conducted with the buried bag technique for corn–soybean production systems in the Midwestern US [25,38]. Therefore, an annual N mineralization of 88 kg ha−1 for soybean and an additional 45 kg ha−1 for corn (mineralization from leftover soybean residues) were used to calculate the N budget in this study [25,39]. Values of atmospheric N deposition were obtained from the National Atmospheric Deposition Program/National Trend Network (NADP/NTN) website for Bondville, IL.
2.3. Different N Outputs
Different N outputs used for calculating the N balance were uptake of N by plants (grains + stover), denitrification losses, and ammonia (NH3) volatilization losses. Surface runoff and subsurface leaching were not included as N outputs since we developed relationships between N remained in the soil and runoff/leaching for better understanding of the N dynamics at this watershed. Data for corn and soybean yields for the entire study period was collected from our personal communication with the landowners of that watershed. Nitrogen uptakes in plant grains were obtained from multiplying the grain yield (kg ha−1) with grain N concentration, which was 5.38% and 1.52% for soybean and corn, respectively. Nitrogen concentration in grains was calculated using an average grain protein concentration of 33.6% and 9.5% for soybean and corn, respectively [40].
Tipping bucket rain gauges equipped with data loggers were installed at each subsurface station to get the precipitation data. Station B (adjacent to station A) did not have any rain gauge installed and shared the same rain gauge with station A. Runoff and subsurface drain water were collected after each rainfall event. Total N loads in the subsurface water were calculated using the computed flow volume and measured concentration of N [34]. Subsurface leaching was monitored continuously by using 8-in Palmer-Bowlus flumes for all stations. Water samples were automatically collected by pump samplers activated by the data logger at specific flow volumes. Nitrogen loads of the collected samples were computed by multiplying the concentration with half flow volume from previous concentration measurement plus half flow volume from following concentration measurement. Surface runoff stations were made in conjunction with the subsurface stations. Flumes, stage recorders, and data loggers were used to monitor the surface monitoring stations. For NO3-N analysis, water samples were collected in the field, preserved with concentrated H2SO4, and stored at 4 °C until the analysis was done. Nitrite ion (nitrate reduced to nitrite by an alkaline solution) was measured colorimetrically at 520 nm. The detection limit for NO3-N was 0.07 mg L−1. Nitrogen loads for each sampling period were summed to give the total annual loads. Mass loads for each station were calculated by dividing the N loads by the station area and reported per ha (kg ha−1).
Measuring gaseous N loss from soil profile is a cumbersome job, specifically for a larger watershed area. Denitrification loss of N from agricultural soil of the Vermilion River Watershed was reported about 6 kg ha−1 y−1 in a 5-year study period [41]. However, in a modeling study conducted by David et al. [42] it was found that the average denitrification loss (using five models such as SWAT, DAYCENT, DRAINMOD-N II, DNDC82a, and DNDC82h) was about 12 kg ha−1 y−1. Average annual field denitrification for a 2-year study period was also reported as about 14 kg ha−1 y−1 in another study at east-central Illinois [39]. Another study conducted in east-central Illinois by Smith et al. [43] reported the annual nitrous oxide emission was 2.2–7.7 kg N ha−1 for corn–corn–soybean crop rotations. We used an average value of 10 kg ha−1 y−1 N loss through denitrification for this study. Nitrogen loss through NH3 volatilization is very common in the Midwest US, specifically for row crop production, where N is mainly applied in the form of urea and liquid UAN. Ammonia (NH3-N) volatilization loss was not measured from our field plots, but studies conducted in row crop productions in the US observed NH3-N volatilization in the range of 3–4 kg ha−1 y−1 [1,44]. Therefore, we used a value of 3 kg ha−1 annual NH3-N loss for this experiment.
2.4. Estimation of Agricultural N Budget and N Use Efficiency (NUE)
Individual N input and output components were combined to get total N input and output, respectively, for this 10-year study period. Estimated total N inputs and outputs for the LVR watershed and collected data from other studies were incorporated to develop the overall agricultural N budget. Annual agricultural N budget for each site of the watershed was estimated by using the following formula.
where, ANB is the agricultural N budget (kg ha−1) is the result of subtraction of different N inputs (kg ha−1) such as fertilizer application (FA), soil mineralization (SM), and atmospheric deposition (AD) from different N outputs (kg ha−1) such as plant N uptake (PNU), soil denitrification (SD), and volatilization losses (V).
ANB = Ʃ(FA, SM, AD) − Ʃ(PNU, SD, V)
Nitrogen use efficiency (NUE) for each site was calculated using the formula below:
Average 10-year N inputs and outputs were estimated to develop an overall agricultural N budget for the entire watershed. We understand that some uncertainties may remain while developing the N budget since few data about N inputs and outputs used in this experiment were collected from other research studies. However, agroclimatic conditions and other parameters (location, soil type, crop type, drainage conditions) of other research studies were similar to our study and therefore, we assume the data variation is negligible. Statistical analyses (regression) were done using SAS 9.4 (SAS Institute, Cary, NC, USA) software.
3. Results and Discussion
3.1. Annual and Monthly N Loss from Surface Stations
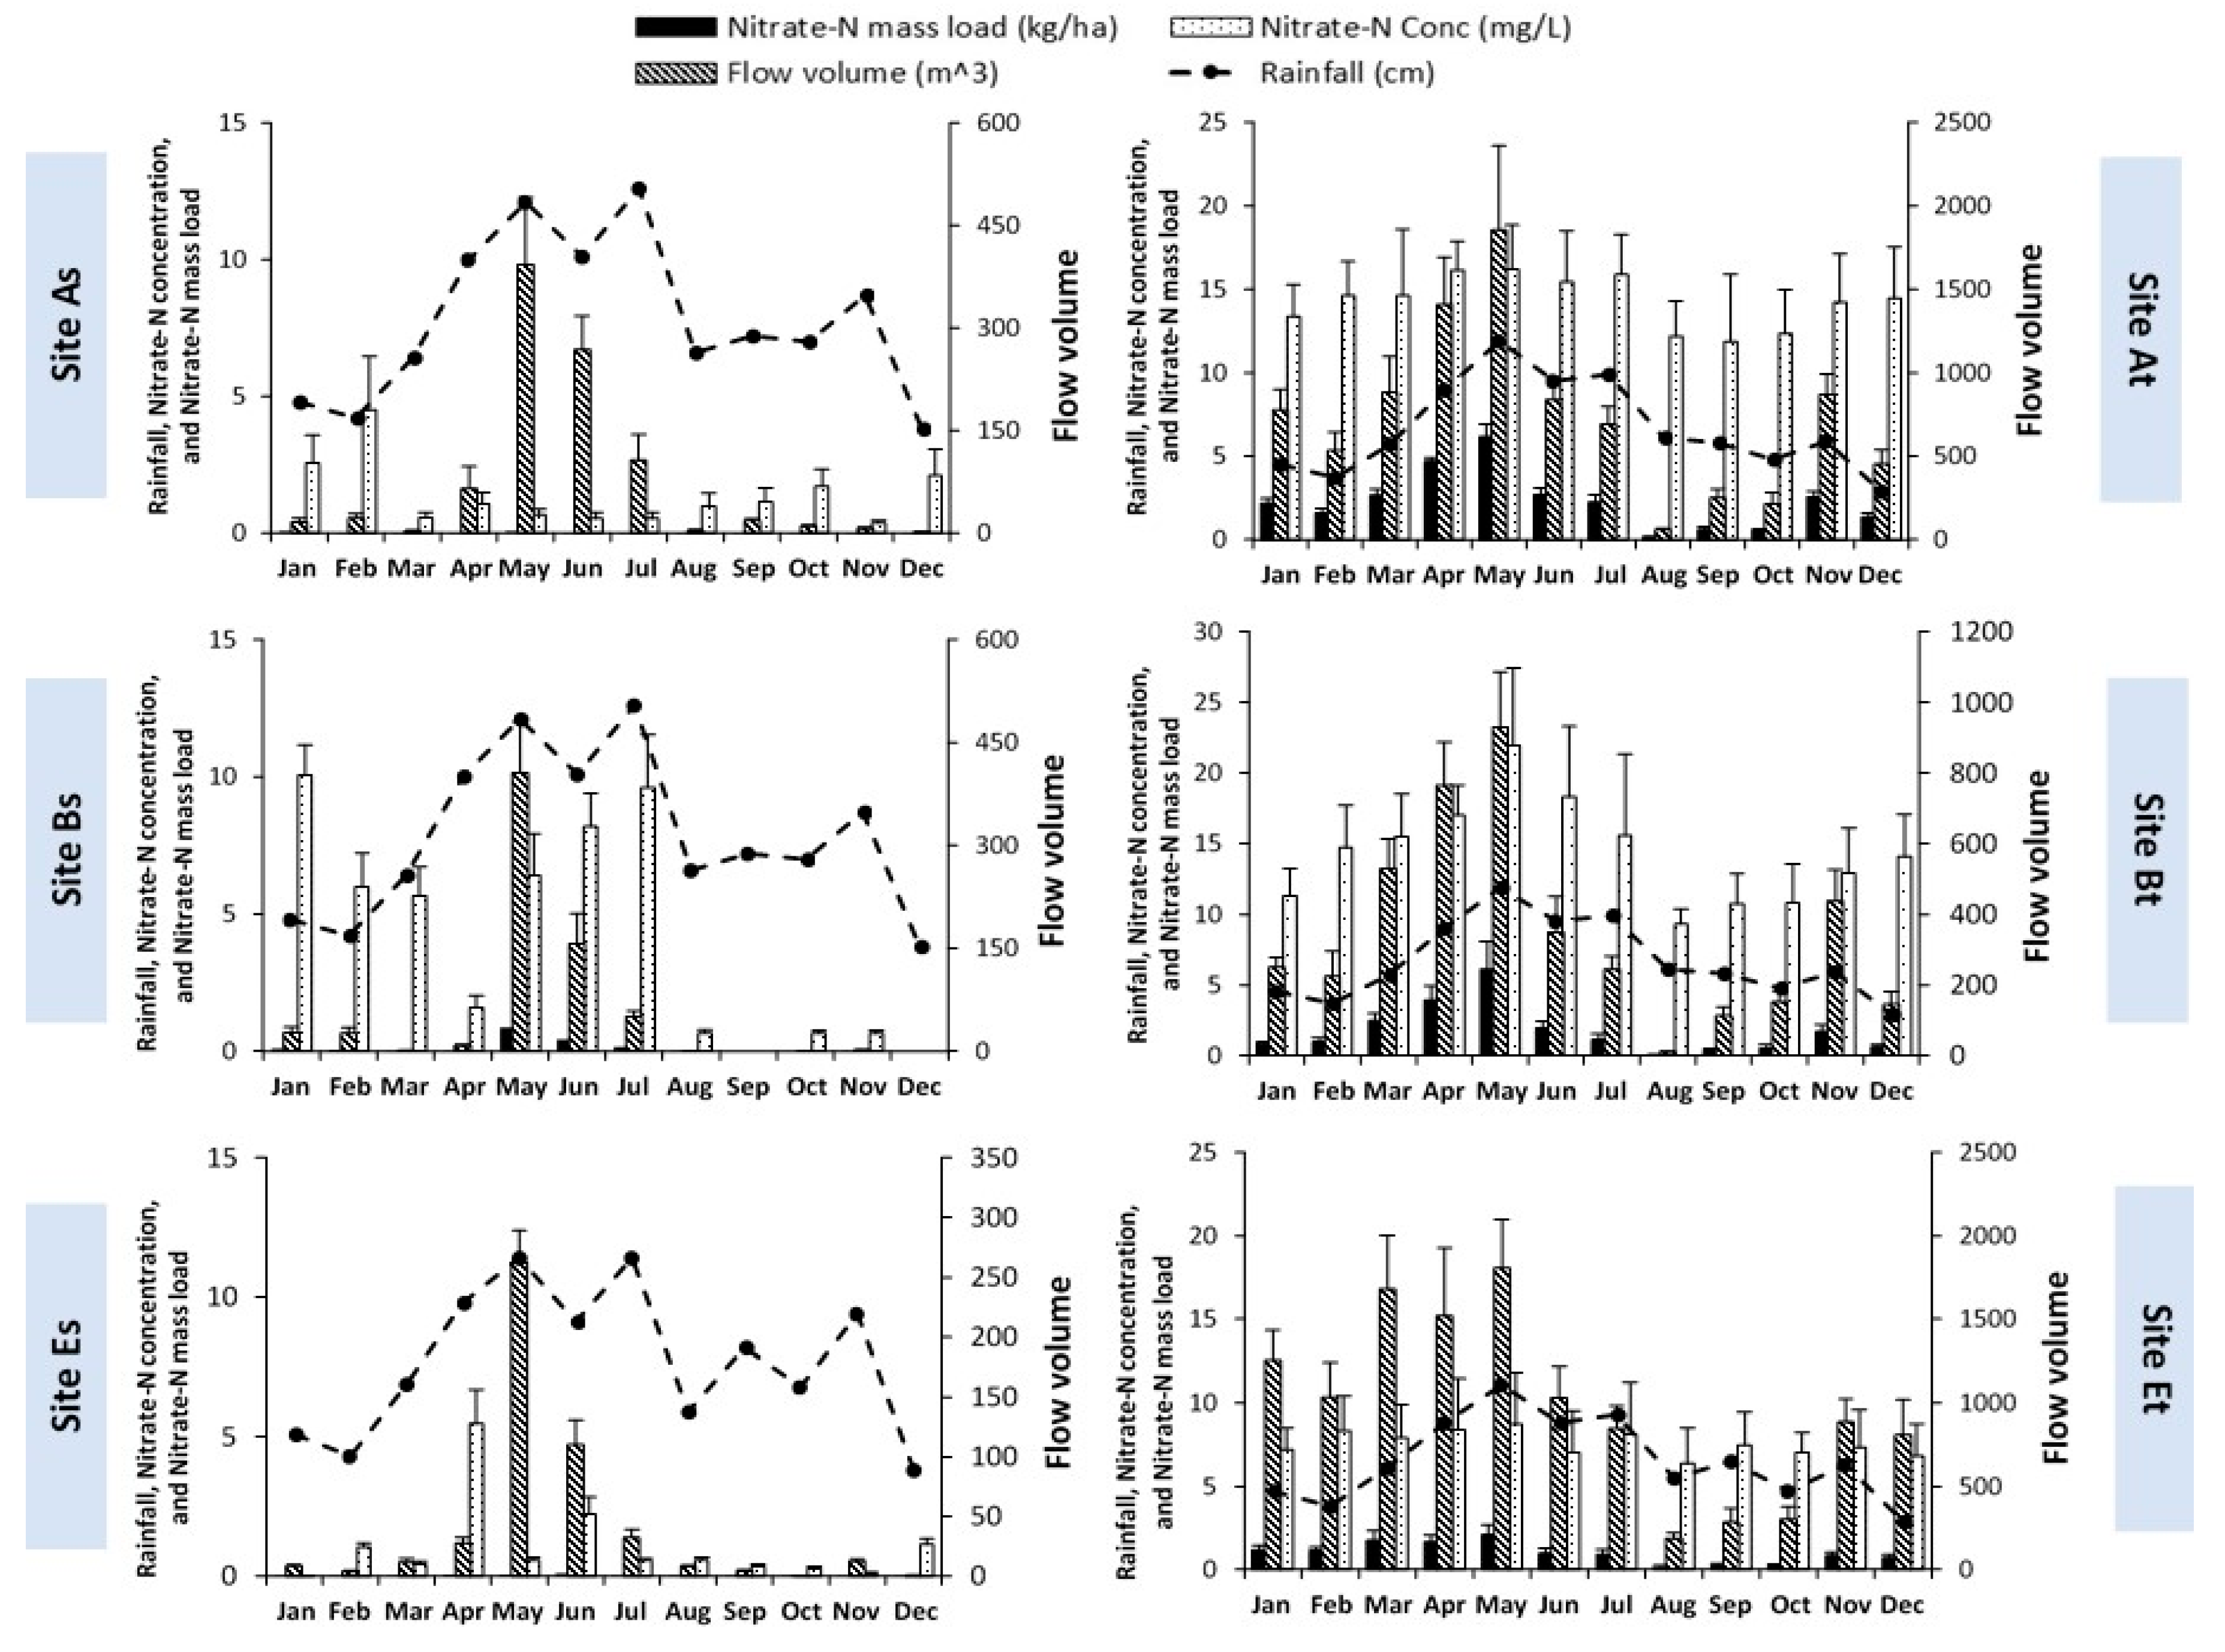
The average rainfall of Danville (Vermilion county), Illinois was 1040 mm y−1 [35] and the rainfall distribution was highly variable for the entire watershed. Highest rainfall was received during year 3 and year 8 for all three sites (Figure 2 and Figure 3). Monthly average rainfall was highest during crop growing season (April, May, June, and July) and was lowest during dormant season (December, January, and February). Maximum amount of rainfall was received during May (average 119 mm) and July (average 122 mm) (Figure 4).
Surface runoff from all three stations (As, Bs, and Es) of this watershed accounted for only a small fraction of the overall flow. Note that surface runoff data was not available in years 1 and 2 and all surface stations were not fully operational in year 3 (Figure 2). Surface runoff was much lower than subsurface flow due to the nearly flat topography (<1% slope) of the watershed. About 2.4% of the total precipitation was removed by surface runoff. Average surface runoff was highest at station Bs (24.3 mm y−1), followed by station Es (21.6 mm y−1), and as (16.9 mm y−1), respectively. Surface runoff volume was highest from May to July due to high rainfall intensity, which allowed relatively less time for the rainwater to infiltrate into the soil profile.
Nitrate-N loss through surface runoff only accounts for 0.14–1.22% of the total N applied at the watershed. Annual NO3-N loss through surface runoff from stations As, Bs, and Es were 0.18, 1.74, and 0.26 kg ha−1, respectively. Flow weighted NO3-N concentrations (not presented) in surface stations (ranged from 1.45 to 5.23 mg L−1) have never exceeded the MCL (10 mg L−1) outlined by the United States Environmental Protection Agency [14]. Greater NO3-N concentrations in surface waters were found in year 9 and year 10 for all three stations. Monthly variation in N concentration was more apparent in surface stations than subsurface stations. No significant relationship (p > 0.05) was found between fertilizer application and surface N concentrations for the entire watershed.
3.2. Annual and Monthly N Loss from Subsurface Stations
About 18% of the total rainfall was removed by subsurface drainage over the entire watershed (Figure 3). This estimate compares well to that estimated by Bakhsh et al. [45] in Iowa, where they found average subsurface flow was 20% of the total rainfall in a 6-year study. Jaynes et al. [46] also reported that subsurface flow removes about 30% of the total precipitation from a field with flat topography in Iowa. A recent study in Ohio, USA, King et al. [28] found that tile drainage can remove 24–54% of the average annual precipitation for corn–soybean crop rotation studies (8-year study period). Subsurface flow volume was found higher from April to June for all three sites due to maximum rainfall, low plant uptake, and low evapotranspiration during that period (Figure 4). Highest NO3-N leaching from stations At and Et were observed during year 3 and year 5 (corn was planted) and from station Bt during year 4 and year 8 (corn was planted). It clearly indicates that N accumulated (N credits) during corn production years provided a substantial amount of NO3-N to leach down from the soil profile. Average NO3-N loss through subsurface leaching from stations At, Bt, and Et were 26.2%, 19.6%, and 16.2% of the applied N, respectively. Long-term average annual NO3-N losses from stations At, Bt, and Et were 30, 22.5, and 13 kg ha−1, respectively, which compares well to other long-term corn–soybean crop rotation studies conducted in the Midwest US such as 5–32 kg ha−1 in Iowa [45], 15–38 kg ha−1 in Indiana [47], 7–18.8 kg ha−1 in Ohio [28], 24–41 kg ha−1 in Michigan [48], and 30–75 kg ha−1 in Minnesota [49].
Subsurface monitoring stations for all three sites were not fully operational during the first two years of this study. Nitrate-N concentration in subsurface water at station At was highest (not statistically significant at p > 0.05) during year 9 (21.0 mg L−1) followed by year 2 (18.3 mg L−1) and year 6 (17.9 mg L−1). However, annual subsurface NO3-N losses were highest during year 3 (72.6 kg ha−1) followed by year 6 (49.2 kg ha−1) and year 2 (37.3 kg ha−1) (Figure 3) possibly because about 20% higher rainfall that resulted in the highest subsurface drainage flow (515 mm) during year 3. Subsurface NO3-N concentration at station Bt was highest during year 6 (24.0 mg L−1) followed by year 8 (19.6 mg L−1) and year 5 (18.6 mg L−1). However, similar to station At the greatest annual NO3-N loss in subsurface flow was observed in year 8 (49.2 kg ha−1) because of high precipitation during the early months of planting, which possibly washed out NO3-N from the soil profile that was accumulated from the previous year. Peak NO3-N concentration was found at the early stages of plant growth during the months of high rainfall and low at the advanced stage of plant growth during late summer. Annual NO3-N concentration in subsurface water for station Et was significantly (p < 0.05) lower than At and Bt and less variation in monthly NO3-N concentrations were found at this station. Subsurface NO3-N concentration was highest in year 6 (9.9 mg L−1) at this station. Our result indicates that higher NO3-N concentrations in subsurface water may not have necessarily caused higher N loss (kg ha−1) from the soil profile. Therefore, we did regression analyses between flow volume (m3 d−1) and NO3-N load (kg ha−1 d−1) in subsurface water for all three sites (Figure 2 and Figure 3). We found a strong positive regression (R2 = 0.84–0.86; p < 0.05) between these two variables suggesting that higher flow volumes contributed to more NO3-N loss to the groundwater through leaching. Bakhsh et al. [45] also found a high positive correlation (R2 = 0.89) between NO3-N loss and subsurface flow from a study in Iowa.
The average annual flow weighted NO3-N concentration in subsurface water of stations At and Bt were 15 and 16.5 mg L−1, respectively, which was greater than the drinking water standards (10 mg L−1). In some subsurface water samples at station Bt, the NO3-N concentration was found as high as 36.5 mg L−1, which is more than three times higher than the drinking water standard. Interestingly, annual NO3-N concentrations for station At were always higher than the MCL value except in year 4 (8.5 mg L−1) when soybean was planted and the lowest N balance (−56 kg ha−1 y−1) was estimated (Table 2). However, annual subsurface NO3-N concentrations (average 6.9 mg L−1) at station Et were lower than MCL standards for all years possibly because this station received about 23–27% lower N than the other two sites (sites A and B) for this study.
3.3. Estimated Nitrogen Budget of the Watershed
An agricultural N budget is often developed for precision farming and better management schemes. Calculated N input-output data combined with collected data from other studies were incorporated to estimate the agricultural N budget for all three sites (sites A, B, and E) of the LVR watershed (Table 2). The N budget for the LVR watershed can help us identify the key factors influencing variability in subsurface N transport for different sites. We found that fertilizer application and mineralization were the major N inputs for corn and soybean, respectively, for all three sites. The total amounts of N applied for corn were 1079, 1019, and 788 kg for sites A, B, and E, respectively. Average yearly N applied for corn and soybean were 192 ± 30 and 13 ± 6 kg ha−1, respectively, which compare well with the data reported from other agricultural fields (corn–soybean rotations) in the Midwestern US [28,50]. Site A received almost uniform N application rates (ranged from 202 to 224 kg ha−1 y−1) for corn and the fertilizers were applied just before sowing. Nitrogen was not applied for soybean production in site A except for year 8 and year 10 when an average of 34 ± 4 kg N ha−1 was applied during planting. However, N was applied every year of soybean production (average 27 ± 9 kg ha−1) at site B and mostly applied after corn harvesting in the previous year. Corn received N (168 to 254 kg ha−1 y−1) just before sowing at this site. Site E has received the lowest average annual fertilizer application rates for corn (158 ± 27 kg N ha−1) compared to that for site A (216 ± 9 kg N ha−1) and site B (204 ± 41 kg N ha−1). Overall, the largest N input for soybean was soil mineralization, estimated as 88 kg ha−1 for all three sites. Rate of atmospheric deposition ranged from 3 to 6 kg ha−1 for the entire watershed.
Major N output (about 89–96% of the total) was N uptake by plants (in grains and stover) both for corn and soybean with an average of 223 and 125 kg ha−1 y−1, respectively. Annual denitrification and ammonia volatilization N losses were 10 and 3 kg ha−1, respectively, for both crops in this 10-year study period. In a tile drained watershed in Illinois, Mehnert et al. [51] estimated that N denitrification in shallow groundwater ranged from 0.3% to 6.4% of the total N applied for seed corn and soybean productions. However, artificially flooded (more than five days) or waterlogged Drummer soils of east-central Illinois could lose up to 50% of the applied N through denitrification during flooding days [39].
After considering all N inputs and outputs, we estimated the N budget for individual sites and an overall agricultural N budget for the entire watershed (Table 2). Nitrogen balance at site A ranged from +83 to +136 kg ha−1 y−1 (average +106 kg ha−1 y−1) for corn and −58 to +5 kg ha−1 y−1 (average −34 kg ha−1 y−1) for soybean. Total N budget (including all inputs and outputs) for site A was 363 kg ha−1 for this 10-year study period (an average of > 36 kg ha−1 each year). The average N remained at this site was even 8.3% higher than the average N applied (33.5 kg ha−1 y−1) for soybean in the last two years. The result indicates that soybean production used most of the soil mineralized N and some residual inorganic N from soil whereas, corn production added extra N in the soil. We also calculated that overall N fixation in soybean (mineralization) was 30% less than total N uptake resulting in negative N balances during soybean years. However, it should be noted that a soybean crop often credits N for corn production in the following year [39,52] for multi-year crop rotation studies. We also found that fertilizer application rates for corn production at sites A and B of the LVR watershed were about 15–22% higher than the average N application rates in Illinois (during the same study period), which suggest that judicious N application protocol was not followed in this watershed and a better management planning needs to be implemented. Field N balance for site B ranged from +54 to +114 kg ha−1 y−1 (average +81 kg ha−1 y−1) for corn and −40 to +5 kg ha−1 y−1 (average −21 kg ha−1 y−1) for soybean. The overall N budget (per ha) for 10-year study period at this site was 300 kg with an average of 30 kg ha−1 y−1. Site E received a total (for 10 years) of 867 kg N (30–37% lower than the other two sites) for this study which resulted in lowest positive N balance at this site. Nitrogen balance at site E ranged from +39 to +148 kg ha−1 y−1 (average +91 kg ha−1 y−1) for corn and −63 to −25 kg ha−1 y−1 (average −41 kg ha−1 y−1) for soybean.
Overall N balance for corn ranged from +39 to +148 kg ha−1 y−1 (average +93 kg ha−1 y−1) and soybean ranged from –63 to +5 kg ha−1 y−1 (average −32 kg ha−1 y−1) for the entire watershed. In a study conducted at Mississippi River Basin (MRB), USA, Blesh and Drinkwater [53] interviewed 95 grain farmers from Iowa, Ohio, Minnesota, and Wisconsin and calculated a 5-year N balance ranged from as high as +149 kg ha−1 y−1 to as low as –80 kg ha−1 y−1 depending on N sources and crop rotations.
We estimated that average corn grain yield (assuming 1.52% grain N concentration) would need to be 25–31% higher to remove the additional N of the watershed and to increase the overall N use efficiency (NUE) by 28%. However, N credits can also vary with soil types, rainfall pattern, N application and timing, land management, and other environmental factors [50,54,55]. Randall et al. [56,57] found that split application of N and nitrification inhibitor (nitrapyrin) can significantly increase crop yield even during excessive rainfall years and reduce 13–18% NO3-N loss through leaching. Although no nitrification inhibitor or slow-release N fertilizers were used for this study, we found that the farmers did some N management (such as split application of fertilizer) at sites B and E (mostly after year 6) which reduced the fertilizer application rate almost by 40% to obtain the same grain yield. Average NUE increased more than 12% from year 6 at sites B and E. We also found that the overall agricultural N budget for corn and soybean productions were negatively correlated (R2 = 0.49 and 0.46 for corn and soybean, respectively) with the rainfall amount. The results indicate that higher rainfall events have caused maximum soil N loss through runoff or leaching and reduced the calculated N inputs compared to other years.
3.4. Nitrogen Balance and Transfer to Water System
This section evaluates the factors affecting the N budget and their transport in drainage water systems. We developed relationships between annual N balances and NO3-N loss from soil profile (leaching and runoff) for all three sites for this 10-year study period. As mentioned earlier, surface runoff (kg ha−1 y−1) was negligible compared to subsurface leaching and overall NO3-N loss through surface runoff was 40 times lower than NO3-N leaching loss. Highest NO3-N losses through surface runoff occurred during corn productions in year 6 (5.4 kg ha−1) and year 8 (3.74 kg ha−1) at station Bs, which corresponds to a maximum amount of rainfall (27% higher than the average) that was received during those two years. Subsurface drains were reported to increase NO3-N transport by flushing water out of the soil matrix, and decrease runoff by preferential flow [58,59]. We had no data for NO3-N loss (leaching + runoff) for first the two years and last year (year 1, year 2, and year 10) of the experiment, so the estimations were made based on seven years of the available data (year 3 to year 9) for all three sites. However, we used the yearly average NO3-N loss for year 3 to year 7 and then a total of 10-year total N loss was calculated (with an assumption of the same range of NO3-N loss during those three years). The average annual NO3-N losses from sites A, B, and E were 34, 27, and 17 kg ha−1, respectively, about 3–7 times higher than the average NO3-N loss (5.13 kg ha−1 y−1) for Illinois in 1997–2011 period [26]. For site A (considering stations As and At), total NO3-N loss from soil profile was 344 kg ha−1 which was about 95% of the N remained in site A (+363 kg ha−1). A similar trend was found in site B where a total of 271 kg ha−1 N was lost from the soil profile through runoff and leaching (about 90% of the N remained in site B). However, about 70% (175 kg N ha−1) of the remaining soil N was lost through runoff and leaching from site E.
Statistical analyses (not presented) showed that individual effects of site, crop type, and water discharge on NO3-N concentrations in surface and subsurface stations were significant (p < 0.05). Concentrations of NO3-N increased during late winter (Dec–Jan) and spring (March–June) each year specifically because of high rainfall immediately after fertilizer application. However, NO3-N concentrations were low from August to October. This might have been due to depletion of NO3-N from soil profile during crop growing season and heavy summer rainfall every year. High NO3-N leaching during heavy rainfall and crop growing season has been reported in previous studies [28,33].
If we consider the average (from all three sites) N remained (balance) as 33 ± 7 kg ha−1 y−1 and average NO3-N loss (runoff and leaching) as 26 ± 8 kg ha−1 y−1, then the estimate of total N balance and loss for the LVR watershed (489 km2) would be 1613 and 1286 Mg y−1, respectively. These results indicate that an average of about 80% of the remaining N at the LVR watershed was lost from the soil profile through runoff and leaching. Soils at sites A and B were Drummer silty clay loam and site E were Sabina and Xenia silt loam (Table 1), considered moderately to poorly drained soils (low vertical hydraulic conductivity). Since these soils can remove 80% of the remaining N from the profile, it is highly likely that a highly drained soil at any other location would leach much more NO3-N in the groundwater (if we have positive N balance in the field) with concentration exceeding the MCL. On an average, Illinois and Iowa accounts for 35% of the total N load (nitrate, ammonium, dissolved organic N, and particulate organic N) discharged into the Gulf of Mexico [60]. (David and Gentry [61] estimated that Illinois annually contributes 15% of the total N loads in the Mississippi River.
Therefore, a viable issue would be how to reduce the N loss from soil profile on a long-term basis. Agricultural N budgets developed at different watersheds [62,63,64,65] suggested following the best management practices (BMPs) including a judicious application of N fertilizer for row crop productions. Our study showed that over-application of N fertilizer was the major problem for NO3-N contamination in subsurface drainage. Compared to the Illinois recommended N application rates [19] for this 10-year study period, our results suggest an average of 15–22% higher N was applied at the LVR watershed. Land management, specifically time of fertilizer application was also an important component to consider. Most fertilizers in sites A and B were applied just before planting (late May to early July) when we received the most amount of rainfall of the year. Therefore, it is most likely that a significant amount of fertilizers has been washed off because of high rainfall immediately after N application. A recent report indicates that the implication of Four Rs (the right source, at the right rate, at the right time, and in the right place), maximum return to nitrogen (MRTN), drainage water management strategies, and use of bioreactors in Illinois have resulted in better management of N loss from agricultural fields [66]. The area in Illinois under cover crop, split-application of N (pre-plant and side-dress), and reduced tillage have increased by 122%, 27%, and 8%, respectively, from 2011 to 2015 [66]. In another study conducted at Mississippi River Basin, Kladivko et al. [67] found that cover crop has the potential to reduce 20% NO3-N loadings to the Mississippi River.
3.5. Effect of Crop Yield on N Budget of the Watershed
Annual corn and soybean grain yields (kg ha−1) for all three sites are presented in Table 3. It was observed that annual corn yield (range: 7278–12,046 kg ha−1 and average: 10,284 kg ha−1) and soybean yield (range: 2510–3576 kg ha−1 and average: 3088 kg ha−1) were highly variable among sites for this watershed. About 22% lower soybean yield (compared to the average yield) was obtained during years 5 and 6 from sites B and E, respectively, due to hail damages on those years. The average corn yield was highest at site B (11,340 kg ha−1 y−1) followed by site A (10,741 kg ha−1 y−1) and site E (8771 kg ha−1 y−1). Overall, site E had significantly (p < 0.05) lower corn grain yield because this site received 30–37% lower N than the other two sites of the LVR watershed. Sites A and B, which were located close to each other, had similar soil type (Drummer and Flanagan silty clay loam), similar soil management (reduced tillage), received the same amount of annual rainfall, and the same average annual N application rate, yet site B produced an average of 600 kg ha−1 higher corn grain yield every year. Management of fertilizer application possibly played an important role for yield differences in sites A and B. Site B received a split application of N (mostly during planting and rest after soybean harvesting), whereas, at site A, fertilizer N was only applied during planting. Studies reported that split application of N can significantly increase corn yield and improve NUE [45,56,68]. However, the average soybean grain yield for all three sites was not significantly different from each other. We did not find any significant correlation (p > 0.05) between crop grain yield and annual rainfall. Corn yield, however, in year 3 at site A was highest (12,046 kg ha−1), and was correlated to the highest rainfall (1244 mm). Similarly, corn yield in year 6 at site B was much higher (11,707 kg ha−1) and was also correlated to high rainfall (1006 mm). The lowest corn yield at site A was obtained in year 5 (9787 kg ha−1) when rainfall was the lowest (743 mm). Our results emphasized that rainfall can directly influence the grain yield of corn and soybean. Previous studies reported that low rainfall during critical crop growth stages resulted in water stress and subsequently reduced the yield [69,70]. A recent study by Huang et al. [71] reported that precipitation increased 2–4% corn yield, and more effectively during pollination months of the growing period.
We also found that years with higher grain yield have resulted in lower N credits at the LVR watershed. Individually, sites A and E showed a strong negative correlation (R2 for sites A and E were 0.79 and 0.95, respectively) between corn yield and N balance for this watershed. Overall, we found a moderately negative correlation (R2 = 0.43) between yield and N balance for soybean years (average of all three sites). Since NO3-N concentrations from subsurface stations of the LVR watershed exceeded MCL for most of the years, it is expected that increase in crop yield (with proper soil and N application management) would reduce N credits and subsequently N leaching to the groundwater.
4. Conclusions
This long-term (10 years) field research has provided a useful understanding of N balance and transfer from three LVR watershed sites, Illinois, USA. Our estimated N budgets indicate that total N inputs were much higher than total N outputs; an over-application of N fertilizer played a significant role in the positive N balance in the entire watershed. Crop rotation of soybean after corn perhaps enabled to use most of the applied N from the soil, however, corn production added extra N in the soil. About 80% of the remaining N was lost from the soil profile mostly through subsurface drainage. Runoff N loss was negligible because of the flat topography, but NO3-N concentrations in subsurface water samples exceeded the MCL in more than 70% of samples. Flow volume was highly correlated with N leaching loss from the soil profile. Maximum NO3-N loads (kg ha−1) were observed during late Spring (March to June) specifically because of higher rainfall after fertilizer was applied. Lower flow volume from August to October has resulted in 9–12 times lower NO3-N loads in the subsurface water than in the late spring season. Our results suggest that better N management planning needs to be implemented to reduce NO3-N contamination in flow through tile drainage at this watershed. One possible change in the management practices may be to lower the fertilizer application rates for corn productions, reducing crop production costs for the landowners. Other possible BMPs may include precision agricultural practices, utilizing the soil N for increasing corn grain yield with high yielding varieties, split application of N in fall and summer, and proper timing of N application. These practices could possibly compensate for the positive N balance of this watershed. The results emphasize that crop, soil, and land management factors can play significant roles in the agricultural N budget, even for sites situated close to each other in the same watershed.
Author Contributions
Major concept, Major writing, Analysis and presentation of the data: S.D.; Conceptualization, Supervise, Editing and writing, Acquired funding: P.K.K.; Statistical analyses, Data processing, Proofreading and writing: S.C.; Experimental data collection, Laboratory analyses, Editing, and writing: A.S.A.; Editing and proofreading: B.S.S. All authors have read and agreed to the published version of the manuscript.
Funding
This research was funded by USDA-NIFA, USDA-NRCS, and UIUC-CFAR.
Conflicts of Interest
The authors declare no conflict of interest.
References
- Dattamudi, S.; Wang, J.J.; Dodla, S.K.; Arceneaux, A.; Viator, H.P. Effect of nitrogen fertilization and residue management practices on ammonia emissions from subtropical sugarcane production. Atmos. Environ. 2016, 139, 122–130. [Google Scholar] [CrossRef] [Green Version]
- Dattamudi, S.; Wang, J.J.; Dodla, S.K.; Viator, H.P.; DeLaune, R.; Hiscox, A.; Darapuneni, M.; Jeong, C.; Colyer, P. Greenhouse Gas Emissions as Influenced by Nitrogen Fertilization and Harvest Residue Management in Sugarcane Production. Agrosyst. Geosci. Environ. 2019, 2, 1–10. [Google Scholar] [CrossRef] [Green Version]
- Giles, M.E.; Morley, N.J.; Baggs, E.M.; Daniell, T.J. Soil nitrate reducing processes–drivers, mechanisms for spatial variation, and significance for nitrous oxide production. Front. Microbial. 2012, 3, 407. [Google Scholar] [CrossRef] [Green Version]
- Huang, T.; Ju, X.; Yang, H. Nitrate leaching in a winter wheat-summer maize rotation on a calcareous soil as affected by nitrogen and straw management. Sci. Rep. 2017, 7, 1–11. [Google Scholar]
- Suárez, S.P.; Peiffer, S.; Gebauer, G. Origin and fate of nitrate runoff in an agricultural catchment: Haean, South Korea–Comparison of two extremely different monsoon seasons. Sci. Total Environ. 2019, 648, 66–79. [Google Scholar] [CrossRef]
- Carpenter, S.R.; Caraco, N.F.; Correll, D.L.; Howarth, R.W.; Sharply, A.N.; Smith, V.H. Nonpoint pollution of surface waters with phosphorus and nitrogen. Ecol. Appl. 1998, 8, 559–568. [Google Scholar] [CrossRef]
- Davis, D.A.; Mondo, K.; Stern, E.; Annor, A.K.; Murch, S.J.; Coyne, T.M.; Brand, L.E.; Niemeyer, M.E.; Sharp, S.; Bradley, W.G.; et al. Cyanobacterial neurotoxin BMAA and brain pathology in stranded dolphins. PLoS ONE 2019, 14, e0213346. [Google Scholar] [CrossRef]
- Keeney, D.R.; Hatfield, J.L. The nitrogen cycle, historic prospective, and current and potential future concerns. In Nitrogen in the Environment: Sources, Problems, and Management; Follett, R.F., Hatfield, J.L., Eds.; Elsevier: Amsterdam, The Netherlands, 2001; pp. 3–16. [Google Scholar]
- Follett, J.R.; Follett, R.F. Utilization and metabolism of nitrogen by humans. In Nitrogen in the Environment: Sources, Problems, and Management; Follett, R.F., Hatfield, J.L., Eds.; Elsevier: Amsterdam, The Netherlands, 2001; pp. 65–92. [Google Scholar]
- Pohanish, R.P. (Ed.) Sitting’s Handbook of Toxic and Hazardous Chemicals and Carcinogens, 4th ed.; Noyes Publications: Norwich, NY, USA, 2002. [Google Scholar]
- Wolfe, A.H.; Patz, J.A. Reactive nitrogen and human health: Acute and long-term implications. Ambio A J. Hum. Environ. 2002, 31, 120–125. [Google Scholar] [CrossRef]
- Ward, M.H.; Mark, S.D.; Cantor, K.P.; Weisenburger, D.D.; Correa-Villasenor, A.; Zahm, S.H. Drinking water nitrate and the risk of non-Hodgkin’s lymphoma. Epidemiology 1996, 7, 465–471. [Google Scholar] [CrossRef]
- Ward, M.H.; Cerhan, J.R.; Colt, J.S.; Hartge, P. Risk of non-Hodgkin lymphoma and nitrate and nitrite from drinking water and diet. Epidemiology 2006, 17, 375–382. [Google Scholar] [CrossRef]
- USEPA. National Primary Drinking Water Regulations: List of Contaminants and Their MCLs; USEPA#816-F-09-004; United States Environmental Protection Agency, Office of Water (4100T): Washington, DC, USA, 2009; p. 20460. Available online: http://water.epa.gov/drink/contaminants/upload/mcl-2.pdf (accessed on 20 August 2020).
- Kalita, P.K.; Kanwar, R.S. Effect of water-table management practices on transport of nitrate-N to shallow groundwater. Trans. ASAE 1993, 36, 413–422. [Google Scholar] [CrossRef] [Green Version]
- Kladivko, E.J.; Grochulska, J.; Turco, R.F.; Van Scoyoc, G.E.; Eigel, J.D. Pesticide and nitrate transport into subsurface tile drains of different spacings. J. Environ. Qual. 1999, 28, 997–1004. [Google Scholar] [CrossRef]
- USDA National Agricultural Statistics Service (USDA-NASS). Crop Production 2018 Summary. 2019. Available online: https://www.nass.usda.gov/Publications/Todays_Reports/reports/cropan19.pdf (accessed on 2 March 2020).
- USDA Economic Research Service (USDA-ERS). Annual State Agricultural Export. 2020. Available online: https://www.ers.usda.gov/data-products/state-export-data/annual-state-agricultural-exports/ (accessed on 2 April 2020).
- USDA NASS. State Agricultural Overview-Illinois. 2019. Available online: https://www.nass.usda.gov/Quick_Stats/Ag_Overview/stateOverview.php?state=ILLINOIS (accessed on 2 March 2020).
- Scharf, P.C.; Kitchen, N.R.; Sudduth, K.A.; Davis, J.G.; Hubbard, V.C.; Lory, J.A. Field-scale variability in optimal nitrogen fertilizer rate for corn. J. Agron. 2005, 97, 452–461. [Google Scholar] [CrossRef] [Green Version]
- Hong, N.; Scharf, P.C.; Davis, J.G.; Kitchen, N.R.; Sudduth, K.A. Economically optimal nitrogen rate reduces soil residual nitrate. J. Environ. Qual. 2007, 36, 354–362. [Google Scholar] [CrossRef] [Green Version]
- Snyder, C.S. Are Midwest corn farmers over-applying fertilizer N. Better Crops 2012, 96, 3–4. [Google Scholar]
- Wilson, G.L.; Mulla, D.J.; Galzki, J.; Laacouri, A.; Vetsch, J.; Sands, G. Effects of fertilizer timing and variable rate N on nitrate–N losses from a tile drained corn-soybean rotation simulated using DRAINMOD-NII. Precis. Agric. 2020, 21, 311–323. [Google Scholar] [CrossRef]
- USDA Economic Research Service (USDA-ERS). Fertilizer Use and Price. 2019. Available online: https://www.ers.usda.gov/data-products/fertilizer-use-and-price.aspx (accessed on 2 March 2020).
- David, M.B.; Gentry, L.E.; Kovacic, D.A.; Smith, K.M. Nitrogen balance in and export from an agricultural watershed. J. Environ. Qual. 1997, 26, 1038–1048. [Google Scholar] [CrossRef] [Green Version]
- Illinois Environmental Protection Agency (IEPA). Illinois Nutrient Loss Reduction Strategy. 2015. Available online: https://www2.illinois.gov/epa/Documents/iepa/water-quality/watershed-management/nlrs/nlrs-final-revised-083115.pdf (accessed on 2 March 2020).
- Zucker, L.A.; Brown, L.C. Agricultural Drainage: Water Quality Impacts and Subsurface Drainage Studies in the Midwest; University of Minnesota Extension Bulletin; University of Minnesota: St. Paul, MN, USA, 1998; pp. 871–998. [Google Scholar]
- King, K.W.; Williams, M.R.; Fausey, N.R. Effect of crop type and season on nutrient leaching to tile drainage under a corn–soybean rotation. J. Soil Water Conserv. 2016, 71, 56–68. [Google Scholar] [CrossRef]
- Nangia, V.; Gowda, P.H.; Mulla, D.J.; Sands, G.R. Water quality modeling of fertilizer management impacts on nitrate losses in tile drains at the field scale. J. Environ. Qual. 2008, 37, 296–307. [Google Scholar] [CrossRef]
- Jones, C.S.; Nielsen, J.K.; Schilling, K.E.; Weber, L.J. Iowa stream nitrate and the Gulf of Mexico. PLoS ONE 2018, 13, e0195930. [Google Scholar] [CrossRef]
- Illinois Environmental Protection Agency (IEPA). Little Vermilion River/Lake Georgetown Watershed TMDL Report. IEPA/BOW/09-015. 2008. Available online: http://www.epa.state.il.us/water/tmdl/report/little-vermilion/little-vermilion.pdf (accessed on 2 April 2020).
- Algoazany, A.S.; Kalita, P.K.; Czapar, G.F.; Mitchell, J.K. Phosphorus transport through subsurface drainage and surface runoff from a flat watershed in east central Illinois, USA. J. Environ. Qual. 2007, 36, 681–693. [Google Scholar] [CrossRef] [PubMed]
- Kalita, P.K.; Algoazany, A.S.; Mitchell, J.K.; Cooke, R.A.C.; Hirschi, M.C. Subsurface water quality from a flat tile-drained watershed in Illinois, USA. Agric. Ecosyst. Environ. 2006, 115, 183–193. [Google Scholar] [CrossRef]
- Mitchell, J.K.; McIsaac, G.F.; Walker, S.E.; Hirschi, M.C. Nitrate in river and subsurface drainage flows from an east-central Illinois watershed. Trans. ASAE 2000, 43, 337–342. [Google Scholar] [CrossRef]
- Illinois State Climatologist Office. Illinois State Water Survey; Illinois State Climatologist Office: Champaign, IL, USA, 2019; Available online: https://stateclimatologist.web.illinois.edu/data/champaign-urbana/ (accessed on 5 December 2019).
- Northcott, W.J. Modeling Water Quality and Quantity on Tile Drained Watersheds with a GIS Coupled DRAINMOOD. Ph.D. Thesis, Department of Agricultural and Biological Engineering, University of Illinois at Urbana-Champaign, Urbana, IL, USA, 1999. [Google Scholar]
- Mitchell, J.K.; Kalita, P.K.; Hirschi, M.C.; Cooke, R.A.C. Upland drainage-watershed hydrology is different. In Proceedings of the AWRA 2003 Spring Specially Conference Agricultural Hydrology and Water Quality, Kansas City, MO, USA, 12–14 May 2003. [Google Scholar]
- Bundy, L.G.; Andraski, T.W.; Wolkowski, R.P. Nitrogen credits in soybean-corn sequences on three soils. Agron. J. 1993, 85, 1061–1067. [Google Scholar] [CrossRef]
- Gentry, L.E.; David, M.B.; Below, F.E.; Royer, T.V.; McIsaac, G.F. Nitrogen mass balance of a tile-drained agricultural watershed in east-central Illinois. J. Environ. Qual. 2009, 38, 1841–1847. [Google Scholar] [CrossRef] [Green Version]
- University of Illinois. Department of Crop Science Variety Testing. 2019. Available online: http://vt.cropsci.illinois.edu (accessed on 2 April 2019).
- Sogbedji, J.M.; McIsaac, G.F. Evaluation of the ADAPT model for simulating nitrogen dynamics in a tile drained watershed in central Illinois. J. Environ. Qual. 2006, 35, 1914–1923. [Google Scholar] [CrossRef]
- David, M.B.; Del Grosso, S.J.; Hu, X.; Marshall, E.P.; McIsaac, G.F.; Parton, W.J.; Tonitto, C.; Youssef, M.A. Modeling denitrification in a tile-drained, corn and soybean agroecosystem of Illinois, USA. Biogeochemistry 2009, 93, 7–30. [Google Scholar] [CrossRef]
- Smith, C.M.; David, M.B.; Mitchell, C.A.; Masters, M.D.; Anderson-Teixeira, K.J.; Bernacchi, C.J.; DeLucia, E.H. Reduced nitrogen losses after conversion of row crop agriculture to perennial biofuel crops. J. Environ. Qual. 2013, 42, 219–228. [Google Scholar] [CrossRef]
- Wang, J.J.; Dodla, S.K.; Viator, S.; Kongchum, M.; Harrison, S.; Mudi, S.D.; Liu, S.; Tian, Z. Agricultural field management practices and greenhouse gas emissions from Louisiana soils. La. Agril. 2013, 56, 8–9. [Google Scholar]
- Bakhsh, A.; Kanwar, R.S.; Bailey, T.B.; Cambardella, C.A.; Colvin, T.S. Cropping system effects on NO3-N loss with subsurface drainage water. Trans. ASAE 2002, 45, 1789–1797. [Google Scholar] [CrossRef] [Green Version]
- Jaynes, D.B.; Colvin, T.S.; Karlen, C.A.; Cambardella, C.A.; Meek, D.W. Nitrate loss in subsurface drainage as affected by nitrogen fertilizer rate. J. Environ. Qual. 2001, 30, 1305–1314. [Google Scholar] [CrossRef] [PubMed]
- Kladivko, E.J.; Frankenberger, J.R.; Jaynes, D.B.; Meek, D.W.; Jenkinson, B.J.; Fausey, N.R. Nitrate Leaching to Subsurface Drains as Affected by Drain Spacing and Changes in Crop Production System Contribution of the Indiana Agric. Research Programs, Purdue Journal Paper 17,296. J. Environ. Qual. 2004, 33, 1803–1813. [Google Scholar] [CrossRef] [PubMed]
- Syswerda, S.P.; Basso, B.; Hamilton, S.K.; Tausig, J.B.; Robertson, G.P. Long-term nitrate loss along an agricultural intensity gradient in the Upper Midwest USA. Agric. Ecosyst. Environ. 2012, 149, 10–19. [Google Scholar] [CrossRef] [Green Version]
- Ochsner, T.E.; Schumacher, T.W.; Venterea, R.T.; Feyereisen, G.W.; Baker, J.M. Soil water dynamics and nitrate leaching under corn–soybean rotation, continuous corn, and kura clover. Vadose Zone J. 2018, 17, 1–11. [Google Scholar] [CrossRef] [Green Version]
- Pittelkow, C.M.; Clover, M.W.; Hoeft, R.G.; Nafziger, E.D.; Warren, J.J.; Gonzini, L.C.; Greer, K.D. Tile drainage nitrate losses and corn yield response to fall and spring nitrogen management. J. Environ. Qual. 2017, 46, 1057–1064. [Google Scholar] [CrossRef]
- Mehnert, E.; Hwang, H.H.; Johnson, T.M.; Sanford, R.A.; Beaumont, W.C.; Holm, T.R. Denitrification in the shallow ground water of a tile-drained, agricultural watershed. J. Environ. Qual. 2007, 36, 80–90. [Google Scholar] [CrossRef]
- Gentry, L.E.; Below, F.E.; David, M.B.; Bergerou, J.A. Source of thesoybean N credit in maize production. Plant Soil 2001, 236, 175–184. [Google Scholar] [CrossRef]
- Blesh, J.; Drinkwater, L.E. The impact of nitrogen source and crop rotation on nitrogen mass balances in the Mississippi River Basin. Ecol. Appl. 2013, 23, 1017–1035. [Google Scholar] [CrossRef]
- Udawatta, R.P.; Motavalli, P.P.; Garrett, H.E.; Krstansky, J.J. Nitrogen losses in runoff from three adjacent agricultural watersheds with claypan soils. Agric. Ecosyst. Environ. 2006, 117, 39–48. [Google Scholar] [CrossRef]
- Goswami, D.; Kalita, P.K.; Cooke, R.A.; McIsaac, G.F. Nitrate-N loadings through subsurface environment to agricultural drainage ditches in two flat Midwestern (USA) watersheds. Agric. Water Manag. 2009, 96, 1021–1030. [Google Scholar] [CrossRef]
- Randall, G.W.; Vetsch, J.A.; Huffman, J.R. Nitrate losses in subsurface drainage from a corn–soybean rotation as affected by time of nitrogen application and use of nitrapyrin. J. Environ. Qual. 2003, 32, 1764–1772. [Google Scholar] [CrossRef]
- Randall, G.W.; Vetsch, J.A. Nitrate losses in subsurface drainage from a corn–soybean rotation as affected by fall and spring application of nitrogen and nitrapyrin. J. Environ. Qual. 2005, 34, 590–597. [Google Scholar] [CrossRef] [PubMed]
- Grigg, B.C.; Southwick, L.M.; Fouss, J.L.; Kornecki, T.S. Drainage system impacts on surface runoff, nitrate loss, and crop yield on a southern alluvial soil. Trans. ASAE 2003, 46, 1531. [Google Scholar] [CrossRef]
- Burchell II, M.R.; Skaggs, R.W.; Chescheir, G.M.; Gilliam, J.W.; Arnold, L.A. Shallow subsurface drains to reduce nitrate losses from drained agricultural lands. Trans. ASAE 2005, 48, 1079–1089. [Google Scholar] [CrossRef]
- Goolsby, D.A. Mississippi basin nitrogen flux believed to cause Gulf hypoxia. Eos. Trans. AGU 2000, 81, 321–327. [Google Scholar] [CrossRef]
- David, M.B.; Gentry, L.E. Anthropogenic inputs of nitrogen and phosphorus and riverine export for Illinois, USA. J. Environ. Qual. 2000, 29, 494–508. [Google Scholar] [CrossRef]
- Bao, X.; Watanabe, M.; Wang, Q.; Hayashi, S.; Liu, J. Nitrogen budgets of agricultural fields of the Changjiang River basin from 1980 to 1990. Sci. Total Environ. 2006, 363, 136–148. [Google Scholar] [CrossRef]
- Liu, C.; Watanabe, M.; Wang, Q. Changes in nitrogen budgets and nitrogen use efficiency in the agroecosystems of the Changjiang River basin between 1980 and 2000. Nutr. Cycl. Agroecosyst. 2008, 80, 19–37. [Google Scholar] [CrossRef]
- Wang, L.; Zheng, H.; Zhao, H.; Robinson, B.E. Nitrogen balance dynamics during 2000-2010 in the Yangtze River Basin croplands, with special reference to the relative contributions of cropland area and synthetic fertilizer N application rate changes. PLoS ONE 2017, 12, e0180613. [Google Scholar] [CrossRef] [Green Version]
- Hanrahan, B.R.; King, K.W.; Williams, M.R.; Duncan, E.W.; Pease, L.A.; LaBarge, G.A. Nutrient balances influence hydrologic losses of nitrogen and phosphorus across agricultural fields in northwestern Ohio. Nutr. Cycl. Agroecosyst. 2019, 113, 231–245. [Google Scholar] [CrossRef]
- USDA National Agricultural Statistics Service (USDA-NASS). Nutrient Loss Survey Results. 2016. Available online: https://www.nass.usda.gov/Statistics_by_State/Illinois/Publications/Current_News_Release/2016/Nutrient_Loss_Survey_Results.pdf (accessed on 20 March 2020).
- Kladivko, E.J.; Kaspar, T.C.; Jaynes, D.B.; Malone, R.W.; Singer, J.; Morin, X.K.; Searchinger, T. Cover crops in the upper midwestern United States: Potential adoption and reduction of nitrate leaching in the Mississippi River Basin. J. Soil Water Conserv. 2014, 69, 279–291. [Google Scholar] [CrossRef] [Green Version]
- Vetsch, J.A.; Randall, G.W.; Fernández, F.G. Nitrate loss in subsurface drainage from a corn–soybean rotation as affected by nitrogen rate and nitrapyrin. J. Environ. Qual. 2019, 48, 988–994. [Google Scholar] [CrossRef] [Green Version]
- Andresen, J.A.; Alagarswamy, G.; Ritchie, J.T.; Rotz, C.A.; LeBaron, A.W. Assessment of the impact of weather on maize, soybean, and alfalfa production in the Upper Great Lakes Region of the United States, 1895–1996. Agron. J. 2001, 93, 1059–1070. [Google Scholar] [CrossRef] [Green Version]
- Hu, Q.; Buyanovsky, G. Climate effects on corn yield in Missouri. J. Appl. Meteorol. 2003, 42, 1626–1635. [Google Scholar] [CrossRef]
- Huang, C.; Duiker, S.W.; Deng, L.; Fang, C.; Zeng, W. Influence of precipitation on maize yield in the Eastern United States. Sustainability 2015, 7, 5996–6010. [Google Scholar] [CrossRef] [Green Version]
Figure 1.
Schematic diagram of different sites and rainfall monitoring stations in the Little Vermilion River (LVR) Watershed, Illinois, US.
Figure 1.
Schematic diagram of different sites and rainfall monitoring stations in the Little Vermilion River (LVR) Watershed, Illinois, US.

Figure 2.
Analyses of annual rainfall, flow volume, and NO3-N load and regression between annual NO3-N load and flow volume, for all three surface stations (Sites As, Bs, and Es) of the Little Vermilion River (LVR) Watershed, Illinois, US. Value in parenthesis is the rainfall (mm) in that year.
Figure 2.
Analyses of annual rainfall, flow volume, and NO3-N load and regression between annual NO3-N load and flow volume, for all three surface stations (Sites As, Bs, and Es) of the Little Vermilion River (LVR) Watershed, Illinois, US. Value in parenthesis is the rainfall (mm) in that year.

Figure 3.
Analyses of annual rainfall, flow volume, and NO3-N load and regression between annual NO3-N load and flow volume, for all three subsurface stations (Sites At, Bt, and Et) of the Little Vermilion River (LVR) Watershed, Illinois, US. Value in parenthesis is the rainfall (mm) in that year.
Figure 3.
Analyses of annual rainfall, flow volume, and NO3-N load and regression between annual NO3-N load and flow volume, for all three subsurface stations (Sites At, Bt, and Et) of the Little Vermilion River (LVR) Watershed, Illinois, US. Value in parenthesis is the rainfall (mm) in that year.
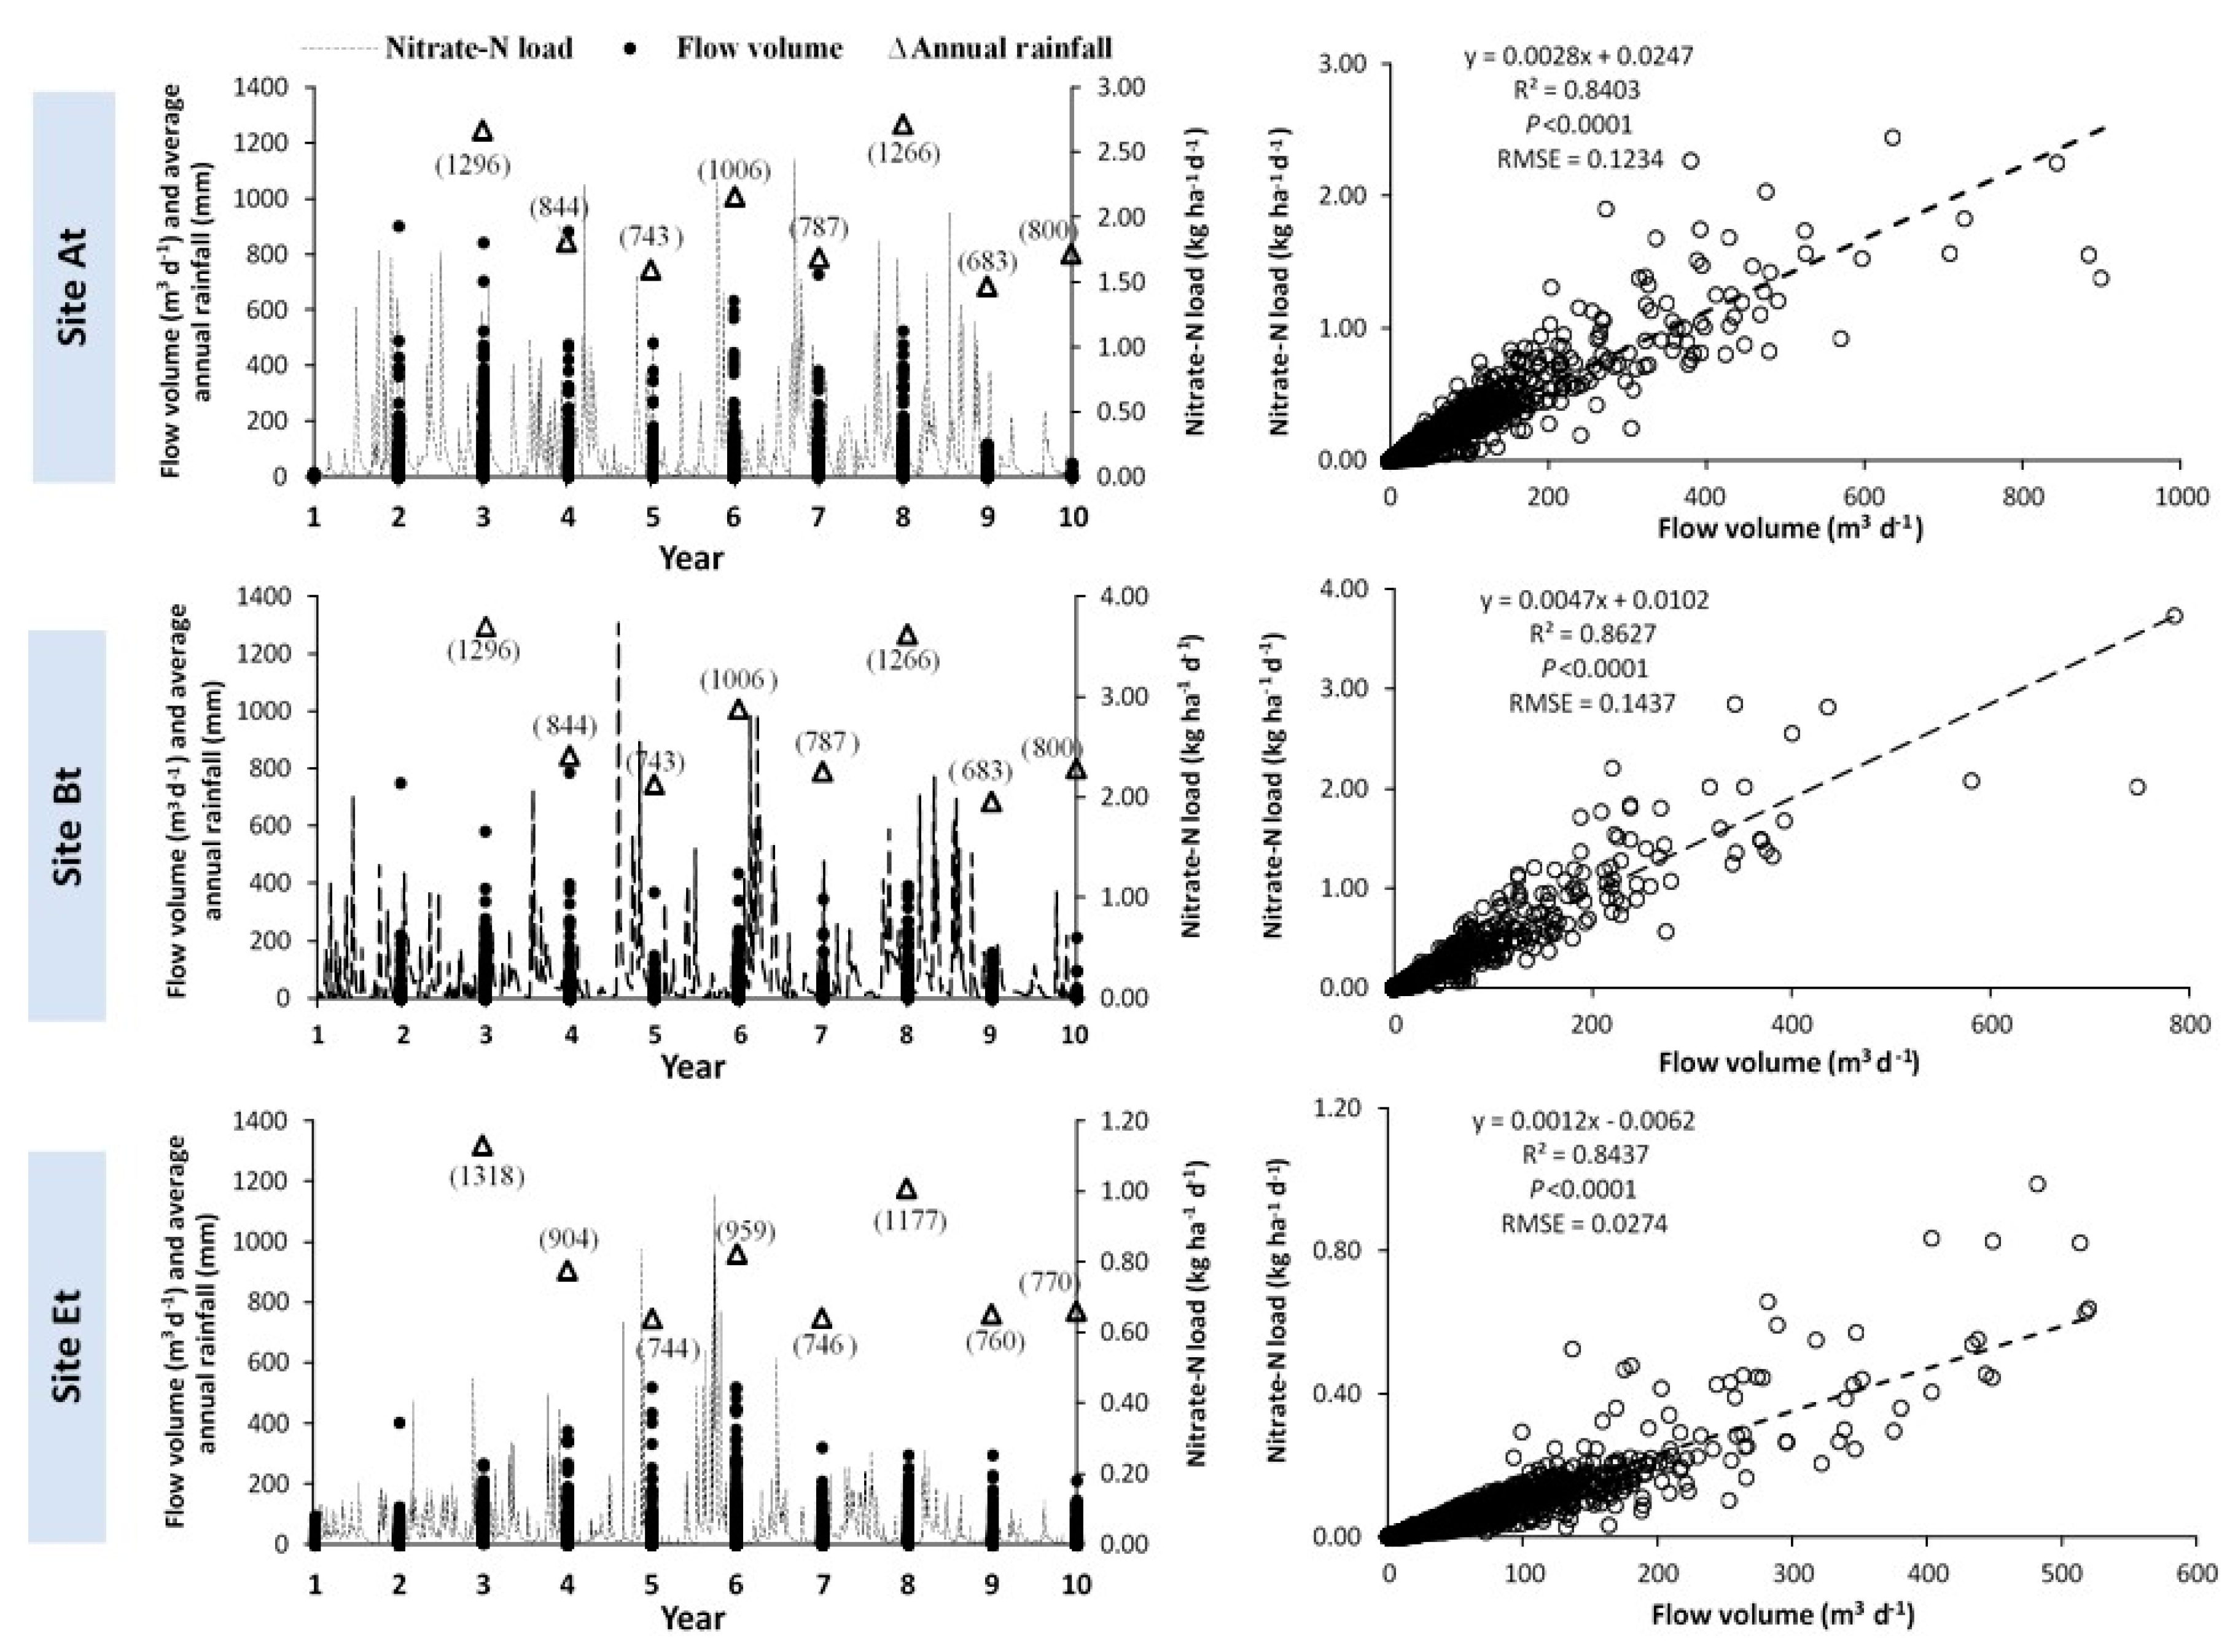
Figure 4.
Long-term (10 years) monthly average of rainfall (mm), flow volume (m3), NO3-N concentration (mg L−1), and NO3-N mass load (kg ha−1) for all three surface (Sites As, Bs, and Es) and subsurface stations (Sites At, Bt, and Et) of the Little Vermilion River (LVR) Watershed, Illinois, US.
Figure 4.
Long-term (10 years) monthly average of rainfall (mm), flow volume (m3), NO3-N concentration (mg L−1), and NO3-N mass load (kg ha−1) for all three surface (Sites As, Bs, and Es) and subsurface stations (Sites At, Bt, and Et) of the Little Vermilion River (LVR) Watershed, Illinois, US.

Table 1.
Characteristics of all three sites (Sites A, B, and E) of the Little Vermilion River (LVR) watershed, Illinois, US.
Table 1.
Characteristics of all three sites (Sites A, B, and E) of the Little Vermilion River (LVR) watershed, Illinois, US.
| Site | Station | Flow Type | Area Drained (ha) | Tillage Practices | Soil Type |
|---|---|---|---|---|---|
| A | As | Surface | 6.00 | Reduced tillage | Drummer silty clay loam and Flanagan silt loam |
| At | Subsurface | 4.86 | |||
| B | Bs | Surface | 3.00 | Reduced tillage | Drummer silty clay loam and Flanagan silt loam |
| Bt | Subsurface | 3.34 | |||
| E | Es | Surface | 2.31 | No-tillage | Sabina and Xenia silt loam |
| Et | Subsurface | 7.56 |
Table 2.
Agricultural N budget (kg N ha−1) with corn–soybean crop rotations for a 10-year study period at all three sites (Sites A, B, and E) of the Little Vermilion River (LVR) watershed, Illinois, US.
Table 2.
Agricultural N budget (kg N ha−1) with corn–soybean crop rotations for a 10-year study period at all three sites (Sites A, B, and E) of the Little Vermilion River (LVR) watershed, Illinois, US.
| Year 1 | Year 2 | Year 3 | Year 4 | Year 5 | Year 6 | Year 7 | Year 8 | Year 9 | Year 10 | |||
|---|---|---|---|---|---|---|---|---|---|---|---|---|
| kg N ha−1 | ||||||||||||
| SITE A | Corn | Soybean | Corn | Soybean | Corn | Soybean | Corn | Soybean | Corn | Soybean | ||
| Inputs | Fertilizer § | 221 | 0 | 220 | 0 | 224 | 0 | 202 | 36 | 212 | 31 | |
| Mineralization ¥ | 133 | 88 | 133 | 88 | 133 | 88 | 133 | 88 | 133 | 88 | ||
| Atmospheric deposition | 3 | 4 | 4 | 4 | 4 | 4 | 3 | 6 | 4 | 3 | ||
| Total | 357 | 92 | 357 | 92 | 361 | 92 | 338 | 130 | 349 | 122 | ||
| Outputs | Total N uptake ¶ | 233 | 137 | 261 | 135 | 212 | 122 | 219 | 112 | 240 | 125 | |
| Denitrification | 10 | 10 | 10 | 10 | 10 | 10 | 10 | 10 | 10 | 10 | ||
| Volatilization | 3 | 3 | 3 | 3 | 3 | 3 | 3 | 3 | 3 | 3 | ||
| Total | 246 | 150 | 274 | 148 | 225 | 135 | 232 | 125 | 253 | 138 | ||
| Balance | Inputs-outputs | 111 | −58 | 83 | −56 | 136 | −43 | 106 | 5 | 96 | −16 | |
| N Use Efficiency * | 30 | 37 | 34 | 36 | 27 | 33 | 30 | 21 | 32 | 25 | ||
| SITE B | Soybean | Corn | Soybean | Corn | Soybean | Corn | Soybean | Corn | Soybean | Corn | ||
| Inputs | Fertilizer | 36 | 254 | 19 | 242 | 23 | 184 | 36 | 171 | 19 | 168 | |
| Mineralization | 88 | 133 | 88 | 133 | 88 | 133 | 88 | 133 | 88 | 133 | ||
| Atmospheric deposition | 3 | 3 | 4 | 4 | 4 | 4 | 4 | 3 | 6 | 4 | ||
| Total | 127 | 390 | 111 | 379 | 115 | 321 | 128 | 307 | 113 | 305 | ||
| Outputs | Total N uptake | 132 | 270 | 132 | 252 | 101 | 254 | 127 | 239 | 144 | 217 | |
| Denitrification | 10 | 10 | 10 | 10 | 10 | 10 | 10 | 10 | 10 | 10 | ||
| Volatilization | 3 | 3 | 3 | 3 | 3 | 3 | 3 | 3 | 3 | 3 | ||
| Total | 145 | 283 | 145 | 265 | 114 | 267 | 140 | 252 | 157 | 230 | ||
| Balance | Inputs-outputs | −18 | 107 | −34 | 114 | 1 | 54 | −12 | 55 | −44 | 75 | |
| N Use Efficiency | 26 | 32 | 29 | 31 | 22 | 36 | 25 | 36 | 32 | 33 | ||
| SITE E | Corn | Soybean | Corn | Soybean | Corn | Soybean | Corn | Soybean | Corn | Soybean | ||
| Inputs | Fertilizer | 188 | 0 | 155 | 0 | 182 | 0 | 127 | 0 | 136 | 0 | |
| Mineralization | 133 | 88 | 133 | 88 | 133 | 88 | 133 | 88 | 133 | 88 | ||
| Atmospheric deposition | 3 | 4 | 4 | 4 | 4 | 4 | 3 | 6 | 4 | 3 | ||
| Total | 324 | 92 | 292 | 92 | 319 | 92 | 263 | 94 | 273 | 91 | ||
| Outputs | Total N uptake | 176 | 116 | 200 | 142 | 158 | 104 | 211 | 122 | 207 | 119 | |
| Denitrification | 10 | 10 | 10 | 10 | 10 | 10 | 10 | 10 | 10 | 10 | ||
| Volatilization | 3 | 3 | 3 | 3 | 3 | 3 | 3 | 3 | 3 | 3 | ||
| Total | 189 | 129 | 213 | 155 | 171 | 117 | 224 | 135 | 220 | 132 | ||
| Balance | Inputs-outputs | 135 | −37 | 79 | −63 | 148 | −25 | 39 | −41 | 53 | −41 | |
| N Use Efficiency | 25 | 31 | 32 | 38 | 23 | 28 | 37 | 32 | 35 | 32 | ||
§: Inorganic fertilizers were only applied for all three sites; ¥: Mineralization was calculated using buried-bag techniques; ¶: Total N uptake by plants includes N uptake in grains and stover. Runoff and leaching were not included in total N outputs; *: Nitrogen use efficiency was calculated using the formula: NUE (%) = (total grain yield/total N inputs) * 100.
Table 3.
Average grain yield (kg ha−1) of corn and soybean for three different sites (A, B, and E) of the watershed.
Table 3.
Average grain yield (kg ha−1) of corn and soybean for three different sites (A, B, and E) of the watershed.
| Year | Site A | Site B | Site E | |||
|---|---|---|---|---|---|---|
| Corn | Soybean | Corn | Soybean | Corn | Soybean | |
| kg ha−1 | ||||||
| Year 1 | 10,729 | - | - | 3269 | 8094 | - |
| Year 2 | - | 3388 | 12,422 | - | - | 2886 |
| Year 3 | 12,046 | - | - | 3262 | 9223 | - |
| Year 4 | - | 3357 | 11,607 | - | - | 3513 |
| Year 5 | 9787 | - | - | 2510 a | 7278 | - |
| Year 6 | - | 3012 | 11,707 | - | - | 2572 |
| Year 7 | 10,101 | - | - | 3137 | 9725 | - |
| Year 8 | - | 2779 | 10,992 | - | - | 3012 |
| Year 9 | 11,042 | - | - | 3576 | 9536 | - |
| Year 10 | - | 3106 | 9976 | - | - | 2949 |
| Average | 10,741 ± 882 | 3128 ± 252 | 11,341 ± 916 | 3311 ± 393 | 8771 ± 1047 | 2986 ± 340 |
a Hail damage: Lower yield resulted from hail which caused damage to standing soybean crops at site B.
Publisher’s Note: MDPI stays neutral with regard to jurisdictional claims in published maps and institutional affiliations. |
© 2020 by the authors. Licensee MDPI, Basel, Switzerland. This article is an open access article distributed under the terms and conditions of the Creative Commons Attribution (CC BY) license (http://creativecommons.org/licenses/by/4.0/).
Share and Cite
MDPI and ACS Style
Dattamudi, S.; Kalita, P.K.; Chanda, S.; Alquwaizany, A.S.; S.Sidhu, B. Agricultural Nitrogen Budget for a Long-Term Row Crop Production System in the Midwest USA. Agronomy 2020, 10, 1622. https://doi.org/10.3390/agronomy10111622
AMA Style
Dattamudi S, Kalita PK, Chanda S, Alquwaizany AS, S.Sidhu B. Agricultural Nitrogen Budget for a Long-Term Row Crop Production System in the Midwest USA. Agronomy. 2020; 10(11):1622. https://doi.org/10.3390/agronomy10111622
Chicago/Turabian StyleDattamudi, Sanku, Prasanta K. Kalita, Saoli Chanda, A.S. Alquwaizany, and B. S.Sidhu. 2020. "Agricultural Nitrogen Budget for a Long-Term Row Crop Production System in the Midwest USA" Agronomy 10, no. 11: 1622. https://doi.org/10.3390/agronomy10111622
Note that from the first issue of 2016, this journal uses article numbers instead of page numbers. See further details here.