Article

Structure Stability of Cultivated Soils from Semi-Arid Region: Comparing the Effects of Land Use and Anionic Polyacrylamide Application

1
Arid Land Research Center, Tottori University, Tottori 680-0001, Japan
2
Faculty of Agriculture, OMU, Samsun 55200, Turkey
3
Faculty of Agriculture, Selcuk University, Konya 42130, Turkey
4
Faculty of Agriculture, Ankara University, Ankara 06110, Turkey
5
Soil Erosion and Degradation Research Group, Department of Geography, Valencia University, 46010 Valencia, Spain
6
Institute of Soil, Water and Environmental Sciences, ARO, Volcani Center, Rishon LeZion 7505101, Israel
*
Author to whom correspondence should be addressed.
Agronomy 2020, 10(12), 2010; https://doi.org/10.3390/agronomy10122010
Submission received: 24 November 2020 / Revised: 10 December 2020 / Accepted: 18 December 2020 / Published: 20 December 2020
(This article belongs to the Special Issue Soil Structural Degradation Evaluation in Sustainable Agroecosystems)

Abstract

:
The Sustainable Development Goals of the United Nations call for applying soil management practices that contribute land degradation neutrality. Our objectives were to investigate the effect of (i) soil management—conventional tillage (CT under crop) and no-tillage (NT under grass)—and (ii) an amendment (polyacrylamide (PAM)) application on the structure stability indices of soils from a semi-arid region. Two sets of experiments were conducted using the high-energy moisture characteristic (HEMC) method for the assessment of (i) land-use type (CT vs. NT) in soils (30 samples) varying in texture, and (ii) the effect of six PAM concentrations (0, 10, 25, 50, 100, and 200 mg L−1) on three typical soils (sandy clay loam, clay loam, and clay) under CT management; then, the contributions of PAM concentration (CT) and NT were compared. Water retention curves of samples were obtained at a matric potential from 0 to −5.0 J kg−1 and characterized by a modified van Genuchten model that yields (i) model parameters α and n, and (ii) a soil structure stability index (SI). The treatments affected the shape of the water retention curves. Change of land use from CT to NT and PAM application to CT soil increased the SI and ɑ, and decreased n compared to CT-managed soils. The magnitude of the NT and PAM effect was inversely related to soil clay content. CT-managed soils treated with a low PAM rate (10–25 mg L−1) gave SI comparable to that obtained for the NT-managed soils, while CT-managed soils treated with a high PAM rate (50–200 mg L−1) yielded 1.3–2.0 and 2–4 times higher SI than that for NT and CT-managed soils, respectively. Our findings suggest that both the change of land use to NT or the addition of small amounts of PAM are viable alternatives for stabilizing CT-managed weakly alkaline semi-arid soils, whose soil structure stability is a priori limited.

1. Introduction

Soil structure is an important soil property that is central to soil health; it plays vital roles in controlling land productivity, and carbon, nitrogen, and water cycles. Soil structure and its stability are associated with on-site and off-site of the soil ecosystem services and thus may assist in moderating the effects of climate change and imposed environmental challenges on the soil [1]. In semi-arid and arid regions, which are abundant in Turkey, long-term intense cultivation led to degradation of soil structure, and hence to (i) a great reduction in soil organic matter (OM) and water-holding capacity, nutrient availability and fertility, and water-use efficiency, (ii) lessening of soil aeration and macro-aggregates fraction, and (iii) modification of aggregate- and pore size distribution (PSD) and soil hydraulic properties, a decrease in infiltration and an increase in runoff, erosion, and compaction [2,3,4,5,6,7].
In Turkey, similar to many other countries, land-use change (e.g., from forest or grassland to cropland) and long-term use of conventional tillage (CT) almost without conservation practices greatly reduced soil (physical) quality and altered the sustainability of soil function [8,9,10]. Recently introduced conservation tillage practices in Turkey (e.g., no-tillage (NT) techniques or direct seeding), remained at the research and field experiments level and were not yet implemented by the farmers. Moreover, results of investigations were inconsistent and characterized as positive (e.g., saving time and energy consumption), conflicting (e.g., comparable yield and soil physical properties) and temporary (e.g., duration or condition, soil textural class) [8,11,12,13,14,15,16,17,18]. Additionally, in the semi-arid and arid regions of Turkey, crop production residues are often limited and/or used for bioenergy. Hence, the residues left in the field provide inadequate soil cover (<30–40%) for capturing raindrop impact and protecting the soil surface from sealing, and they are devoid of OM accumulation, irrespective of the conservation practices employed [8,19].
Forest, woodland, and grassland (grazing land) soils usually have higher OM content, higher porosity, enhanced soil hydraulic properties, improved aggregate stability, and greater resistance to erosion than CT cropland soils [20,21,22]. Long-term land use of grassland (NT grass) that leads to the accumulation and protection of OM in macro- and microaggregates could be a good model to evaluate the effects of short and long-term CT crop or NT crop or alternative conservation practices (e.g., amendments) on soil water retention and structure stability [22,23,24]. The efficacy of traditional conservation methods are highly dependent on climate and soil type as well as soil textural class, and may take up to 20–40 years to reach substantial soil OM level and improved soil physical quality, whereas remarkable and comparable positive trends could be noted after 5–10 years under grassland [5,7,10,15,20,25,26,27,28,29].
As a management strategy, amending soils with an anionic polyacrylamide (PAM) coupled with other traditional practices in cultivated lands can significantly improve the quality of soils in a fast manner by positively influencing (i) soil PSD and structure, and aggregate stability, thus protecting soil organic carbon (SOC) in macro-aggregates, (ii) microbial activity, soil OM, or residue decomposition—mineralization (regulating C:N ratio), and (ii) mitigation of erosion and water contamination [30,31,32,33,34,35]. The addition of PAM improves soil physical properties, and thus indirectly, PAM leads to the increase in aeration and plant root penetration, plant uptake of water and nutrients, growth of root, shoot, and plant biomass, and finally plant yield and quality [36,37,38,39]. Therefore, PAM application can, at least in part, replace high-cost intensive cultivation practices and assist in the adaptation of agroecosystems to future climate variations [24,30,35,39,40].
Treating soils with PAM is recognized as an effective tool for improving soil properties under both CT and NT systems [24,38,41]. However, the impact of PAM on soil macropores (>60–75 µm) and aggregate and structure stabilization, which could be up to 2–4 times that of non-treated soils, depends on soil texture and PAM rate. Moreover, the effects of PAM application increase with the increase in macro-aggregate size (>0.25–0.5 mm), particularly in soils from arid and semi-arid regions having smectite as the predominant clay mineral [31,42,43,44].
PAM-amended acidic Luvisols varying in texture (pH = 5.0–6.2, kaolinite–illite-smectite mixed mineralogy), from Ethiopia, that have been under CT cropland, yielded similar to or more stable aggregates compared with aggregates from a NT soil under grass management [24]. Yet, it was concluded that soil additives application for enhancing soil structure stability and physical quality, and thus, as a substitute to conservation practices such as NT, still needs further evaluation under both laboratory and field conditions. It was further postulated that consideration should be paid to tillage and cropping systems, specific climatic conditions, and soil type or clay mineralogy [24,43]. The structure of soils high in montmorillonite is considered unstable, whereas the structure of soils with high contents of kaolinite and sesquioxides is relatively stable, and soils high in 2:1 clay minerals but with low amounts of montmorillonite exhibit an intermediate structure stability. In semi-arid and arid regions, montmorillonite (smectite) is the predominant clay mineral [43,45,46]. Hence, because of the weaker structure stability of smectite soils compared with kaolinitic ones, it is of interest to examine whether use of additives such as PAM may at least partially replace NT management as a conservation practice.
Based on the aforementioned, it is hypothesized that in weakly alkaline soils (pH = 7.6–8.2) from semi-arid regions, (i) NT management under grass will significantly improve soil structure stability indices compared with CT management under crop, (ii) the use of PAM as a soil amendment in CT-managed soils may improve soil structure stability indices beyond that obtained in NT-managed soils, and (iii) the effect of management (NT, CT, and CT + PAM) is soil texture dependent. Consequently, the objectives of the study were to investigate soil structure stability indices dependence on (i) land use in soils varying in texture from a semi-arid region and (ii) PAM addition at various concentrations to soils under long-term CT in comparison with prolonged soils under NT without PAM addition.

2. Materials and Methods

2.1. Soil Samples for Laboratory Tests

Weakly alkaline soils (Luvic/Petric Calcisols) from the Konya region, Turkey characterized by a semi-arid climate and representing three main soil texture groups, as defined by the USDA classification method (i.e., sandy clay loam, clay loam, and clay), were studied. For each soil texture class, samples (in triplicates) were collected from nine long-term conventionally tilled (>15–20 years) farm fields used for annual crops (CT) and from available one neighboring no-till grass (NT) field (>20 years) used for grazing; altogether, ninety soil samples (30 samples × 3 replicates; 3 replicates related to 3 plots within each farm field) were taken from the top soil layer (0–20 cm). The soils were characterized for particle size distribution using the hydrometer method, cation exchange capacity by sodium acetate, exchangeable sodium by ammonium acetate, calcium carbonate content using the volumetric calcimeter method, and organic matter content by wet combustion [47,48]. Selected physical and chemical properties of the soils are presented in Table 1.
Two sets of experiments were conducted to evaluate soil structural stability indices derived from near saturation soil water retention curves obtained using the high-energy (0–5 Jkg−1) moisture characteristic (HEMC) method [49,50]. In the first experiment, the contribution of land use and soil texture was assessed using all soil samples. In the second experiment, the structure stability indices of three of the CT soils (one from each textural class) treated with six anionic PAM concentrations (0, 10, 25, 50, 100, and 200 mg L−1) were compared with the stability indices obtained in the NT soils of the same type.

2.2. Preparation of PAM-Treated Soil Aggregates

Treating aggregates with PAM solution was conducted in accordance with the procedure employed by Mamedov et al. (2010) [43]. An anionic PAM of high molecular weight (≈18 × 106 Da) and 30% hydrolysis with a trade name of Superfloc A-110 (Kemira, GA, USA) was used. A polymer solution of 0 (control, untreated), 10, 25, 50, 100, and 200 mg L−1 was prepared with tap water (electrical conductivity, EC = 0.4 dS m−1, sodium adsorption ratio of = 1.2 (mmolc/L)0.5, and pH = 6.5) under constant stirring and the slow addition of PAM granules over 4 h. Plastic boxes (30 × 60 cm) were filled with a very coarse sand to form a 5-mm thick layer that was then covered with a high porosity (>100 μm pore size) filter paper allowing PAM molecules to diffuse to the aggregates from the coarse sand layer. Aggregates (0.5–1.0 mm) from each studied soil were gently spread on the filter paper to form a monolayer of aggregates and then saturated from below with tap water or PAM solution (0, 10, 25, 50, 100, and 200 mg L−1) during 1 h (at a rate of 4 mm h−1) using a peristaltic pump; then, the boxes were covered and kept in their respective solution for 24 h to reach equilibrium. Thereafter, the boxes were drained and the aggregates were placed in an oven to dry at 60 °C for 24 h; then, aggregates were sieved to eliminate broken aggregates. The polymer concentration in the solution before and after saturating the aggregates, determined by total C analyzer, showed that concentration decreased by <3%, indicting no deficiency in polymer for adsorption by the aggregates.

2.3. Determination of Structural Stability Indices

Soil structure stability indices and pore size distribution (PSD) of 48 samples (non-treated 27 CT and 3 NT samples, and 3 CT samples treated with six PAM concentrations = 18 samples) were determined using the HEMC method and equipment [49,51]. In this method, energy of hydration, differential swelling, and compression of entrapped air are the main forces responsible for breaking down aggregates [50].
Briefly, 15 g of macro-aggregates (0.5–1.0 mm) were placed in a 60 mm I.D. funnel with a fritted disc to form a bed ≈5 mm thick with a bulk density of ≈1.05 g cm−3. The fritted disk had a nominal maximum pore diameter of 20–40 µm. Saturation of the fritted disc is ensured prior to placing aggregates in the funnel. The aggregates were wetted from the bottom with deionized water (DW) at a fast wetting (100 mm h−1) with a peristaltic pump. Then, a soil water retention curve at matric potential from 0 to −5.0 J kg−1 (0 to −50 cm H2O), corresponding to drainable pores of 60 to 2000 µm, with small steps of 0.1–0.2 J kg−1 (1–2 cm, in total 30 points were measured), was performed (Figure 1a). Then, aggregate and structural stability indices were inferred from the obtained water retention curves by characterizing the curves with a modified version of the van Genuchten (1980) model [49,51,52]:
θ   =   θ r + ( θ s θ r )   [   1 + ( α   ψ ) n ]   ( 1 / n 1 ) + A ψ 2 + B ψ + C .
In Equation (1), θ is the water content (kg kg−1); θr and θs are the pseudo residual and saturated water content, respectively; ψ is the applied matric potential (J kg−1); α (cm−1) and n (dimensionless) represent the location and steepness (measure of PSD) of the S-shaped water retention curve (Figure 1a), with the reciprocal of α being often equated with the air entry suction [51]. A, B, and C are coefficients of the polynomial added for better fitting the water retention curves. The modified Equation (1) was used to provide an accurate estimation of volume of drainable pores (VDP, kg kg−1), yet having only little effect on the values of parameters n and α [50]. The specific water capacity curve (dθ/dψ) was computed by differentiating Equation (1) with respect to ψ:
d θ / d ψ = ( θ s θ r ) [ 1 + ( α   ψ ) n ] ( 1 / n 1 ) ( 1 / n 1 ) ( α   ψ ) n n / [ ψ ( 1 + ( α   ψ ) n ) ] + 2 A ψ + B .
The specific water capacity curve allows the determination of the modal suction (MS), which is the matric potential at the peak of the specific water capacity curve and corresponds to the most frequent pore size. Soil VDP, the area under the specific water capacity curve and above the soil shrinkage line (Figure 1b), was calculated by subtracting the terms for pore shrinkage (2Aψ + B) from Equation (2) and analytically integrating the reminder of the equation. Then, the soil structural index (SI, cm−1) was obtained to characterize the stability of the aggregates [50,51]:
SI = VDP/MS.

2.4. Statistical Analysis

An ANOVA test was conducted using the SAS Proc GLM procedure [53] to assess the effects of the treatments (tillage, soil texture, PAM) on the water retention curve parameters (α, n), and the structural stability index (SI). Treatment mean comparisons (e.g., one CT and closely neighboring one NT farms for each of the studied soil textural classes) were done using the Tukey–Kramer HSD test at p < 0.05. Least squares fitting was used to identify the best relation between the soil SI and soil characteristics and PAM concentration, and water retention model parameters (α, n) of the treatments.

3. Results

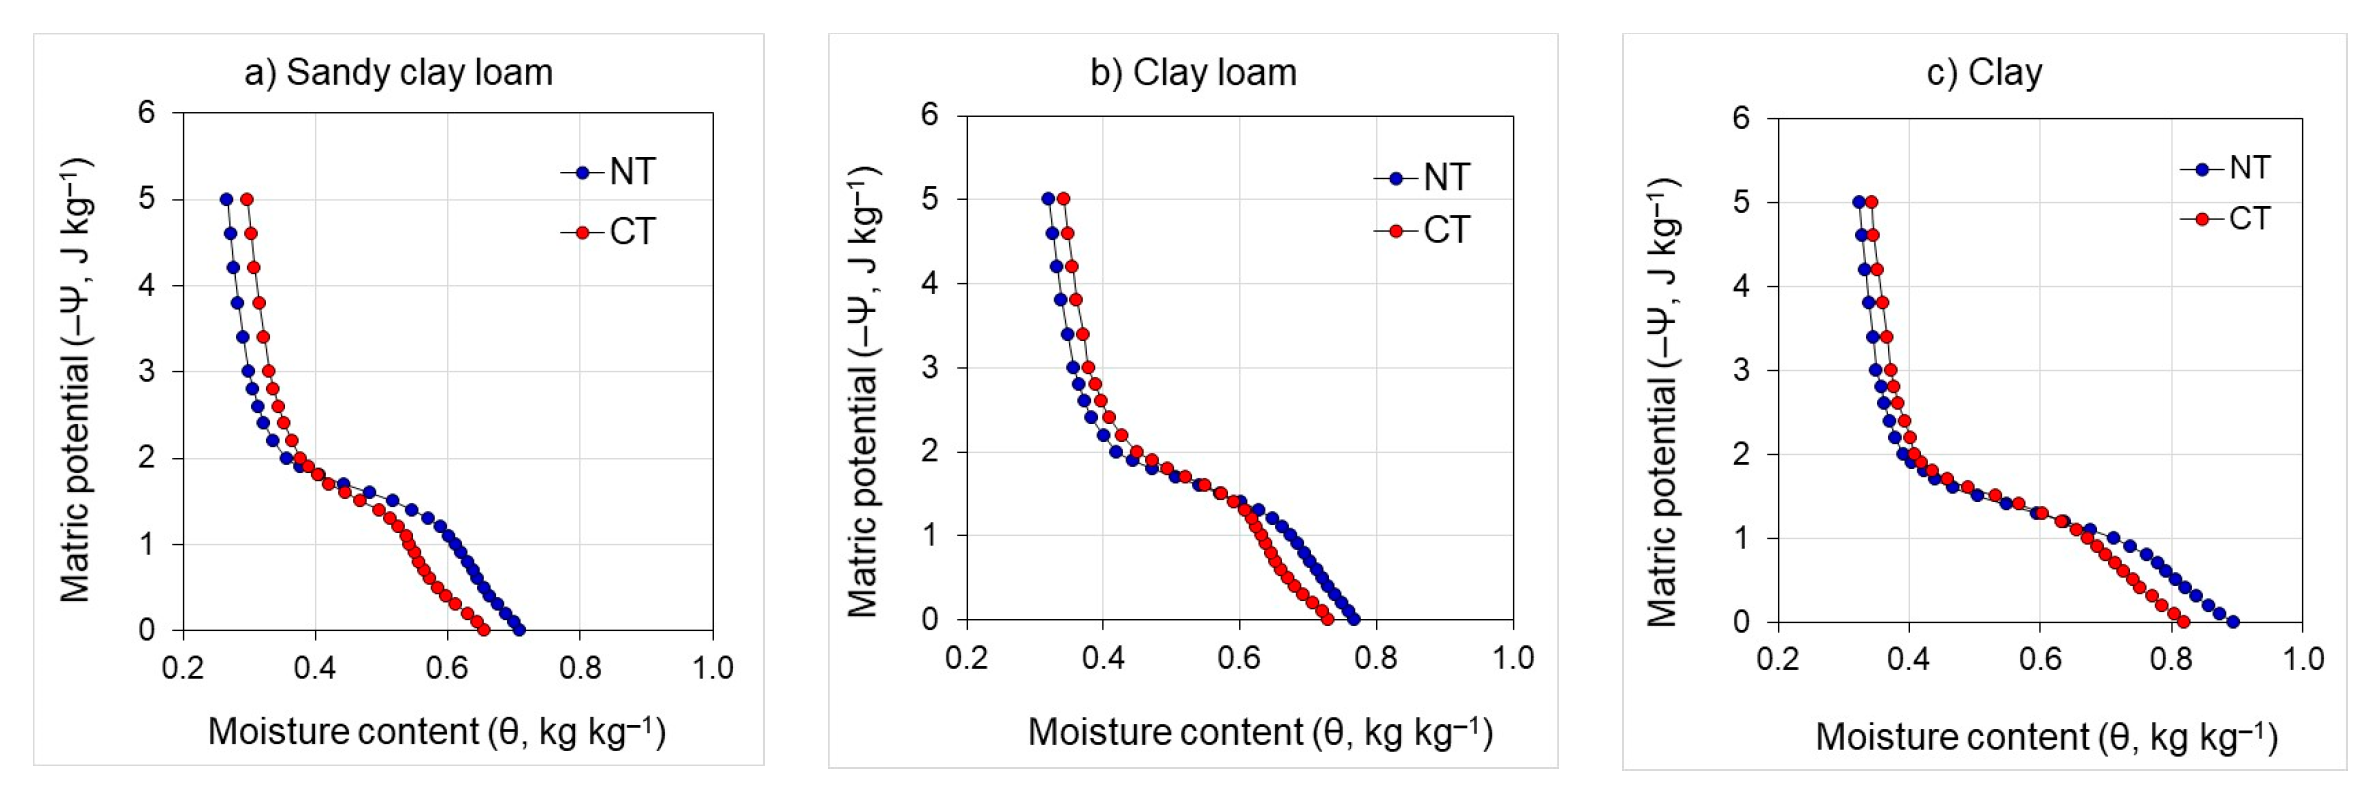
3.1. Soil Texture and Land-Use Impacts on Water Retention Curves and Stability Indices

The water retention curves of long-term cultivated samples separated by soil texture (sandy clay loam, clay loam, and clay soils) and land use (CT crop and NT grass) are presented in Figure 2. A qualitative evaluation of the water retention curves indicates the existence of differences among the curves, which suggests differences in the PSD or distribution of the studied macropores (>60 µm) areas within each soil texture group and between the course and fine textured soils (Figure 2). Pore diameter was calculated from the matric potential as follows: d = −3000/ψ, where d is the equivalent pore diameter, µm. These observed qualitative differences in the water retention curves can be related to variations in both soil properties and land use (Table 1). The water retention curves for the NT soils were mostly located on the right side of the CT soils for ψ < 1.2 J kg−1 (pore size > 250 µm), whereas the opposite trend was observed for the ψ > 1.2 J kg−1 (pore size 60–250 µm) (Figure 2).
A quantitative examination of the water retention curves is obtained from the analysis of the model parameters of the curves (α and n), and soil structural index (SI), all of which were significantly affected by soil texture, land use, and the interaction between them (Table S1). Soil stability indices SI, α, and n widely varied between 0.006 and 0.021 cm−1, 0.061 and 0.079 cm−1, and 9.2 and 13.5, respectively (Table 2). Within each of soil textural class, the contribution of land use to the stability indices was significant, and NT > CT for SI or α, and NT < CT for n (Table 2). The SI of NT soils were 1.4–2.0 times higher than those of CT soils, resulting from the higher VDP and/or lower MS values in the former (Figure 1 and Figure 2). Changes in SI were more evident in the clay and clay loam soils than in the sandy clay loam. The trends for the water retention parameters of α and n were similar to those noted for SI but somewhat less expressive (Table 2). In addition, moisture content at full saturation was significantly higher in NT (grass) soils than CT (crop) soils (∆θs = 0.04 − 0.07 kg kg−1), whereas for residual moisture content, an opposite trend, yet of a smaller and non-significant magnitude, was noted (∆θr = 0.02 − 0.03 kg kg−1) (Figure 2, Table 2).
Soil SI and α increased and n decreased with the increase in soil clay content (Figure 3, Table 2). Moderate power relations (R2 = 0.50 − 0.56, p < 0.001) between the water retention parameters (α, n) and clay content, and a strong linear relation between SI and clay content (R2 = 0.61, p < 0.001), were noted (Figure 3). Furthermore, a weak relation, albeit significant (R2 = 0.41, p < 0.001), was noted between SI and soil OM (data not presented).

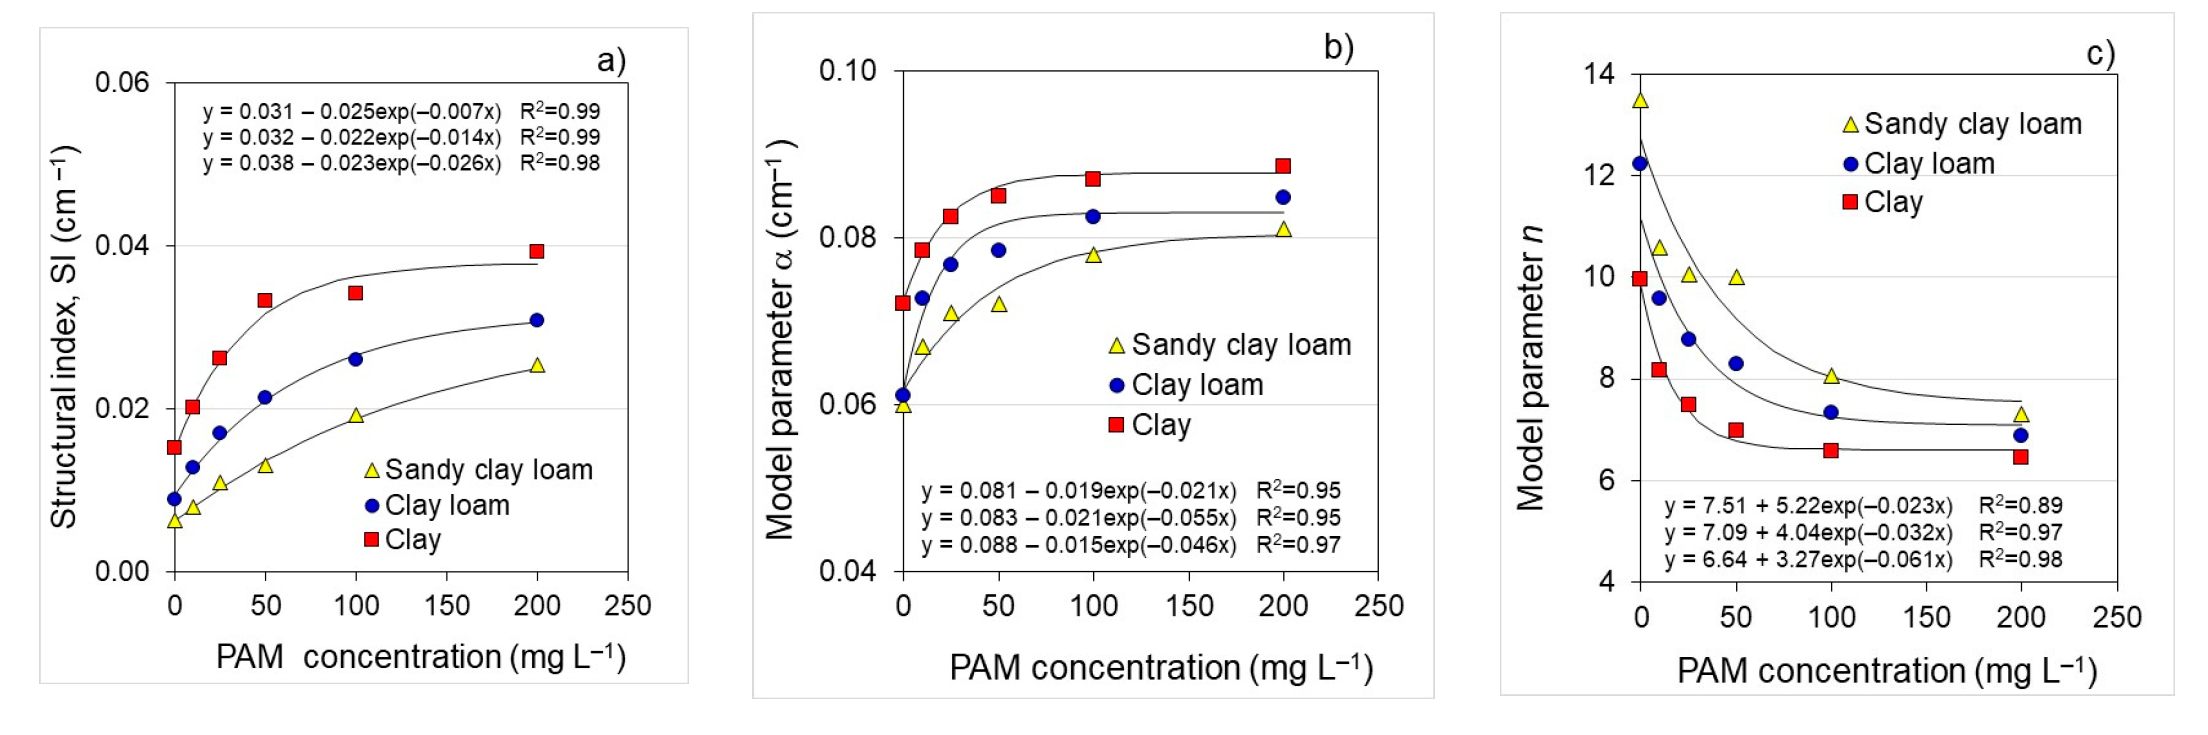
3.2. Water Retention Curves and Stability Indices of PAM-Treated Soils

The water retention curves of PAM-treated sandy clay loam and clay soils with low OM (<1.3%) are given in Figure 4. The curves for clay loam are not presented, as they are located between those of the sandy clay loam and the clay. The effect of soil texture, PAM concentration, and their interaction on all stability indices were significant (Table S2). The shape of soil water retention curves was texture dependent and largely affected by PAM concentrations. Similar to NT, the water retention curves for the PAM-treated soils were analogous to CT or located on the right side of the control CT soils for ψ < 1.2 J kg−1 (pore size > 250 µm). For ψ > 1.2 J kg−1 (pore size 60–250 µm), the water retention curves for the PAM-treated soils were mostly located on the left side of the control CT curves. This phenomenon was more noticeable at the higher rates of PAM, especially for the sandy clay loam (Figure 4). Relative to the control, increasing PAM concentration increased water content (∆θs = 0.03 − 0.06 kg kg−1) at ψ = 0 J kg−1 and decreased water content (∆θr = 0.03 − 0.05 kg kg−1) at ψ = 5 J kg−1 (Figure 4).
In all three soil samples, the SI and α increased, and n decreased with the increase in PAM concentrations (Figure 5). The relationships between SI as well as model parameters (α, n) and PAM concentration were soil dependent, but they could also be characterized by exponential-associated growth for SI and α and exponential-associated decline for n with a high coefficient of determination (R2 = 0.89–0.99, p < 0.001) (Figure 5). The impact of PAM on the water retention curves increased α by 1.1–1.4 times and decreased n by 1.2–1.9 times, relative to the control. Relative stabilization of the parameters was noted after PAM 50–100 mg L−1 concentrations (Figure 5).
The SI of the long-term NT soils was 1.4–2.0 times higher than the SI of the non-treated CT soils. However, for the same soil texture, CT soils treated with low PAM concentrations (10–25 mg L−1) exhibited comparable SI levels to those observed for the NT soils (Figure 6). Conversely, the CT soils treated with high PAM concentrations (50–200 mg L−1) showed 1.3–2.0 and 2.0–4.0 times greater SI than those of the NT and CT control soils, respectively. These effects of PAM addition were of a greater magnitude in the soils with the lower clay content (Figure 6).

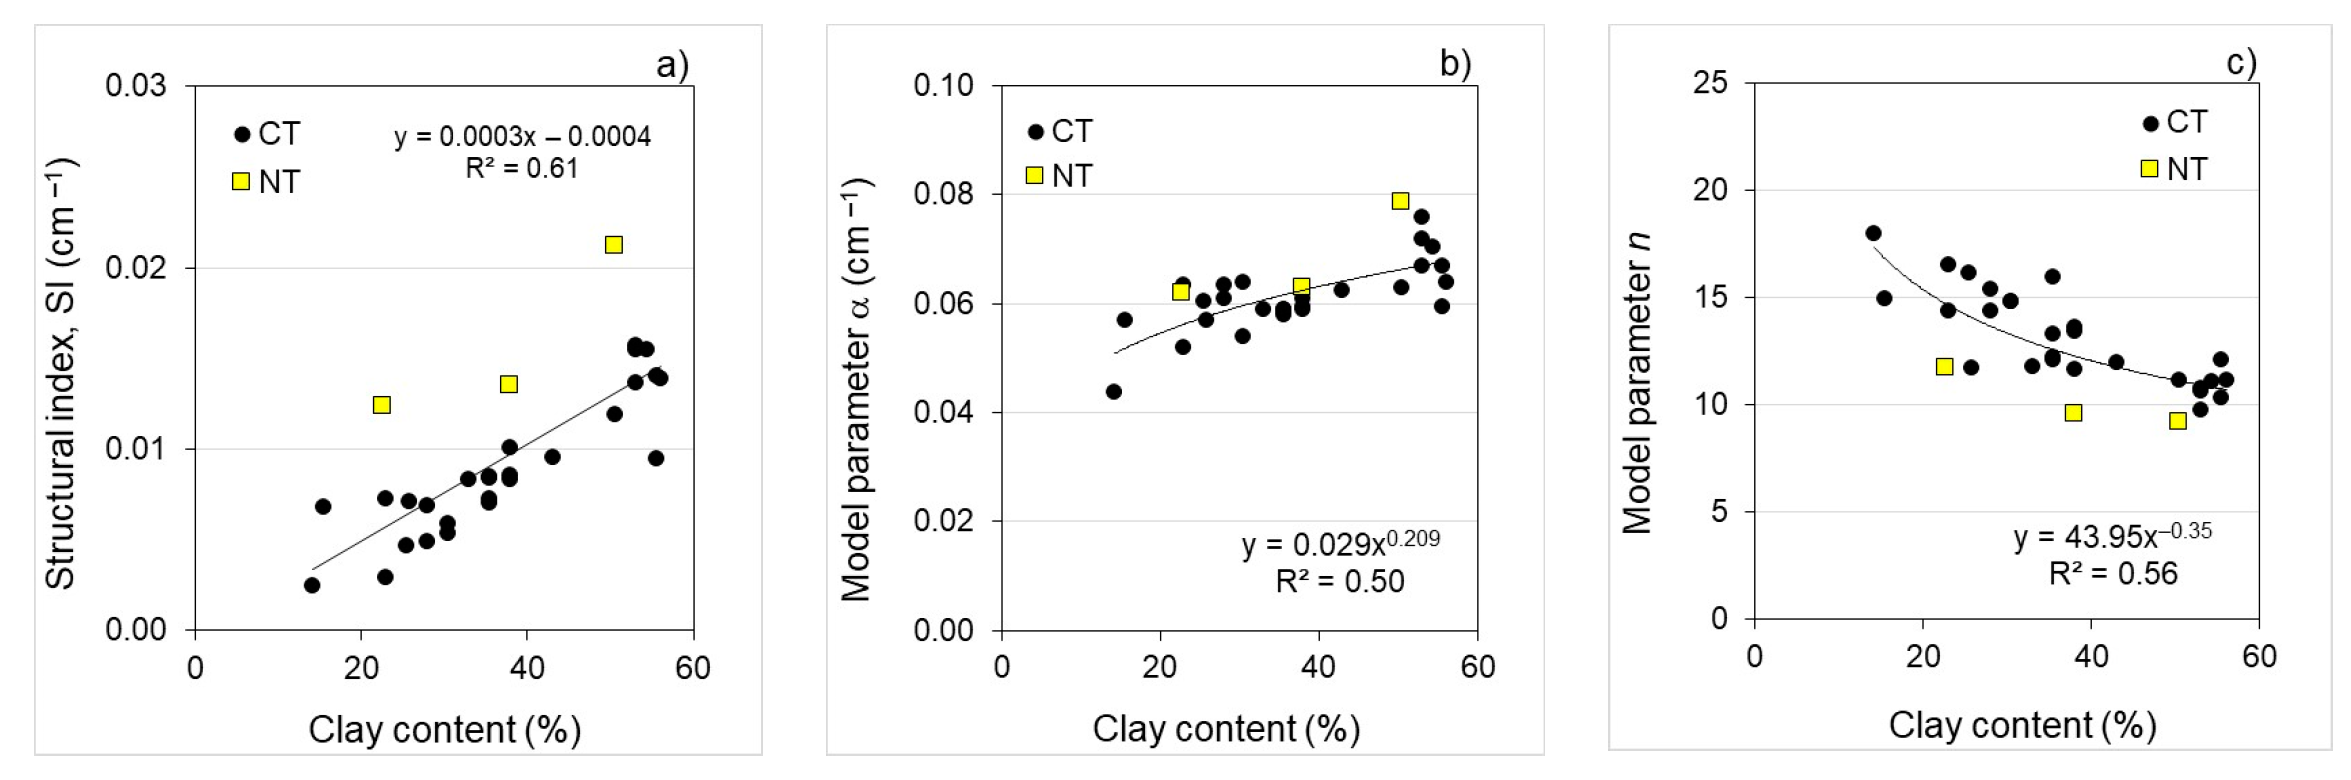
3.3. Relations between Soil Structural Index and Model Parameters

Relations between soil structural index (SI) and model parameters (α, n) for the combination of long-term 30 cultivated soils (27 CT and 3 NT), and 18 PAM-treated soils (3 soils × 6 PAM concentrations) are presented in Figure 7. It should be noted that for a given soil texture, SI of the NT soil was higher than those of the CT ones (Figure 3, Figure 6 and Figure 7). In both cases, combined treatments gave an exponential relationship with a high coefficient of determination for α (R2 = 0.86, p < 0.001) and n (R2 = 0.90, p < 0.001). Coefficients of determination were also higher for separated land use and PAM treatments (R2 = 0.74–0.91, data not shown).

4. Discussion

A qualitative analysis of dissimilarities between water retention curves derived from the different treatments can provide information as to the apparent aggregate size fraction that had been affected by these treatments [50,54]. The applied suction was in the range of 0–5 J kg−1, thus affecting pores that are associated with soil structure porosity (i.e., inter-particle pores; >60 µm). These pores can be divided broadly into three sub-classes within the very fine macropores equivalent diameter class (75 to 1000 µm) with matric potential ranges of 0–1.2, 1.2–2.4, and 2.4–5.0 J kg−1, corresponding to macro-, meso-, and micro-pores, respectively [43]. The above division of the drainable pores studied by the HEMC method must be accompanied by soil aggregates of sizes and packing that form these pore-size classes. It has been shown for spherical particles that their packing will typically create a pore size with a diameter 15–40% of the particle diameter [55]. Hence, three apparent size classes of aggregates (e.g., apparent macro-, meso-, and micro-aggregates), which correspond to the aforementioned macro-, meso-, and micro-pores, respectively, can be defined. The term apparent aggregate size class is introduced because, unlike the pore classes whose sizes are well defined, the actual size of the aggregate classes is not well known [1,50,54].
In our study, notable differences of a qualitative nature in the water retention curves among the treatments studied (soil texture, land use, and PAM concentration) have been observed (Figure 2 and Figure 4). The fact that the water retention curves of the NT and the PAM-treated soils lay to the right of the CT (control, with no PAM) curves at the low suction range (0–1.2 J kg−1) is a clear indication that the former two treatments exhibit greater macro-pores and hence greater apparent macro-aggregates compared with the CT treatment. Conversely, at the high suction range (2.4–5.0 J kg−1), the water retention curves of the NT and the PAM-treated soils lay mostly to the left of the CT-crop (control) curves. This observation implies that the latter treatment had larger micro-pores than the two former ones. As a result, the NT and the PAM-treated soils maintained a larger portion of drainable pores, including meso-pores and thus apparent meso-aggregates compared with the CT (control) treatment. The magnitude of the aforementioned phenomena increased with the decrease in soil clay content. Finally, these observations propose that for our weakly alkaline semi-arid soils, the use of long-term NT or treating CT soils with PAM stabilize and maintain a greater fraction of apparent macro- and meso-aggregates than the CT control soils [24]. In the case of the NT, this size range of apparent aggregates could be formed by roots and microbiota activity; such aggregates and the associated pores also can provide physical protection of SOC [22,23].

4.1. Soil Texture and Land Use

The aforementioned treatment-related dissimilarities in the water retention curves and hence the differences in near saturation PSD are magnified in the subsequent calculated stability indices (SI) and model parameters α and n in the weakly alkaline semi-arid soils. The stability indices (SI) and model parameter ɑ increased and model parameter n decreased with increase in clay content in the 27 CT (crop) soils and to a certain extent in the three NT (grass) ones (Figure 3). Both attributes are linked by their representation of binding processes in the soil [49]. The association between SI and soil clay content exhibited linear-type relations (Figure 3). Levy and Miller (1997) [56] also reported of linear relations between aggregate stability and clay content for humid soils from the southeastern USA. Yet, other studies reported logarithmic-type relations between the two attributes [49]. It is postulated that the linear relationship between aggregate stability and clay content is related to the relatively narrow range of clay content (20–50% clay) in the soils used in the current and previous studies [56].
Contrary to the CT soils with low OM (≈1%) and weak structure, the effect of fast wetting on aggregate slaking in the NT soils having higher OM content (≈3%), particularly in the clay soil, was less marked. The higher SI values, and thus aggregate stability, in the NT soils compared with the CT soil (Table 2) are ascribed to both the higher OM content in the NT soils (Table 1) and the development of inter- and intra-aggregate cohesion forces with time following the absence of tillage, which is known to stabilize aggregates [57]. Land use that does not involve tillage (e.g., grass, forest) is more beneficial to soil structure than long-term crop rotation alone in tilled soils, which does not have much additional effect on soil structure [4].

4.2. Application of PAM

Although PAM is known to be a soil-stabilizing agent, some uncertainty exists regarding the issue of whether PAM penetrates into aggregates or adsorbs only on the aggregates’ exterior surfaces and thus stabilizes merely those surfaces [58]. Some studies observed that PAM adsorption on soils is mostly on exterior surfaces of soil material [59]. Conversely, other studies showed that PAM does penetrate into pores within aggregates [60]. Levy and Miller (1999) [61] emphasized the aspect of scale: when high-molecular-weight PAM is used, the narrow pores in small-size aggregates (<1 mm) may not allow penetration of the large PAM molecules into the aggregates, while the opposite is true for large aggregates having greater macroporosity.
Our soils had favorable properties for stabilization by PAM application such as predominant smectite and illite (smectite-illite) clay mineralogy and soil type, low salinity (EC < 2 dS m−1), slight alkalinity, appreciable CaCO3 content, and no sodicity (ESP < 2) (Table 2) [15,43,62]. In general, the promising impact of the PAM treatments on stabilizing the aggregates in the studied sandy clay loam, clay loam, and clay soils was consistent with numerous former studies and stems mostly from stabilizing the exterior surfaces of our aggregates as we studied 0.5–1.0 mm aggregates [43,44].
The positive influence of PAM on SI and model parameters were soil texture dependent, being more effective in sandy clay loam with initially much weaker soil structure than in clay soil (Figure 5, Figure 6 and Figure 7), which was, generally, in agreement with other studies [31,44,46]. This finding also was similar to that reported by Mamedov et al. (2010) [43] for soils having different clay mineralogy. Conversely to this finding for PAM, in semi-arid and arid regions, changing land use from CT to NT has been noted to be soil type-dependent and more effective in stabilizing clay soils than loam soils, where a prolonged period is needed to rebuild soil structure due to lower SOC input and its protection [7,8,10,12,22,28].
The contributions of PAM to the shape of water retention curves and aggregate stability were somewhat similar (Figure 2 and Figure 4) to the contributions of NT. This trend was more visible at high rates of PAM, which was probably due to the fact that in contrast to NT, the application of PAM does not lead to the buildup of new soil aggregates with time but to preserving and strengthening existing aggregates [31,39,41,50]. The increase in the effectiveness of PAM as a soil amendment with the increase in its concentration coupled with the dependence of its effectiveness on soil texture highlight the importance of tailoring the amount of PAM used to the specific conditions (e.g., management, amendments application, biofertilizers) in the field [24,40].
It is well understood that there is a need to apply management practices to reduce soil structure deterioration and extreme soil erosion. The use of strategies such as mulch [63,64], no tillage [65,66], chipped pruned branches [67,68], and cover crops [69] is common. All those strategies are considered nature-based solutions [63] that are efficient only after some years and also need high investments to become effective. The use of PAM can serve as a suitable alternative strategy to improve soil aggregate and structure stability (e.g., SI) and reduce runoff and soil losses in agriculture [30,70,71] and forest soils that used to be under highly degraded conditions [65,72,73]. That is not only because PAM is an efficient soil amendment [24] but also because it becomes effective immediately after application. This feature is imperative to achieve the Sustainable Development Goals of the United Nations Land Degradation Neutrality challenge [63]. The reduction in cost involved in the use of PAM, compared to the aforementioned traditional strategies, coupled with its high efficiency within a short time span, will contribute to its widespread application and proper management following its acceptance by the farmers, which used to reject other environmentally friendly strategies [65,67].

4.3. Relations between Soil Structure Stability Indices

The contribution of agricultural management and amendments on soil water retention could also be quantitatively characterized by the α and n parameters, because changes in α, n, and the SI are considered to be closely related to soil physical quality, PSD, and therefore to aggregate size distribution [44,50,54,74,75]. The relations between SI and water retention model parameters are important for understanding the mechanism and direction of the tested treatments in stabilization soil structure. An exponential relation between SI and α or n (Figure 7) implies that increases in the size of the most frequent pores and associated larger aggregates [50,55] improve soil SI and, hence, the stability of the aggregates and their resistance to slaking by wetting. The strong exponential relations (R2 = 0.86 and 0.90) between SI and α or n were unique for combined treatments (27 CT, 3 NT, and 18 PAM treated soils) and might suggest that α and n could serve as a good proxy for evaluating changes in aggregate stability following changes in soil extrinsic conditions such as changes in size of aggregates following different tillage and cultivation practices and/or the application of soil amendments such as PAM [43,44,54,75].

5. Conclusions

It emerged from our study that the change of land use from CT-managed soils to NT-managed soils has substantial positive effects on aggregate stability indices in the studied weakly alkaline semi-arid soils. Moreover, a viable alternative in the form of the use of small amount of a soil amendment (e.g., PAM) was noted to effectively stabilize aggregates and improve soil structure in a CT-managed soil, at times, even at a magnitude greater than that of NT-managed soil. These findings validated our first and second hypotheses. The magnitude of the improvement in soil stability indices following the aforementioned change in land use or the use of PAM was inversely related to soil clay content; these observations confirmed our third hypothesis. Evidently, in fine textured soils (i.e., clay soils), merely the presence of high clay content is sufficient to enforce on the soil a meaningful level of stability, thereby making the contribution of the management tools on soil stability of lesser significance, yet, at times important. Our findings suggest that there is more than one management alternative, such as PAM application, for stabilizing weakly alkaline semi-arid soils whose soil structure stability is a priori limited. The choice of type of management tool to be employed should depend on the nature of the agroecosystem to be treated and the needs of the farmers.

Supplementary Materials

The following are available online at https://www.mdpi.com/2073-4395/10/12/2010/s1, Table S1: Significance levels for treatment (soil group and selected soil texture and tillage type) effects on the stability indices (VDP = volume of drainable pores, MS = modal suction, SI = structural index, ɑ and n, model parameters representing the location of the inflection point and the steepness of the water retention curve respectively). NS, not significant; *, **, *** Significant at the 0.05, 0.01 and 0.001 level. Significance levels for treatment (soil group and selected soil texture and tillage type) effects on the stability indices (VDP = volume of drainable pores, MS = modal suction, SI = structural index, ɑ and n, model parameters representing the location of the inflection point and the steepness of the water retention curve respectively), (NS, not significant; *, **, *** Significant at the 0.05, 0.01 and 0.001 level); Table S2: Significance levels for treatment (soil texture and PAM rate) effects on the stability indices (VDP = volume of drainable pores, MS = modal suction, SI = structural index, α and n, model parameters which represent the location of the inflection point and the steepness of the water retention curve respectively), (*, **, *** Significant at the 0.05, 0.01 and 0.001 level).

Author Contributions

Conceptualization, A.I.M., G.J.L., A.T. and A.C.; methodology, A.I.M., M.T., C.Ş., G.J.L. I.E. and A.C.; software, A.I.M., H.F. and I.E.; validation, A.I.M., C.Ş., M.T. and G.J.L. formal analysis, A.I.M., I.E., H.S.Ö.; investigation, A.I.M., H.F. and C.Ş.; resources, H.F., C.Ş. and H.S.Ö.; data curation, M.T. and H.F.; writing—original draft preparation, A.I.M. and G.J.L.; writing—review and editing, A.I.M., G.J.L., A.C., H.S.Ö., I.E.; visualization, A.I.M.; supervision, A.I.M., A.T., G.J.L., C.Ş.; project administration, A.T.; funding acquisition, A.T., C.Ş.; All authors have read and agreed to the published version of the manuscript.

Funding

This research received no external funding.

Acknowledgments

Administrative, technical and fellowship support received by A.I. Mamedov from Arid Land Research Center, Tottori University, Japan, Science and Technology Research Partnership for Sustainable Development (SATREPS), Japan, and Japan Science and Technology Agency (JST)/Japan International Cooperation Agency (JICA), and TUBITAK, Turkey (Scientific and Technological Research Council of Turkey) is greatly acknowledged. Authors also would like to thank the Kemira Company, GA, USA for providing anionic polyacrylamide, Superfloc A-110, free of charge.

Conflicts of Interest

The authors declare no conflict of interest.

References

  1. Rabot, E.; Wiesmeier, M.; Schlüter, S.; Vogel, H.-J. Soil structure as an indicator of soil functions: A review. Geoderma 2018, 314, 122–137. [Google Scholar] [CrossRef]
  2. Evrendilek, F.; Celik, I.; Kilic, S. Changes in soil organic carbon and other physical soil properties along adjacent Mediterranean forest, grassland, and cropland ecosystems in Turkey. J. Arid. Environ. 2004, 59, 743–752. [Google Scholar] [CrossRef]
  3. Strudley, M.W.; Green, T.R.; Ascough, J.C., II. Tillage effects on soil hydraulic properties in space and time: State of the science. Soil Tillage Res. 2008, 99, 4–48. [Google Scholar] [CrossRef]
  4. Benjamin, J.G.; Mikha, M.M.; Vigil, M.F. Organic carbon effects on soil physical and hydraulic properties in a semiarid climate. Soil Sci. Soc. Am. J. 2008, 72, 1357–1362. [Google Scholar] [CrossRef] [Green Version]
  5. Wiesmeier, M.; von Lützow, M.; Spörlein, P.; Geuß, U.; Hangen, E.; Reischl, A.; Schilling, B.; Kögel-Knabner, I. Land use effects on organic carbon storage in soils of Bavaria: The importance of soil types. Soil Tillage Res. 2015, 146, 296–302. [Google Scholar] [CrossRef]
  6. van Loo, M.; Dusar, B.; Verstraeten, G.; Renssen, H.; Notebaert, B.; D’Haen, K.; Bakker, J. Human induced soil erosion and the implications on crop yield in a small mountainous Mediterranean catchment (SW-Turkey). Catena 2017, 149, 491–504. [Google Scholar] [CrossRef] [Green Version]
  7. Çelik, I.; Günal, H.; Acar, M.; Acir, N.; Barut, Z.B.; Budak, M. Evaluating the long-term effects of tillage systems on soil structural quality using visual assessment and classical methods. Soil Use Manag. 2020, 36, 223–239. [Google Scholar] [CrossRef]
  8. Avci, M. Conservation tillage in Turkish dryland research. Agron. Sustain. Dev. 2010, 31, 299–307. [Google Scholar] [CrossRef] [Green Version]
  9. Günal, H.; Korucu, T.; Birkás, M.; Özgöz, E.; Halbac-Cotoara-Zanfir, R. Threats to Sustainability of Soil Functions in Central and Southeast Europe. Sustainability 2015, 7, 2161–2188. [Google Scholar] [CrossRef] [Green Version]
  10. Sarker, J.R.; Singh, B.-; Cowie, A.; Fang, Y.; Collins, D.; Badgery, W.; Dalal, R.C. Agricultural management practices impacted carbon and nutrient concentrations in soil aggregates, with minimal influence on aggregate stability and total carbon and nutrient stocks in contrasting soils. Soil Tillage Res. 2018, 178, 209–223. [Google Scholar] [CrossRef]
  11. Effects of Different Tillage Methods on Soil Physical Properties under Second Crop Sesame in the Harran Plain, Southeast Turkey. Asian J. Plant Sci. 2006, 5, 613–618. [CrossRef] [Green Version]
  12. Gursoy, S.; Sessiz, A.; Malhi, S. Short-term effects of tillage and residue management following cotton on grain yield and quality of wheat. Field Crop. Res. 2010, 119, 260–268. [Google Scholar] [CrossRef]
  13. Celik, I.; Turgut, M.M.; Acir, N. Crop rotation and tillage effects on selected soil physical properties of a Typic Haploxerert in an irrigated semi-arid Mediterranean region. Int. J. Plant Prod. 2012, 6, 457–480. [Google Scholar]
  14. Uzun, B.; Yol, E.; Furat, Ş.; Topakci, M.; Canakci, M.; Karayel, D. The effects of different tillage methods on the post-wheat second crop sesame: Seed yield, energy budget, and economic return. Turk. J. Agric. Forest. 2012, 36, 399–407. [Google Scholar] [CrossRef]
  15. Mayes, M.; Marin-Spiotta, E.; Szymanski, L.; Erdoğan, M.A.; Ozdoğan, M.; Clayton, M. Soil type mediates effects of land use on soil carbon and nitrogen in the Konya Basin, Turkey. Geoderma 2014, 232, 517–527. [Google Scholar] [CrossRef]
  16. Ozpinar, S.; Ozpinar, A. Tillage effects on soil properties and maize productivity in western Turkey. Arch. Agron. Soil Sci. 2014, 61, 1029–1040. [Google Scholar] [CrossRef]
  17. Gozubuyuk, Z.; Sahin, U.; Adiguzel, M.C.; Ozturk, I.; Çelik, A. The influence of different tillage practices on water content of soil and crop yield in vetch–winter wheat rotation compared to fallow–winter wheat rotation in a high altitude and cool climate. Agric. Water Manag. 2015, 160, 84–97. [Google Scholar] [CrossRef]
  18. Barut, Z.; Celik, I. Tillage effects on some soil physical properties in semi-arid mediterranean region of Turkey. Chem. Engin. Trans. 2017, 58, 217–222. [Google Scholar] [CrossRef]
  19. Li, Y.; Li, Z.; Cui, S.; Jagadamma, S.; Zhang, Q. Residue retention and minimum tillage improve physical environment of the soil in croplands: A global meta-analysis. Soil Tillage Res. 2019, 194, 104292. [Google Scholar] [CrossRef]
  20. Kodešová, R.; Jirků, V.; Kodeš, V.; Mühlhanselová, M.; Nikodem, A.; Žigová, A. Soil structure and soil hydraulic properties of Haplic Luvisol used as arable land and grassland. Soil Tillage Res. 2011, 111, 154–161. [Google Scholar] [CrossRef]
  21. Liu, M.-Y.; Chang, Q.; Qi, Y.-B.; Liu, J.; Chen, T. Aggregation and soil organic carbon fractions under different land uses on the tableland of the Loess Plateau of China. Catena 2014, 115, 19–28. [Google Scholar] [CrossRef] [Green Version]
  22. Wiesmeier, M.; Urbanski, L.; Hobley, E.; Lang, B.; von Lützow, M.; Marin-Spiotta, E.; van Wesemael, B.; Rabot, E.; Ließ, M.; Garcia-Franco, N.; et al. Soil organic carbon storage as a key function of soils—A review of drivers and indicators at various scales. Geoderma 2019, 333, 149–162. [Google Scholar] [CrossRef]
  23. Kravchenko, A.N.; Negassa, W.C.; Guber, A.K.; Rivers, M.L. Protection of soil carbon within macro-aggregates depends on intra-aggregate pore characteristics. Sci. Rep. 2015, 5, 16261. [Google Scholar] [CrossRef] [PubMed] [Green Version]
  24. Mamedov, A.I.; Fujimaki, H.; Tsunekawa, A.; Tsubo, M.; Levy, G. Structure stability of acidic Luvisols: Effects of tillage type and exogenous additives. Soil Tillage Res. 2021, 206, 104832. [Google Scholar] [CrossRef]
  25. Jacobs, A.; Rauber, R.; Ludwig, B. Impact of reduced tillage on carbon and nitrogen storage of two Haplic Luvisols after 40 years. Soil Tillage Res. 2009, 102, 158–164. [Google Scholar] [CrossRef]
  26. Kelishadi, H.; Mosaddeghi, M.R.; Ayoubi, S.; Mamedov, A. Effect of temperature on soil structural stability as characterized by high energy moisture characteristic method. Catena 2018, 170, 290–304. [Google Scholar] [CrossRef]
  27. Ogle, S.M.; Alsaker, C.; Baldock, J.; Bernoux, M.; Breidt, F.J.; McConkey, B.; Regina, K.; Vazquez-Amabile, G.G. Climate and Soil Characteristics Determine Where No-Till Management Can Store Carbon in Soils and Mitigate Greenhouse Gas Emissions. Sci. Rep. 2019, 9, 1–8. [Google Scholar] [CrossRef]
  28. Liang, C.; VandenBygaart, A.; Macdonald, J.; Cerkowniak, D.; McConkey, B.; Desjardins, R.; Angers, D. Revisiting no-till’s impact on soil organic carbon storage in Canada. Soil Tillage Res. 2020, 198, 104529. [Google Scholar] [CrossRef]
  29. Jensen, J.L.; Schjønning, P.; Watts, C.W.; Christensen, B.T.; Obour, P.B.; Munkholm, L.J. Soil degradation and recovery—Changes in organic matter fractions and structural stability. Geoderma 2020, 364, 114181. [Google Scholar] [CrossRef]
  30. Sojka, R.E.; Orts, W.J.; Entry, J.A. Soil Physics and Hydrology: Conditioners. In Encyclopedia of Soils in the Environment; Elsevier Ltd.: Oxford, UK, 2004; pp. 301–306. [Google Scholar]
  31. Caesar-Tonthat, T.; Busscher, W.; Novak, J.; Gaskin, J.; Kim, Y. Effects of polyacrylamide and organic matter on microbes associated to soil aggregation of Norfolk loamy sand. Appl. Soil Ecol. 2008, 40, 240–249. [Google Scholar] [CrossRef]
  32. Levy, G.J.; Warrington, D.N. Polyacrylamide Addition to Soils: Impacts on Soil Structure and Stability. In Functional Polymers in Food Science; Wiley: Hoboken, NJ, USA, 2015; Volume 2, pp. 9–31. [Google Scholar]
  33. Lee, S.S.; Shah, H.S.; Awad, Y.M.; Kumar, S.; Ok, Y.S. Synergy effects of biochar and polyacrylamide on plants growth and soil erosion control. Environ. Earth Sci. 2015, 74, 2463–2473. [Google Scholar] [CrossRef]
  34. Tian, X.; Fan, H.; Wang, J.; Ippolito, J.; Li, Y.; Feng, S.; An, M.; Zhang, F.; Wang, K. Effect of polymer materials on soil structure and organic carbon under drip irrigation. Geoderma 2019, 340, 94–103. [Google Scholar] [CrossRef]
  35. Tian, X.; Wang, K.; Liu, Y.; Fan, H.; Wang, J.; An, M. Effects of polymer materials on soil physicochemical properties and bacterial community structure under drip irrigation. Appl. Soil Ecol. 2020, 150, 103456. [Google Scholar] [CrossRef]
  36. Wu, L.; Ok, Y.S.; Xu, X.; Kuzyakov, Y. Effects of anionic polyacrylamide on maize growth: A short term 14C labeling study. Plant Soil 2011, 350, 311–322. [Google Scholar] [CrossRef] [Green Version]
  37. Shabbir, A.; Khan, M.M.A.; Sadiq, Y.; Jaleel, H.; Ahmad, B.; Uddin, M. Effect of polyacrylamide soil-dressing on physiological attributes, essential oil content, and composition of vetiver (Vetiveria zizanioides). J. Herbs, Spices Med. Plants 2018, 24, 199–212. [Google Scholar] [CrossRef]
  38. Abu-Hamdeh, N.H.; Ismail, S.M.; Al-Solaimani, S.G.; Hatamleh, R.I. Effect of tillage systems and polyacrylamide on soil physical properties and wheat grain yield in arid regions differing in fine soil particles. Arch. Agron. Soil Sci. 2019, 65, 182–196. [Google Scholar] [CrossRef]
  39. Ma, B.; Ma, B.-L.; McLaughlin, N.B.; Mi, J.; Yang, Y.; Liu, J. Exploring soil amendment strategies with polyacrylamide to improve soil health and oat productivity in a dryland farming ecosystem: One-time versus repeated annual application. Land Degrad. Dev. 2020, 31, 1176–1192. [Google Scholar] [CrossRef]
  40. Awad, Y.M.; Lee, S.S.; Kim, K.-H.; Ok, Y.S.; Kuzyakov, Y. Carbon and nitrogen mineralization and enzyme activities in soil aggregate-size classes: Effects of biochar, oyster shells, and polymers. Chemosphere 2018, 198, 40–48. [Google Scholar] [CrossRef]
  41. Roozbeh, M.; Bahrami, H.; Almassi, M.; Sheikhdavoodi, M.J.; Abbasi, F.; Gheysari, M. Investigation of polyacrylamide application under different tillage intensity on sediment and nitrogen losses in irrigated corn field. Aust. J. Crop Sci. 2012, 6, 963–969. [Google Scholar]
  42. Ashgari, S.; Neyshabour, M.R.; Abbasi, F.; Aliasgharzad, N.; Oustan, S. The effects of four organic soil conditioners on aggregate stability, pore size distribution, and respiration activity in a sandy loam soil. Turkish J. Agr. Forest. 2009, 33, 47–55. [Google Scholar] [CrossRef]
  43. Mamedov, A.I.; Wagner, L.E.; Huang, C.; Norton, L.D.; Levy, G.J. Polyacrylamide Effects on Aggregate and Structure Stability of Soils with Different Clay Mineralogy. Soil Sci. Soc. Am. J. 2010, 74, 1720–1732. [Google Scholar] [CrossRef] [Green Version]
  44. Mamedov, A.I.; Huang, C.; Aliev, F.A.; Levy, G.J. Aggregate Stability and Water Retention Near Saturation Characteristics as Affected by Soil Texture, Aggregate Size and Polyacrylamide Application. Land Degrad. Dev. 2017, 28, 543–552. [Google Scholar] [CrossRef] [Green Version]
  45. Amézketa, E. Soil Aggregate Stability: A Review. J. Sustain. Agric. 1999, 14, 83–151. [Google Scholar] [CrossRef]
  46. de Melo, D.V.M.; de Almeida, B.G.; de Souza, E.R.; Silva, L.S.; Jacomine, P.K.T. Structural quality of polyacrylamide-treated cohesive soils in the coastal tablelands of Pernambuco. Rev. Brasil. Ciênc. Solo 2014, 38, 476–485. [Google Scholar] [CrossRef] [Green Version]
  47. Klute, A. Methods of Soil Analysis, Part 1, 2nd ed.; Agronomy Monograph 9; ASA and SSSA: Madison, WI, USA, 1986. [Google Scholar]
  48. Page, A.L.; Miller, R.H.; Keeney, D.R. Methods of Soil Analysis, Part 2, 2nd ed.; Agronomy Monograph 9; ASA and SSSA: Madison, WI, USA, 1986. [Google Scholar]
  49. Levy, G.J.; Mamedov, A.I. High-Energy-Moisture-Characteristic Aggregate Stability as a Predictor for Seal Formation. Soil Sci. Soc. Am. J. 2002, 66, 1603–1609. [Google Scholar] [CrossRef]
  50. Mamedov, A.; Levy, G.; Logsdon, S.; Berli, M.; Horn, R. High Energy Moisture Characteristics: Linking Between Some Soil Physical Processes and Structure Stability. In Bridging Among Disciplines by Synthesizing Soil and Plant Processes; Wiley: Hoboken, NJ, USA, 2015; Volume 3, pp. 41–74. [Google Scholar]
  51. Pierson, F.B.; Mulla, D.J. An Improved Method for Measuring Aggregate Stability of a Weakly Aggregated Loessial Soil. Soil Sci. Soc. Am. J. 1989, 53, 1825–1831. [Google Scholar] [CrossRef]
  52. van Genuchten, M.T. A Closed-form Equation for Predicting the Hydraulic Conductivity of Unsaturated Soils. Soil Sci. Soc. Am. J. 1980, 44, 892–898. [Google Scholar] [CrossRef] [Green Version]
  53. SAS Institute. SAS User’s Guide; Version 9.2.; SAS Institute: Cary, NC, USA, 2008. [Google Scholar]
  54. Lipiec, J.; Walczak, R.; Witkowska-Walczak, B.; Nosalewicz, A.; Słowińska-Jurkiewicz, A.; Sławiński, C. The effect of aggregate size on water retention and pore structure of two silt loam soils of different genesis. Soil Tillage Res. 2007, 97, 239–246. [Google Scholar] [CrossRef]
  55. Hamamoto, S.; Moldrup, P.; Kawamoto, K.; de Jonge, L.W.; Schjønning, P.; Komatsu, T. Two-Region Extended Archie’s Law Model for Soil Air Permeability and Gas Diffusivity. Soil Sci. Soc. Am. J. 2011, 75, 795–806. [Google Scholar] [CrossRef]
  56. Levy, G.J.; Miller, W.P. Aggregate Stabilities of Some Southeastern U.S. Soils. Soil Sci. Soc. Am. J. 1997, 61, 1176–1182. [Google Scholar] [CrossRef]
  57. Blake, G.R.; Gilman, R.D. Thixotropic Changes with Aging of Synthetic Soil Aggregates. Soil Sci. Soc. Am. J. 1970, 34, 561–564. [Google Scholar] [CrossRef]
  58. Shainberg, I.; Goldstein, D.; Mamedov, A.I.; Levy, G.J. Granular and Dissolved Polyacrylamide Effects on Hydraulic Conductivity of a Fine Sand and a Silt Loam. Soil Sci. Soc. Am. J. 2011, 75, 1090–1098. [Google Scholar] [CrossRef]
  59. Mamedov, A.I.; Beckmann, S.; Huang, C.; Levy, G.J. Aggregate Stability as Affected by Polyacrylamide Molecular Weight, Soil Texture, and Water Quality. Soil Sci. Soc. Am. J. 2007, 71, 1909–1918. [Google Scholar] [CrossRef] [Green Version]
  60. Miller, W.P.; Willis, R.L.; Levy, G.J. Aggregate stabilization in kaolinitic soils by low rates of anionic polyacrylamide. Soil Use Manag. 1998, 14, 101–105. [Google Scholar] [CrossRef]
  61. Levy, G.; Miller, W. Polyacrylamide adsorption and aggregate stability. Soil Tillage Res. 1999, 51, 121–128. [Google Scholar] [CrossRef]
  62. Yilmaz, K.; Celik, I.; Kapur, S.; Ryan, J. Clay minerals, Ca/Mg ratio and Fe-Al-Oxides in relation to structural stability, hydraulic conductivity and soil erosion in southeastern Turkey. Turk. J. Agr. Forest. 2005, 29, 29–37. [Google Scholar]
  63. Keesstra, S.; Nunes, J.P.; Novara, A.; Finger, D.C.; Avelar, D.; Kalantari, Z.; Cerda, A. The superior effect of nature based solutions in land management for enhancing ecosystem services. Sci. Total. Environ. 2018, 610, 997–1009. [Google Scholar] [CrossRef] [Green Version]
  64. Chalise, D.; Kumar, L.; Sharma, R.; Kristiansen, P. Assessing the Impacts of Tillage and Mulch on Soil Erosion and Corn Yield. Agronomy 2020, 10, 63. [Google Scholar] [CrossRef] [Green Version]
  65. Novara, A.; Pulido, M.; Rodrigo-Comino, J.; di Prima, S.; Smith, P.; Gristina, L.; Gimenez-Morera, A.; Terol, E.; Salesa, D.; Keesstra, S. Long-term organic farming on a citrus plantation results in soil organic carbon recovery. Cuader. Invest. Geogr. 2019, 45, 271. [Google Scholar] [CrossRef] [Green Version]
  66. Cerda, A.; Rodrigo-Comino, J.; Yakupoglu, T.; Dindaroglu, T.; Terol, E.; Mora, G.; Arabameri, A.; Radziemska, M.; Novara, A.; Kavian, A.; et al. Tillage Versus No-Tillage. Soil Properties and Hydrology in an Organic Persimmon Farm in Eastern Iberian Peninsula. Water 2020, 12, 1539. [Google Scholar] [CrossRef]
  67. Cerda, A.; Rodrigo-Comino, J.; Giménez-Morera, A.; Novara, A.; Pulido, M.; Kapović-Solomun, M.; Keesstra, S. Policies can help to apply successful strategies to control soil and water losses. The case of chipped pruned branches (CPB) in Mediterranean citrus plantations. Land Use Policy 2018, 75, 734–745. [Google Scholar] [CrossRef] [Green Version]
  68. Rodrigo-Comino, J.; Giménez-Morera, A.; Panagos, P.; Pourghasemi, H.R.; Pulido, M.; Cerdà, A. The potential of straw mulch as a nature-based solution for soil erosion in olive plantation treated with glyphosate: A biophysical and socioeconomic assessment. Land Degrad. Dev. 2020, 31, 1877–1889. [Google Scholar] [CrossRef]
  69. López-Vicente, M.; Calvo-Seas, E.; Álvarez, S.; Cerda, A. Effectiveness of Cover Crops to Reduce Loss of Soil Organic Matter in a Rainfed Vineyard. Land 2020, 9, 230. [Google Scholar] [CrossRef]
  70. Yakupoglu, T.; Rodrigo-Comino, J.; Cerda, A. Potential Benefits of Polymers in Soil Erosion Control for Agronomical Plans: A Laboratory Experiment. Agronomy 2019, 9, 276. [Google Scholar] [CrossRef] [Green Version]
  71. Kebede, B.; Tsunekawa, A.; Haregeweyn, N.; Mamedov, A.I.; Tsubo, M.; Fenta, A.A.; Meshesha, D.T.; Masunaga, T.; Adgo, E.; Abebe, G.; et al. Effectiveness of Polyacrylamide in Reducing Runoff and Soil Loss under Consecutive Rainfall Storms. Sustainability 2020, 12, 1597. [Google Scholar] [CrossRef] [Green Version]
  72. Barrena-González, J.; Lozano-Parra, J.; Alfonso-Torreño, A.; Lozano-Fondón, C.; Abdennour, M.A.; Cerdà, A.; Pulido-Fernández, M. Soil erosion in Mediterranean chestnut tree plantations at risk due to climate change and land abandonment. Cent. Europ. Forest. J. 2020, 66, 85–96. [Google Scholar] [CrossRef]
  73. Borrelli, P.; Robinson, D.A.; Panagos, P.; Lugato, E.; Yang, J.E.; Alewell, C.; Wuepper, D.; Montanarella, L.; Ballabio, C. Land use and climate change impacts on global soil erosion by water (2015–2070). Proc. Natl. Acad. Sci. USA 2020, 117, 21994–22001. [Google Scholar] [CrossRef]
  74. Dexter, A.; Czyż, E.A. Applications ofS-theory in the study of soil physical degradation and its consequences. Land Degrad. Dev. 2007, 18, 369–381. [Google Scholar] [CrossRef]
  75. Porebska, D.; Slawinski, C.; Lamorski, K.; Walczak, R.T. Relationship between van Genuchten’s parameters of the retention curve equation and physical properties of soil solid phase. Int. Agrophys. 2006, 20, 153–159. [Google Scholar]
Figure 1. Water retention (a) and specific water capacity (b) curves of the sandy clay loam soil aggregates from conventionally tilled (CT crop), and no-till (NT grass). The dashed baseline in the specific water capacity curve represents soil shrinkage line.
Agronomy 10 02010 g001
Figure 2. Water retention curves of soil samples taken from CT (crop) and NT (grass) of (a) a sandy clay loam, (b) a clay loam and (c) a clay soil.
Agronomy 10 02010 g002
Figure 3. Relations (p < 0.001) between clay content and (a) structure stability index (SI), (b) water retention model parameter α, and (c) model parameter n, for the CT (crop) and NT (grass) soil samples.
Agronomy 10 02010 g003
Figure 4. Water retention curves of (a) sandy clay loam and (b) clay soils form long-term conventionally tilled field (CT crop) treated with six concentrations (control = 0, 10, 25, 50, 100, and 200 mg L−1) of the polyacrylamide (PAM).
Agronomy 10 02010 g004
Figure 5. Relations (p < 0.001) between (a) soil structural index (SI), (b) water retention model parameter α, and (c) water retention model parameter n and applied polyacrylamide (PAM) concentrations.
Agronomy 10 02010 g005
Figure 6. Structure stability (SI) of sandy clay loam, clay loam, and clay soils as affected by tillage and polyacrylamide (PAM) application: no-till under grass (NT grass) and conventional tillage under crop (CT crop) treated with six PAM concentrations (PAM 0 = untreated CT crop soil). The columns labeled with same letter are not significantly different at p < 0.05.
Agronomy 10 02010 g006
Figure 7. Relations (p < 0.001) between soil structural index (SI) and water retention model parameter for (a) α and (b) n for 48 soil samples: 27 long-term cultivated (CT) soils and 3 no-till (NT) soils (10 sandy clay loam, 10 clay loam, and 10 clay soils) and 18 polyacrylamide (PAM)-treated soils: 3 soils (sandy clay loam, clay loam, and clay soils) treated with six polyacrylamide (PAM) concentrations (0 = control, 10, 25, 50, 100, and 200 mg L−1).
Agronomy 10 02010 g007
Table 1. Selected properties of the used soils (mean ± standard deviation): averaged soil properties of 30 samples separated by textural class (sandy loam, sandy clay loam, clay loam, and clay) and used to study the contribution of management and properties of three samples (sandy clay loam, clay loam, and clay) used for polyacrylamide (PAM) treatments.
Land UseSamplesPropertiesSandy Clay LoamClay LoamClay
CT crop27Clay, %23.7 ± 5.635.5 ± 2.552.7 ± 4.0
Silt, %20.3 ± 4.121.4 ± 2.821.9 ± 3.0
Sand, %56.8 ± 6.643.1 ± 3.625.4 ± 5.1
CEC, me/100 g25.7 ± 7.829.9 ± 2.336.9 ± 3.7
OM, %1.35 ± 0.451.71 ± 0.491.76 ± 0.65
CaCO3, %20.6 ± 9.326.0 ± 8.418.3 ± 5.9
pH7.85 ± 0.147.91 ± 0.107.86 ± 0.13
EC, dS/m0.36 ± 0.20.18 ± 0.10.35 ± 0.2
ESP1.6 ± 1.10.8 ± 0.51.1 ± 0.8
CT crop3Clay, %23.0 ± 2.535.5 ± 3.953.0 ± 5.8
+ PAM Silt, %22.5 ± 2.517.5 ± 1.917.5 ± 2.0
Sand, %54.5 ± 5.847.0 ± 5.229.5 ± 3.2
CEC, me/100 g19.2 ± 2.130.0 ± 3.337.2 ± 4.1
OM, %1.26 ±. 0141.16 ± 0.121.19 ± 0.13
CaCO3, %26.8 ± 2.926.0 ± 2.916.8 ± 1.8
pH8.02 ± 0.088.00 ± 0.087.90 ± 0.09
EC, dS/m0.19 ± 0.020.17 ± 0.020.15 ± 0.02
ESP0.8 ± 0.10.5 ± 0.11.2 ± 0.1
NT grass 3Clay, %22.7 ± 2.538.0 ± 4.250.5 ± 5.6
Silt, %25.1 ± 2.820.0 ± 2.217.5 ± 1.9
Sand, %52.2 ± 5.742.0 ± 4.632.0 ± 3.5
CEC, me/100 g20.9 ± 2.333.9 ± 3.738.5 ± 4.2
OM, %3.10 ± 0.352.85 ± 0.323.21 ± 0.34
CaCO3, %18.4 ± 2.022.0 ± 2.320.5 ± 2.4
pH8.10 ± 0.087.80 ± 0.087.70 ± 0.08
EC, dS/m0.34 ± 0.040.19 ± 0.030.35 ± 0.04
ESP1.4 ± 0.20.5 ± 0.10.6 ± 0.1
NT: no-tillage (under grass), CT: conventional tillage (under crop), CEC: cation exchange capacity, OM: organic matter; EC: electrical conductivity (1:2), ESP: exchangeable sodium percentage.
Table 2. Structural stability indices and water retention model parameters of soils.
SoilsTillageSInɑθsθr
(cm−1) (cm−1)(kg kg−1)(kg kg−1)
Sandy clay loamNT (grass)0.012 a11.69 b0.063 a0.709 a0.268 a
CT (crop)0.006 b13.50 a0.060 b0.655 b0.297 a
Clay LoamNT (grass)0.014 a9.56 b0.064 a0.768 a0.320 a
CT (crop)0.009 b13.45 a0.061 b0.729 b0.342 a
Clay LoamNT (grass)0.021 a9.22 b0.079 a0.894 a0.324 a
CT (crop)0.015 b9.96 a0.072 b0.820 b0.343 a
NT: no-tillage, CT: conventional tillage, SI: structural index, ɑ and n, are the location of the inflection point and the steepness of the water retention curve. θr and θs, are the residual and saturated water content. Within each soil textural class, the columns labeled with the same letter (a, b) are not significant at p < 0.05 level.
Publisher’s Note: MDPI stays neutral with regard to jurisdictional claims in published maps and institutional affiliations.

