Article

Weather-Based Predictive Modeling of Wheat Stripe Rust Infection in Morocco

1
Department of Sciences and Environmental Management, University of Liege, Arlon 6700, Belgium
2
Department of Plant Protection, Ecole Nationale d’Agriculture de Meknès, Meknès 50001, Morocco
3
Centre for Applied Climate Sciences, University of Southern Queensland, Toowoomba, QLD 4350, Australia
4
AGROPTIMIZE, Arlon 6700, Belgium
5
Current affiliation: Institute of Bio and Geosciences (Agrosphere, IBG-3), Research Centre Jülich, 52428 Jülich, Germany
6
Department of Mathematics, Université Abdelmalek Essaâdi, B.P. 416 Tangier, Morocco
7
INRA, Centre Régional de la Recherche Agronomique, Oujda 60000, Morocco
*
Author to whom correspondence should be addressed.
Agronomy 2020, 10(2), 280; https://doi.org/10.3390/agronomy10020280
Submission received: 14 December 2019 / Revised: 10 February 2020 / Accepted: 12 February 2020 / Published: 15 February 2020
(This article belongs to the Special Issue Cereal Rust Management for Improving Global Food Security)

Abstract

:
Predicting infections by Puccinia striiformis f. sp. tritici, with sufficient lead times, helps determine whether fungicide sprays should be applied in order to prevent the risk of wheat stripe rust (WSR) epidemics that might otherwise lead to yield loss. Despite the increasing threat of WSR to wheat production in Morocco, a model for predicting WSR infection events has yet to be developed. In this study, data collected during two consecutive cropping seasons in 2018–2019 in bread and durum wheat fields at nine representative sites (98 and 99 fields in 2018 and 2019, respectively) were used to develop a weather-based model for predicting infections by P. striiformis. Varying levels of WSR incidence and severity were observed according to the site, year, and wheat species. A combined effect of relative humidity > 90%, rainfall ≤ 0.1 mm, and temperature ranging from 8 to 16 °C for a minimum of 4 continuous hours (with the week having these conditions for 5% to 10% of the time) during March–May were optimum to the development of WSR epidemics. Using the weather-based model, WSR infections were satisfactorily predicted, with probabilities of detection ≥ 0.92, critical success index ranging from 0.68 to 0.87, and false alarm ratio ranging from 0.10 to 0.32. Our findings could serve as a basis for developing a decision support tool for guiding on-farm WSR disease management, which could help ensure a sustainable and environmentally friendly wheat production in Morocco.

1. Introduction

Rust pathogens are among the most widespread and important pathogens of wheat which can cause substantial economic losses if uncontrolled (see for examples [1,2,3,4,5]). For instance, yield losses resulting from wheat stripe rust (WSR) epidemics, caused by Puccinia striiformis f. sp. tritici, can reach more than 5.5 million tons per year globally [5,6]. WSR constitutes an increasing threat to wheat production worldwide, with repeated occurrences [7,8,9,10]. During the past decade, a number of WSR epidemics were reported in Central and West Asia, and in East and North Africa, with a high disease pressure observed in countries such as Morocco [11,12] (https://rusttracker.cimmyt.org/). The increasing threat of WSR worldwide can be attributed to a combination of various factors. They include favorable climatic conditions conducive to infections [13,14,15,16,17]; long-distance migration capacity [16,18]; high rates of mutation and existence of recombinant and highly diverse populations [10,19,20,21,22,23,24].
Wheat is one of the major staple crops of great economic importance in Morocco, the most consumed cereal crop, with a per capita consumption of 258 kg annually [25,26,27]. The Moroccan wheat production is dominated by bread (or common) wheat (Triticum aestivum L.), which represents ~70% of the total wheat production (durum wheat—Triticum turgidum ssp. durum—representing the remaining 30%) [27]. The average production of bread wheat during 2012–2018 was ca. 4.1 million tons for a harvested area of ca. 2.1 million ha [27,28,29]. That of durum wheat over the same period was on average ca. 1.8 million tons for a harvested area of ca. 958,000 ha [27,28,29]. Given the importance of wheat production to the Moroccan economy, the continuous threat posed by WSR each year, particularly since 2010 [30] could be detrimental to the livelihoods of millions of individuals over time if not well addressed. Fungicides are typically used to control WSR epidemic outbreaks in Morocco. To help limiting the potential harmful side effects of these products, while ensuring economic benefits, it is essential to develop decision-support systems that integrate WSR disease risk model.
Several disease models with variable levels of complexity and data requirements have been developed to predict WSR progress in wheat [15,31,32,33,34,35,36,37]. For example, in Canada, an integrated model-based forecasting approach for WSR disease risk at the regional scale, which involves weather, airborne inoculum and satellite-based data, was developed and tested in Alberta [34]. In the U.S., meteorological data such as maximum, minimum, and average temperature; total and frequency of precipitation; consecutive days with and without precipitation; accumulation of negative and positive degree-days; and number of days with extreme temperature events, were considered for developing statistical models for predicting WSR severity [35,36,37]. In Luxembourg, a threshold-based weather model was developed, and is being used operationally into a warning system for timely and optimum fungicide sprays in wheat fields [15,38]. The authors denoted that although the findings were region-specific, the underlying hypothesis and approach are potentially applicable in different geographical regions [15]. Such approaches have the potential to improve the timeliness and effectiveness of fungicide applications while minimizing economic costs and environmental impacts, as well as yield losses [34]. To the best of our knowledge, no such system nor WSR disease risk model has been applied for Moroccan conditions. Using a similar modelling approach as in El Jarroudi et al. [15], the main objective of this study was therefore to develop a weather-based model for predicting WSR infection events at representative wheat-producing areas in Morocco. The reproducibility of area-specific modelling approaches is often a hurdle for their application in operational disease warning system. Thus, beside constituting a replicability test of the modelling approach used in [15], the findings of this study could serve as a basis for improving the management of WSR epidemics in Moroccan wheat-growing regions, while reducing the potential harmful side effects of fungicide applications.

2. Materials and Methods

2.1. Study Sites and Weather Data

Wheat-growing areas in Morocco can be classified into six agro-ecological regions [39]. They range from a typical Mediterranean climate in the northern coasts to continental conditions in the Central regions and mountainside areas in the West High Atlas, to semi-arid environments in the southern part of wheat-growing areas (north-western parts of the Sahara desert). Durum and bread wheats are typically sown around mid-October to mid-November, with harvests taking place during mid-May to June in the following year.
The surveys for WSR assessment were carried out in nine sites across the wheat-growing regions in the Saïs plain: Ain Jemâa, Ain Orma, Ain Taoujdate, Bouderbala, Boufekrane, El Hajeb, Hajkadour, M‘Haya, and Sebaâyoun (Figure 1). In each site, several commercial bread and durum wheat fields were observed during April–May 2018 and 2019, a period encompassing generally the growth stages flowering to physiological maturity. Fields were randomly selected to represent the common wheat management practices in Morocco. Observation dates along with the growth stages are presented in Table 1. In 2019 no observation was carried out for durum wheat at Ain Jemâa, Ain Orma, Ain Taoujdate and El Hajeb because farmers in these areas opted for bread wheat instead of durum wheat.
The number of fields surveyed per site varied between 3 and 13, depending on the year and wheat species: there were 98 fields surveyed in 2018 (51 of bread wheat and 47 of durum wheat) and 99 fields in 2019 (88 of bread wheat and 11 of durum wheat) (Table 1). The main cultivars grown in the surveyed areas were Achtar, Arrehane, Amal, Faiza, Radia, and Rajae for bread wheat, and Karim, Irid, Kanakis, and Vitrico for durum wheat (http://www.onssa.gov.ma/fr/controle-des-semences-et-plants/homologation-des-varietes). It is well known that the level of resistance of the cultivar to WSR influences the level of disease pressure. Given the lack of such information for the different bread and durum wheat cultivars in Morocco, we assumed in this study that all the cultivars for each of the wheat species have more or less the same level of resistance to WSR.
Hourly weather data (average near surface air temperature (T), relative humidity (RH), and rainfall (R)) for the selected sites from January 2018 to June 2019 were used in this study. These weather data were computed using the regional climate model Modèle Atmosphérique Régional (MAR) version 3.9 [40,41]. Here, we used the first 24 h from the daily forecast run of the global weather forecast model Global Forecast System as boundary conditions for MAR. The MAR model was run at a 7.5 km horizontal resolution over a domain extending from the Atlantic Ocean off the Moroccan coast in the North-West to the Atlas Mountains in the South-East. For each selected site, the time series of weather data were then extracted from the nearest grid point of the model domain.

2.2. Wheat Stripe Rust Incidence and Severity Assessment

WSR incidence (proportion of plants with disease symptoms) and severity (percent leaf area diseased) were assessed on 15 plants at each of the selected fields in a given cropping season. Plants were selected randomly in different places across the field, with a minimum distance of 10 m from field borders to avoid any border effect. For each plant, the visual disease severity estimates were made on the three upper leaves (L3 to L1, L1 being the flag leaf) using a modified Cobb scale for rusts [42]; the average value of disease severity was then considered for the plant. WSR was identified based on yellow to orange, round to ovoid, erumpent uredinia that were 1.0 to 1.5 mm in diameter, scattered on both the upper and the lower leaf surfaces. Additionally, there were random observations every 8 to 12 km along the roads to inspect any wheat fields, wherever available, and assess the spread of the disease across the surveyed site.
For each site, WSR incidence for a given observation date was calculated as the proportion of diseased plants out of the 15 observed. WSR severity was calculated as the average of the 15 plants observed. The overall disease prevalence for each wheat species during each of the cropping seasons was calculated as the ratio between the total number of fields where WSR was observed and the total number of fields surveyed.
An analysis of variance (ANOVA) using general linear modelling (PROC GLM procedure; SAS® v.9.01; SAS Institute Inc., Cary, NC) was carried out to assess the influence of year, site, and wheat species (considered as independent variables) on WSR severity (dependent variable). A Tukey’s HSD post hoc means separation test (α = 0.05) was used to compare the means.

2.3. Development of the Weather-Based Model for Predicting WSR Infection Events

We followed the approach used by El Jarroudi et al. [15] to develop a weather-based model for simulating the occurrence of WSR at the selected Moroccan sites during the 2017/2018 and 2018/2019 cropping seasons. A schematic flowchart of the approach is presented in Figure 2.
First, we determined the frequencies of classes of weather variables conducive to infections by P. striiformis during each of the weeks for the end of March-May period. This period was chosen because any infections by P. striiformis and subsequent development of WSR occurring during this period could adversely affect the final grain yield. The classes of weather variables used in the frequency analysis (Table 2) were based on the ranges of plausible weather conditions (T, RH and R) influencing WSR, as reported in the literature [14,15,32,43], and on the average climate conditions (i.e., air temperature and relative humidity) as observed at the surveyed sites. Historical climate data were used to determine the ranges of selected climate variables over the year and over the wheat cropping season. Given the potential difference in response to temperature of WSR pathotypes, it was important to consider local climate conditions while defining the classes of weather variables.
Then, the dominant classes of T and R over uninterrupted hours (4 and 8 h) where such conditions were met, were determined; they were then associated with each interval of RH to determine the optimum combination of weather variables based on a given threshold frequency, i.e., frequency of this class over a week. At the completion of each latency period an occurrence of WSR was simulated. The latency period was calculated as follows [44]:
P = ( 1005 + 11.3   T ) / ( 2.5 + 5.65   T )
where P is the latency period (days), and T is the average daily temperature (°C).
In our study, starting from each day of infection, the latency period was calculated at a daily time step, as well as its inverse. The day when this sum of the inverses reaches 1 (i.e., 100% of latency achieved) corresponds to the date when WSR symptoms become visible.
Finally, different proportions (5% to 35%, in 5% steps) of weekly frequency of each class of combined weather variables were assessed in relation to the observed WSR occurrences, and those resulting in good accuracy (i.e., highest scores of forecast probability) were selected as thresholds for consideration into the weather-based model for predicting WSR infections. A WSR infection event was considered to have occurred when symptoms appear after the disease latency period and significantly increase in incidence and severity.

2.4. Model Calibration and Evaluations

Data for the 2017/2018 cropping season for both bread and durum wheat fields of six sites (Ain Jemâa, Ain Orma, Ain Taoujdate, Boufekrane, El Hajeb, and M’Haya) were used for calibrating the model. A first model evaluation was then performed using data of the remaining sites (Bouderbala, Hajkadour and Sebaâyoun) for the same cropping season which were not considered in the calibration step. Further, data of all the nine sites for 2018/2019 cropping season were used for a second model evaluation. Since these were cross-sectional data, we used this double-evaluation process to better test the robustness of the model. Weather conditions affecting wheat growth during the two cropping seasons were variable and different between seasons [25,45]. Moreover, given the absence of observation for durum wheat at four sites in 2019, considering only 2019 for evaluating the model would have not provided the overall picture of the model performance.
Three statistical scores derived from a contingency table analysis were used to assess the accuracy of the weather-based model at the different stages of its development. They were the probability of detection (POD), the false alarm ratio (FAR), and the critical success index (CSI). These scores were calculated as follows:
P O D =   S O S O + N S O
F A R =   S N O S O + S N O
C S I =   S O S O + S N O + N S O
where SO, SNO and NSO refer to infections simulated and observed, infections simulated but not observed, and infections observed but not simulated, respectively [46,47].
POD corresponds to the probability of forecasting correctly the observed event. It varies between 0 and 1, with 1 being the perfect score. FAR is the number of times an event is forecast but is not observed, divided by the total number of forecasts of that event. Its perfect score is 0. CSI takes into account both false alarms and missed events. It ranges from 0 to 1, with 1 being the perfect score.

3. Results and Discussion

3.1. Weather Conditions during the Study Period

The weather was generally dry in the surveyed sites during March-May 2018 and 2019, with 2019 being the driest (Figures S1–S3). In 2018 the dominant weekly ranges of rainfall and temperatures were R = 0 mm and 8 °C < T ≤ 12 °C, respectively. The relative humidity mostly varied between 60 and 85%. In 2019, more weeks without rainfall, associated to temperatures > 16 °C and RH < 60%, were recorded during March–May in the majority of the sites (Figures S1–S3).

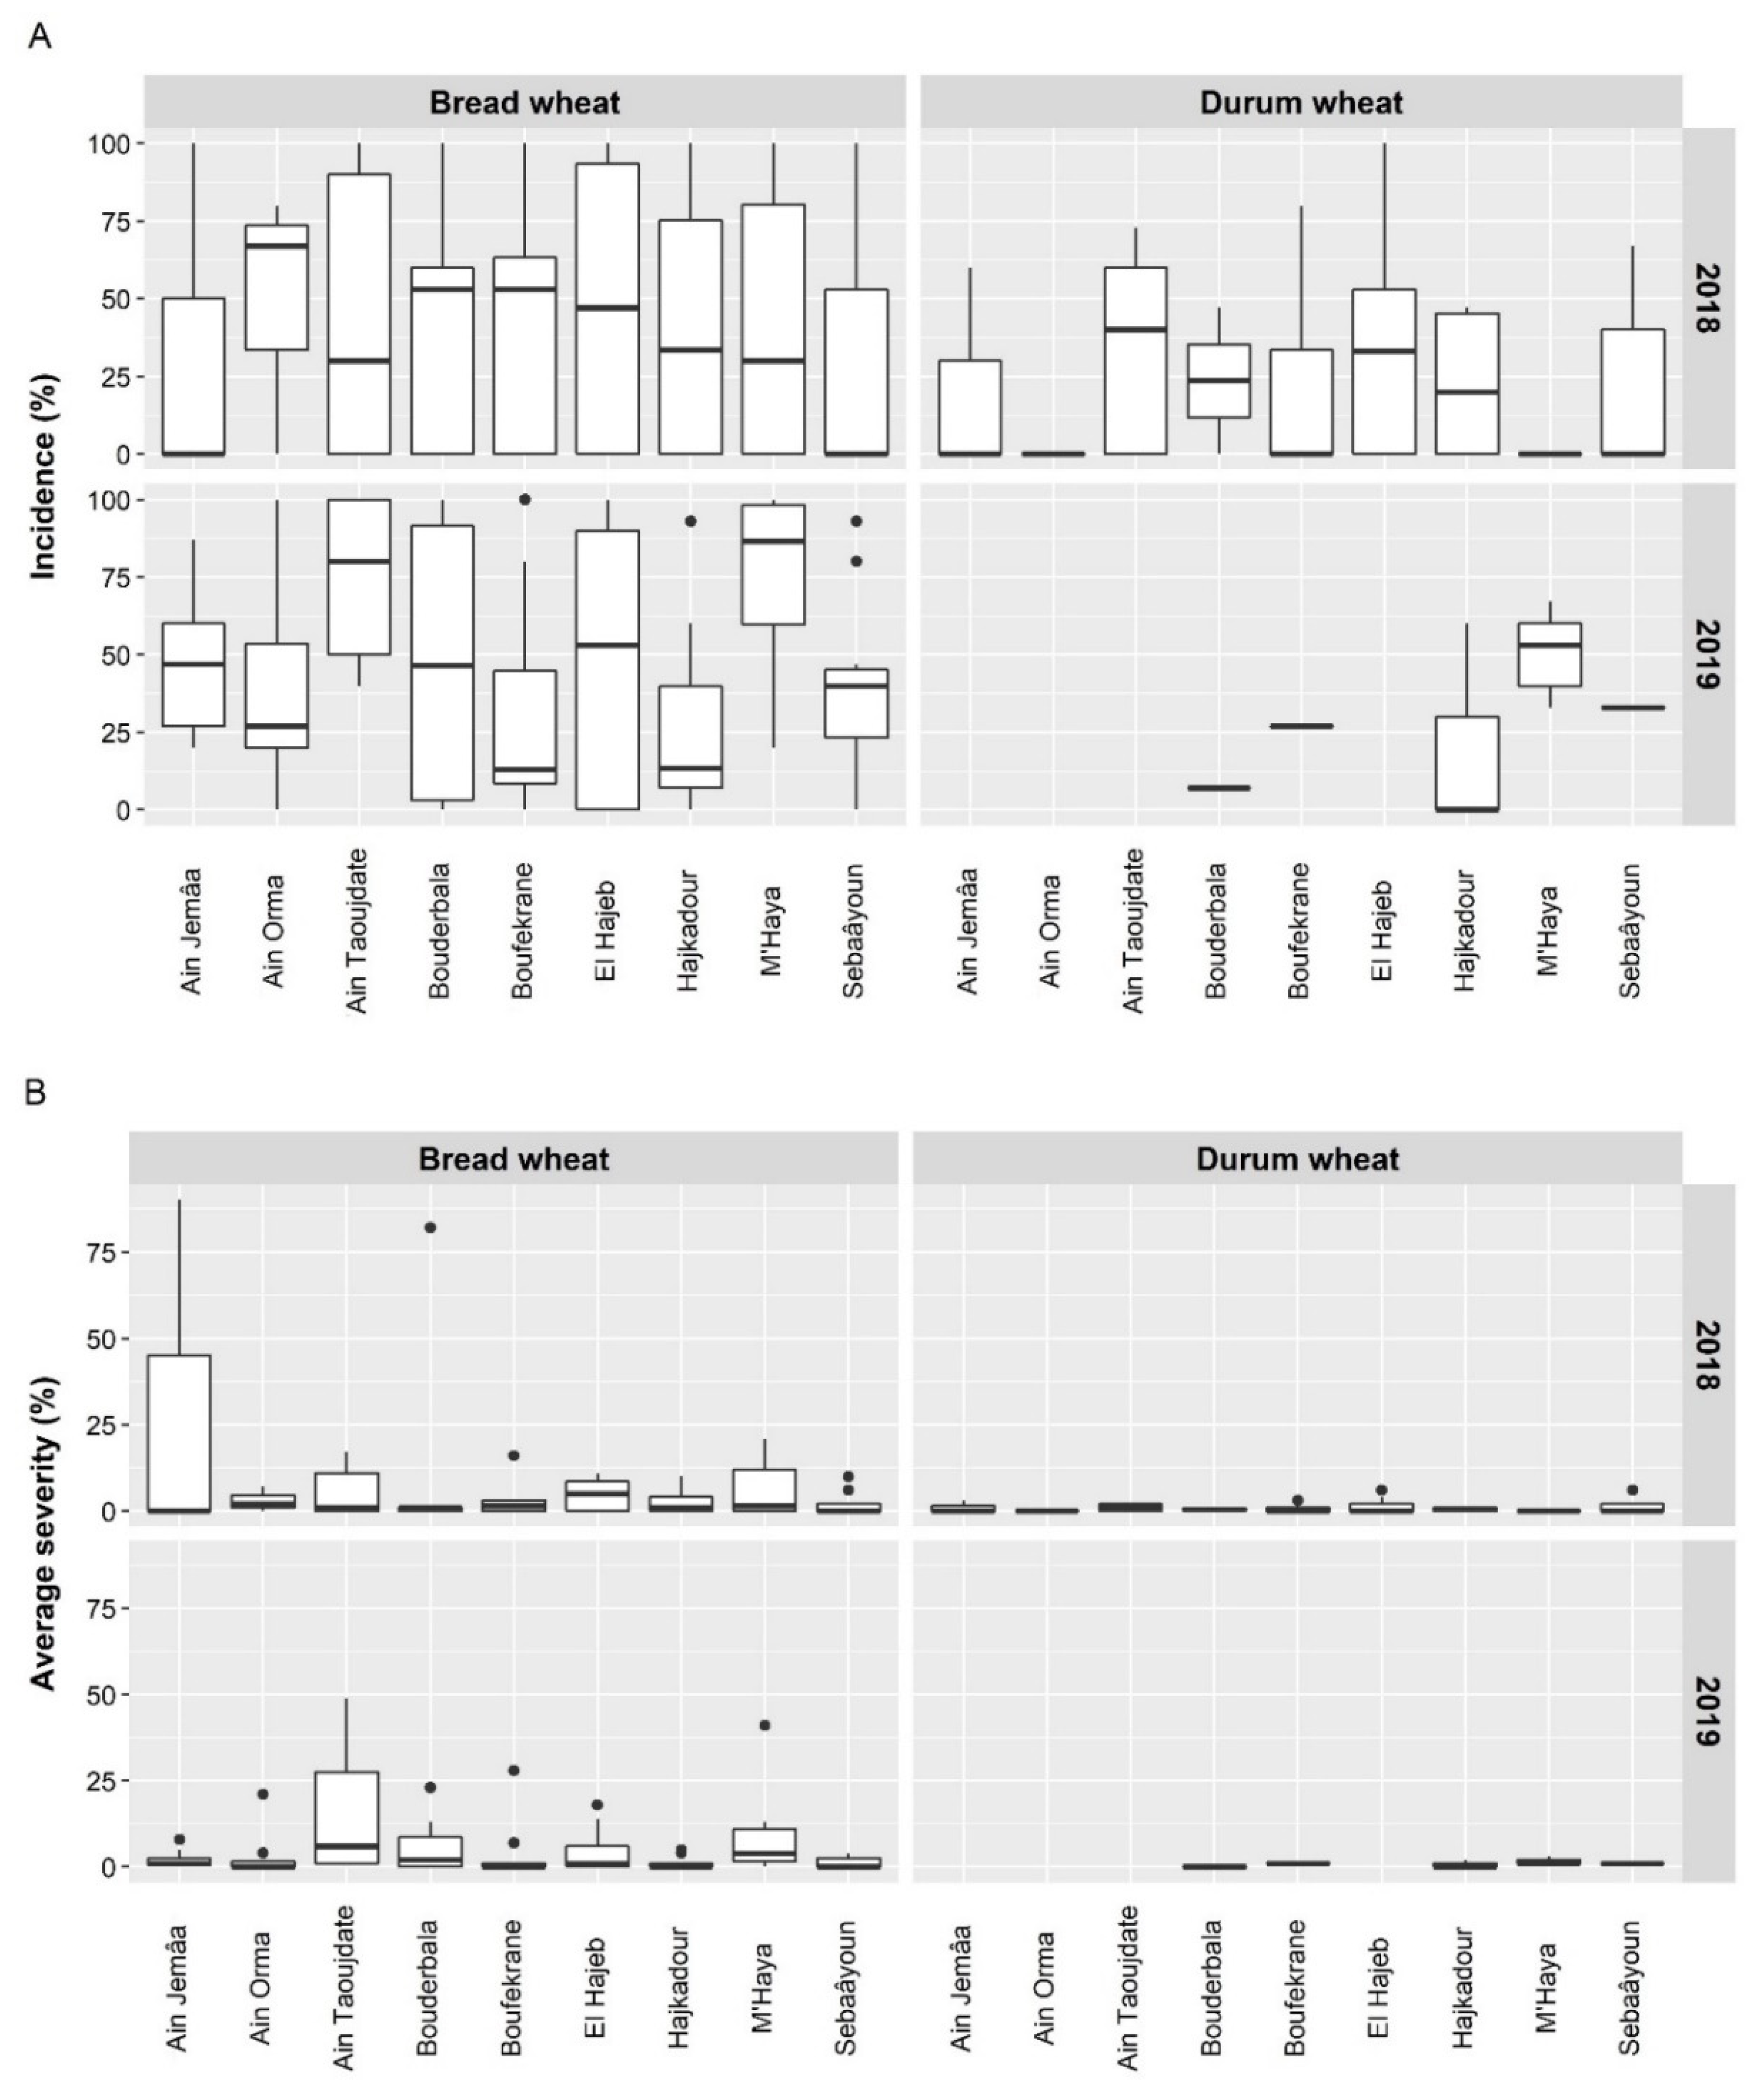
3.2. Incidence and Severity of Wheat Stripe Rust during the Survey

During the two cropping seasons, WSR occurred predominantly in bread wheat fields (Figure 3A). The ANOVA of the mean disease severities revealed a statistically significant difference between sites (P < 0.001; F-value = 16.77), between years (P < 0.001; F-value = 71.28), and between wheat species (P < 0.001; F-value = 50.17) (Table S1). This confirms that the difference of weather conditions between sites, as well as the difference of wheat species, has an influence on WSR severity.
In 2018, 57% of the total surveyed fields (49 fields) infected by P. striiformis were of bread wheat (Table S2). The majority of bread wheat fields reached 100% of WSR incidence in that specific cropping season; the only exception was M’Haya where up to 80% of incidence was recorded (Figure 3A and Figure 4). Similar patterns were observed in 2019. In durum wheat, higher WSR incidences were recorded in 2018 compared to 2019. In that latter year, the maximum incidence was 67% and was recorded at M’Haya (Figure 3A and Figure 4). WSR was more severe in bread wheat fields at all surveyed sites (Figure 3B and Figure 4). The severity rates were up to 90% and up to 49% in 2018 and 2019, respectively, with highest proportions observed at Bouderbala and Ain Jemaâ in 2018 (82% and 90%, respectively). In 2019, increased proportions of WSR severities were observed in five locations out of nine, with the maximum severity (49%) recorded at Ain Taoujdate. Note these variations of WSR incidence and severity by site must be interpreted cautiously given the lack of information about the resistance level to WSR of the Moroccan cultivars.
The levels of incidence and severity in bread wheat as observed in this study were similar to those reported across the study region. Indeed, Hodson [48] reported that in 2013 WSR was detected in 40% of the bread wheat fields surveyed in in the Saïs plain, with severities often > 50%. A reason of varying levels of WSR severity during the surveys could be the presence of other fungal diseases such as brown rust (caused by Puccinia triticina) and Septoria tritici blotch (caused by Zymoseptoria tritici). The decrease in WSR severity from 2018 to 2019 at two of the sites with the highest disease rate in the first growing season (Ain Jemaâ and Bouderbala, from 90% to 8%, and 82% to 21%, respectively) or the relatively low severities recorded at some sites in 2019 suggest that changes in management practices, e.g., crop rotation, fungicide composition (use of active chemical ingredients such as propiconazol in combination with azoxystrobin), and the use of resistant cultivars [49], were probably adopted to minimize the adverse effects of the disease pressure. Moreover, wheat fields with no disease symptom might have received fungicidal applications as this practice has become more common in the Saïs plain. It is worth noting that the resistance of current wheat cultivars in the study areas is increasingly being weakened due to the occurrence and rapid spread of a new virulent race of P. striiformis, temporarily designated PstS14 [virulence pattern: Yr-,2,3,-,-,6,7,8,9,-,-,17,-,25,-,32,Sp,AvS,-] [30].

3.3. Weather Conditions Conducive to Infections by Puccinia Striiformis at the Moroccan Sites

The analysis of classes of dominant R and T intervals associated to each RH interval over a minimum of four or eight uninterrupted hours when such conditions were met, showed that WSR infection events were predicted with good accuracy for combined effect of RH > 90%, R ≤ 0.1 mm, and 8 °C < T < 16 °C (class C1 in Table 3). From the defined weekly frequencies of the combined weather variables classes, the 5% and 10% thresholds were those resulting in better scores (Table 3). POD values for class C1 were all 1.00. FAR and CSI were 0.20 and 0.80, respectively, when a minimum period of four uninterrupted hours was considered. The corresponding values for a minimum period of eight uninterrupted hours being 0.30 to 0.70, respectively (Table 3). At thresholds ≥ 15% infection events by P. striiformis were poorly simulated, regardless of the class of combined weather variables or category of consecutive hours (POD and CSI were very close to, or equal to 0; Table 3). Consequently, in the surveyed Moroccan sites, a combined effect of RH > 90%, R ≤ 0.1 mm, and 8 °C < T < 16 °C during a minimum of four continuous hours at the 5% or 10% threshold over a given week of March–May, the probability of infection by P. striiformis and subsequent development of WSR is very high.
The favorable weather conditions conducive to infection by P. striiformis found in the surveyed Moroccan sites are in line with reported studies [14,15,31,50,51]. Indeed, in Luxembourg, El Jarroudi et al. [15] found that a combination of RH > 92%, R ≤ 0.1 mm, and 4 °C < T < 16 °C over a minimum of four consecutive hours were favorable to the development of WSR epidemics. De Vallavieille-Pope et al. [31] reported that in controlled conditions (i.e., air-filtered chamber experiment inside a greenhouse) the optimal air temperatures favoring infections by P. striiformis under non-limiting wetness duration ranged from 5 °C to 12 °C. Air temperatures during the February–June period were the most influential factor for noticeable WSR severity and damaging epidemic [14].

3.4. Performance of the Weather-Based Model for Predicting WSR Infection Events

Several periods of WSR infection events were predicted in 2018 using the weather-based model, with proportions varying according to site (Figure 5 and Figure 6). In 2019 fewer infection events were predicted (Figure 7). The results of the model performance are presented in Table 4. Overall, the model performed well for bread wheat compared to durum wheat. In the calibration phase, POD values were equaled 1.00 for both wheats, while the higher FAR (0.40) and lower CSI (0.60) were found for durum wheat. While evaluating the model using independent data from the 2018 cropping season (i.e., data for the three sites not considered in the model calibration step), the same pattern of performance was observed (model evaluation #1; Table 4). For the 2019 cropping season, in addition to the good performance observed for bread wheat (POD = 0.92, FAR = 0.10, CSI = 0.86), the model improved in predicting WSR infection events in durum wheat with POD = 1, FAR = 0.17, and CSI = 0.83 (Table 4).
The performance of the weather-based model in Moroccan conditions were comparable to that of a model developed for winter wheat in Luxembourg using similar approach [15], supporting thus the replicability of the modelling approach used. Indeed, in case of Luxembourg, the POD were ≥ 0.90; FAR values were ≤ 0.38 on average; and CSI values ranged from 0.63 to 1 [15]. With more WSR monitoring data becoming available in Morocco, opportunities for improving this weather-based model and/or developing wheat species-specific models (i.e., two separate models) are expected.
In drier conditions as it was observed in 2019 at all the surveyed sites in Morocco, which resulted in low WSR severities, the model was able to predict WSR infection events satisfactorily for both wheats (Table 4, Figure 7). Such a feature can be exploited for managing fungicide sprays. Providing favorable weather conditions are met, the progress of WSR under field conditions is also affected by factors such as topography, the presence of inoculum in sufficient amount, the cultivar’s susceptibility to WSR, and management practices (fungicides, crop rotation). All these factors can influence the prevalence of the disease and its impacts of yield. For a better use of the weather-based model within a decision-support tool, it is critical to consider these factors.
The likelihood of WSR epidemic outbreaks is crucial to farmers for a better management of the disease. Yield losses caused by fungal pathogens in fields across the study region are on average up to 20% and 10% on bread and durum wheats, respectively [6]. With the variations in P. striiformis populations [10,18], which increases the susceptibility of current wheat cultivars, especially bread wheat cultivars [30], farmers are increasingly relying on agrochemicals to mitigate the adverse effects of WSR epidemics on yield. Thus, the weather-based model can help guide fungicide sprays throughout the cropping season. During pre-season, the model could be used for simulating the potential WSR infection events based on seasonal climate forecasts. Providing such data are readily available for the study region, the outputs of the weather-based model can guide the choice of the cultivars to sow (i.e., resistant cultivars if weather forecasts are conducive to more WSR infection events and subsequent epidemics). Growing of resistant cultivars is considered as an efficient, economic, and environmentally friendly approach to control WSR [52,53]. Other alternatives include shifting to more durum wheat cultivation given the low prevalence of WSR as it was observed in this study.
In this study we assumed, for a given wheat species, that all the cultivars had similar response to WSR. The actual level of resistance may have influenced the incidences and severities observed during the study period. With different growth stages recorded at the selected sites, and often between fields at a given site (Table 1), WSR may have also developed differently. Regular visits of the selected sites for a better assessment of the disease progress were difficult to carry out due to logistic issues. Improving the weather-based model developed in this study will involve the consolidation of a good dataset, along with further researches on the susceptibility to WSR of the main cultivars grown in the study area and the impact of WSR on grain yield.

4. Conclusions

Interactions between weather conditions and WSR pathogen Puccinia striiformis and wheat plants determine whether infection occurs and the disease develops to destructive epidemic levels that may cause significant economic loss. We developed a weather-based model for predicting WSR infection events at representative sites in Moroccan wheat-growing regions. The optimum ranges of favorable rainfall, relative humidity, and air temperature conditions, conducive to WSR epidemics were determined and used for building the model. Overall, WSR infection events during the 2017/2018 and 2018/2019 cropping seasons were satisfactorily predicted for both bread and durum wheats during the most critical infection period (March–May) using the weather-based model. As a first of its kind for Morocco in terms of WSR disease risk model, our findings are very promising and encouraging. With background knowledge of the region and levels of resistance of wheat cultivars to WSR, along with solid field monitoring data, such a weather-based model could be improved, and ultimately be embedded within a decision support tool for an improved management of WSR epidemics in wheat across Morocco.

Supplementary Materials

The following are available online at https://www.mdpi.com/2073-4395/10/2/280/s1, Table S1: Summary of the ANOVA. Table S2: Wheat stripe rust severity and incidence at the selected Moroccan sites during the study period. Figure S1: Frequencies of air temperature, relative humidity and rainfall at the weekly time scale during January–May 2018 and 2019 in Ain Arma, Ain Jemaa and Ain Taoujdate, Morocco. Figure S2: Frequencies of air temperature, relative humidity and rainfall at the weekly time scale during January–May 2018 and 2019 in El Bouderbala, Boufekrane and Hajkadour, Morocco. Figure S3: Frequencies of air temperature, relative humidity and rainfall at the weekly time scale during January–May 2018 and 2019 in El Hajeb, Mhaya and Sebaayoun, Morocco.

Author Contributions

Conceptualization, M.E.J. (Moussa El Jarroudi) and L.K.; methodology, M.E.J. (Moussa El Jarroudi), L.K. and R.L.; formal analysis, M.E.J. (Moussa El Jarroudi) and L.K.; formal analysis—climate data and GIS, A.B. and A.D.; resources, R.L., M.B. and B.T.; writing—original draft preparation, L.K. and M.E.J. (Moussa El Jarroudi); writing—review and editing, L.K., M.E.J. (Moussa El Jarroudi), R.L., A.D., A.B., M.E.J. (Mustapha El Jarroudi), M.B., H.M. and B.T. All authors have read and agree to the published version of the manuscript.

Funding

This research was funded by Phytopathology Unit of the Department of Plant Protection, Ecole Nationale d’Agronomie (ENA), Meknès, Morocco.

Acknowledgments

We would like to thank Siham Khanfri, Chaimae El Hmaidi and all the technicians involved in data collection.

Conflicts of Interest

The authors declare no conflict of interest.

References

  1. Singh, R.P.; Hodson, D.P.; Huerta-Espino, J.; Jin, Y.; Njau, P.; Wanyera, R.; Herrera-Foessel, S.A.; Ward, R.W. Will Stem Rust Destroy the World’s Wheat Crop? In Advances in Agronomy; Academic Press: Cambridge, MA, USA, 2008; Volume 98, pp. 271–309. [Google Scholar]
  2. Dean, R.; Van Kan, J.A.L.; Pretorius, Z.A.; Hammond-Kosack, K.E.; Di Pietro, A.; Spanu, P.D.; Rudd, J.J.; Dickman, M.; Kahmann, R.; Ellis, J.; et al. The top 10 fungal pathogens in molecular plant pathology. Mol. Plant Pathol. 2012, 13, 414–430. [Google Scholar] [CrossRef] [PubMed] [Green Version]
  3. Pardey, P.G.; Beddow, J.M.; Kriticos, D.J.; Hurley, T.M.; Park, R.F.; Duveiller, E.; Sutherst, R.W.; Burdon, J.J.; Hodson, D. Right-sizing stem-rust research. Science 2013, 340, 147–148. [Google Scholar] [CrossRef] [PubMed]
  4. Singh, R.P.; Singh, P.K.; Rutkoski, J.; Hodson, D.P.; He, X.; Jørgensen, L.N.; Hovmøller, M.S.; Huerta-Espino, J. Disease impact on wheat yield potential and prospects of genetic control. Annu. Rev. Phytopathol. 2016, 54, 303–322. [Google Scholar] [CrossRef] [PubMed] [Green Version]
  5. Beddow, J.M.; Pardey, P.G.; Chai, Y.; Hurley, T.M.; Kriticos, D.J.; Braun, J.-C.; Park, R.F.; Cuddy, W.S.; Yonow, T. Research investment implications of shifts in the global geography of wheat stripe rust. Nat. Plants 2015, 1, 15132. [Google Scholar] [CrossRef] [PubMed]
  6. Khanfri, S.; Boulif, M.; Lahlali, R. Yellow rust (Puccinia striiformis): a serious threat to wheat production worldwide. Not. Sci. Biol. 2018, 10. [Google Scholar] [CrossRef] [Green Version]
  7. Hovmøller, M.S.; Walter, S.; Justesen, A.F. Escalating threat of wheat rusts. Science 2010, 329, 369. [Google Scholar] [CrossRef] [Green Version]
  8. Hovmøller, M.S.; Walter, S.; Bayles, R.A.; Hubbard, A.; Flath, K.; Sommerfeldt, N.; Leconte, M.; Czembor, P.; Rodriguez-Algaba, J.; Thach, T.; et al. Replacement of the European wheat yellow rust population by new races from the centre of diversity in the near-Himalayan region. Plant Pathol. 2016, 65, 402–411. [Google Scholar] [CrossRef] [Green Version]
  9. Hovmøller, M.S.; Rodriguez-Algaba, J.; Thach, T.; Sørensen, C. Race typing of Puccinia striiformis on wheat. In Methods in Molecular Biology; Periyannan, S., Ed.; Humana Press: New York, NY, USA, 2017. [Google Scholar]
  10. Ali, S.; Rodriguez-Algaba, J.; Thach, T.; Sørensen, C.K.; Hansen, J.G.; Lassen, P.; Nazari, K.; Hodson, D.P.; Justesen, A.F.; Hovmøller, M.S. Yellow rust epidemics worldwide were caused by pathogen races from divergent genetic lineages. Front. Plant Sci. 2017, 8, 1057. [Google Scholar] [CrossRef] [Green Version]
  11. Ezzahiri, B.; Yahyaoui, A.; Hovmøller, M.S. An analysis of the 2009 Epidemic of yellow rust on wheat in Morocco. In Proceedings of the 4th Regional Yellow Rust Conference for Central and West Asia and North Africa, Antalya, Turkey, 10–12 October 2009. [Google Scholar]
  12. Mert, Z.; Nazari, K.; Karagöz, E.; Akan, K.; Öztürk, İ.; Tülek, A. First incursion of the Warrior race of wheat stripe rust (Puccinia striiformis f. sp. tritici) to Turkey in 2014. Plant Dis. 2015, 100, 528. [Google Scholar] [CrossRef]
  13. Milus, E.A.; Kristensen, K.; Hovmøller, M.S. Evidence for increased aggressiveness in a recent widespread strain of Puccinia striiformis f.sp. tritici causing stripe rust of wheat. Phytopathology 2009, 99, 89–94. [Google Scholar] [CrossRef] [Green Version]
  14. Te Beest, D.E.; Paveley, N.D.; Shaw, M.W.; van den Bosch, F. Disease–weather relationships for powdery mildew and yellow rust on winter wheat. Phytopathology 2008, 98, 609–617. [Google Scholar] [CrossRef] [Green Version]
  15. El Jarroudi, M.; Kouadio, L.; Bock, C.H.; El Jarroudi, M.; Junk, J.; Pasquali, M.; Maraite, H.; Delfosse, P. A threshold-based weather model for predicting stripe rust infection in winter wheat. Plant Dis. 2017, 101, 693–703. [Google Scholar] [CrossRef] [Green Version]
  16. Zadoks, J.C. Yellow rust on wheat: Studies in epidemiology and physiologic specialisation. Tijdschr.Planteziekten 1961, 67, 69–256. [Google Scholar] [CrossRef]
  17. Gladders, P.; Langton, S.D.; Barrie, I.A.; Taylor, M.C.; Paveley, N.D. The importance of weather and agronomic factors for the overwinter survival of yellow rust (Puccinia striiformis) and subsequent disease risk in commercial wheat crops in England. Ann. Appl. Biol. 2007, 150, 371–382. [Google Scholar] [CrossRef]
  18. Hovmoller, M.S.; Justesen, A.F.; Brown, J.K.M. Clonality and long-distance migration of Puccinia striiformis f.sp. tritici in north-west Europe. Plant Pathol. 2002, 51, 24–32. [Google Scholar] [CrossRef]
  19. Hovmøller, M.S. Sources of seedling and adult plant resistance to Puccinia striiformis f.sp. tritici in European wheats. Plant Breed. 2007, 126, 225–233. [Google Scholar] [CrossRef]
  20. Hovmøller, M.S.; Justesen, A.F. Rates of evolution of avirulence phenotypes and DNA markers in a northwest European population of Puccinia striiformis f. sp tritici. Mol. Ecol. 2007, 16, 4637–4647. [Google Scholar] [CrossRef]
  21. Jin, Y.; Szabo, L.J.; Carson, M. Century-old mystery of Puccinia striiformis life history solved with the identification of Berberis as an alternate host. Phytopathology 2010, 100, 432–435. [Google Scholar] [CrossRef] [Green Version]
  22. Rodriguez-Algaba, J.; Walter, S.; Sørensen, C.K.; Hovmøller, M.S.; Justesen, A.F. Sexual structures and recombination of the wheat rust fungus Puccinia striiformis on Berberis vulgaris. Fungal Genet. Biol. 2014, 70, 77–85. [Google Scholar] [CrossRef]
  23. Zhao, J.; Wang, L.; Wang, Z.; Chen, X.; Zhang, H.; Yao, J.; Zhan, G.; Chen, W.; Huang, L.; Kang, Z. Identification of eighteen Berberis species as alternate hosts of Puccinia striiformis f. sp. tritici and virulence variation in the pathogen isolates from natural infection of barberry plants in China. Phytopathology 2013, 103, 927–934. [Google Scholar] [CrossRef] [Green Version]
  24. Rodriguez-Algaba, J.; Hovmøller, M.S.; Justesen, A.F. Sexual recombination within the “Kranich” race of the yellow rust fungus Puccinia striiformis f.sp. tritici on Berberis vulgaris. Eur. J. Plant Pathol. 2020. [Google Scholar] [CrossRef]
  25. FAO. GIEWS Country Brief: Morocco; Food and Agriculture Organization of the United Nations (FAO): Rome, Italy, 2018. [Google Scholar]
  26. Tidiane Sall, A.; Chiari, T.; Legesse, W.; Seid-Ahmed, K.; Ortiz, R.; van Ginkel, M.; Bassi, M.F. Durum wheat (Triticum durum Desf.): Origin, cultivation and potential expansion in Sub-Saharan Africa. Agronomy 2019, 9, 263. [Google Scholar] [CrossRef] [Green Version]
  27. Ministry of Agriculture and Fisheries. Kingdom of Morocco Ministry of Agriculture and Fisheries-Department of Agriculture. Available online: http://www.agriculture.gov.ma/en/ (accessed on 29 January 2020).
  28. USDA. Morocco. Grain and Feed Annual-2016 Annual Report. United States Department of Agriculture (USDA) Foreign Agricultural Service, Gobal Agricultural Information Network (GAIN). GAIN Report number: MO1602. Date: 30 March 2016. Available online: https://apps.fas.usda.gov/newgainapi/api/report/downloadreportbyfilename?filename=Grain%20and%20Feed%20Annual_Rabat_Morocco_3-30-2016.pdf (accessed on 29 January 2020).
  29. USDA. Morocco. Grain and Feed Annual-Early returns turn to losses after three-month drought. United States Department of Agriculture (USDA) Foreign Agricultural Service, Gobal Agricultural Information Network (GAIN). GAIN Report number: MO1912. Date: 4 December 2019. Available online: https://apps.fas.usda.gov/newgainapi/api/report/downloadreportbyfilename?filename=Grain%20and%20Feed%20Annual_Rabat_Morocco_4-12-2019.pdf (accessed on 29 January 2020).
  30. Ramdani, A.; Nazari, K.; Hodson, D.; Thach, T.; Algaba, J.R.; Hovmøller, M.S. Outbreak of wheat yellow rust disease under Moroccan conditions during 2016-2017 cropping season. In Proceedings of the 2018 Borlaug Global Rust Initiative (BGRI) Technical Workshop, Marrakech, Morocco, 14–17 April 2018. [Google Scholar]
  31. De Vallavieille-Pope, C.; Huber, L.; Leconte, M.; Goyau, H. Comparative effects of temperature and interrupted wet periods on germination, penetration and infection of Puccinia recondita f.sp. tritici and P. striiformis on wheat seedlings. Phytopathology 1995, 85, 409–415. [Google Scholar] [CrossRef]
  32. De Vallavieille-Pope, C.; Giosue, S.; Munk, L.; Newton, A.C.; Niks, R.E.; Østergård, H.; Pons-kühnemann, J.; Rossi, V.; Sache, I. Assessment of epidemiological parameters and their use in epidemiological and forecasting models of cereal airborne diseases. Agron. Sustain. Dev. 2000, 20, 715–727. [Google Scholar] [CrossRef]
  33. de Vallavieille-Pope, C.; Bahri, B.; Leconte, M.; Zurfluh, O.; Belaid, Y.; Maghrebi, E.; Huard, F.; Huber, L.; Launay, M.; Bancal, M.O. Thermal generalist behaviour of invasive Puccinia striiformis f. sp. tritici strains under current and future climate conditions. Plant Pathol. 2018, 67, 1307–1320. [Google Scholar] [CrossRef] [Green Version]
  34. Newlands, N.K. Model-based forecasting of agricultural crop disease risk at the regional scale, integrating airborne inoculum, environmental, and satellite-based monitoring data. Front. Environ. Sci. 2018, 6. [Google Scholar] [CrossRef] [Green Version]
  35. Line, R.F. Stripe rust of wheat and barley in North America: A retrospective historical review. Annu. Rev. Phytopathol. 2002, 40, 75–118. [Google Scholar] [CrossRef]
  36. Coakley, S.M.; McDaniel, L.R.; Line, R.F. Quantifying how climatic factors affect variation in plant disease severity: A general method using a new way to analyze meteorological data. Clim. Chang. 1988, 12, 57–75. [Google Scholar] [CrossRef]
  37. Coakley, S.M.; Line, R.F.; McDaniel, L.R. Predicting stripe rust severity on winter wheat using an improved method for analyzing meteorological and rust data. Phytopathology 1988, 78, 543–550. [Google Scholar] [CrossRef]
  38. El Jarroudi, M.; Kouadio, L.; Beyer, M.; Junk, J.; Hoffmann, L.; Tychon, B.; Maraite, H.; Bock, C.H.; Delfosse, P. Economics of a decision–support system for managing the main fungal diseases of winter wheat in the Grand-Duchy of Luxembourg. Field Crops Res. 2015, 172, 32–41. [Google Scholar] [CrossRef] [Green Version]
  39. Gommes, R.; El Hairech, T.; Rosillon, D.; Balaghi, R.; Kanamaru, H. Impact of Climate Change on Agricultural Yields in Morocco; Food and Agriculture Organization of the United Nations (FAO): Rome, Italy, 2007. [Google Scholar]
  40. Doutreloup, S.; Wyard, C.; Amory, C.; Kittel, C.; Erpicum, M.; Fettweis, X. Sensitivity to convective schemes on precipitation simulated by the regional climate model MAR over Belgium (1987–2017). Atmosphere 2019, 10, 34. [Google Scholar] [CrossRef] [Green Version]
  41. Doutreloup, S.; Kittel, C.; Wyard, C.; Belleflamme, A.; Amory, C.; Erpicum, M.; Fettweis, X. Precipitation evolution over Belgium by 2100 and sensitivity to convective schemes using the regional climate model MAR. Atmosphere 2019, 10, 321. [Google Scholar] [CrossRef] [Green Version]
  42. Peterson, R.F.; Campbell, A.B.; Hannah, A.E. A diagrammatic scale for estimating rust intensity on leaves and stems of cereals. Can. J. Res. 1948, 26c, 496–500. [Google Scholar] [CrossRef]
  43. Dennis, J.I. Temperature and wet-period conditions for infection by Puccinia striiformis f.sp. tritici race 104E137A +. Trans. Br. Mycol. Soc. 1987, 88, 119–121. [Google Scholar] [CrossRef]
  44. Zadoks, J.C. Systems analysis and the dynamics of epidemics. Phytopathology 1971, 61, 600–610. [Google Scholar] [CrossRef]
  45. FAO. GIEWS Country Brief: Morocco; Food and Agriculture Organization of the United Nations (FAO): Rome, Italy, 2019. [Google Scholar]
  46. Crown, M.D. Validation of the NOAA Space Weather Prediction Center’s solar flare forecasting look-up table and forecaster-issued probabilities. Space Weather 2012, 10, S06006. [Google Scholar] [CrossRef]
  47. El Jarroudi, M.; Delfosse, P.; Maraite, H.; Hoffmann, L.; Tychon, B. Assessing the accuracy of simulation model for Septoria leaf blotch disease progress on winter wheat. Plant Dis. 2009, 93, 983–992. [Google Scholar] [CrossRef] [Green Version]
  48. Hodson, D. Morocco Rust Survey Summary-Leaf Rust and Yellow Rust Both Widespread; RustTracker.org-A global wheat rust monitoring system:CIMMYT-Ethiopia: Addis Ababa, Ethiopia, 2010. [Google Scholar]
  49. Rharrabti, Y.; Elhani, S. Using path analysis to evaluate breeding progress in grain yield and related characters of durum wheat in Morocco. Int. J. Inn. Appl. St. 2014, 9, 1224. [Google Scholar]
  50. Rapilly, F. Yellow rust epidemiology. Annu. Rev. Phytopathol. 1979, 17, 59–73. [Google Scholar] [CrossRef]
  51. Sache, I. Short-distance dispersal of wheat rust spores. Agronomie 2000, 20, 757–767. [Google Scholar] [CrossRef]
  52. Chen, X. Epidemiology and control of stripe rust [Puccinia striiformis f. sp. tritici] on wheat. Can. J. Plant Pathol. 2005, 27, 314–337. [Google Scholar] [CrossRef]
  53. Chen, X. High-temperature adult-plant resistance, key for sustainable control of stripe rust. Am. J. Plant Sci. 2013, 4, 608. [Google Scholar] [CrossRef] [Green Version]
Figure 1. Location of the nine sites (white circles) surveyed during the 2017/2018 and 2018/2019 cropping seasons in Morocco.
Agronomy 10 00280 g001
Figure 2. Descriptive flowchart of the modeling approach for predicting infection events of wheat stripe rust caused by Puccinia striiformis.
Agronomy 10 00280 g002
Figure 3. Observed incidences (A) and severities (B) of wheat stripe rust in bread and durum wheat fields at the surveyed sites in Morocco during the 2017/2018 and 2018/2019 cropping seasons.
Agronomy 10 00280 g003
Figure 4. Maps of maximum percentages of wheat stripe rust incidence and severity (%) in bread and durum wheat at the surveyed sites in Morocco during the 2017/2018 and 2018/2019 cropping seasons. The position of the circle corresponds to the site coordinates as presented in Figure 1.
Agronomy 10 00280 g004
Figure 5. Model calibration phase: simulated infection events per day (bars) and number of completed latency periods (lines) during March–May 2018. The calibration was performed using data of 2017/2018 cropping season for six sites (Ain Jemâa, Ain Orma, Ain Taoujdate, Boufekrane, El Hajeb, and M’Haya).
Agronomy 10 00280 g005
Figure 6. Model evaluation #1: simulated infection events per day (bars) and number of completed latency periods (lines) during March–May 2018. The model evaluation #1 was performed using data of 2017/2018 cropping season for three sites (Bouderbala, Hajkadour and Sebaâyoun).
Agronomy 10 00280 g006
Figure 7. Simulated infection events per day (bars) and number of completed latency periods (lines) during March–May 2019. Observed data for the sites Bouderbala, Boufekrane, Hajkadour, M’Haya, and Sebaâyoun were used in the model evaluation #2 phase.
Agronomy 10 00280 g007
Table 1. Agronomic details for bread and durum wheat at all surveyed sites in Morocco during the 2017/2018 and 2018/2019 cropping seasons.
Bread WheatDurum Wheat
LocationYearObservation DateGrowth StageN.F 1Growth StageN.FTotal N.F
Ain Jemâa201823 Mayn.a. 23n.a.36
20196 MayMilk stage–Dough stage11 011
Ain Orma20187–14 Mayn.a.3n.a.14
20197 MayMilk stage–Dough stage11 011
Ain Taoujdate201824 Mayn.a.6n.a.915
201925 AprilMilk stage–Dough stage11 011
Bouderbala201827 April; 16 Mayn.a.5n.a.27
201911-AprilHeading–Flowering10Flowering111
Boufekrane201814–15 Mayn.a.8n.a.715
20199-AprilBooting–Heading–Flowering10Heading111
El Hajeb201826 April; 7–9 Mayn.a.7n.a.1320
20194 AprilTillering–Booting/Heading–Flowering11 011
Hajkadour201826 April–7 Mayn.a.4n.a.610
20192 AprilHeading–Flowering8Heading—Flowering311
M’Haya201823 Mayn.a.6n.a.17
20193 MayMilk stage–Dough stage6Milk stage—Dough stage511
Sebaâyoun201826 April; 7–9 Mayn.a.9n.a.514
201916 AprilFlowering–Milk stage10Milk stage111
Total 2018 51 4798
Total 2019 88 1199
1N.F, Number of fields; 2 data not available.
Table 2. The classes of air temperature (T), relative humidity (RH) and rainfall (R) considered with hourly data in the frequency analysis for each week during the March–May period.
VariableClass
Temperature (°C)T <00< T ≤ 44< T ≤ 88< T ≤ 1212< T ≤ 1616< T ≤ 20T > 18
Relative humidity (%)RH ≤ 6060 < RH ≤ 7575 < RH ≤ 8585 < RH ≤ 90RH > 90
Rainfall (mm)R = 00 < R ≤ 11 < R ≤ 5R > 5
Table 3. Model calibration: statistical contingency scores for different classes of combined weather variables according to defined thresholds. These thresholds correspond the frequencies over a week during the March–May period. All combinations of weather variables included rain ≤ 0.1 mm. Data for occurrence of wheat stripe rust (WSR) for six study sites (Ain Jemâa, Ain Orma, Ain Taoujdate, Boufekrane, El Hajeb, and M’Haya) were pooled.
Minimum of 4 Continuous Hours Minimum of 8 Continuous Hours
Threshold 1Combination Class 2POD 3FAR 4CSI 5PODFARCSI
5%C11.000.200.801.000.300.70
C21.000.480.521.000.570.43
C31.000.830.171.000.850.15
C41.000.950.051.000.970.03
C50.001.000.000.001.000.00
10%C11.000.300.701.000.400.60
C21.000.630.371.000.750.25
C31.000.880.121.000.920.08
C41.000.970.031.000.980.02
C50.001.000.000.001.000.00
15%C11.000.450.551.000.550.45
C21.000.780.221.000.930.07
C31.000.930.071.000.950.05
C40.001.000.000.001.000.00
C50.001.000.000.001.000.00
20%C11.000.570.431.000.670.33
C21.000.880.121.000.980.02
C31.000.970.031.000.970.03
C40.001.000.000.001.000.00
C50.001.000.000.001.000.00
25%C11.000.670.331.000.730.27
C21.000.970.031.000.980.02
C31.000.970.031.000.980.02
C40.001.000.000.001.000.00
C50.001.000.000.001.000.00
30%C11.000.730.271.000.750.25
C21.000.980.021.000.980.02
C31.000.970.031.000.980.02
C40.001.000.000.001.000.00
C50.001.000.000.001.000.00
35%C11.000.780.221.000.780.22
C21.000.980.021.000.980.02
C30.001.000.000.001.000.00
C40.001.000.000.001.000.00
C50.001.000.000.001.000.00
1 For example, for all cases where 5% of weather class C1 were observed during a given week of March–May, the forecasted and observed disease infection events during that period were used to calculate the contingency scores POD, FAR and CSI. 2 C1-C5: classes of combined weather variables 8 °C < T < 16 °C associated, respectively, with RH > 90% (C1), 80% < RH < 90% (C2), 70% < RH < 80% (C3), 60% < RH < 70% (C4), and RH < 60% (C5). T refers to air temperature and RH is the relative humidity. 3 POD: probability of detection. It corresponds to the probability of forecasting correctly the observed event. Perfect score = 1. 4 FAR: false alarm ratio, is the number of times an event is forecast but is not observed, divided by the total number of forecasts of that event. Perfect score = 0. 5 CSI, critical success index, takes into account both false alarms and missed events. Perfect score = 1.
Table 4. Performance of the weather-based model for predicting infections by Puccinia striiformis in bread and durum wheat fields in Morocco. Data of the 2017/2018 cropping season were used in the calibration step (six sites) and model evaluation #1 (three remaining sites). The model evaluation #2 was carried out using data of the 2018/2019 cropping season. For durum wheat, only infections greater than 2 per day were considered.
SO 1SNO 2NSO 3POD 4FAR 5CSI 6
CalibrationBread wheat571701.000.230.77
Durum wheat271801.000.400.60
Model evaluation #1Bread wheat40601.000.130.87
Durum wheat281301.000.320.68
Model evaluation #2Bread wheat24220.920.100.86
Durum wheat5101.000.170.83
1 Simulated and observed. 2 Simulated but not observed. 3 Not simulated but observed. 4 POD: probability of detection. Perfect score = 1. 5 FAR: false alarm ratio. Perfect score = 0. 6 CSI: critical success index. Perfect score = 1.

