Article

Seed Priming with Carbon Nanomaterials to Modify the Germination, Growth, and Antioxidant Status of Tomato Seedlings

by
Elsy Rubisela López-Vargas
1,
Yolanda González-García
1,
Marissa Pérez-Álvarez
2,
Gregorio Cadenas-Pliego
3,
Susana González-Morales
4,
Adalberto Benavides-Mendoza
4,
Raul I. Cabrera
5 and
Antonio Juárez-Maldonado
6,*
1
Doctorado en Agricultura Protegida, Universidad Autónoma Agraria Antonio Narro, Saltillo, Coahuila 25315, Mexico
2
Instituto Mexicano del Petróleo, Ciudad de México 07730, Mexico
3
Centro de Investigación en Química Aplicada, Saltillo, Coahuila 25294, Mexico
4
Departamento de Horticultura, Universidad Autónoma Agraria Antonio Narro, Saltillo, Coahuila 25315, Mexico
5
Rutgers Agricultural Research and Extension Center (RAREC), Rutgers University, Bridgeton, NJ 08302, USA
6
Departamento de Botánica, Universidad Autónoma Agraria Antonio Narro, Saltillo, Coahuila 25315, Mexico
*
Author to whom correspondence should be addressed.
Agronomy 2020, 10(5), 639; https://doi.org/10.3390/agronomy10050639
Submission received: 20 March 2020 / Revised: 19 April 2020 / Accepted: 29 April 2020 / Published: 1 May 2020
(This article belongs to the Special Issue Nanotechnology Applications in Agriculture System)

Abstract

:
The objective of this work was to determine the responses of tomato seed priming with CNMs (carbon nanomaterials), evaluating the changes in germination and biochemical compounds as well as the effect on the growth of tomato seedlings. Five concentrations of CNMs (10, 100, 250, 500, and 1000 mg L−1) were evaluated, as well as an absolute control and a sonicated control. The results showed that seed priming with CNMs did not affect the germination rate of the tomato seeds; however, it negatively affected the vigor variables, such as the root length (up to 39.2%) and hypocotyl biomass (up to 33%). In contrast, the root biomass was increased by the application of both carbon nanotubes and graphene up to 127% in the best case. Seed priming with carbon nanotubes (1000 mg L−1) decreased the plant height (29%), stem diameter (20%), fresh shoot biomass (63%), fresh root biomass (63%), and dry shoot biomass (71%). Seed priming with graphene increased the content of chlorophylls (up to 111%), vitamin C (up to 78%), β-carotene (up to 11 fold), phenols (up to 85%), and flavonoids (up to 45%), as well as the H2O2 content (up to 215%). Carbon nanotubes (CNTs) increased the enzymatic activity (phenylalanine ammonia lyase (PAL), ascorbate peroxidase (APX), glutathione peroxidase (GPX), superoxide dismutase (SOD), and catalase (CAT). In addition, seed priming with high concentrations of CNMs showed negative effects. Seed priming with carbon nanomaterials can potentially improve the development of the tomato crop; therefore, this technique can be used to induce biostimulation and provides an easy way to apply carbon nanomaterials.

1. Introduction

In recent years, the use of nanotechnology in different areas has increased. Proof of this includes the large number of studies on the application of nanomaterials (NMs), such as metal nanoparticles (NPs) and carbon nanomaterials (CNMs), including find single-walled carbon nanotubes (CNTs) (SWCNTs), multi-walled carbon nanotubes (MWCNTs), graphene (GR), and fullerenes [1]. CNMs are of great interest due to their unique chemical and physical properties that make them available for a variety of applications compared to those of the same bulk material [2,3,4]. Among their main properties are their high rigidity, strength, and elasticity compared to other fibrous materials. In addition, they show a high thermal and electrical conductivity compared to other conductive materials [5]. The literature has reported that nanomaterials (NMs) have the ability to induce biostimulation in plants, generating multiple positive responses, such as increased growth and development, performance, and the ability to tolerate different types of stress [2,4,6,7].
Graphene is a crystalline structure of 2D atomic plane graphite (2D) similar to a honeycomb network and is a basic component for other CNMs; a single layer of graphene rolled into a cylinder forms a SWCNT, while a MWCNT consists of two or more sheets of graphene [8]. These have been shown to be toxic to a variety of species, including vertebrates, algae, bacteria, and fungi [9]. Begum et al. [10] reported that the exposure of cabbage (Brassica oleracea var. capitata), tomato (Lycopersicon esculentum), and red spinach (Amaranthus tricolor and Amaranthus lividus) plants to graphene resulted in the inhibition of growth and biomass; in addition, reactive oxygen species (ROS) production and cell death were increased in a concentration-dependent manner. However, Sayes et al. [11] mentioned that the functionalization of the CNMs diminished toxic effects, which could be an alternative solution for this problem.
Favorable effects have also been reported. Zhang et al. [12] showed that the application of graphene oxide (GO) (40 µg mL−1) increased the germination of tomato seeds, because the GO penetrated the husks of the seeds, which facilitated the capture of water. In addition, the content of reduced glutathione was increased, as was the activity of the enzymes glutathione reductase, glutathione peroxidase, and glutathione sulfo-transferase. In the seedlings of forest species, such as Larix olgensis, the application of graphene in low concentrations (25–50 mg L−1) was shown to increase the dry matter of the root, stem and leaves, root length, surface area, volume, and average diameter; however concentrations greater than 100 mg L−1 induced the opposite effect [13]. This clearly indicated that the concentration used is decisive in the observed effects regardless of the species in question.
Regarding CNTs, studies have demonstrated that they can penetrate the roots of the plants and then translocate to the vascular bundles and the to the aerial part by means of the xylem through the transpiration process [7]. They can also penetrate the cell wall, as well as its membrane through pores or channels through the apoplastic route and via endocytosis, so that they can be used as carriers of substances or chemicals inside cells [2,14]. However, CNTs can also act as carriers of pollutants, transporting them to the aerial part of the plants [15]. In addition, derived from these characteristics, CNTs can improve the germination of seeds and the growth of plants. Yousefi et al. [16] reported that seed priming with MWCNTs improved the seed germination percentage, mean germination time, and root and stem lengths, as well as the fresh and dry weights of the roots and stems of Hopbush (Dodonaea viscosa L.) under drought stress. Martínez-Ballesta et al. [17] showed that broccoli plants (Brassica oleracea L. var. Italica) treated with MWCNTs significantly increased their growth (32.7%), and under saline stress conditions, a positive effect was also observed. MWCNTs improved the water absorption in seeds through aquaporins and improved the cation exchange in the cell wall matrix, which increased the concentration of nutrients such as Ca and Fe. These minerals can improve germination and can potentially increase plant growth and development, impacting performance [18]. In addition, the interaction of CNTs with proteins and polysaccharides was found to generate a cascade of signaling that resulted in the accumulation of compounds that led to the thickening of the cell wall and subsequent growth [19].
Several investigations have shown that the applications of these CNMs can have beneficial effects on the growth and development of plants, although inhibition and phytotoxicity can also be observed [2,3,4,7]. This is because they stimulate the production of ROS by interacting with organelles, such as the mitochondria; additionally, in high concentrations, ROS cause an imbalance in the concentration of antioxidant compounds and in the level of oxidative stress of plants, thus causing damage [9,20,21]. However, ROS can also cause positive effects, as they act as signaling agents under stress conditions, triggering cellular responses to produce antioxidant compounds to counteract ROS, which allows the plant to tolerate stress [22,23,24].
The tomato crop is considered one of the most important horticultural crops in the world; it is a vegetable with some of the highest demand and highest economic value. The trade and production of tomatoes are particularly important in the tropical, subtropical, and temperate regions, both for the markets of fresh products and for processing [25]. It is especially important to look for new alternatives based on nanotechnology that allow for improvements in the operation of agricultural crops and that are easy to apply. Therefore, it is very important to study the impact that CNMs can have on production systems in order to improve them. In this context, the present work was developed with the objective of determining the responses of the exposure of tomato seeds to different doses and types of CNMs, evaluating the changes in germination and biochemical compounds, as well as the effect on the growth of seedlings in the short term.

2. Materials and Methods

The experiment was developed in two stages, one in the laboratory and one in the greenhouse. In the laboratory stage, a germination test was carried out on tomato seeds, while in the greenhouse stage, the effect of seed priming with carbon nanomaterials on tomato seedlings was evaluated. In both stages, the seeds were treated with the different carbon nanomaterials. “Pony” hybrid tomato seeds (Harris Moran, Davis, CA, USA) of the saladette type with determined growth were used.

2.1. Characteristics of Carbon Nanomaterials

Two types of carbon nanomaterials were used: carbon nanotubes and graphene. The carbon nanotubes (CNTs) were multilayer, with an out diameter of 30–50 nm, a length of 10–20 μm, and a purity of approximately 95% (Nanostructured and Amorphous Materials, Inc., Houston, TX, USA). The graphene (GR) used was multilayer, with a diameter of 2 μm, a thickness of 8–12 nm, and a purity of 97% (Cheap Tubes Inc., Cambridgeport, VT, USA). The dispersion of the CNMs was determined through the Z potential using a Z potential analyzer (ZetaCheck, ZC 0006, Microtrac, Montgomery, PA USA) at −39.1 mV for the CNTs and −35.2 mV for the GR.

2.2. Seed Priming and Description of Treatments

The tomato seeds were sterilized in a 2% (v/v) solution of sodium hypochlorite for 5 min and rinsed five times with distilled water. Five concentrations were evaluated for each of the CNMs: 10, 100, 250, 500, and 1000 mg L−1. The solutions were prepared in 50 mL beakers containing 75 tomato seeds dispersed in 20 mL of solution (distilled water + CNMs). Subsequently, they were directly sonicated in an ultrasonicator (Q500 sonicator, QSONICA, Melville, NY, USA). The sonication amplitude of vibration (60%) was kept constant for 10 min at 20 KHz, similarly to what was reported by Ratnikova et al. [26]. This process is necessary, as carbon-based nanomaterials (CBNMs) tend to agglomerate due to van der Waals forces [27]. To study their applications, the CBNMs must be uniformly dispersed because, in addition to the mass concentration and primary particle size, the level of agglomeration can also play a critical role in determining effects on plants [28]. After sonication, the seeds were stored in jars with lids along with the solution of CNMs for 24 h. To verify that the solution was stable, it was manually shaken every eight hours, thus stopping the CNMs from precipitating. In addition to the treatments, we included an absolute control in which only distilled water was used and no sonication was applied, as well as a sonicated control following the same previously described process.

2.3. Germination Test

We placed 10 tomato seeds on filter paper for each Petri dish (diameter of 125 mm). Each Petri dish was considered as a replicate, and each consisted of four replicates. The Petri dishes were covered and placed randomly in a germination chamber (Plant Growth Chamber Model 250) at a temperature of 25 ± 1 °C with 16 h of light per day. To maintain the moisture of the seed, distilled water was added when required. After 15 days, the percentage of germination, the length of the root and the hypocotyl, and the fresh biomass of the hypocotyl and the root were determined.

2.4. Greenhouse Experiment

After seed priming with CNMs for 24 h, a seed was placed in a 1 L polystyrene cup (L) with a mix of perlite substrate and peat moss in a 1:1 ratio. We considered a total of 10 cups for each treatment, where each vessel was a repeat. A directed irrigation system was used for irrigation, applying a Steiner solution (1961) at a 25% concentration to provide the necessary nutrients. The pH of the nutrient solution was adjusted with sulfuric acid (98%) to 6.5. The tomato plants were grown for 60 days in a chapel-type greenhouse, with a polycarbonate cover, an average PAR (photosynthetically active radiation) of 600 μmol m−2 s−1, a temperature of 28 °C, and relative humidity of 60%.
Sixty days after planting, the plant height, stem diameter, and number of leaves were measured. In addition, the fresh and dry biomass of the aerial part and the root were determined.
For the determination of the biochemical compounds, samples of fresh foliar tissue were taken from fully expanded young leaves (third and fourth leaves), and these were placed in a freezer at −20 °C and then lyophilized for 72 h in freeze dryer (Labconco, FreeZone 2.5 L model, Kansas City, MO, USA). The lyophilized samples were ground to a fine powder to make the determinations.

2.5. Biochemical Determinations

2.5.1. Photosynthetic Pigments

The chlorophyll content was determined according to the method of Nagata and Yamashita [29]. The absorbance at 645 and 663 nm was determined and used in Equations (1) and (2) to determine the content of chlorophyll, as follows:
Chl   a = 0.999 × Abs 663 0.0989 × Abs 645 ,
Chl   b = 0.328 × Abs 663 + 1.77 × Abs 645 .
The total chlorophyll is the sum of Chl a and Chl b. All data are expressed as mg g−1 dry weight (mg g−1 DW).

2.5.2. Non-Enzymatic Antioxidant Compounds and Antioxidant Capacity

The non-enzymatic antioxidant compounds were determined according to standard techniques. The Vitamin C (mg g−1 DW) content was determined by the colorimetric method using 2,6 dichlorophenol, 1 g of dry tissue, and HCl (2%), as described in Padayatt et al. [30].
The β-carotene content was determined according to the method of Nagata and Yamashita [29]. The absorbance at 453, 505, 645, and 663 nm was determined and used in Equation (3) as follows:
β carotene = 0.216 × Abs 663 1.22 × Abs 645 0.304 × Abs 505 + 0.452 × Abs 453 .
The phenols (mg g−1 DW) were determined using the Folin–Ciocalteu reagent, as described in [31]. The sample (0.2 g) was extracted with 1 mL of a water:acetone solution (1:1). The mixture was vortexed for 30 s. The tubes were centrifuged (UNICO Spectrophotometer Model UV2150, Dayton, USA) at 17,500× g for 10 min at 4 °C. In a test tube, 50 μL of the supernatant, 200 μL of the Folin–Ciocalteu reagent, 500 μL of 20% sodium carbonate (Na2CO3), and 5 mL of distilled water were added and then vortexed for 30 s. The samples were placed in a water bath at 45 °C for 30 min. Finally, the reading was taken at an absorbance of 750 nm using a plastic cell in a UV–Vis spectrophotometer (UNICO Spectrophotometer Model UV2150, Dayton, USA).
The flavonoids (mg g−1 DW) were determined with the method of Arvouet-Grand et al. [32]. For the extraction, 100 mg of lyophilized tissue was placed in a test tube, where 10 mL of reagent-grade methanol was added and shaken for 30 s until the mixture was homogenized. The mixture was filtered using No. 1 Whatman paper. For the quantification, 2 mL of the extract and 2 mL of methanolic solution of aluminum trichloride (AlCl3) 2% were added to a test tube and left to rest for 20 min in the dark. The reading was then taken in a UV–Vis spectrophotometer (UNICO Spectrophotometer Model UV2150, Dayton, NJ, USA) at a wavelength of 415 nm using a quartz cell.
The total protein (mg g−1 of DW) determination was performed using Bradford’s colorimetric technique [33]. In a microplate, 5 μL of the extract and 250 μL of the Bradford reagent were placed in each well. They were incubated for 10 min at room temperature (26 °C) and then read at a wavelength of 630 nm on a microplate reader (Allsheng, AMR-100 model, Hangzhou, China).
The glutathione (GSH) content (µmol g−1 DW) was determined using the method of Xue et al. [34] by means of a 5,5-dithio-bis-2 nitrobenzoic acid (DTNB) reaction. A mix of 0.480 mL of the extract, 2.2 mL of sodium dibasic phosphate (Na2HPO4 at 0.32 M), and 0.32 mL of the DTNB dye (1 mM) was placed in a test tube. Then, the mix was vortexed and read on a UV–Vis spectrophotometer (UNICO Spectrophotometer Model UV2150, Dayton, NJ, USA) at 412 nm using a quartz cell.
The antioxidant capacity was determined using the DPPH (2,2-diphenyl-1-picrylhydrazyl) radical according to the method of Brand-Williams et al. [35]. The hydrophilic compounds were determined using a phosphate buffer for extraction, and for the lipophilic compounds, a hexane:acetone solution was used. The total antioxidant capacity was obtained by the sum of the hydrophilic and lipophilic compounds [36]. The antioxidant capacity was expressed as vitamin C equivalents (mg g−1 DW).

2.5.3. Hydrogen Peroxide

The extraction was carried out according to the methodology of Patterson et al. [37]. We ground 50 mg of lyophilized tissue to powder together with 5 mL of 5% trichloroacetic acid (TCA) and 150 mg of activated charcoal. Subsequently, this mixture was centrifuged at 10,000× g for 20 min at 4 °C. From the resulting supernatant, 0.5 mL was taken and passed to a 15 mL conical tube containing 2.5 mL of TCA, to which a 10% ammonia solution was added until a pH of 8.4 was reached. The solution was filtered with a 0.45 micron pore syringe and polytetrafluoroethylene (PTFE) membrane. The filtrate was divided into two aliquots of 1 mL. To one of these aliquots (aliquot blank), we added 8 μg of catalase and maintained the solution at room temperature (24 ± 1 °C) for 10 min. Subsequently, for both aliquots with and without catalase (sample), 1 mL of the colorimetric reagent was added and allowed to incubate for 10 min at 30 °C. After the reaction time, the absorbance at 505 nm was determined by a UV–VIS spectrophotometer (UNICO Spectrophotometer Model UV2150, Dayton, NJ, USA). The colorimetric reagent was prepared with 10 mg of 4-aminoantipyrine, 10 mg of phenol, and 5 mg of peroxidase (150 U mg−1), which were dissolved in 50 mL of an acetic acid buffer (100 mM, pH 5.6). The content of H2O2 was given on a standard curve.

2.5.4. Enzymatic Activity

The extract used was the same as that used for total proteins and followed the standard techniques. The ascorbate peroxidase (EC 1.11.1.11) was determined by the method of Nakano and Asada [38] and is expressed as U per gram of total proteins (U g−1 TP), where U is equal to the μmol of oxidized ascorbate per milliliter per minute. The measurement was undertaken at two moments (at time 0 (T0) and at time 1 (T1)). At T0, a mix of 100 μL of extract, 500 μL of ascorbate (10 mg L−1), 400 μL of H2SO4 (5%), and 1 mL of H2O2 (100 mM) were placed in a test tube and then vortexed for 30 s. The absorbance was measured in a UV–Vis spectrophotometer (UNICO Spectrophotometer Model UV2150, Dayton, NJ, USA) at 266 nm with a quartz cell. At T1, 100 μL of extract, 500 μL of ascorbate (10 mg L−1), and 1 mL of H2O2 (100 mM) were added to the previous mixture and vortexed for 1 min at a temperature of 26 °C. To stop the reaction, 400 μL of H2SO4 (5%) was added, and the absorbance was measured. Ascorbate peroxidase determination was based on the quantification of the ascorbate oxidation rate by means of the absorbance difference (T0–T1).
The glutathione peroxidase (EC 1.11.1.9) (U per gram of total proteins (U TP−1), where U is equal to the mM equivalent of reduced glutathione (GSH) per milliliter per minute) was determined by the method of Flohé and Günzler [34,39]. A mix of 200 μL of extract, 400 μL of GSH (0.1 mM), and 200 μL of Na2HPO4 (0.067 M) was placed in a test tube. The mixture was preheated in a water bath at 25 °C for 5 min, and then 200 μL of H2O2 (1.3 mM) was added to start the catalytic reaction for 10 min at a temperature of 26 °C. The reaction was stopped by the addition of 1 mL of 1% trichloroacetic acid. The mixture was placed in an ice bath for 30 min and then centrifuged at 1008× g for 10 min at 4 °C. To assess the glutathione peroxidase, 480 μL of the supernatant, 2.2 mL of Na2HPO4 (0.32 M), and 320 μL of 1 mM DTNB were placed in a test tube. The absorbance was measured by a UV–Vis spectrophotometer (UNICO Spectrophotometer Model UV2150, Dayton, NJ, USA) at 412 nm with a quartz cell.
The catalase (EC 1.11.1.6) (U TP−1, where U is equal to the mM equivalent of H2O2 consumed per milliliter per minute) was quantified by the method of Dhindsa et al. [40]. The measurement was carried out in two steps (at time 0 (T0) and at time 1 (T1)). At T0, 100 μL of extract, 400 μL of H2SO4 (5%), and 1 mL of H2O2 (100 mM) were added to an Eppendorf tube and vortexed for 30 s. The absorbance was then measured on a UV–Vis spectrophotometer (UNICO Spectrophotometer Model UV2150, Dayton, NJ, USA) with a quartz cell at 270 nm. At T1, 100 μL of extract and 1 mL of H2O2 (100 μL) were added and stirred for 1 min in a vortex at 26 °C. Then, 400 μL of H2SO4 (5%) was added to stop the reaction, and the absorbance was measured by a UV–Vis spectrophotometer with a quartz cell at 270 nm. The determination of catalase was based on the quantification of the oxidation rate of H2O2 by absorbance difference (T0–T1).
The phenylalanine ammonia lyase (PAL) (EC 4.3.1.5) was determined according to the method of Sykłowska-Baranek et al. [41], and the results are expressed as U per gram of total proteins (U g−1 TP), where U is equal to µmol equivalent of trans-cinnamic acid per milliliter per minute. A total of 0.1 mL of the enzymatic extract was taken, and 0.9 mL of L-phenylalanine (6 mM) was added. After 30 min of incubation at 40 °C, the reaction was stopped with 0.25 mL of 5 N HCl. The samples were placed in an ice bath, and 5 mL of distilled water was added. The absorbance was determined at 290 nm on a UV–Vis spectrophotometer (UNICO Spectrophotometer Model UV2150, Dayton, NJ, USA).
The superoxide dismutase (SOD) (EC 1.15.1.1) (U mL−1, where U is defined as the amount of enzyme needed to exhibit 50% dismutation of the superoxide radical) was carried out using the Cayman kit (SOD Assay Kit 706002, Cayman Chemical, Ann Arbor, Michigan, USA). A mix of 20 μL of extract, 200 μL of the radical detector (tetrazolium salt), and 20 μL of xanthine oxidase solution was placed in a microplate. The microplate was covered with a transparent cover (kit), stirred for 10 s, and then incubated at 26 °C for 30 min. The absorbance was then measured at a length of 450 nm using a plate reader (Allsheng, AMR-100 model, Hangzhou, China). The principle of the test was based on the use of a tetrazolium salt for the detection of superoxide radicals generated by xanthine oxidase and hypoxanthine.

2.6. Statistical Analysis

For the germination test, four replicates were used per treatment. The variables of tomato growth were assessed using 10 replicates, where a plant was used a replicate. For each of the evaluated biochemical variables, five replicates per treatment were used. A completely random design was used. An analysis of variance and Fisher’s least significant difference (LSD) mean test (p < 0.05) were performed. A Pearson correlation analysis was also performed between the different evaluated antioxidants. All statistical procedures were performed using the software Infostat 2018 (http://www.infostat.com.ar).

3. Results and Discussion

3.1. Germination Test

For the germination variables, only the length of the hypocotyl was unaffected with any concentration of the CNMs applied, while for the rest of the variables, we observed differences between the treatments (Figure 1). The percentage of germination was affected by the application of GR at its highest dose (1000 mg L−1), presenting 19% less germination compared to the absolute control, and the rest of the treatments with CNMs were equal to this (Figure 1A). The root length decreased with the application of 500 mg L−1 of GR and 10 mg L−1 of CNTs compared to the absolute control by 37.2% and 39.2%, respectively (Figure 1B). The addition of GR decreased the hypocotyl biomass by 30.11%, 33.05%, and 32%, with the doses of 250, 500, and 1000 mg L−1, respectively, while 250 mg L−1 of CNTs presented a decrease of 30.94% in relation to the absolute control (Figure 1E). In contrast, the root biomass increased by 66% and 127.2% with the application of 100 mg L−1 of GR and CNTs, respectively, compared to both controls (sonicated and non-sonicated); the rest of the treatment results were the same (Figure 1D).
The results indicated obtained, in general, that CNMs could negatively affect some variables related to germination in a concentration-dependent manner, mainly high concentrations of GR. However, we observed that root development could be increased with the application of CNMs.
Pandey et al. [42], evaluated graphene and MWCNTs at concentrations of 50 and 200 mg L−1 in sorghum and millet seeds incubated for 10 and 21 days in an MS (Murashige and Skoog) culture medium. They observed an increase in the percentage of germination, as well as a more rapid germination of both seeds. They also mentioned that the concentration of 50 mg L−1 for both nanomaterials was more effective because it increased the length of the shoots and roots, as well as the fresh biomass.
Khodakovskaya et al. [14] reported that the germination of seeds and the development of tomato seedlings drastically improved after exposure to 40 mg L−1 of CNTs in an MS culture medium, after evaluation for 21 days. According to the authors, the observed results were due to the penetration of the CNTs through the cover of the seed by creating a greater number of pores, which allowed for a greater uptake of water in the seeds. Khodakovskaya [43] mentioned that CNTs (50, 100 to 200 mg L−1) applied in tomatoes in an MS medium activated many genes related to stress, among which the protein gene of the water channel stood out. This resulted in the better germination and growth of the tomato seedlings. Begum et al. [10] reported that high concentrations of graphene (2000 mg L−1) inhibited the growth of the tomato roots and shoots, in addition to decreasing the biomass. However, graphene concentrations of 50–200 mg L−1 did not affect the tomato plant [43].
Several authors have mentioned that the phytotoxicity of CNMs depends on the type of seed, species of plant, the stage of growth of the plant, the nature of the CNMs, and the dose and exposure time [4,7,44,45]. However, in general and according to the results obtained in this work, it is clear that high doses of CNMs are more likely to induce negative responses in the germination of tomato seeds.

3.2. Impact of Seed Priming on Growth of Tomato Seedlings

The agronomic variables evaluated in the tomato plants treated with the CNMs showed significant differences between treatments (Figure 2). In general, the results showed that the process of the sonication of the seeds affected the behavior of the agronomic variables, since in all cases, the sonicated control presented the lowest values of the evaluated variables. On the other hand, the absolute control was lower than some treatments with CNMs only in root dry biomass, and it was the best in dry shoot biomass. Meanwhile, in the rest of the evaluated variables, it was the same as the best treatment with CNMs.
In comparison to the sonicated control, the evaluated variables behaved in the following way. The plant height increased by 41.75% and 41.25% with the addition of GR and CNTs, respectively, with the dose of 10 mg L−1 (Figure 2A). The stem diameter increased with the GR 10 and 250 treatments by 13.24% and 11.58%, respectively (Figure 2B). The fresh shoot biomass increased by 49.52% with GR and 45.05% with CNTs, both with a dose of 10 mg L−1 (Figure 2C). The fresh root weight increased by 40.37% with the addition of GR 1000 compared with the sonicated control, contrary to that observed with CNTs 1000, which decreased by 47.32% (Figure 2D). The dry shoot biomass increased by 42.70% with GR and 41.08% with CNTs, both with a dose of 10 mg L−1 (Figure 2E), while the dry root biomass was increased in the GR 1000 treatment by 197.5% (Figure 2F).
Compared to the absolute control, the results were different when derived from the process of sonicating the seeds. The dry root biomass was better with the GR 1000 treatment with an increase of 112% (Figure 2F). On the other hand, the plant height was lower with concentrations of 100, 500, and 1000 mg L−1 of CNTs by 9.8%, 9.6%, and 29%, respectively (Figure 2A). The stem diameter decreased with all evaluated doses of CNTs (Figure 2B), and the dry shoot biomass also decreased with all treatments that included CNMs (Figure 2E). In general, the obtained results showed that high doses of CNMs (500–1000 mg L−1) generated adverse effects in the evaluated variables, although we observed that the CNTs had more effects than the GR (Figure 2).
In relation to the process of the sonication of the seeds, Ratnikova et al. [26] mentioned that there was a mechanical effect that removes a part of the seed coat that improved the water uptake and accelerated the appearance of the radicle. They also proposed that the removal or rupture of this layer channels allowed for the passage of small molecules to the embryo, which could improve the penetration of the CNMs to increase the results observed in the treatments with CNMs compared to the sonicated control.
Pandey et al. [42] reported an increase in fresh biomass (28.11%) and dry biomass (16.66%) of sorghum and millet plants treated with graphene (50 and 200 mg L−1) that was applied via soil under greenhouse conditions. In seedlings of Larix olgensis, low concentrations of graphene (25–50 mg L−1) increased the dry matter of the root, stem and leaves, root length, surface area, volume, and average diameter; in contrast, concentrations greater than 100 mg L−1 induced the opposite effect [13]. Similarly, Villagarcia et al. [18] showed that the CNTs (40 mg L−1) in an MS culture medium increased their absorption of water and that the addition of calcium and iron improved the growth and development of tomato plants.
Yousefi et al. [16] reported that seed priming with MWCNTs improved the seed germination percentage, mean germination time, and root and stem lengths, as well as the fresh and dry weights of the roots and stems of Hopbush (Dodonaea viscosa L.) under drought stress. Martínez-Ballesta et al. [17] showed that broccoli plants (Brassica oleracea L. var. Italica) treated with MWCNTs significantly increased their growth under saline stress conditions. Liu et al. [46] mentioned that CNTs had physicochemical properties as molecular transporters in the cell walls of plants, which stimulated the growth of crops and promoted the metabolism of crop growth. This indicated that the concentration used was decisive in the effects observed, though the species may be more or less tolerant to CNMs, which could have also defined the observed response.
On the other hand, studies have demonstrated that, when entering cells, especially in the roots, CNTs form aggregates that could cause negative effects by obstructing the transport of nutrients and, in turn, causing a delay in growth [9,46,47]. In addition, CNTs have been found to generate reactive oxygen species and, consequently, oxidative stress that modify the physiological and biochemical responses of plants exposed to these CNMs [48]. This explains the negative effects observed here with high doses of CNMs.

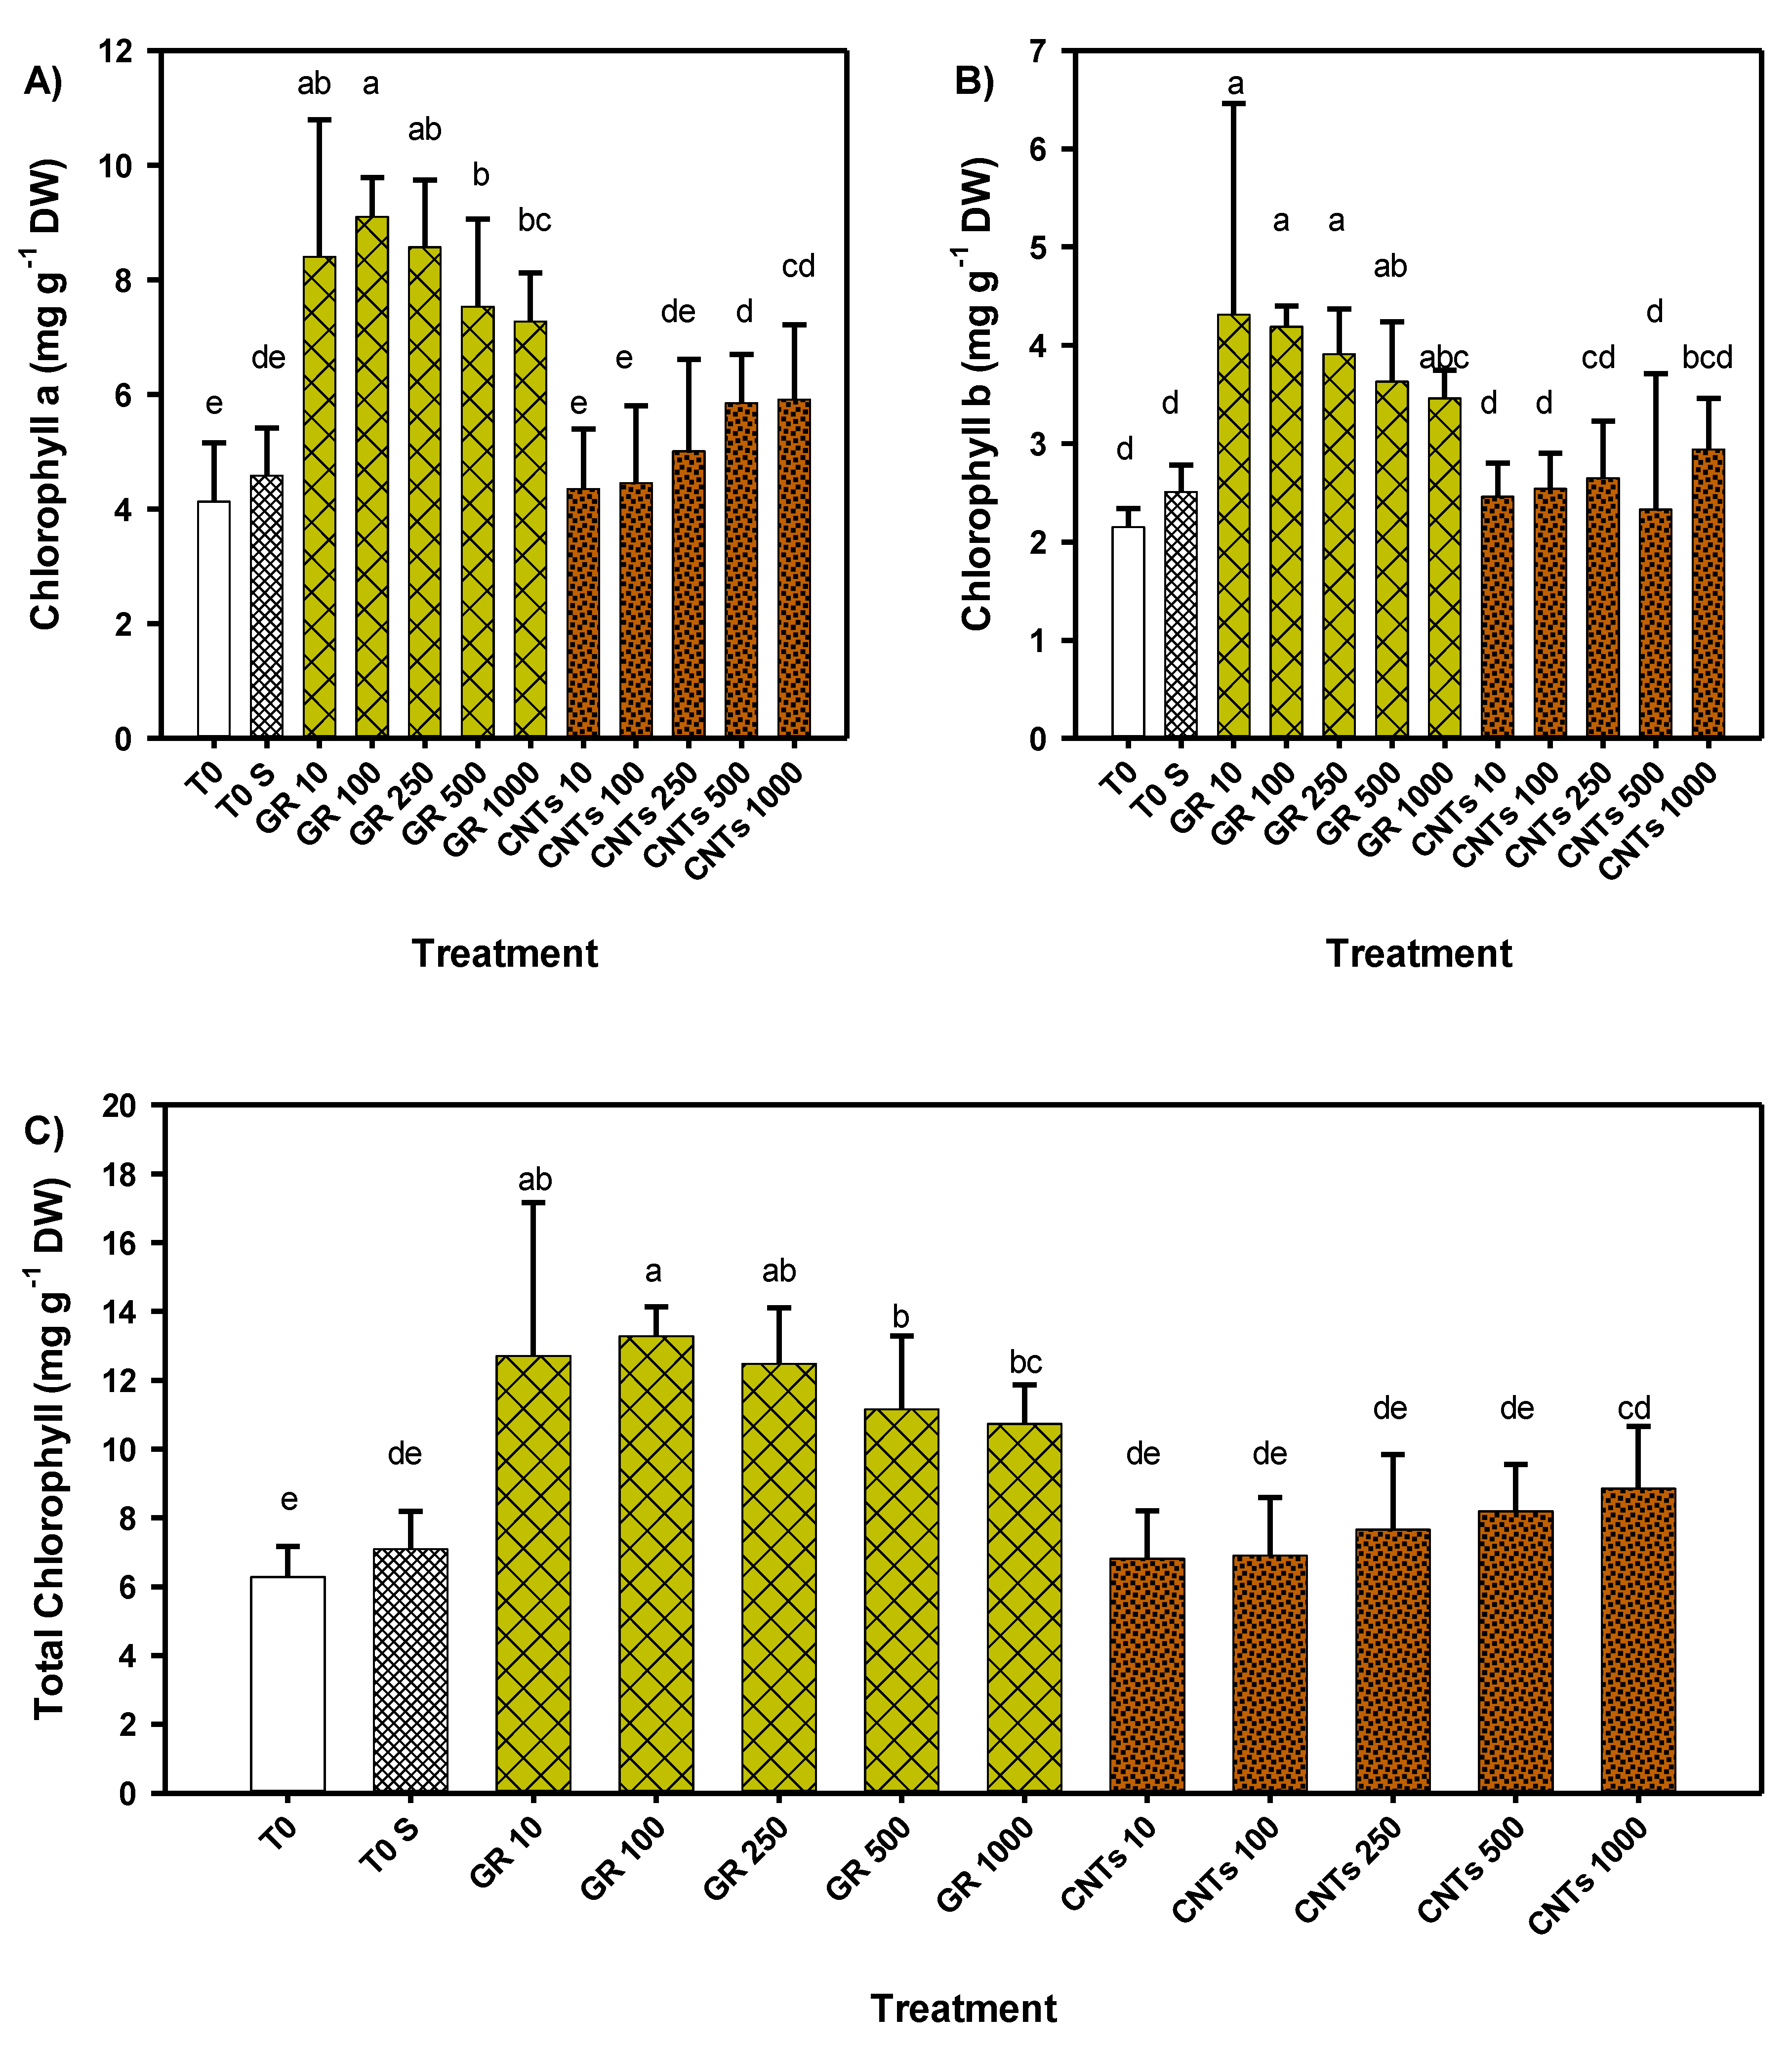
3.3. Content of Photosynthetic Pigments of Tomato Seedlings

The chlorophyll a, b, and total contents were consistently increased with the addition of graphene in all the studied doses (Figure 3). The addition of GR (10–1000 mg L−1) increased chlorophyll a, with the dose of 100 mg L−1 being the one that generated the best result with increments of 120% and 99% in comparison with the absolute and sonicated controls, respectively (Figure 3A). Chlorophyll b also increased with the application of GR, where the low concentrations (10, 100, and 250) obtained the highest chlorophyll b content in the ranges of 82%–100% and 56%–71% compared to the absolute and sonicated controls, respectively (Figure 3B). In the total chlorophyll content, the GR 100 treatment generated an increase of 111% compared to the absolute control and 87.53% compared to the sonicated control (Figure 3C). As for CNTs, the addition of 500 and 1000 mg L−1 increased the chlorophyll a content by 41.6% and 43%, respectively (Figure 3A), and only the 1000 mg L−1 dose increased the total chlorophyll by 40.9% compared to the absolute control (Figure 3C). Chlorophyll b was not affected by the addition of CNTs (Figure 3B).
An increase of the chlorophyll in plants modifies the absorption of light and therefore the production of carbohydrates, making the process more efficient. Wang et al. [49] reported that the application of carbon dots (0.02–0.12 mg mL−1) in mung bean shoots increased the chlorophyll content (14.8%). Park and Ahn [50] evaluated the effect of CNTs (500 mg L−1) on the content of chlorophyll in carrot leaves suspended for 48 h in a solution and reported an increase of 25%–30%. Giraldo et al. [51] mentioned that CNTs have the potential to move from the soil to the plants and to be located within the cells of the leaves, especially within chloroplasts, and thus promote photosynthetic activity, because this modifies the activity of the chloroplast in carbon capture through the promotion of energy use and electron transport rates. Larue et al. [52] reported that the application of CNTs (50 mg L−1) in wheat seedlings did not affect the photosynthetic activity, as the chlorophyll a and b contents remained unchanged.
With respect to graphene, Zhang et al. [53] evaluated different doses (250, 500, 1000, and 1500 mg L−1) in the roots and shoots of wheat plants after 30 days of exposure, and as a result, the chlorophyll content and PSII (photosystem II) activity were reduced. Siddiqui et al. [54] evaluated the effect of graphene oxide (0.05 and 0.10 mg mL−1) sprinkled on carrot leaves and reported a decrease in chlorophyll content.
The mentioned results showed that both positive and negative effects could be observed with the application of CNMs, though it was clear that this depended on the route of application, dose, type of material, and exposure times. The results obtained in this study showed that the graphene application was more efficient than that of the CNTs in increasing the chlorophyll content, at least until the time of sampling (60 days after planting). In addition, no nanotoxicity was observed with any dose of the CNMs evaluated, as there was no decrease in chlorophylls until the moment of analysis.

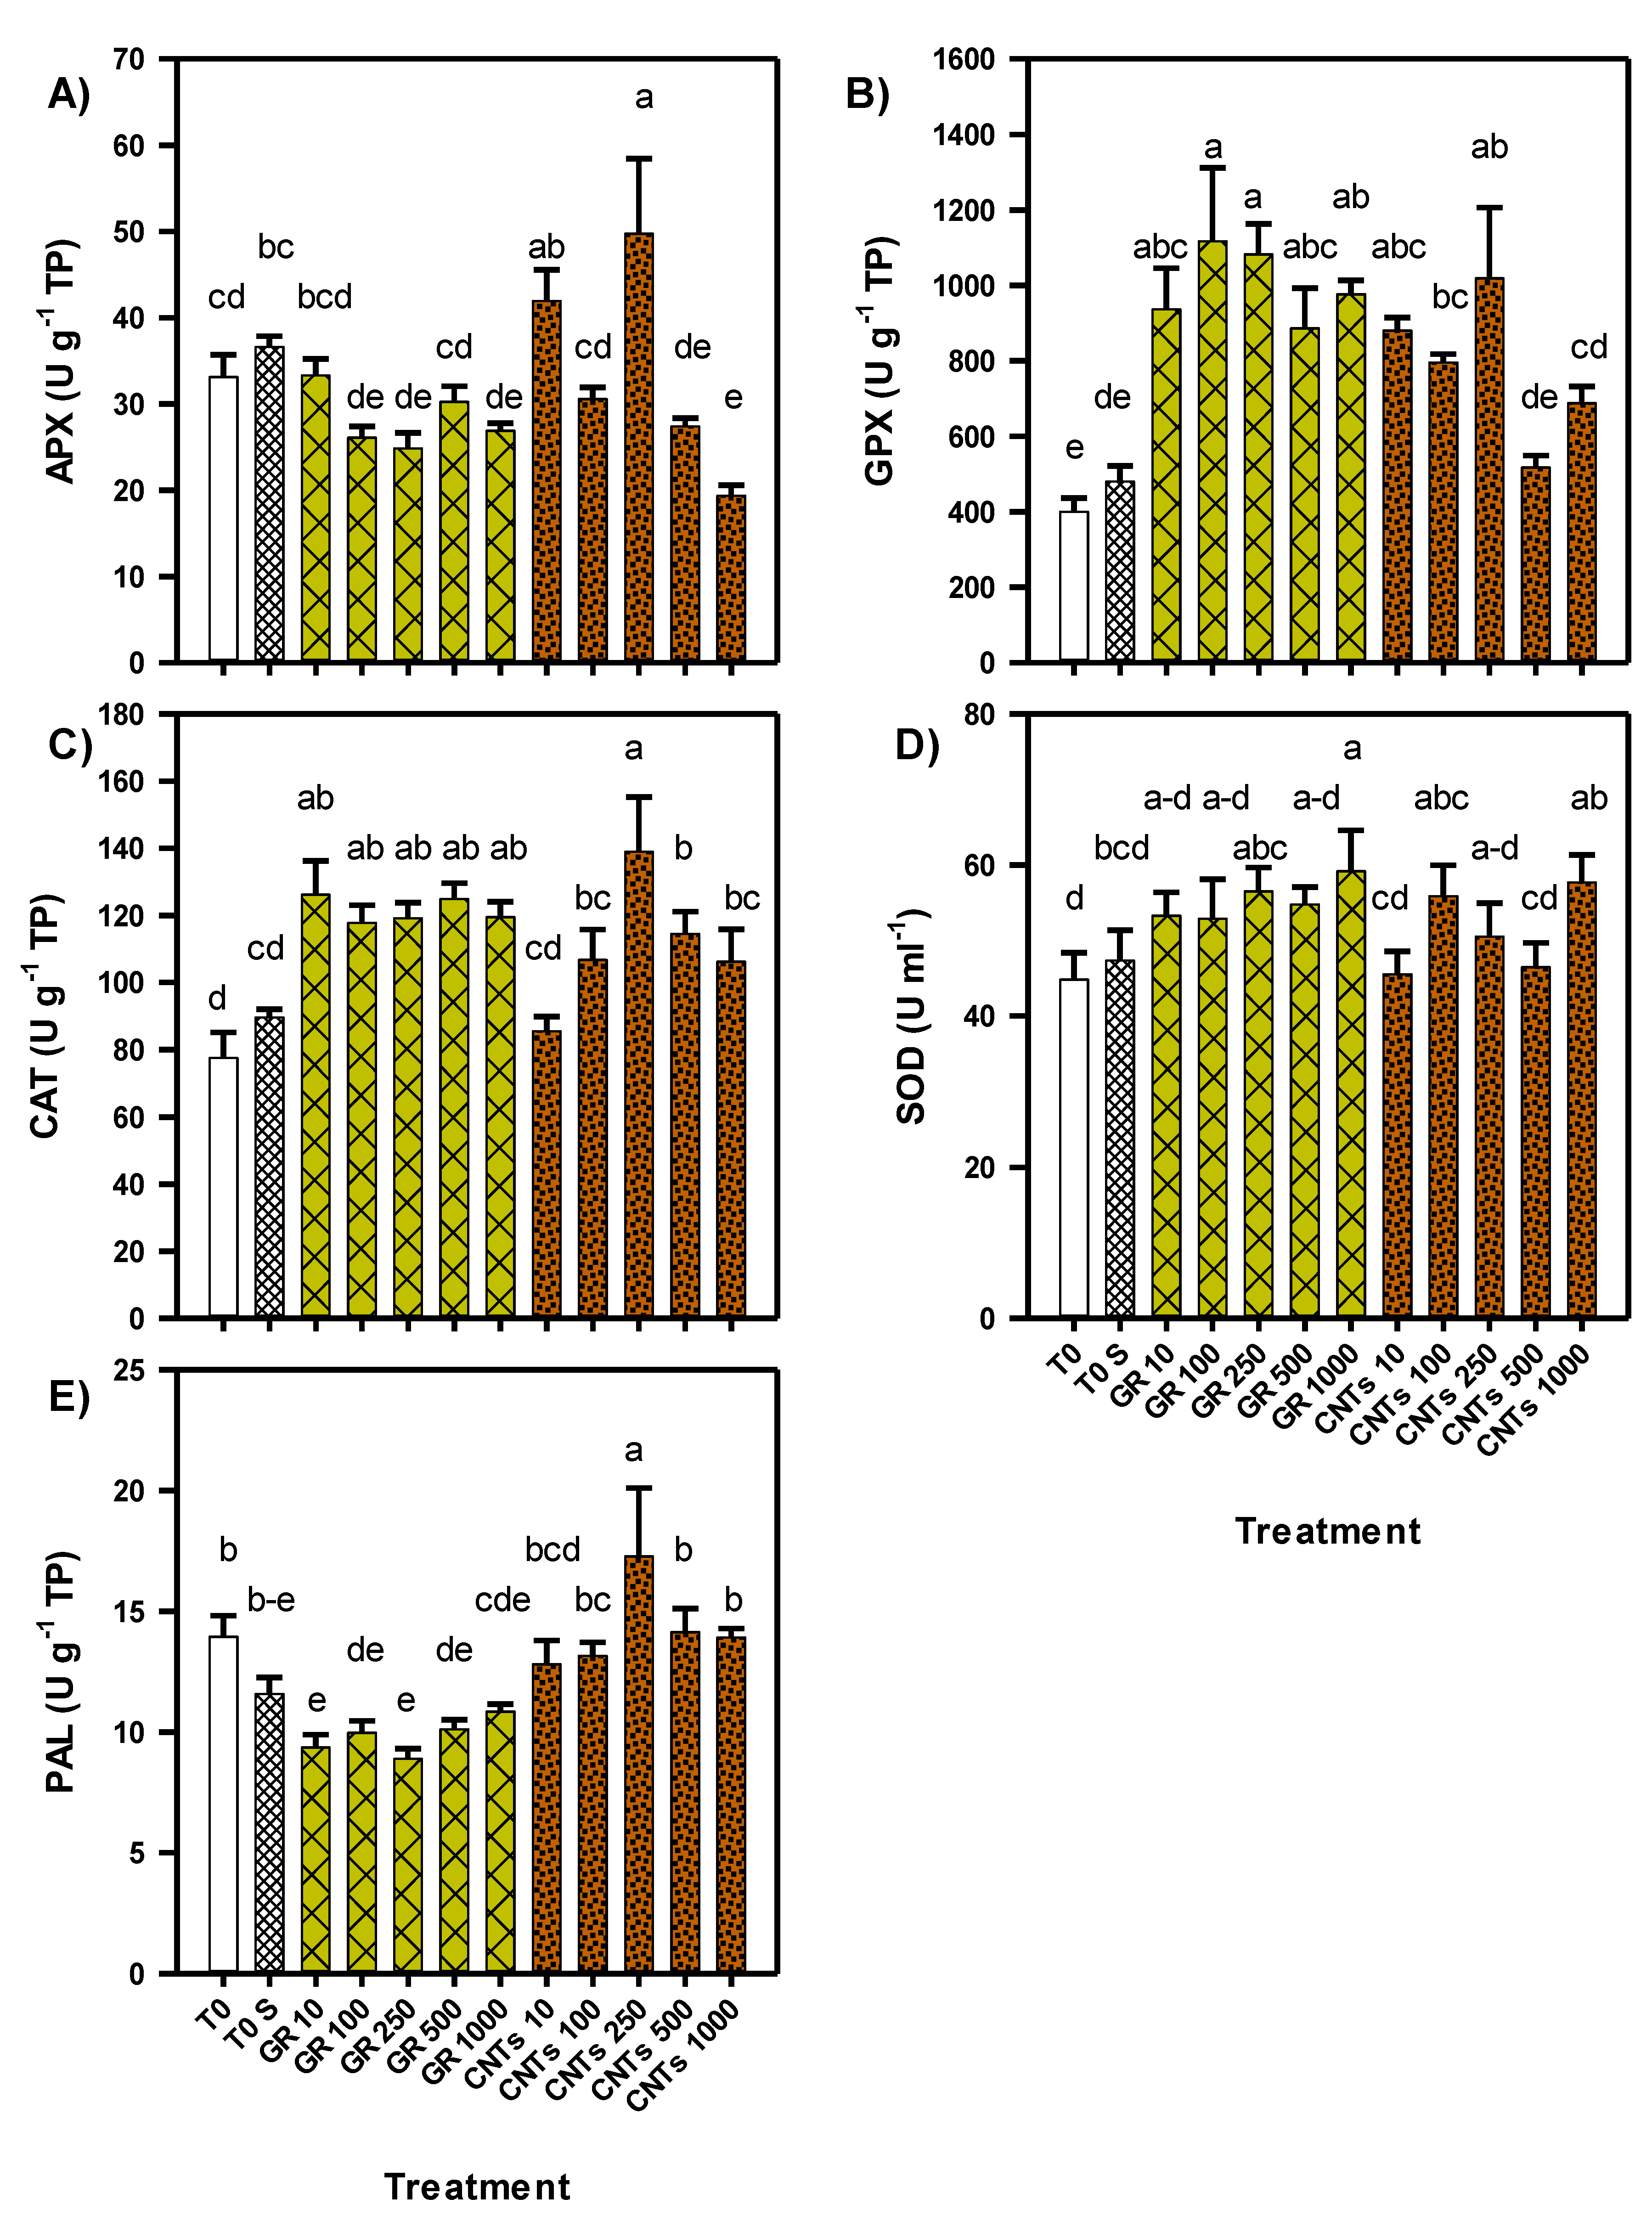
3.4. Antioxidant Status of Tomato Seedlings

The obtained results showed that for the proteins, vitamin C, β-carotene, phenols, flavonoids, the antioxidant capacity of lipophilic compounds, and the total antioxidant capacity, at least one treatment was better than the absolute control (Figure 4 and Figure 5). Only in the content of GSH and the antioxidant capacity of hydrophilic compounds was there no treatment greater than the absolute control (Figure 4B). Regarding H2O2 production, the GR 500 and 1000 treatments together with the absolute control presented the lowest H2O2 values, while the GR 100 and 10 treatments presented the highest values at around 2.5 times more than the absolute control (Figure 4F).
The GR 1000 treatment generated the highest concentration of vitamin C (Figure 4A), H2O2 (Figure 4F), and phenols (Figure 4C), which were 18.4%, 78%, and 85.2% more than the absolute control, respectively. The β-carotene content was better with the GR 250 treatment (10 times more than the absolute control) (Figure 4E), while the GR 100 treatment generated the highest flavonoid content (45.4% more than the absolute control) (Figure 4D); in both cases, the GR 1000 treatment was also better than the absolute control by nine-fold and 43.3%, respectively. These results inversely corresponded with the H2O2 because the highest doses of graphene (500 and 1000 mg L−1), together with the absolute control, induced the lowest accumulation of this radical, which was expected as one of the functions of the antioxidant compounds is to neutralize the ROS. However, graphene at 100 mg L−1 increased the H2O2 up to 215%, and at 10 mg L−1, graphene increased it by 195% (Figure 4F).
Regarding antioxidant capacity, the CNTs 250 treatment induced the best results in the antioxidant capacity of lipophilic compounds that were greater than the absolute control by 23.2% (Figure 5B); meanwhile, the total antioxidant capacity was higher by 19.5% (Figure 5C). In contrast, all graphene treatments showed significantly lower values than the absolute control in these variables (Figure 5).
It is well known that non-enzymatic antioxidant compounds, such as vitamin C, glutathione, and carotenoids, play a fundamental role in the control of ROS. Vitamin C is a powerful antioxidant that protects plants from oxidative damage by acting as a substrate in reactions catalyzed by the enzyme ascorbate peroxidase (APX) by reducing H2O2 to H2O [55]. Vitamin C also plays an important role in photosynthesis as a cofactor of enzymes (including the synthesis of ethylene, gibberellins, flavonoids, and anthocyanins) [56]. Carotenoids are lipophilic compounds that act as non-enzymatic antioxidant compounds by preventing the formation or elimination of 1O2 by the xanthophyll cycle, and they function as antenna molecules, capturing light in chloroplasts [57,58].
The main role of β-carotene in green tissues is the extinction of 3Chl*, thus providing the inhibition of the production and damage of 1O2, in addition to participating in the formation of provitamin A [59]. Glutathione is one of the most important antioxidants that detoxifies ROS and protects plants from oxidative damage by eliminating H2O2, 1O2, OH•, and O2•- [60]; it also participates in the regeneration of ascorbic acid [61]. Phenolic compounds also have the ability to eliminate free radicals due to their role as electron donors and their ability to chelate transition metal ions and terminate the Fenton reaction [62].
Among these compounds, for example, the flavonoids found in the chloroplast act as singlet oxygen scavengers and chloroplast membrane stabilizers by altering the kinetics of peroxidation and decreasing the fluidity of the membranes [63]. These changes could seriously hinder the diffusion of ROS and restrict peroxidative reactions [59]. Thus, an increase in this compound could generate a secondary pathway to eliminate ROS and improve the antioxidant defense system [64]. Therefore, an increase in this type of compounds in plants may lead to a greater capacity to tolerate oxidative stress caused, in turn, by other types of stress.
According to the results obtained in this study, it was clear that the application of CNMs induced the production of non-enzymatic antioxidant compounds, as also shown by Siddiqui et al. [54] who reported increases in the carotenoid content in carrot crops by the foliar application of graphene oxide (0.05–0.10 mg mL−1). Begum and Fugetsu [44] demonstrated that ascorbic acid decreased oxidative stress caused by CNTs (0–1000 mg L−1) in red spinach developed under hydroponic conditions.
The increase in the content of antioxidant compounds observed was due to the fact that CNMs stimulate ROS production by interacting with cell organelles [65]. H2O2, which is one of the main ROS, has a double function. In low concentrations, it acts as a signaling agent, activating the production of antioxidant compounds; however, in excess, it generates oxidative stress [22,23,24]. Anjum et al. [66] showed that doses of 100, 200, and 1600 mg L−1 of graphene oxide impaired the metabolism of glutathione due to the greater accumulation of ROS in Vicia faba. However, moderate concentrations of this same CNM (400 and 800 mg L−1) generated different effects and, on the other hand, increased the glutathione content while decreasing the ROS [67].
The enzymatic activity evaluated in the different enzymes showed significant differences between treatments, where in all cases, at least one treatment with CNMs was greater than the absolute control (Figure 6). The PAL enzyme showed a greater activity with the CNTs 250 treatment, with an increase of 24% compared to the absolute control, while the rest of the concentrations of CNTs were statistically equal to the absolute control. On the contrary, the addition of graphene presented a negative effect, as the activity of this enzyme decreased in all the evaluated concentrations (Figure 6E). The activity of the PAL enzyme is of the utmost importance because it is the first enzyme in the phenylpropanoid pathway that catalyzes the deamination of phenylalanine to cinnamic acid to produce phenolic compounds [68]. The phenolic compounds present a variety of functions in plants, including an antioxidant effect; therefore, changes in the activity of PAL can also influence protection against oxidative stress.
Regarding the activity of the antioxidant enzymes, the treatment with 250 mg L−1 of CNTs increased the APX activity by 50%, while the highest dose (1000 mg L−1) generated a decrease of 41% in comparison to the absolute control (Figure 6A). The treatments with the application of graphene did not show differences with respect to the absolute control. The enzymatic activity of glutathione peroxidase (GPX) was affected to a greater extent by the application of graphene, as it was increased 179% and 170% with the GR 100 and 250 treatments, respectively, in comparison to the absolute control.
The CNTs also had a positive effect, with the CNTs 250 treatment being the one with the highest increase at 55% more than the absolute control (Figure 6B). The activity of the catalase enzyme was increased in all graphene doses, and, with the exception of the lowest dose of CNTs (10 mg L−1), the rest of the treatments also increased the activity of the enzyme. The treatment of CNTs 250 generated the greatest increase in catalase activity at 79% more than the absolute control (Figure 6C). The activity of SOD increased to a greater extent with high doses of both CNMs, where the GR 1000 treatment showed 32% more activity than the absolute control. The treatment of CNTs 1000 was 29% more (Figure 6D). The results indicated that the CNTs 250 treatment had the greatest influence on the enzymatic activity, as it was the best for PAL, APX, and catalase (CAT), and it was statistically equal to the best treatment in GPX and SOD (Figure 6).
The importance of the different antioxidant enzymes that were evaluated in the present study is due to their active participation in ROS neutralization, which allows for the maintenance of ROS homeostasis in plants. The enzyme SOD and its isoenzymes (Mn-SOD, Cu/Zn-SOD, and Fe-SOD) convert the O2•- to H2O2 and O2, whereas the enzymes APX, GPX, and CAT participate in the transformation of H2O2 to H2O. APX requires ascorbic acid and reduced glutathione as substrates, while GPX uses GSH as a reducing agent [69]. CAT presents a high affinity and ability to dismute H2O2 molecules (mainly in the peroxisome) in water, oxygen, and, to a lesser degree, organic peroxides without requiring a reducing compound [70].
Other authors have also reported that CNMs influence the activity of antioxidant enzymes. Zhao et al. [71] reported that the CNTs (0, 0.45, 0.9, 2.25, and 4.5 mg L−1), evaluated in an MS culture medium for 25 days, increased the CAT, SOD, and APX contents in Arabidopsis. Lin et al. [47] mentioned that the application of CNTs in cell culture in Arabidopsis T87 in a range of 10–600 mg L−1 decreased the enzymatic activity of SOD.
The different responses that have been observed with CNMs are due to the ability of cells to penetrate the seed layer and to be internalized in the different organelles of the cells [14,26], either through endocytosis, pore formation, transport proteins, or plasmodesmata [72]. Once inside, CNMs stimulate the production of ROS through interactions with cellular organelles [65]. This is due to the fact that nanomaterials have a corona around their surface with a high density of surface charges that, when they interact with cells, modify the integral activity of the proteins, generating a cellular response [6]. These responses can vary from biostimulation to cell death depending on the level of oxidative stress generated by the increase in ROS.
As shown in Figure 7, there was a high correlation between some compounds of the antioxidant system of tomato seedlings. The chlorophylls showed a positive correlation with β-carotene, which may have been related to the function of this accessory pigment compound acting as antenna molecules and capturing light in chloroplasts [57,58]. In addition to this, one of the main role of β-carotene is the extinction of 3Chl*, thus providing the inhibition of production and damage of 1O2 [59], that would be caused by stress conditions. All of these compounds showed a negative correlation with the antioxidant capacity.
Researchers have also observed that there is a high correlation between the antioxidant capacity and the PAL enzyme. This is an expected response due to the role of said enzyme in the production of phenolic compounds [68], which, among other things, function as antioxidants and protect against oxidative stress.
In the case of hydrogen peroxide, a negative correlation with GSH was observed, which was likely derived from the role it has in the control and detoxification of ROS [60].

4. Conclusions

Seed priming with CNMs did not affect the germination of tomato plants. Only high doses induced a negative effect. However, the CNMs negatively affected the length of the root and the fresh weight of the hypocotyl, and they promoted the growth of the root. Seed priming with CNMs induced significant changes in the growth of seedlings in a concentration-dependent manner. The vigor of the tomato seedlings was generally promoted with graphene and CNTs in low doses. However, the high doses of both CNMs had negative effects. Therefore, it is important to consider the concentrations used in order to obtain favorable results in the growth of seedlings.
Seed priming with graphene favored the increase of chlorophylls, as well as the contents of proteins and non-enzymatic antioxidants (vitamin C, β-carotene, glutathione, phenols, and flavonoids) of tomato seedlings. However, the antioxidant capacity was greater with the use of CNTs for seed priming. Likewise, both CNMs promoted enzymatic activity; the CNTs increased the PAL, APX and CAT enzymes, while GPX and SOD were greater with graphene. Therefore, seed priming with CNMs had pronounced effects on the antioxidant system of the tomato plants, presenting different responses depending on whether graphene or carbon nanotubes were used.
The seed priming with carbon nanomaterials induced favorable responses that could potentially improve the development of the tomato crop. These results indicated that the treatment of tomato seeds with carbon nanomaterials could be a good option to induce biostimulation, as well as demonstrating an easy method of application.

Author Contributions

Conceptualization and project administration, A.J.-M. and A.B.-M.; methodology, investigation, and original draft, E.R.L.-V. and Y.G.-G.; resources M.P.-Á. and G.C.-P.; writing and editing, A.J.-M., A.B.-M., M.P.-Á., G.C.-P., S.G.-M., and R.I.C. All authors reviewed the manuscript. All authors have read and agreed to the published version of the manuscript.

Funding

This research received no external funding.

Conflicts of Interest

The authors declare no conflict of interest.

References

  1. Jeevanandam, J.; Barhoum, A.; Chan, Y.S.; Dufresne, A.; Danquah, M.K. Review on nanoparticles and nanostructured materials: History, sources, toxicity and regulations. Beilstein J. Nanotechnol. 2018, 9, 1050–1074. [Google Scholar] [CrossRef] [Green Version]
  2. Majeed, N.; Panigrahi, K.C.S.; Sukla, L.B.; John, R.; Panigrahy, M. Application of carbon nanomaterials in plant biotechnology. Mater. Today Proc. 2020. [Google Scholar] [CrossRef]
  3. Wang, Q.; Li, C.; Wang, Y.; Que, X. Phytotoxicity of graphene family nanomaterials and its mechanisms: A review. Front. Chem. 2019, 7. [Google Scholar] [CrossRef] [Green Version]
  4. Vithanage, M.; Seneviratne, M.; Ahmad, M.; Sarkar, B.; Ok, Y.S. Contrasting effects of engineered carbon nanotubes on plants: A review. Environ. Geochem. Health 2017, 39, 1421–1439. [Google Scholar] [CrossRef]
  5. Georgakilas, V.; Perman, J.A.; Tucek, J.; Zboril, R. Broad Family of Carbon Nanoallotropes: Classification, Chemistry, and Applications of Fullerenes, Carbon Dots, Nanotubes, Graphene, Nanodiamonds, and Combined Superstructures. Chem. Rev. 2015, 115, 4744–4822. [Google Scholar] [CrossRef]
  6. Juárez-Maldonado, A.; Ortega-Ortiz, H.; González-Morales, S.; Morelos-Moreno, Á.; Cabrera-de la Fuente, M.; Sandoval-Rangel, A.; Cadenas-Pliego, G.; Benavides-Mendoza, A. Nanoparticles and Nanomaterials as Plant Biostimulants. Int. J. Mol. Sci. 2019, 20, 162. [Google Scholar] [CrossRef] [Green Version]
  7. Jordan, J.T.; Singh, K.P.; Cañas-carrell, J.E. Carbon-Based Nanomaterials Elicit Changes in Physiology, Gene Expression, and Epigenetics in Exposed Plants: A Review. Curr. Opin. Environ. Sci. Heal. 2018. [Google Scholar] [CrossRef]
  8. Qian, D.; Wagner, G.J.; Liu, W.K.; Yu, M.-F.; Ruoff, R.S. Mechanics of carbon nanotubes. Appl. Mech. Rev. 2002, 55, 495–533. [Google Scholar] [CrossRef]
  9. Chen, M.; Zhou, S.; Zhu, Y.; Sun, Y.; Zeng, G.; Yang, C.; Xu, P.; Yan, M.; Liu, Z.; Zhang, W. Toxicity of carbon nanomaterials to plants, animals and microbes: Recent progress from 2015-present. Chemosphere 2018, 206, 255–264. [Google Scholar] [CrossRef]
  10. Begum, P.; Ikhtiari, R.; Fugetsu, B. Graphene phytotoxicity in the seedling stage of cabbage, tomato, red spinach, and lettuce. Carbon 2011, 49, 3907–3919. [Google Scholar] [CrossRef] [Green Version]
  11. Sayes, C.M.; Liang, F.; Ausman, K.D.; Moore, V.C.; Hudson, J.L.; Guo, W.; Sayes, C.M.; West, J.L.; Beach, J.M.; Doyle, C.D.; et al. Functionalization density dependence of single-walled carbon nanotubes cytotoxicity in vitro. Toxicol. Lett. 2006, 161, 135–142. [Google Scholar] [CrossRef] [PubMed]
  12. Zhang, M.; Gao, B.; Chen, J.; Li, Y. Effects of graphene on seed germination and seedling growth. J. Nanoparticle Res. 2015, 17. [Google Scholar] [CrossRef]
  13. Song, J.; Cao, K.; Duan, C.; Luo, N.; Cui, X. Effects of graphene on larix olgensis seedlings and soil properties of haplic cambisols in Northeast China. Forests 2020, 11, 258. [Google Scholar] [CrossRef] [Green Version]
  14. Khodakovskaya, M.; Dervishi, E.; Mahmood, M.; Xu, Y.; Li, Z.; Watanabe, F.; Biris, A.S. Carbon Nanotubes Are Able To Penetrate Plant Seed Coat and Dramatically Affect Seed Germination and Plant Growth (Retracted article. See vol. 6, pg. 7541, 2012). ACS Nano 2009, 3, 3221–3227. [Google Scholar] [CrossRef]
  15. Chen, G.; Qiu, J.; Liu, Y.; Jiang, R.; Cai, S.; Liu, Y.; Zhu, F.; Zeng, F.; Luan, T.; Ouyang, G. Carbon Nanotubes Act as Contaminant Carriers and Translocate within Plants. Sci. Rep. 2015, 5, 1–9. [Google Scholar] [CrossRef] [PubMed] [Green Version]
  16. Yousefi, S.; Kartoolinejad, D.; Naghdi, R. Effects of priming with multi-walled carbon nanotubes on seed physiological characteristics of Hopbush (Dodonaeaviscosa L.) under drought stress. Int. J. Environ. Stud. 2017, 74, 528–539. [Google Scholar] [CrossRef]
  17. Martínez-Ballesta, M.C.; Zapata, L.; Chalbi, N.; Carvajal, M. Multiwalled carbon nanotubes enter broccoli cells enhancing growth and water uptake of plants exposed to salinity. J. Nanobiotechnology 2016, 14, 1–14. [Google Scholar] [CrossRef] [Green Version]
  18. Villagarcia, H.; Dervishi, E.; De Silva, K.; Biris, A.S.; Khodakovskaya, M.V. Surface chemistry of carbon nanotubes impacts the growth and expression of water channel protein in tomato plants. Small 2012, 8, 2328–2334. [Google Scholar] [CrossRef]
  19. Talebi, S.M. Nanoparticle-Induced Morphological Responses of Roots and Shoots of Plants; Elsevier Inc.: Cambridge, MA, USA, 2018; ISBN 9780128114872. [Google Scholar]
  20. Hu, X.; Lu, K.; Mu, L.; Kang, J.; Zhou, Q. Interactions between graphene oxide and plant cells: Regulation of cell morphology, uptake, organelle damage, oxidative effects and metabolic disorders. Carbon 2014, 80, 665–676. [Google Scholar] [CrossRef]
  21. Hao, Y.; Ma, C.; Zhang, Z.; Song, Y.; Cao, W.; Guo, J.; Zhou, G.; Rui, Y.; Liu, L.; Xing, B. Carbon nanomaterials alter plant physiology and soil bacterial community composition in a rice-soil-bacterial ecosystem. Environ. Pollut. 2018, 232, 123–136. [Google Scholar] [CrossRef]
  22. Marslin, G.; Sheeba, C.J.; Franklin, G. Nanoparticles Alter Secondary Metabolism in Plants via ROS Burst. Front. Plant Sci. 2017, 8, 1–8. [Google Scholar] [CrossRef] [PubMed] [Green Version]
  23. Mittler, R. ROS Are Good. Trends Plant Sci. 2017, 22, 11–19. [Google Scholar] [CrossRef] [PubMed] [Green Version]
  24. Zaytseva, O. Phytotoxicity of Nanoparticles; Springer Nature Switzerland AG: Basel, Switzerland, 2018; pp. 103–118. [Google Scholar] [CrossRef]
  25. Lopez-Marin, J.; Rodriguez, M.; del Amor, F.M.; Galvez, A.; Martinez, J.M.B. Cost-Benefit Analysis of Tomato Crops under Different Greenhouse Covers. J. Agr. Sci. Tech. 2019, 21, 235–248. [Google Scholar]
  26. Ratnikova, T.A.; Podila, R.; Rao, A.M.; Taylor, A.G. Tomato Seed Coat Permeability to Selected Carbon Nanomaterials and Enhancement of Germination and Seedling Growth. Sci. World J. 2015, 2015. [Google Scholar] [CrossRef]
  27. Atif, R.; Inam, F. Reasons and remedies for the agglomeration of multilayered graphene and carbon nanotubes in polymers. Beilstein J. Nanotechnol. 2016, 7, 1174–1196. [Google Scholar] [CrossRef]
  28. Wang, Y.; Chang, C.H.; Ji, Z.; Bouchard, D.C.; Nisbet, R.M.; Schimel, J.P.; Gardea-Torresdey, J.L.; Holden, P.A. Agglomeration Determines Effects of Carbonaceous Nanomaterials on Soybean Nodulation, Dinitrogen Fixation Potential, and Growth in Soil. ACS Nano 2017, 11, 5753–5765. [Google Scholar] [CrossRef]
  29. Nagata, M.; Yamashita, I. Simple Method for Simultaneous Determination of Chlorophyll and Carotenoids in Tomato Fruit. J. Japanese Soc. Food Sci. Technol. Shokuhin Kagaku Kogaku Kaishi 1992, 39, 925–928. [Google Scholar] [CrossRef] [Green Version]
  30. Padayatty, S.J.; Katz, A.; Wang, Y.; Eck, P.; Kwon, O.; Lee, J.-H.; Chen, S.; Corpe, C.; Dutta, A.; Dutta, S.K.; et al. Vitamin C as an Antioxidant: Evaluation of Its Role in Disease Prevention. J. Am. Coll. Nutr. 2003, 22, 18–35. [Google Scholar] [CrossRef]
  31. Singleton, V.L.; Orthofer, R.; Lamuela-Raventos, R.M. Analisys of total phenols and other oxidation sobstrates and antioxidants by means of Folin Ciocalteau reagent. Methods Enzymol. 1999, 299, 152–178. [Google Scholar]
  32. Arvouet-Grand, A.; Vennat, B.; Pourrat, A.; Legret, P. Standardization of a propolis extract and identification of the main constituents. J. Pharm. Belg. 1994, 49, 462–468. [Google Scholar] [PubMed]
  33. Bradford, M.M. A rapid and sensitive method for the quantitation of microgram quantities of protein utilizing the principle of protein-dye binding. Anal. Biochem. 1976, 72, 248–254. [Google Scholar] [CrossRef]
  34. Xue, T.; Hartikainen, H.; Piironen, V. Antioxidative and growth-promoting effect of selenium on senescing lettuce. Plant Soil 2001, 237, 55–61. [Google Scholar] [CrossRef]
  35. Brand-Williams, W.; Cuvelier, M.E.; Berset, C. Use of a Free Radical Method to Evaluate Antioxidant Activity. Food Sci. Technol. 1995, 28, 25–30. [Google Scholar] [CrossRef]
  36. Arnao, M.B.; Cano, A.; Acosta, M. The hydrophilic and lipophilic contribution to total antioxidant activity. Food Chem. 2001, 73, 239–244. [Google Scholar] [CrossRef]
  37. Patterson, B.D.; MacRae, E.A.; Ferguson, I.B. Estimation of hydrogen peroxide in plant extracts using titanium(IV). Anal. Biochem. 1984, 139, 487–492. [Google Scholar] [CrossRef]
  38. Nakano, Y.; Asada, K. Purification of ascorbate peroxidase in spinach chloroplasts; its inactivation in ascorbate-depleted medium and reactivation by monodehydroascorbate radical. Plant Cell Physiol. 1987, 28, 131–140. [Google Scholar] [CrossRef]
  39. Flohé, L.; Günzler, W.A. Assays of glutathione peroxidase. Methods Enzymol. 1984, 105, 114–120. [Google Scholar] [CrossRef]
  40. Dhindsa, R.S.; Plumb-dhindsa, P.; Thorpe, T.A. Leaf senescence: Correlated with increased levels of membrane permeability and lipid peroxidation, and decreased levels of superoxide dismutase and catalase. J. Exp. Bot. 1981, 32, 93–101. [Google Scholar] [CrossRef]
  41. Sykłowska-Baranek, K.; Pietrosiuk, A.; Naliwajski, M.R.; Kawiak, A.; Jeziorek, M.; Wyderska, S.; Łojkowska, E.; Chinou, I. Effect of l-phenylalanine on PAL activity and production of naphthoquinone pigments in suspension cultures of Arnebia euchroma (Royle) Johnst. Vitr. Cell. Dev. Biol. Plant 2012, 48, 555–564. [Google Scholar] [CrossRef] [Green Version]
  42. Pandey, K.; Lahiani, M.H.; Hicks, V.K.; Hudson, M.K.; Green, J.; Khodakovskaya, M. Effects of carbon-based nanomaterials on seed germination, biomass accumulation and salt stress response of bioenergy crops. PLoS ONE 2018, 1–17. [Google Scholar] [CrossRef] [PubMed] [Green Version]
  43. Khodakovskaya, M.V.; De Silva, K.; Nedosekin, D.A.; Dervishi, E.; Biris, A.S. Complex genetic, photothermal, and photoacoustic analysis of nanoparticle-plant interactions. PNAS 2011, 108, 1028–1033. [Google Scholar] [CrossRef] [PubMed] [Green Version]
  44. Begum, P.; Fugetsu, B. Phytotoxicity of multi-walled carbon nanotubes on red spinach (Amaranthus tricolor L) and the role of ascorbic acid as an antioxidant. J. Hazard. Mater. 2012, 243, 212–222. [Google Scholar] [CrossRef] [PubMed] [Green Version]
  45. Miralles, P.; Johnson, E.; Church, T.L.; Harris, A.T. Multiwalled carbon nanotubes in alfalfa and wheat: Toxicology and uptake. J. R. Soc. Interface 2012, 9, 3514–3527. [Google Scholar] [CrossRef] [PubMed]
  46. Liu, Q.; Chen, B.; Wang, Q.; Shi, X.; Xiao, Z.; Lin, J.; Fang, X. Carbon nanotubes as molecular transporters for walled plant cells. Nano Lett. 2009, 9, 1007–1010. [Google Scholar] [CrossRef] [PubMed]
  47. Lin, C.; Fugetsu, B.; Su, Y.; Watari, F. Studies on toxicity of multi-walled carbon nanotubes on Arabidopsis T87 suspension cells. J. Hazard. Mater. 2009, 170, 578–583. [Google Scholar] [CrossRef] [PubMed] [Green Version]
  48. Burman, U.; Kumar, P. Plant Response to Engineered Nanoparticles. In Nanomaterials in Plants, Algae, and Microorganisms; Tripathi, D.K., Ahmad, P., Sharma, S., Chauhan, D.K., Dubey, N.K., Eds.; Elsevier: Cambridge, MA, USA, 2018; pp. 103–118. ISBN 9780128116463. [Google Scholar]
  49. Wang, H.; Zhang, M.; Song, Y.; Li, H.; Huang, H.; Shao, M.; Liu, Y.; Kang, Z. Carbon dots promote the growth and photosynthesis of mung bean sprouts. Carbon 2018, 136, 94–102. [Google Scholar] [CrossRef]
  50. Park, S.; Ahn, Y.J. Multi-walled carbon nanotubes and silver nanoparticles differentially affect seed germination, chlorophyll content, and hydrogen peroxide accumulation in carrot (Daucus carota L.). Biocatal. Agric. Biotechnol. 2016, 8, 257–262. [Google Scholar] [CrossRef]
  51. Giraldo, J.P.; Landry, M.P.; Faltermeier, S.M.; McNicholas, T.P.; Iverson, N.M.; Boghossian, A.A.; Reuel, N.F.; Hilmer, A.J.; Sen, F.; Brew, J.A.; et al. Plant nanobionics approach to augment photosynthesis and biochemical sensing. Nat. Mater. 2014, 13, 400–408. [Google Scholar] [CrossRef] [Green Version]
  52. Larue, C.; Pinault, M.; Czarny, B.; Georgin, D.; Jaillard, D.; Bendiab, N.; Mayne-L’Hermite, M.; Taran, F.; Dive, V.; Carrière, M. Quantitative evaluation of multi-walled carbon nanotube uptake in wheat and rapeseed. J. Hazard. Mater. 2012, 227–228, 155–163. [Google Scholar] [CrossRef]
  53. Zhang, P.; Zhang, R.; Fang, X.; Song, T.; Cai, X.; Liu, H.; Du, S. Toxic effects of graphene on the growth and nutritional levels of wheat (Triticum aestivum L.): Short- and long-term exposure studies. J. Hazard. Mater. 2016, 317, 543–551. [Google Scholar] [CrossRef] [PubMed]
  54. Siddiqui, Z.A.; Parveen, A.; Ahmad, L.; Hashem, A. Effects of graphene oxide and zinc oxide nanoparticles on growth, chlorophyll, carotenoids, proline contents and diseases of carrot. Sci. Hortic. (Amsterdam) 2019, 249, 374–382. [Google Scholar] [CrossRef]
  55. Kaur, R.; Nayyar, H. Ascorbic Acid: A Potent Defender Against Environmental Stresses. In Oxidative Damage to Plants: Antioxidant Networks and Signaling; Elsevier Inc.: Cambridge, MA, USA, 2014; pp. 235–287. ISBN 9780127999630. [Google Scholar]
  56. Ortiz-Espín, A.; Sánchez-Guerrero, A.; Sevilla, F.; Jiménez, A. The Role of Ascorbate in Plant Growth and Development. In Ascorbic Acid in Plant Growth, Development and Stress Tolerance; Hossain, M.A., Munné-Bosch, S., Burritt, D.J., Diaz-Vivancos, P., Fujita, M., Lorence, A., Eds.; Springer International Publishing: Cham, Switzerland, 2017; pp. 25–45. ISBN 9783319740577. [Google Scholar]
  57. Havaux, M. Carotenoid oxidation products as stress signals in plants. Plant J. 2013, 79, 597–606. [Google Scholar] [CrossRef] [PubMed]
  58. Latowski, D.; Szymanska, R.; Strzalka, K. Carotenoids involved in antioxidant system of chloroplasts. In Oxidative Damage to Plants: Antioxidant Networks and Signaling; Elsevier Inc.: Cambridge, MA, USA, 2014; pp. 289–319. ISBN 9780127999630. [Google Scholar]
  59. Ahmad, P.; Jamsheed, S.; Hameed, A.; Rasool, S.; Sharma, I.; Azooz, M.M.; Hasanuzzaman, M. Drought stress induced oxidative damage and antioxidants in plants. In Oxidative Damage to Plants: Antioxidant Networks and Signaling; Elsevier Inc.: Cambridge, MA, USA, 2014; pp. 345–367. ISBN 9780127999630. [Google Scholar]
  60. Waśkiewicz, A.; Gładysz, O.; Szentner, K.; Goliński, P. Role of Glutathione in Abiotic Stress Tolerance. In Oxidative Damage to Plants; Academic Press: Cambridge, MA, USA, 2014; pp. 149–181. ISBN 9780127999630. [Google Scholar]
  61. Szymanska, R.; Latowski, D.; Nowicka, B.; Strzalka, K. Lipophilic Molecules as a Part of Antioxidant System in Plants. In Oxidative Damage to Plants: Antioxidant Networks and Signaling; Elsevier Inc.: Cambridge, MA, USA, 2014; pp. 321–344. ISBN 9780127999630. [Google Scholar]
  62. Dangles, O. Antioxidant Activity of Plant Phenols: Chemical Mechanisms and Biological Significance. Curr. Org. Chem. 2012, 16, 692–714. [Google Scholar] [CrossRef]
  63. Agati, G.; Azzarello, E.; Pollastri, S.; Tattini, M. Flavonoids as antioxidants in plants: Location and functional significance. Plant Sci. 2012, 196, 67–76. [Google Scholar] [CrossRef]
  64. Hernández, I.; Alegre, L.; Van Breusegem, F.; Munné-Bosch, S. How relevant are flavonoids as antioxidants in plants? Trends Plant Sci. 2009, 14, 125–132. [Google Scholar] [CrossRef]
  65. Zia-ur-Rehman, M.; Qayyum, M.F.; Akmal, F.; Maqsood, M.A.; Rizwan, M.; Waqar, M.; Azhar, M. Recent Progress of Nanotoxicology in Plants. In Nanomaterials in Plants, Algae, and Microorganisms; Tripathi, D.K., Ahmad, P., Sharma, S., Chauhan, D.K., Dubey, N.K., Eds.; Elsevier: Cambridge, MA, USA, 2018; pp. 143–174. ISBN 9780128114872. [Google Scholar]
  66. Anjum, N.A.; Singh, N.; Singh, M.K.; Shah, Z.A.; Duarte, A.C.; Pereira, E.; Ahmad, I. Single-bilayer graphene oxide sheet tolerance and glutathione redox system significance assessment in faba bean (Vicia faba L.). J. Nanoparticle Res. 2013, 15. [Google Scholar] [CrossRef]
  67. Anjum, N.A.; Singh, N.; Singh, M.K.; Sayeed, I.; Duarte, A.C.; Pereira, E.; Ahmad, I. Single-bilayer graphene oxide sheet impacts and underlying potential mechanism assessment in germinating faba bean (Vicia faba L.). Sci. Total Environ. 2014, 472, 834–841. [Google Scholar] [CrossRef]
  68. Zhang, X.; Liu, C.-J. Multifaceted regulations of gateway enzyme phenylalanine ammonia-lyase in the biosynthesis of phenylpropanoids. Mol. Plant 2015, 8, 17–27. [Google Scholar] [CrossRef] [Green Version]
  69. Hajiboland, R. Reactive oxygen species and photosynthesis. In Oxidative damage to plants; Elsevier: Cambridge, MA, USA, 2014; pp. 1–63. [Google Scholar]
  70. Choudhury, S.; Panda, P.; Sahoo, L.; Kumar, P.S. Reactive oxygen species signaling in plants under abiotic stress. Plant Signal. Behav. 2013, 8, e23681. [Google Scholar] [CrossRef] [Green Version]
  71. Zhao, Q.; Ma, C.; White, J.C.; Dhankher, O.P.; Zhang, X.; Zhang, S.; Xing, B. Quantitative evaluation of multi-wall carbon nanotube uptake by terrestrial plants. Carbon 2017, 114, 661–670. [Google Scholar] [CrossRef] [Green Version]
  72. Pérez-de-Luque, A. Interaction of Nanomaterials with Plants: What Do We Need for Real Applications in Agriculture? Front. Environ. Sci. 2017, 5, 1–7. [Google Scholar] [CrossRef] [Green Version]
Figure 1. Germination variables evaluated in tomato seeds treated with carbon nanomaterials. Each data point is the average of four replicates ± standard error. Different letters indicate significant differences between treatments according to Fisher’s least significant difference test (p ≤ 0.05). T0: absolute control. T0 S: sonicated control. GR: graphene. CNTs: carbon nanotubes.
Agronomy 10 00639 g001
Figure 2. Agronomic variables evaluated in tomato seedlings treated with carbon nanomaterials. Each data point is the average of ten replicates ± standard error. Different letters indicate significant differences between treatments according to Fisher’s least significant difference test (p ≤ 0.05). T0: absolute control. T0 S: sonicated control. GR: graphene. CNTs: carbon nanotubes.
Agronomy 10 00639 g002
Figure 3. The contents of chlorophylls in the leaves of tomato seedlings treated with carbon nanomaterials. Each data point is the average of five replicates ± standard error. Different letters indicate significant differences between treatments according to Fisher’s least significant difference test (p ≤ 0.05). T0: absolute control. T0 S: sonicated control. GR: graphene. CNTs: carbon nanotubes. DW: dry weight.
Agronomy 10 00639 g003
Figure 4. Antioxidant compounds and hydrogen peroxide (H2O2) in the leaves of tomato seedlings treated with carbon nanomaterials. Each data point is the average of five replicates ± standard error. Different letters indicate significant differences between treatments according to Fisher’s least significant difference test (p ≤ 0.05). T0: absolute control. T0 S: sonicated control. GR: graphene. CNTs: carbon nanotubes. DW: dry weight.
Agronomy 10 00639 g004
Figure 5. The antioxidant capacity determined in the leaves of tomato seedlings treated with carbon nanomaterials. Each data point is the average of five replicates ± standard error. Different letters indicate significant differences between treatments according to Fisher’s least significant difference test (p ≤ 0.05). T0: absolute control. T0 S: sonicated control. GR: graphene. CNTs: carbon nanotubes. DPPH: 2,2-difenil−1-picrilhidracilo (equivalents of vitamin C mg g−1 DW). H: hydrophilic compounds. L: lipophilic compounds. DPPH Total: total antioxidant capacity.
Agronomy 10 00639 g005
Figure 6. Enzymatic activity in leaves of tomato seedlings treated with carbon nanomaterials. Each data point is the average of five replicates ± standard error. Different letters indicate significant differences between treatments according to Fisher’s least significant difference test (p ≤ 0.05). T0: absolute control. T0 S: sonicated control. GR: graphene. CNTs: carbon nanotubes. PAL: phenylalanine ammonia lyase. APX: ascorbate peroxidase. GPX: glutathione peroxidase. SOD: superoxide dismutase. CAT: catalase. TP: total proteins.
Agronomy 10 00639 g006
Figure 7. The Pearson correlations of antioxidant variables determined in the leaves of tomato seedlings treated with carbon nanomaterials.
Agronomy 10 00639 g007

