Article

Modeling Hairy Vetch and Cereal Rye Cover Crop Decomposition and Nitrogen Release

1
USDA-ARS, Sustainable Water Management Research Unit, 4006 Old Leland Road, Leland, MS 38756, USA
2
Delta Research and Extension Center, Mississippi State University, P.O. Box 197, Stoneville, MS 38776, USA
3
Department of Forestry and Environmental Resources, North Carolina State University, Raleigh, NC 27695, USA
4
Oakland City University, Oakland City, IN 47660, USA
*
Author to whom correspondence should be addressed.
Agronomy 2020, 10(5), 701; https://doi.org/10.3390/agronomy10050701
Submission received: 16 March 2020 / Revised: 5 May 2020 / Accepted: 8 May 2020 / Published: 14 May 2020
(This article belongs to the Section Soil and Plant Nutrition)

Abstract

:
Empirical models could help us to understand the process of plant residue decomposition and nutrient release into the soil. The objective of this study was to determine an appropriate model to describe the decomposition of hairy vetch (Vicia villosa Roth) and cereal rye (Secale cereale L.) cover crop (CC) residue and nitrogen (N) release. Data pertaining to above and belowground CC residue mass loss and N release for up to 2633 cumulative decomposition degree days (112 d) after litterbag installation were obtained from two cropping system experiments, a 1-yr study conducted in 2015 and a 2-yr study during 2017 to 2018 in the humid subtropical environment of southern IL, USA. Six exponential and two hyperbolic models were fit to percent mass and N remaining data to find the one with minimum Akaike information criterion (AIC) and residual sum of squares. Modified three-parameter single exponential and two- or three-parameter hyperbolic models best met the assumed criteria of selection for above and belowground CC residue, respectively. Fitting a double exponential model to combined data for percent mass and N remaining identified two mass and N pools, a fast and a slow pool with different rate constants. A five-parameter double exponential with an asymptote met the preset criteria and passed all tests for normally distributed population, constant variance, and independence of residuals at α = 0.05 when fit to combined data of hairy vetch shoot mass and N remaining. However, a two-parameter hyperbolic and three-parameter asymptotic hyperbolic model provided the best fit to a combined data of cereal rye shoot mass and N remaining, respectively. Both hyperbolic decay models showed a good fit for belowground mass decomposition and N release for both CCs. Cereal rye had a poorer fit than hairy vetch for mass and N remaining of both above and belowground mass. The best-selected decay models can be used to estimate the decomposition and N release rates of hairy vetch and cereal rye above and belowground residue in a similar environment.

1. Introduction

Cover crop (CC) residue is a source of soil organic matter, and its degradation is critical to subsequent crop productivity. Residue decomposition determines the soil nutrient pool and regulates nutrient release in soil [1] through depolymerization of fibers and hydrolysis of sugars, mostly via heterotrophic soil microorganisms [2]. External environmental conditions as modified by climate, agronomic practices such as tillage, cropping rotation, fertilizer, and irrigation, and plant residue quality may impact the rate of decomposition and nutrient release. Inherent properties of the residue such as carbon-nitrogen (CN) ratio, fiber fractions, and lignin concentration can greatly affect the litter decomposition and nutrient cycling [3,4,5]. These properties differ between C3- and C4-derived soil organic matter [6] and between grass and legume residue [7], which may impact decomposition and nutrient release kinetics, indicating the possibility of the usefulness of the different approaches for modeling those kinetics. The choice of approach also depends on the desired degree of analytical simplicity, predictive power, and generality [8]. Knowledge of decay mechanism and use of a suitable model specific to the substrate quality can provide valuable information for CC management, which is mostly lacking in comparative studies where a single model is chosen for a variety of crops to determine decay rate constants and half-lives. There is a lack of uniformity in using decay models for decomposition and mineralization studies for similar substrates, which vary from simple one parametric single exponential first-order models to the complex multiparametric consecutive exponential models.
A first-order single exponential decay model (y = ae−bx, where y is the mass of substrate at time x, b is the rate constant, and e is the base of the natural logarithms (2.71828)) has been widely used for nutrient mineralization, residue decomposition, and plant population studies [5,7,9,10,11,12]. It was applied for modeling litter decomposition for numerous grasses and legumes [7] and fine litter decomposition of forest soil [12]. Ruffo and Bollero [13] and Sievers and Cook [5] used this model with an asymptote (y = aebx + yₒ, where yₒ is an asymptote) for cereal rye (Secale cereale L.) and hairy vetch (Vicia villosa Roth) decomposition and nutrient release. Polglase et al. [14] used a single exponential model for P mineralization from soil organic matter in a pine forest, whereas Fernández et al. [15] used it for modeling C mineralization in soils after wildfires in Spain. The strength of this model is that it produces a single rate constant, which can be used directly to compare decay rates from different treatments. However, it does not accurately describe decomposition or mineralization kinetics, where rate constants vary with time due to rapid loss or an extended lag phase in early decomposition [9,12,16]. The CC-derived labile fraction of soil organic matter composed of light (low specific density or mineral-free) and heavy (high specific density or mineral-bound) fractions tends to follow a different kinetic model in describing the decomposition and mineralization [17,18].
The first-order double exponential model with two rate constants (y = ae−bx + ce−dx, where b and d are the rate constants) separates organic matter into a soluble fraction (e.g., sucrose) or fast pool and cell-wall (e.g., detergent fibers) or slow pool [19] fraction. It was reported to have improved goodness of fit of single exponential models for residue decomposition and nutrient release mechanisms [9,18,20]. Berndt [9] suggested this model over the single exponential model when comparing kinetic parameters of decay of C remaining for hybrid bermudagrass (Cynodon dactylon (L.) Pers. × Cynodon transvaalensis Burtt-Davy) thatch. Wang et al. [20] predicted temperature- and moisture-dependent rate constants for soil N mineralization with a modified double exponential model under standard temperature (35 °C) and moisture conditions (55% water holding capacity). Dhakal et al. [11] reported that the double exponential model described alfalfa (Medicago sativa L.) population decline in a semiarid environment, which resulted in the highest adjusted R2 (0.94 to 0.97) and the lowest standard error of estimate (SEE) for the upright-type alfalfa cultivars. Fernandez et al. [15] and Camargo et al. [21] reported this model as fitting mineralization data better than a single exponential model. Although all models generated an R2 greater than 0.98 for in vitro mineralization of C, the double exponential model could not fit some of the samples, whereas exponential with a linear combination (y = ae−bx + cx + yₒ, where c is the slope of the linear function) yielded superior results to the double exponential, exponential plus an asymptote, and hyperbolic model [y = ab/(b + x)] [17]. Dendooven et al. [22] reported poor fit of the double exponential function in fitting N mineralization data to characterize active and recalcitrant organic N pools derived from sugar-beet (Beta vulgaris L.) and bean (Phaseolus vulgaris L.) residue.
Besides exponential models, a hyperbolic function was recommended to minimize standard errors, compared to the first-order exponential model in fitting the N mineralization data [16]. Decay and N release of cereal rye and hairy vetch residue has been well described using the hyperbolic model when compared to linear and first-order models [23]. In contrast, Berndt [9] reported poor fit statistics for the two-parametric hyperbolic decay function, relative to exponential models. This indicates the need to test various empirical models, specific to the plant species. Since mass loss and N release from cereal rye and hairy vetch residue have been studied using a variety of empirical models [5,13,23], performances of those functions have not been compared yet to suggest the best fit model.
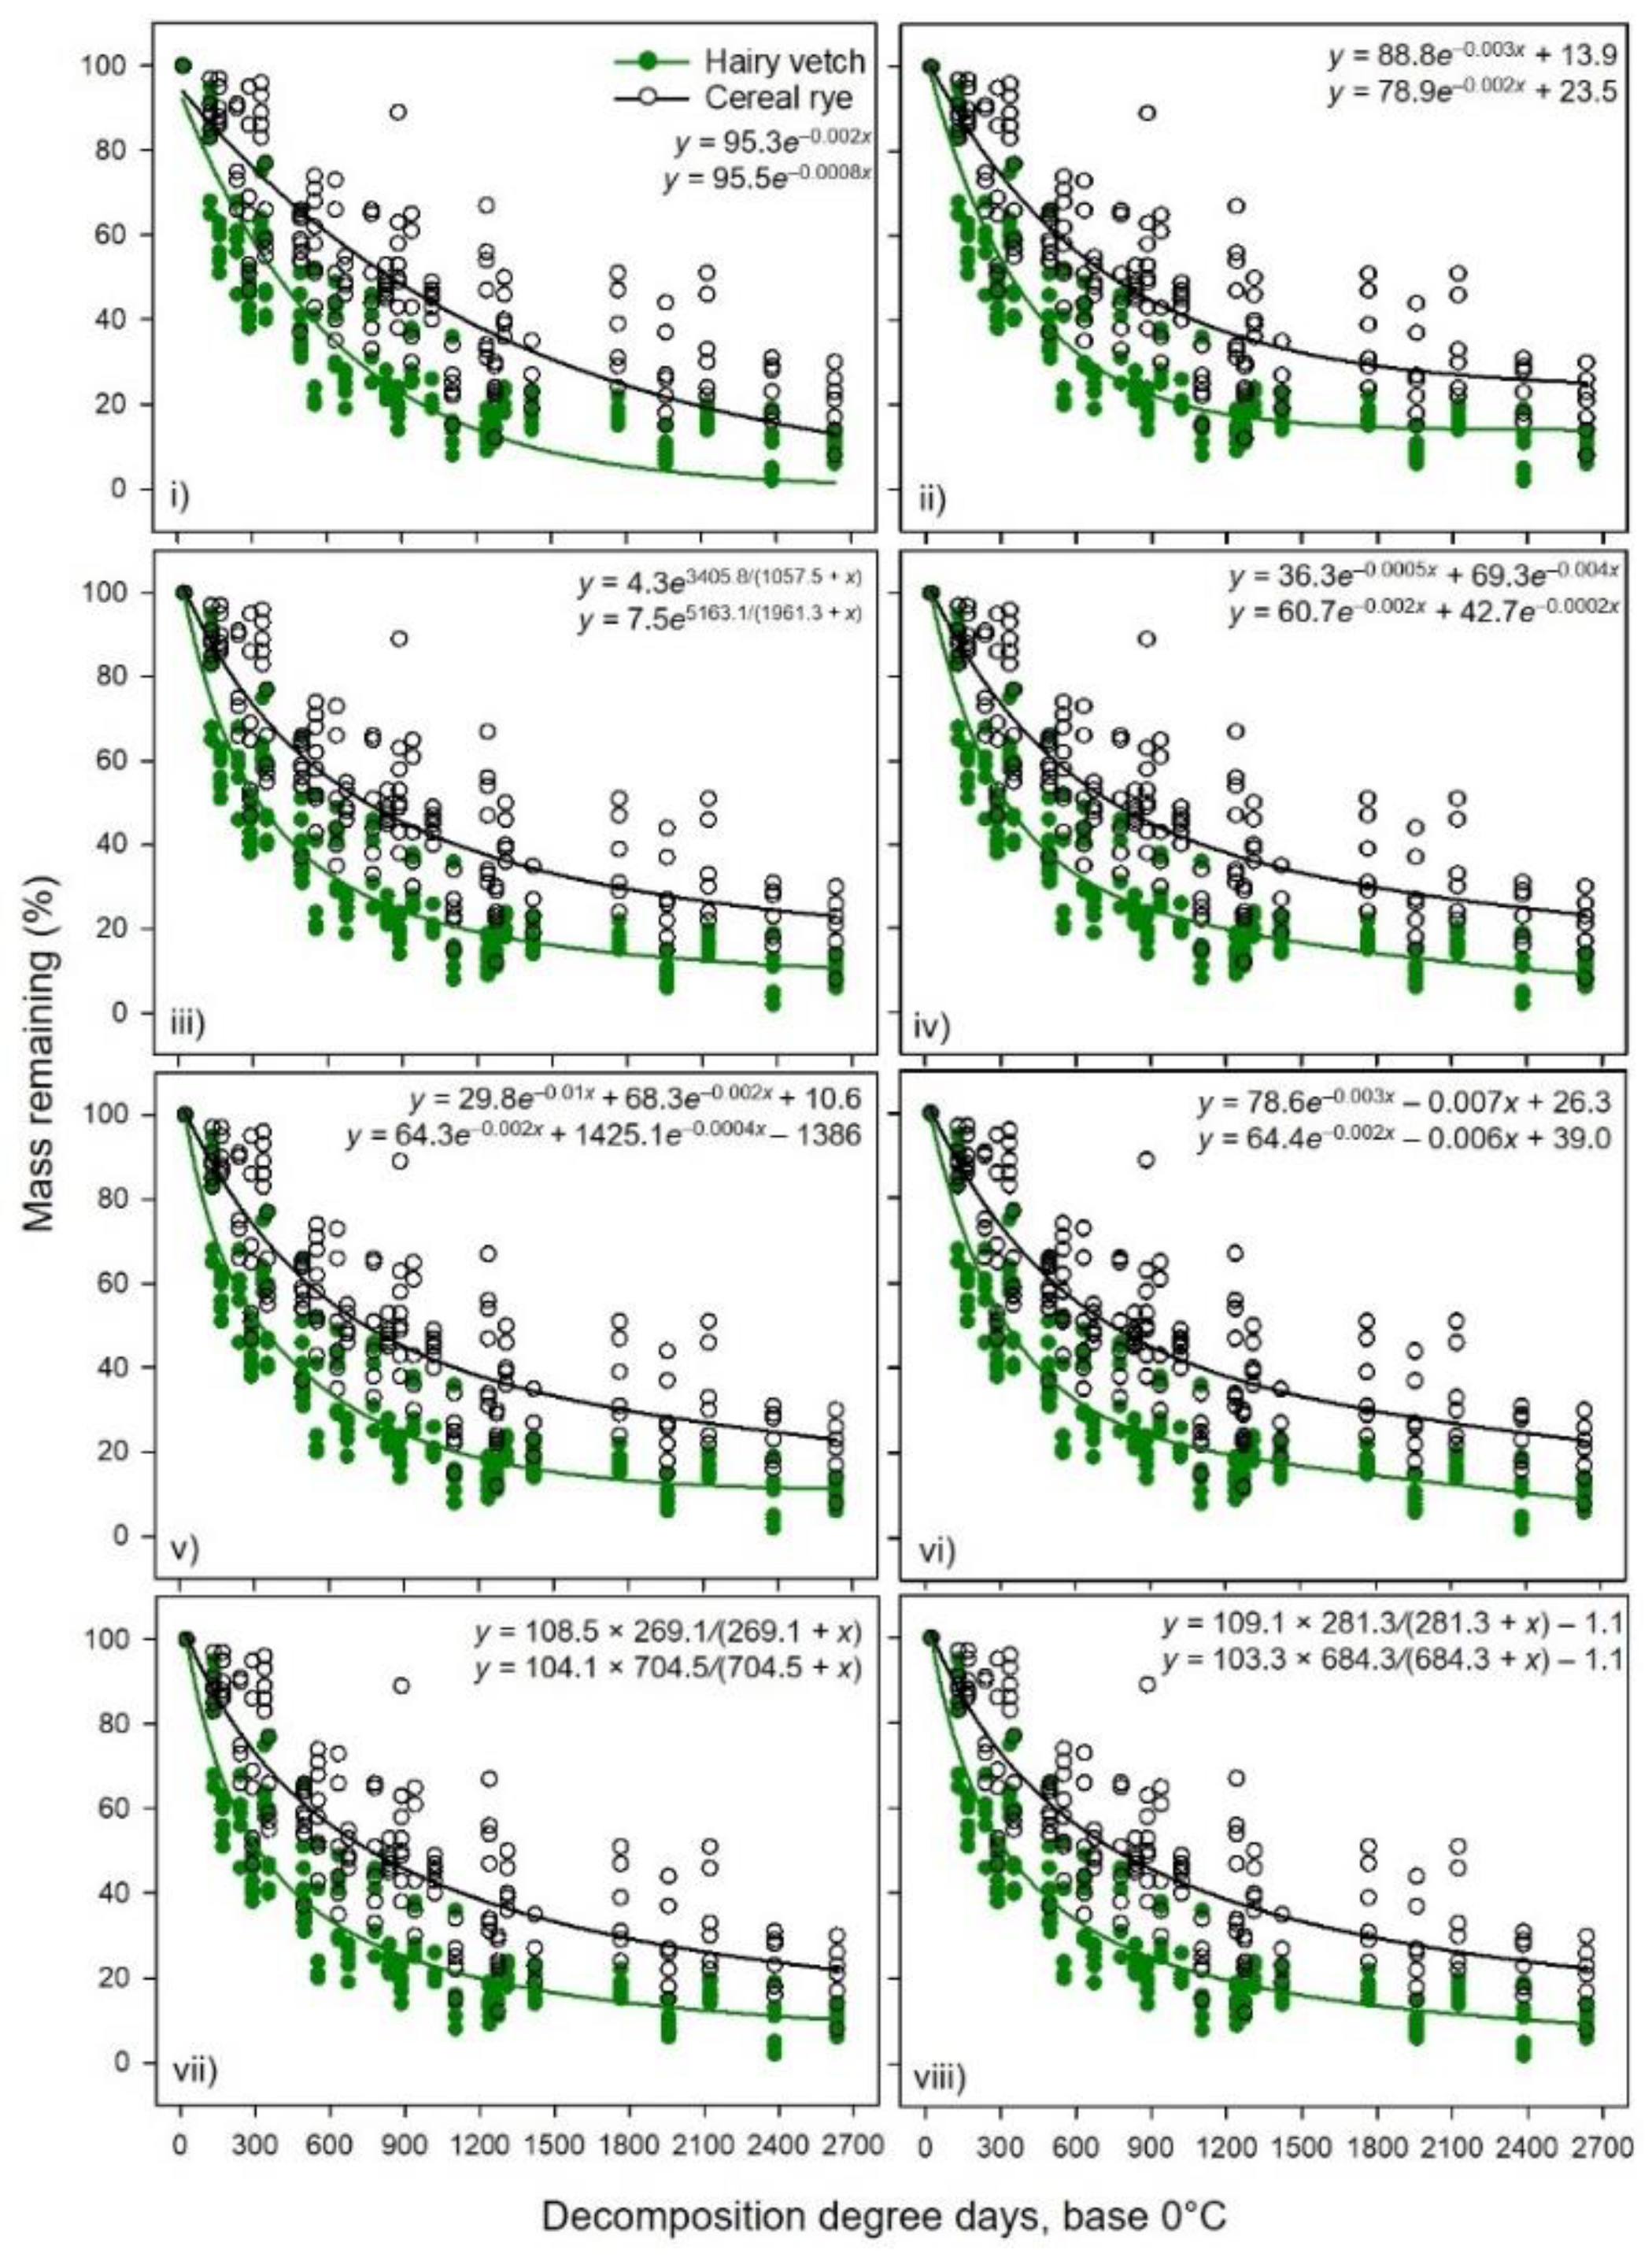
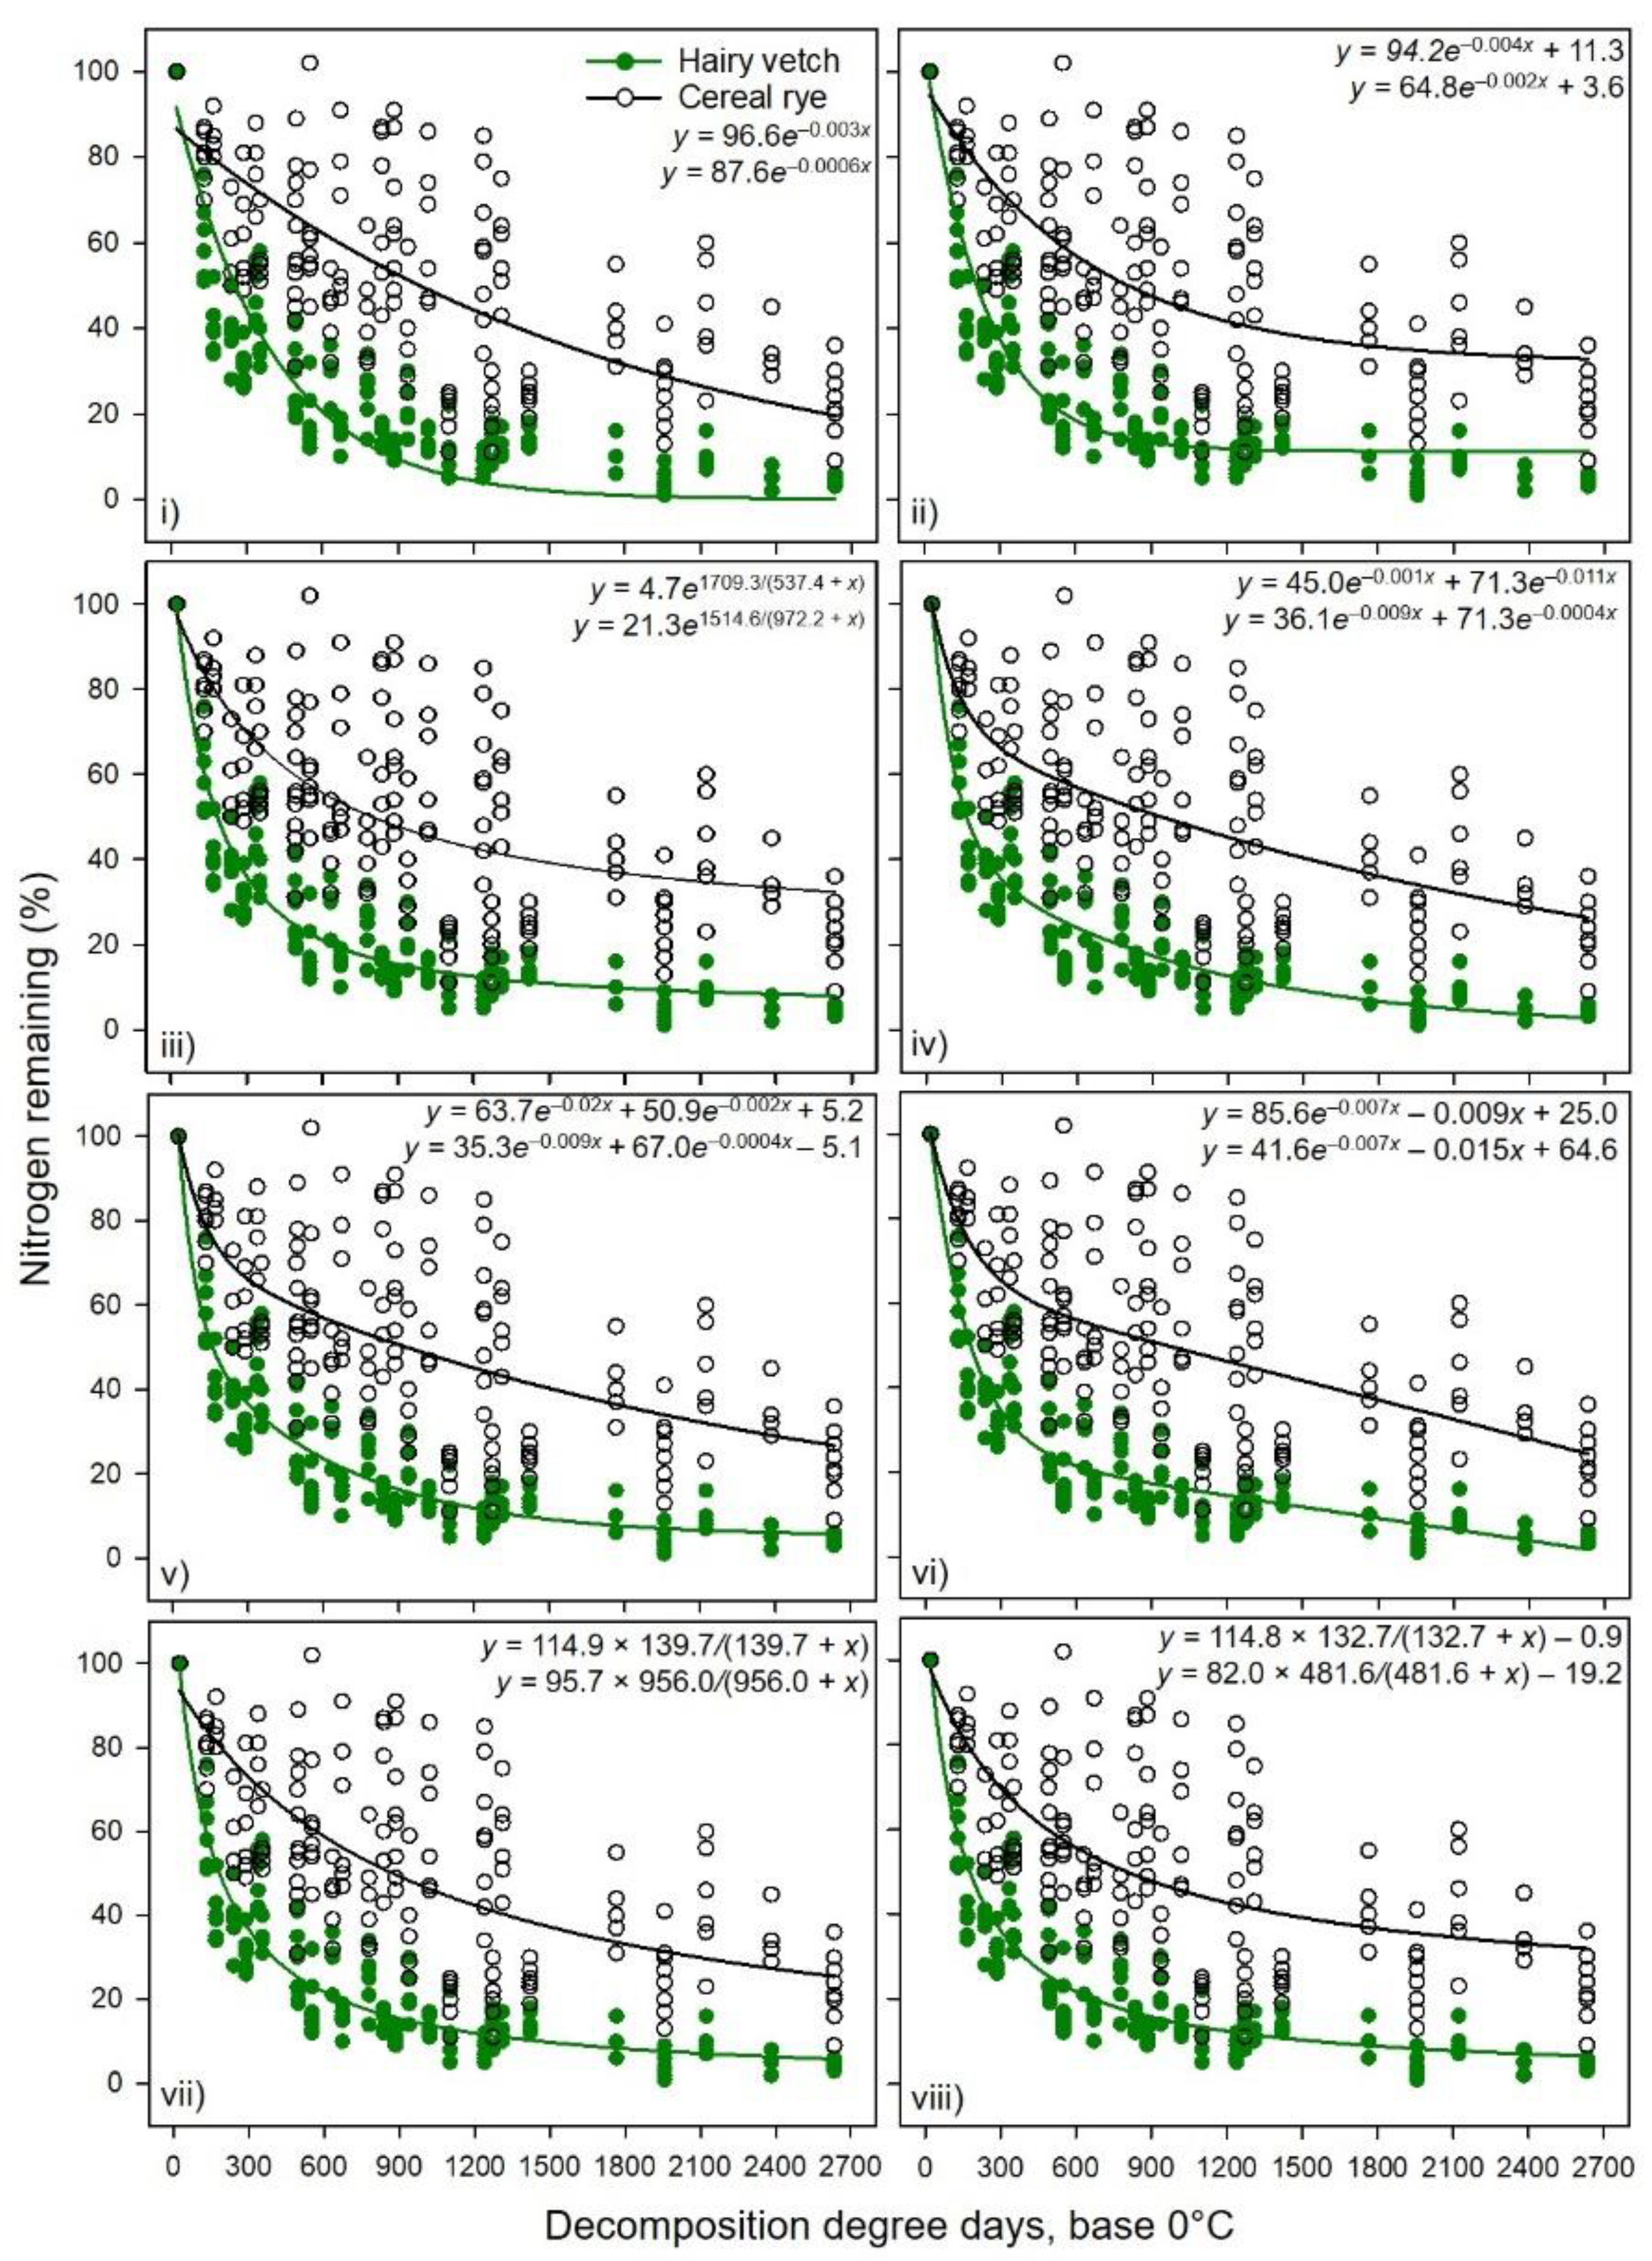
The current study provides an overview of performances of the commonly used empirical models in CC decomposition and N mineralization studies. The objective of this research was to examine eight mathematical models to test their statistical significance in explaining cereal rye and hairy vetch decay and N mineralization in a sub-humid environment. Mass and N remaining of CC residue were fitted with six exponential and two hyperbolic models, and statistical parameters were compared for those models. An empirical model with the highest adjusted R2 and lowest residual sum of squares and Akaike information criterion (AIC; [24]) may be considered best for decomposition studies.

2. Materials and Methods

2.1. Experiment Locations

Data from two experiments (Experiment 1, [5]; Experiment 2, [25]), comprised of two different intervals, were used to carry out this study. Both studies were conducted at the Agronomy Research Center (ARC, 37.7029 N, −89.2403 W and 38.185 N, −89.4592 W, respectively) at Southern Illinois University, Carbondale, IL. Soil series at both locations were Hosmer silt-loam (fine, silty, mixed, active, mesic Oxyaquic Fraguidalfs). Research design, treatments, site soil properties, and weather conditions were described in greater detail by Sievers and Cook [5] and Singh et al. [25]. Exp. 1 location received nearly 540 mm cumulative rainfall (> 80% within 67 d after beginning the trial) during the study period in 2015, while 482- and 414-mm cumulative rainfall were recorded in 2017 and 2018 in Exp. 2, respectively. The Exp. 2 location received > 50% of the total rainfall within 12 d in 2017, whereas ~ 70% of the cumulative rainfall was received within the first two months in 2018. In Exp. 1, the maximum average daily temperature recorded was 34.9 °C on 6 July 2015 and the minimum was 5.9 °C on 3 May 2015. The maximum daily temperature (32.9 and 35.7 °C) recorded in Exp. 2 was on 5 and 14 June in 2017 and 2018, respectively, while the minimum daily temperature of 2.6 and 7.4 °C was recorded on 24 April and 8 May in 2017 and 2018, respectively. The soil volumetric water content in the top 15 cm was 0.15 to 0.30 m3 m−3 for Exp. 1, whereas the top 5-cm soil profile ranged from 0.15 to 0.42 m3 m−3 and 0.07 to 0.37 m3 m−3 for Exp. 2 in 2017 and 2018, respectively.

2.2. Sampling and Data Collection

In Exp. 1, CC biomass was collected in spring 2015 from two locations: cereal rye from Kuehn research farm (37.933548 N, −89.244436 W) of the Southern Illinois University, Carbondale, IL; whereas hairy vetch was obtained from the ARC. The experiment was overlaid as a portion of a larger trial where only the no-till subsystem plots were used for the decomposition study. Hairy vetch and cereal rye were terminated on 15 and 23 April 2015, respectively, using glyphosate [N-(phosphonomethyl) glycine] at 1.26 kg ae ha−1. Aboveground biomass was clipped 3 to 4 d after burndown and air-dried for 1 wk to be used as a residue in the litterbags, whereas samples clipped before herbicide application were oven-dried to determine in situ CC production and C to N ratio. Belowground biomass was collected by taking intact root cores of 5 cm in diameter and 15 cm in length. Ten grams of air-dried aboveground CC biomass was placed into traditionally made 20 × 20 cm nylon mesh bags, with 5 mm mesh on the upper side and 2 mm mesh on the bottom. The aboveground biomass used was equivalent to 1277 and 2203 kg ha−1 dry mass and 14.7 and 92.3 kg N ha−1 with a C to N ratio of 34.7 and 9.5 for cereal rye and hairy vetch, respectively, which was much greater than the actual in situ productivity, i.e., 578 and 791 kg ha−1 dry mass and 13.5 and 21.4 kg N ha−1 for cereal rye and hairy vetch, respectively [5]. A total of 14 litterbags were installed in each no-till sub-plot under soybean [Glycine max (L.) Merr.] and corn (Zea mays L.) main plot, which were rotated every year in four replicates, giving a total number of 112 litterbags (56 cereal rye + 56 hairy vetch). Litterbags were placed on the ground on 5 May 2015, and biomass samples were collected on the same day for ‘week 0′ sampling. After that, two litterbags per plot were collected at 2, 4, 6, 8, 12, and 16 wk after litterbag installation. Corn and soybean were planted on the 4th and 12th of June 2015, respectively, and the growth stage of the crops was noted at the time of litterbag collection. The intact root cores remained in plastic liners, wrapped with 16 mesh size at open ends were used for belowground study. The same number of cores as the litterbags were inserted 5 cm below the soil surface and collected on the same day as mentioned for the litterbags. Collected soil cores were washed to retrieve belowground biomass then oven-dried and ground to analyze for its constituents. Corn was fertilized with N at the late vegetative stage [5]. Aboveground biomass and collected residue samples for each CC were dried, ground to pass through a 1-mm screen, and analyzed for lignin, acid detergent fiber, neutral detergent fiber, and C and N concentration. The complete field events were described by Sievers and Cook [5] in greater detail.
Similarly, Exp. 2 was laid out in a completely randomized design with three replicates, overlapped on an ongoing tillage study established in fall 2013. The experiment consisted of two CCs (cereal rye and hairy vetch) under two tillage systems (reduced tillage and no-tillage), giving a total of 12 plots. Corn and soybean were grain crops in 2017 and 2018, respectively. Cover crops were killed by spraying a mixture of glyphosate at 1.26 kg ae ha−1, 2,4-D (Dichlorophenoxyacetic acid) at 0.80 kg ae ha–1, and ammonium sulfate (2.5% v/v) on 13 and 28 April in 2017 and 2018, respectively. Aboveground CC biomass was collected 2 to 3 d after spraying, washed, and air-dried for 1 to 3 d. Fifty grams of air-dried samples were packed into the litterbags of the mesh size described above for Exp. 1. The packed CC biomass was equivalent to 2206 to 2743 kg ha−1 for cereal rye and 1198 to 1624 kg ha−1 for hairy vetch dry biomass. A total of 132 litterbags were used in each year. At “wk 0” all litterbags were placed on the ground to simulate installation and returned to the lab for further analysis. Six days after “wk 0” in 2017 and 8 d after “wk 0” in 2018, tillage operation was performed at reduced treatment plots to plant the main season crop. After that, litterbags in tillage treatment were placed in a vertical opening down to 15 cm into the soil. The no-till treatment had litterbags on the soil surface throughout the study in both years. In 2017, litterbags were installed on 19 April (week 0) and then one litterbag per plot was collected weekly for 10 wks, whereas in 2018, they were placed on 2 May and collected at 1, 2, 3, 4, 5, 6, 8, 10, 12, and 14 wks after installation. Sample preparation, grinding, and lab analysis was similar to the method described above.
For both experiments, the percentage of ash-free mass remaining (MR, %) and N remaining (NR, %) at a given time was calculated using the formula:
MR or NR = (Xt/Xo) × 100
where X was the mass or N at a given time t (decomposition degree days, DDD), and Xo was the initial CC mass or N mass at week 0. To standardize time after litterbag installation based on daily air temperature and DDD, it was calculated as follows [26]:
DDD = [(TMax + TMin)/2] − TBase
where TMax and TMin are the daily maximum and minimum air temperature, respectively, TBase is the base temperature for the CC decomposition, which was considered 0 °C [26]. When TMax or TMin were less than TBase, the TMax and TMin computed were equal to TBase. For the days when TMax was greater than 30 °C, the TMax was changed to 30 °C.

2.3. Comparison of Empirical Models

Eight non-linear models were fitted to the percent mass and N remaining vs. accumulated DDD. One of the first-order decay models tested was a two-parameter single exponential decay model by Stanford and Smith [27], which captures the gradually slowing absolute rate of mass loss over time at a constant temperature and moisture [28]:
y = aebx
where a is the y-intercept or numeric constant to satisfy the model, b is the relative decay rate or proportionality constant, and x is an independent variable or time. Howard and Howard [29] and Wieder and Lang [30] added an asymptote (yₒ) to capture the resistant litter fraction (Equation (4)).
y = aebx + yₒ
A modified three-parameter single exponential decay model [9,11] has also been used to compare with other exponential models as provided by Systat Software [31] (Equation (5)).
y = aeb/(c + x)
where c is the numeric constant. Single exponential models have been criticized for not representing the transition from rapid to slow decomposition, whereas the double exponential model with two single exponential components, which consists of two decay or mineralization rate constants, is reported to be a better alternative [9,19,32]. A four-parameter double exponential model can be written as Equation (6) [33].
y = aebx + cedx
where a and c are the constants and b and d are the rates of decay of available (light) and resistant (heavy) fractions of residue, respectively. An asymptote can be added to Equation (6) to further catchup the resistant fraction of the residue. The five-parameter function used was [31]
y = aebx + cedx + yₒ
A double-pool model was reported in yielding significantly smaller root mean square errors in which one pool was assumed to mineralize exponentially and the second pool worked according to zero-order kinetics [10,34] for modeling the flush of N mineralization caused by drying and rewetting soils.
y = aebx + cx + yₒ
where c is also the rate constant for the mineralization of the slow pool fraction of the residue.
Besides exponential decay models, hyperbolic equations were also found effective in explaining N mineralization in soils [16]. The two-parameter hyperbolic decay model tested in our study was
y = ab/(b + x)
where b is the rate constant. The three-parameter hyperbolic model with asymptote was also used for comparison [31].
y = ab/(b + x) + yₒ
The data were subjected to a Lavene’s test and Shapiro Wilk test for variance and normality of data at α = 0.05, respectively, using PROC NLIN in SAS 9.4 (SAS Institute, Cary, NC). In addition, partial residual plots for mass and N remaining against time were visually analyzed to confirm the non-linear pattern of data. Then, models were fitted for percent mass remaining and N remaining for each of the studies and CCs using SigmaPlot 14.0 [31]. For Exp. 1, models were fitted for aboveground and belowground root biomass. Data from two tillage treatments were combined within each CC for Exp. 2 for both study years. The iterative method adopted in SigmaPlot was based on the Marquart-Levenberg algorithm [35] for all non-linear models. Models were compared based on normality, the constant variance test [31,36], and the Durbin-Watson test [37] to detect positive or negative autocorrelation of residuals. These tests were conducted at α = 0.05, where the models were assumed to be passed or failed based on a given standard criterion. Test statistics such as adjusted R2, standard error of estimate (SEE), residual mean squares (RMS), predicted residual error sum of squares (PRESS), and Akaike information criterion was also used for model comparison. Model fitting excluded influential outliers using Leverage and Cook’s D.
The Akaike information criterion is good for model selection; however, with the increase in complexity of the model, such as from single to multiple exponential functions, the AIC may fail to select the best model because the criterion assumes that the true model is among the candidate pool, in a condition that none of the models are representing a complete set of data. To solve the problem, the PRESS statistic has often been used for cross-validation of models, which uses a predicted set of samples to provide an unbiased evaluation of predictability of the model [38]. Models passed normality, variance test, and residual test with the highest adjusted R2, and the lowest SEE, RMS, PRESS, and AIC values were considered the best fit for hairy vetch and cereal rye CC decomposition and nutrient mineralization. Model parameters were estimated for each species, year, and study. Regression plots were obtained from SigmaPlot 14.0 [31].

3. Results

3.1. Modeling Percent Mass Remaining

Statistical values and parameters of eight different non-linear models explaining the percent mass remaining of CC residues are given in Table 1, Table 2, Table 3 and Table 4. All models were valid in predicting mass loss (P < 0.001). For hairy vetch aboveground residue in Exp. 1, all models had an R2 value of 0.97 except for the two-parameter single exponential decay model (0.91) (Table 1). The modified three-parameter single exponential function had the lowest RMS, SEE, PRESS, and AIC values. Although five-parameter double exponential and hyperbolic decay models had SEE comparable to the modified single exponential model, these models failed the tests for normality and independence of residuals (Durbin-Watson), whereas the modified single exponential model passed those tests, including the constant variance of errors. The four-parameter double exponential model produced greater R2 and lower SEE and PRESS statistics, while the four-parameter single exponential with linear combination resulted in a comparable R2 and SEE to the double exponential model, and lower RMS and AIC for cereal rye aboveground biomass (Table 1). However, the latter failed the normality test and the test for independence of residuals. The double exponential model passed all those test criteria and appeared to be a promising model for aboveground cereal rye residue decomposition. The five-parameter double exponential model with an asymptote had non-significant rate constants, especially for the resistant fraction of the cereal rye residue.
The model that reduced AIC and PRESS statistics in Table 2 was the two-parameter hyperbolic decay for hairy vetch belowground biomass decay. Nevertheless, the four-parameter double exponential model best minimized the RMS and SEE. However, double exponential models had a non-significant rate constant (P > 0.01) for slow pool fraction and failed assumption of normally distributed population. Belowground mass remaining for cereal rye was also explained better by the two-parameter hyperbolic decay model, which best minimized RMS and SEE with the highest adjusted R2 and the lowest AIC and PRESS statistic (Table 2). The model also satisfied the assumption of normally distributed population, constant variance, and independence of residuals. Double exponential models had at least one of the parameters as non-significant in predicting the hairy vetch and cereal rye mass decomposition.
Table 3 compares the models for aboveground biomass decomposition for hairy vetch and cereal rye from Exp. 2. Model performances did not vary between tillage treatment when the parameters were compared (P > 0.05). Across the tillage treatments, the five-parameter double exponential model with an asymptote best minimized the RMS and SEE and gave the lowest AIC and PRESS, relative to other close models for hairy vetch decomposition. It also passed the tests for normality, variance, and independence of residuals. All models generated the same adjusted R2 value (0.90) except for a simple single exponential function (0.86) for hairy vetch (Table 3). None of the models passed all tests for normality, constant variance, and independence of residuals for cereal rye percent mass remaining. The five-parameter double exponential model passed the tests for normality and constant variance at α = 0.05 but produced non-significant estimates of parameters. The single exponential with an asymptote yielded the lowest PRESS and AIC and passed tests for normality and independence of residuals at α = 0.05 with significant model parameters. This single exponential model was found to be best for cereal rye in Exp. 2.
We compared the fitness of exponential and hyperbolic functions to combined data from two studies (Table 4) as portrayed by Figure 1. The shape of the decay models followed a pattern of rapid mass loss from day 0 to nearly 1000 accumulated DDD and a slow rate of decomposition afterward (Figure 1). All models produced very high adjusted R2 and low SEE values except a two-parameter single exponential model for both CC residues. None of the models passed all three statistical tests viz. test for normality, constant variance, and independence of residuals for both hairy vetch and cereal rye. Results showed better fit with five-parameter double exponential plus an asymptote than the single exponential and hyperbolic models for hairy vetch CC decomposition. However, the two-parameter hyperbolic model also produced standard errors and AIC values close to the five-parameter double exponential model in minimizing RMS, SEE, and AIC. Despite that, the choice between the five-parameter double exponential and two-parameter hyperbolic model would suggest the former model as the best fit with significant heteroskedasticity (Table 4). In contrast to the exponential models, the two-parameter hyperbolic model seemed to have the best fit for the cereal rye percent mass remaining data, as the SEE, RMS, PRESS, and AIC appeared lower than or equal to exponential and three-parameter hyperbolic models. This model also passed the test for the constant variance of the errors. Overall, the five-parameter double exponential model with an asymptote appeared suitable for hairy vetch decomposition modeling, whereas cereal rye had inconsistent results for individual small datasets and the two-parameter hyperbolic model for the combined data.

3.2. Modeling Percent Nitrogen Remaining

Nitrogen released from above- and belowground CC residue was non-linear with accumulated DDD (P < 0.001). The results followed a similar pattern to those of the percent mass remaining of the residue. Table 5, Table 6, Table 7 and Table 8 describes the parameter estimates and test statistics for the six exponential and two hyperbolic decay models. Table 5 shows results from Exp. 1 for percent N remaining of aboveground CC residue. The adjusted R2 of the models was near perfect (>0.96) while for cereal rye it ranged from 0.67 to 0.70 when fit to percent N remaining data (Table 5). All models passed the constant variance of residuals test for both CCs except for the three-parameter single exponential model with an asymptote. The modified three-parameter single exponential model appeared to have the best fit for the hairy vetch percent N remaining, which minimized RMS and SEE and lowered the PRESS and AIC statistics, relative to other decay models. For the aboveground cereal rye percent N remaining, the four-parameter single exponential model with the linear combination had the highest adjusted R2 (0.70) and the lowest RMS, SEE, PRESS, and AIC values in relation to other exponential and hyperbolic models (Table 5), but the rate constant was not significant. This means the model cannot explain the N release rates. Thus, the three-parameter single exponential model was chosen based on relatively smaller SEE, RMS, and AIC and greater adjusted R2. This model also passed assumptions for the normal population, constant variance, and independence of residuals.
Table 6 shows fit parameters and statistics for below-ground CC residue from Exp. 1. Four- and five-parameter exponential models had non-significant decay rate constants for the slow pool of the residue and had relatively higher RMS and AIC than hyperbolic functions. The two-parameter hyperbolic model produced high adjusted R2 and minimized RMS, SEE, PRESS, and AIC for hairy-vetch N remaining data when compared to exponential and three-parameter hyperbolic decay models. For cereal rye N remaining, three-parameter hyperbolic decay function with an asymptote fitted best in minimizing RMS, SEE, and AIC, while the model also passed the assumption of normality, constant variance, and independence of residuals.
All models fitted to percent N remaining data from Exp. 2 failed the normality test (Table 7); however, some of the models passed the constant variance and independence of residual tests. The five-parameter double exponential model with an asymptote fitted to the percent N remaining data for hairy vetch best minimized the RMS, SEE, PRESS, and AIC with the greatest adjusted R2 value and significant rate constants. The model also passed a test for constant variance and independence of residuals. The model that best minimized the RMS and SEE for the percent N remaining of cereal rye was the modified three-parameter single exponential. The model produced the greatest R2 and had the lowest AIC value. However, the tests for normality, variance, and residuals were not satisfied by any of the models for cereal rye.
Similar to the individual studies, the five-parameter double exponential model fitted best for the combined dataset with very high adjusted R2 (0.94) and the lowest SEE, RMS, PRESS, and AIC values for hairy vetch N remaining (Table 8). All models failed the test for normality for both CCs. The five-parameter double exponential function passed a test for constant variance and independence of residuals. For cereal rye percent N remaining, the three-parameter hyperbolic model with an asymptotic best minimized the RMS and SEE and had the lowest PRESS and AIC values (Table 8). None of the models could satisfy the assumption of normality, constant variance, and independence of residuals. The double exponential model also produced high adjusted R2 and minimized the RMS and SEE, but had non-significant rate constants for percent N remaining of cereal rye residue. The modified three-parameter single exponential model was equally as good as the hyperbolic decay model.
Figure 2 visualizes the pattern of those selected exponential decay models where more than 80% of the hairy vetch N was mineralized within the first 600 accumulated DDD and nearly 50% cereal rye N was mineralized within 1000 accumulated DDD from the period of total 2700 DDD. It indicates that there were two phases of N release into the soil: progressive and lag. The rapid N release rate during the progressive phase took less than 25% of the total DDD for hairy vetch and less than 40% of the total DDD for cereal rye CC residue. Overall, hairy vetch N dynamics clearly followed double exponential function, while the cereal rye exhibited mostly the hyperbolic decay function for mass and N remaining. Cereal rye produced higher residuals than hairy vetch because of more spread of the data, especially during the initial decomposition period.

4. Discussion

Results showed a stronger relationship between percent mass or N remaining (high adjusted R2, Table 1, Table 2, Table 3, Table 4, Table 5, Table 6, Table 7 and Table 8) of hairy vetch CC residue and cumulative DDD than that of cereal rye residue (Figure 1 and Figure 2). The decomposition rate constants and asymptotes were dissimilar for these two CCs (Table 1, Table 2, Table 3, Table 4, Table 5, Table 6, Table 7 and Table 8). Although Exp. 2 had two tillage systems (reduced vs. no-tillage), there was no effect on decomposition rate constant and N release in 2017 and 2018 [25], indicating that the management factor had lesser impact than the substrate quality factor. The inherent plant chemical constituents determine the rate of decomposition and N mineralization into the soil [4]. In both CC decomposition experiments, the CN ratio was greater for cereal rye (35:1 and 24:1 for Exp. 1 and 2, respectively) than hairy vetch (10:1, 9:1 for Exp. 1 and 2, respectively) [5,25]. Greater N concentration and less fiber content in hairy vetch may have accelerated the decomposition and N release in the early days or with less accumulated DDD, a relationship reported by Ruffo and Bollero [13] and Otte et al. [39]. Nitrogen and soluble carbohydrate fraction of the plant residue enhanced the microbial growth efficiency and improved the bermudagrass residue decomposition in FL, USA [9]. In both experiments, the residuals were higher for the cereal rye mass remaining and N release data than for hairy vetch. The lack of fit was due to large variability in initial mass and N content of cereal rye and immobilization of the N in the first 4 wks [5]. Rufo and Bollero [13] also reported the lack of fit for cereal rye when compared to hairy vetch. The presence of high neutral detergent fiber and lignin concentration [5] likely influenced the tensile strength of leaves and decomposability of cereal rye, which provide mechanical and chemical defense against microbial and chemical degradation [40]. Cornelissen et al. [41] reported that leaf tensile strength was related to litter decomposition for C3 grasses and also suggested that the complex leaf base content of the grass species can result in high variation in mass and N loss.
The greater adjusted R2 values and lower standard errors with the double exponential model with two rate constants when compared to a single exponential with or without an asymptote, especially for hairy vetch CC residue, indicated two residue pools, i.e., fast and slow decomposing fractions. This could be due to the presence of labile versus and recalcitrant fractions of the plant materials. However, in some cases, the addition of asymptotic or linear or another exponential component to the simple single exponential model resulted in non-finite residuals and failed to cross-validate the model, mainly for cereal rye for individual datasets from Exp. 1 and 2. In such cases, the slopes (or rate constants) for the double exponential model or exponential model with the linear combination had poor predictability at α ≤ 0.01. This indicates that the sample size was too small to have a sufficient sampling frame for the model, which gave undue weight to the initial data points for the short study period. We noticed that the issue of non-finite residuals was eliminated with combined data from Exp. 1 and 2, which extended the x-axis from 14 wk (cumulative DDD = 2382) to 16 wk (cumulative DDD = 2633) and increased the number of XY pairs. That was the reason Otte et al. [39] suggested using the simple asymptotic model rather than a double exponential model for cereal rye biomass decomposition. However, an asymptotic model may not always give the best results when compared to non-asymptotic models. The plant chemical constituents and environmental conditions may also affect the model performances [40,42]. Both of our experiments received more than half of the total cumulative rain in the first few weeks and the volumetric soil water content was near the field capacity, which might help accelerate the residue degradation as most of the soil microbes are highly active and thrive under moist warm conditions [42]. Hairy vetch aboveground biomass was well represented by a double exponential model with an asymptote with high R2 and minimal residual errors and AIC with shorter fast-pool turnover time (~25% of the total accumulated DDD), compared to that of cereal rye (~40% of the total accumulated DDD). Juma et al. [16] suggested that a model of N cycling in soil should have at least three to four compartments to account for different sources of N.
Only hyperbolic models produced relatively low RMS, SEE, AIC, and PRESS statistics for the belowground hairy vetch and cereal rye percent mass and N remaining, while exponential models showed poorer fits. The fast-pool turnover time of belowground residue mass was shorter than that of aboveground biomass owing to its immediate proximity to soil biotic and abiotic environments [43,44,45]. Similar to aboveground biomass, there was a difference in mass loss and N release from belowground mass between hairy vetch and cereal rye. However, the pattern of decaying was different for belowground biomass even though the CN ratio of root mass was in line with aboveground litter, which was 17:1 for hairy vetch and 40:1 for cereal rye [5]. Sun et al. [43] found distinct traits other than the CN ratio that controls root decomposition where N was not the major driver, but C compounds associated with mycorrhiza were the major factors. They reported a poorer fit of the double exponential model for the root mass remaining data. The parameter estimates vary more with the model fitting procedure for exponential equations than the hyperbolic models [16]. The reason is that the first-order equation assumes that the rate of mineralization is proportional to the initial size (MR0 or NR0) of the mineralizable pool [27], which might be affected by environmental and management factors and generate more variance. In our study, the belowground initial mineralizable pool was considerably smaller than the aboveground pool, and a significant portion of root mass remained undecomposed after 550 DDD [5]; thus, exponential models produced an ambiguous estimate of parameters. The evidence of a wide range of parameter estimates of the first-order equation was also reported by Nicolardot et al. [46] and Talpaz et al. [47].
The asymptotic approach used by Sievers and Cook [5] and Singh et al. [25] in Exp. 1 and 2, respectively, to estimate decomposition and N mineralization rate had higher RMS and SEE than the double exponential and hyperbolic models for both crops. The point of contention was that the single exponential asymptotic model mostly departed from the assumption of normally distributed population, constant variance, and independence of residuals. However, the lignin content of the plant materials leaves a certain amount of highly recalcitrant compound in the late stages of decomposition, despite having a high rate of decomposition, which can typically be addressed by the asymptotic form of equations [43]. However, use of an asymptote in a single exponential model for a short study period may limit the first-order decomposable pool to a smaller fraction and might give undue weight to the slowly decomposing fraction than the relatively long period. It is difficult to infer the persistence of the recalcitrant fraction and conversion of residue into the soil organic matter based on mass loss and N remaining data [48,49]. The addition of C dynamics and microbial growth rate factors in the study would be a step towards the empirical calculation of soil organic matter conversion. However, the current study was able to detect the statistical precision and fitness of the commonly used models in decomposition and N dynamics studies. Finding control mechanisms that fitted hyperbolic function to the root decomposition data would extend the prospect of this study.

5. Conclusions

The double exponential model with an asymptote can be used to determine hairy vetch aboveground biomass decomposition or N release rates as the model best minimized the standard errors and passed the selection criteria with minimal PRESS and AIC values. However, the modified single exponential model is equally as good as the double exponential for hairy vetch mass and N release rates in the sense that the model can generate valid parameters even for small datasets. To determine the cereal rye decomposition and N release rates, the hyperbolic decay models gave equal weight to the data points, which best estimated the parameters and minimized the residual sum of squares than exponential models. The hyperbolic model had the flexibility to be used with or without asymptote and had a narrow range of rate constants. Hyperbolic models can be used for belowground biomass and can also remove the problem of undue weight to the initial data points that the first-order exponential model gives. Use of best models specific to cereal rye and hairy vetch would give unbiased prediction. We recommend double exponential function with an asymptote for aboveground hairy vetch and the hyperbolic model for cereal rye mass loss and N release. While this modeling study covered hairy vetch and cereal rye decomposition in a humid subtropical region, imposing a different environment might alter the model performance. Specifically, temperature and precipitation may change the rate of decomposition and N release. Investigation of the performance of the best selected models in this study to different legumes and grasses would be the next step in validating the current research results in broader scenarios.

Author Contributions

Conceptualization, M.D.; methodology, M.D.; data collection, G.S., T.S., R.L.C.; software, M.D.; data curation, M.D.; validation, M.D.; formal analysis, M.D.; visualization, M.D.; writing—original draft preparation, M.D.; writing—review and editing, M.D., G.S., R.L.C. All authors have read and agreed to the published version of the manuscript.

Funding

Funding for this project was provided by the Illinois Nutrient Research and Education Council.

Acknowledgments

We would like to thank Jackie Crim and Shelly Williard for help with processing the CN analysis of the data.

Conflicts of Interest

The authors declare no conflicts of interest.

References

  1. Meisinger, J.J.; Ricigliano, K.A. Nitrate Leaching from Winter Cereal Cover Crops Using Undisturbed Soil-Column Lysimetersle. J. Environ. Qual. 2017, 46, 576–584. [Google Scholar] [CrossRef]
  2. Balestrini, R.; Lumini, E.; Borriello, R.; Bianciotto, V. Chapter 11-Plant-Soil Biota Interactions. In Soil Microbiology, Ecology and Biochemistry, 4th ed.; Paul, E.A., Ed.; Academic Press: Boston, MA, USA, 2015; pp. 311–338. [Google Scholar] [CrossRef]
  3. Lupwayi, N.Z.; Clayton, G.W.; O’Donovan, J.T.; Harker, K.N.; Turkington, T.K.; Rice, W.A. Decomposition of crop residues under conventional and zero tillage. Can. J. Soil Sci. 2004, 84, 403–410. [Google Scholar] [CrossRef]
  4. McDaniel, M.D.; Grandy, A.S.; Tiemann, L.K.; Weintraub, M.N. Crop rotation complexity regulates the decomposition of high- and low-quality residues. Soil Biol. Biochem. 2014, 78, 243–254. [Google Scholar] [CrossRef] [Green Version]
  5. Sievers, T.; Cook, R.L. Aboveground and Root Decomposition of Cereal Rye and Hairy Vetch Cover Crops. Soil Sci. Soc. Am. J. 2018, 82, 147–155. [Google Scholar] [CrossRef]
  6. Wynn, J.G.; Bird, M.I. C4-derived soil organic carbon decomposes faster than its C3 counterpart in mixed C3/C4 soils. Glob. Chang. Biol. 2007, 13, 2206–2217. [Google Scholar] [CrossRef]
  7. Thomas, R.J.; Asakawa, N.M. Decomposition of Leaf-Litter from Tropical Forage Grasses and Legumes. Soil Biol. Biochem. 1993, 25, 1351–1361. [Google Scholar] [CrossRef]
  8. Andren, O.; Paustian, K. Barley Straw Decomposition in the Field—A Comparison of Models. Ecology 1987, 68, 1190–1200. [Google Scholar] [CrossRef]
  9. Berndt, W.L. Double Exponential Model Describes Decay of Hybrid Bermudagrass Thatch. Crop Sci. 2008, 48, 2437–2446. [Google Scholar] [CrossRef]
  10. Cabrera, M.L. Modeling the Flush of Nitrogen Mineralization Caused by Drying and Rewetting Soils. Soil Sci. Soc. Am. J. 1993, 57, 63–66. [Google Scholar] [CrossRef]
  11. Dhakal, M.; West, C.P.; Villalobos, C. Establishment and Stand Development of Alfalfa Interseeded into Native Grass Mixture: Cultivar and Row Spacing Effects. Crop Sci. 2019, 59, 2271–2279. [Google Scholar] [CrossRef]
  12. Harmon, M.E.; Nadelhoffer, K.J.; Blair, J.M. Measuring decomposition, nutrient turnover, and stores in plant litter. In Standard Soil Methods for Long-Term Ecological Research; Robertson, G.P., Bledsoe, D.C.C.C.S., Sollins, P., Eds.; Oxford University Press Inc.: London, UK, 1999; pp. 202–240. [Google Scholar]
  13. Ruffo, M.L.; Bollero, G.A. Modeling rye and hairy vetch residue decomposition as a function of degree-days and decomposition-days. Agron. J. 2003, 95, 900–907. [Google Scholar] [CrossRef]
  14. Polglase, P.J.; Attiwill, P.M.; Adams, M.A. Nitrogen and Phosphorus Cycling in Relation to Stand Age of Eucalyptus-Regnans F-Muell.2. N-Mineralization and Nitrification. Plant Soil 1992, 142, 167–176. [Google Scholar] [CrossRef]
  15. Fernandez, I.; Cabaneiro, A.; Carballas, T. Carbon mineralization dynamics in soils after wildfires in two Galician forests. Soil Biol. Biochem. 1999, 31, 1853–1865. [Google Scholar] [CrossRef]
  16. Juma, N.G.; Paul, E.A.; Mary, B. Kinetic-Analysis of Net Nitrogen Mineralization in Soil. Soil Sci. Soc. Am. J. 1984, 48, 753–757. [Google Scholar] [CrossRef] [Green Version]
  17. Alvarez, R.; Alvarez, C.R. Soil organic matter pools and their associations with carbon mineralization kinetics. Soil Sci. Soc. Am. J. 2000, 64, 184–189. [Google Scholar] [CrossRef]
  18. Couˆteaux, M.-M.; Bottner, P.; Berg, B. Litter decomposition, climate and liter quality. Trends Ecol. Evol. 1995, 10, 63–66. [Google Scholar] [CrossRef]
  19. Molina, J.A.E.; Clapp, C.E.; Shaffer, M.J.; Chichester, F.W.; Larson, W.E. Ncsoil, a Model of Nitrogen and Carbon Transformations in Soil-Description, Calibration, and Behavior. Soil Sci. Soc. Am. J. 1983, 47, 85–91. [Google Scholar] [CrossRef]
  20. Wang, W.J.; Smith, C.J.; Chen, D. Predicting soil nitrogen mineralization dynamics with a modified double exponential model. Soil Sci. Soc. Am. J. 2004, 68, 1256–1265. [Google Scholar] [CrossRef]
  21. Camargo, F.A.D.O.; Gianello, C.; Tedesco, M.J.; Riboldi, J.; Meurer, E.J.; Bissani, C.A. Empirical models to predict soil nitrogen mineralizations. Ciênc. Rural 2002, 32, 393–399. [Google Scholar] [CrossRef] [Green Version]
  22. Dendooven, L.; Merckx, R.; Verstraeten, L.M.J.; Vlassak, K. Failure of an iterative curve-fitting procedure to successfully estimate two organic N pools. Plant Soil 1997, 195, 121–128. [Google Scholar] [CrossRef]
  23. Poffenbarger, H.J.; Mirsky, S.B.; Weil, R.R.; Kramer, M.; Spargo, J.T.; Cavigelli, M.A. Legume Proportion, Poultry Litter, and Tillage Effects on Cover Crop Decomposition. Agron. J. 2015, 107, 2083–2096. [Google Scholar] [CrossRef]
  24. Akaike, H. Information Theory and an Extension of the Maximum Likelihood Principle. In Selected Papers of Hirotugu Akaike; Parzen, E., Tanabe, K., Kitagawa, G., Eds.; Springer: New York, NY, USA, 1998; pp. 199–213. [Google Scholar] [CrossRef]
  25. Sing, G.; Dhakal, M.; Yang, L.; Kaur, G. Decomposition and nitrogen release of cover crops in reduced and no-tillage systems. Agron. J. 2020. [Google Scholar] [CrossRef]
  26. McMaster, G.S.; Wilhelm, W.W. Growing degree-days: One equation, two interpretations. Agric. For. Meteorol. 1997, 87, 291–300. [Google Scholar] [CrossRef] [Green Version]
  27. Stanford, G.; Smith, S.J. Nitrogen Mineralization Potentials of Soils. Soil Sci. Soc. Am. Proc. 1972, 36, 465–472. [Google Scholar] [CrossRef]
  28. Harmon, M.E.; Silver, W.L.; Fasth, B.; Chen, H.; Burke, I.C.; Parton, W.J.; Hart, S.C.; Currie, W.S.; Lidet. Long-term patterns of mass loss during the decomposition of leaf and fine root litter: An intersite comparison. Glob. Chang. Biol. 2009, 15, 1320–1338. [Google Scholar] [CrossRef] [Green Version]
  29. Howard, P.J.A.; Howard, D.M. Microbial Decomposition of Tree and Shrub Leaf Litter. 1. Weight-Loss and Chemical Composition of Decomposing Litter. Oikos 1974, 25, 341–352. [Google Scholar] [CrossRef]
  30. Wieder, R.K.; Lang, G.E. A Critique of the Analytical Methods Used in Examining Decomposition Data Obtained from Litter Bags. Ecology 1982, 63, 1636–1642. [Google Scholar] [CrossRef] [Green Version]
  31. Systat, S. SigmaPlot 10.1 User’s Manual; Systat Software: Point Richmond, CA, USA, 2006. [Google Scholar]
  32. Sierra, J. Analysis of Soil-Nitrogen Mineralization as Estimated by Exponential Models. Soil Biol. Biochem. 1990, 22, 1151–1153. [Google Scholar] [CrossRef]
  33. Bonde, T.A.; Rosswall, T. Seasonal-Variation of Potentially Mineralizable Nitrogen in 4 Cropping Systems. Soil Sci. Soc. Am. J. 1987, 51, 1508–1514. [Google Scholar] [CrossRef]
  34. Bates, D.M.; Watts, D.G. Nonlinear Regression Analysis and Its Applications; John Wiley & Sons, Inc.: New York, NY, USA, 1988. [Google Scholar] [CrossRef] [Green Version]
  35. Marquardt, D.W. An Algorithm for Least-Squares Estimation of Nonlinear Parameters. J. Soc. Ind. Appl. Math. 1963, 11, 431–441. [Google Scholar] [CrossRef]
  36. Snedecor, G.W.; Cochran, R.S. Statistical-Methods, 8th ed.; Iowa State University Press: Ames, IA, USA, 1989; pp. 38–40. [Google Scholar]
  37. Durbin, J.; Watson, G.S. Testing for serial correlation in least squares regression. I. Biometrika 1950, 37, 409–428. [Google Scholar] [CrossRef] [PubMed]
  38. Xu, S.Z. Predicted Residual Error Sum of Squares of Mixed Models: An Application for Genomic Prediction. G3 Genes Genomes Genet. 2017, 7, 895–909. [Google Scholar] [CrossRef] [PubMed] [Green Version]
  39. Otte, B.; Mirsky, S.; Schomberg, H.; Davis, B.; Tully, K. Effect of Cover Crop Termination Timing on Pools and Fluxes of Inorganic Nitrogen in No-Till Corn. Agron. J. 2019, 111, 2832–2842. [Google Scholar] [CrossRef]
  40. Gallardo, A.; Merino, J. Leaf Decomposition in 2 Mediterranean Ecosystems of Southwest Spain-Influence of Substrate Quality. Ecology 1993, 74, 152–161. [Google Scholar] [CrossRef]
  41. Cornelissen, J.H.C.; Thompson, K. Functional leaf attributes predict litter decomposition rate in herbaceous plants. New Phytol. 1997, 135, 109–114. [Google Scholar] [CrossRef]
  42. Vigil, M.F. Factors Affecting the Rate of Crop Residue Decomposition under Field Conditions. Conservation Tillage Fact Sheet Number 3–95. 1995. Available online: https://www.ars.usda.gov/ARSUserFiles/30100000/1990-1999documents/301%201995%20Vigil%20Conserv%20Tillage%20Fact%20Sht.pdf (accessed on 15 March 2020).
  43. Sun, T.; Hobbie, S.E.; Berg, B.; Zhang, H.; Wang, Q.; Wang, Z.; Hättenschwiler, S. Contrasting dynamics and trait controls in first-order root compared with leaf litter decomposition. Proc. Natl. Acad. Sci. USA 2018, 115, 10392–10397. [Google Scholar] [CrossRef] [Green Version]
  44. Kurka, A.M.; Starr, M.; Heikinheimo, M.; Salkinoja-Salonen, M. Decomposition of cellulose strips in relation to climate, litterfall nitrogen, phosphorus and C/N ratio in natural boreal forests. Plant Soil 2000, 219, 91–101. [Google Scholar] [CrossRef]
  45. Dornbush, M.E.; Isenhart, T.M.; Raich, J.W. Quantifying fine-root decomposition: An alternative to buried litterbags. Ecology 2002, 83, 2985–2990. [Google Scholar] [CrossRef]
  46. Nicolardot, B.; Recous, S.; Mary, B. Simulation of C and N mineralisation during crop residue decomposition: A simple dynamic model based on the C:N ratio of the residues. Plant Soil 2001, 228, 83–103. [Google Scholar] [CrossRef]
  47. Talpaz, H.; Fine, P.; Baryosef, B. On the Estimation of N-Mineralization Parameters from Incubation Experiments. Soil Sci. Soc. Am. J. 1981, 45, 993–996. [Google Scholar] [CrossRef]
  48. Cotrufo, M.F.; Soong, J.L.; Horton, A.J.; Campbell, E.E.; Haddix, M.L.; Wall, D.H.; Parton, A.J. Formation of soil organic matter via biochemical and physical pathways of litter mass loss. Nat. Geosci. 2015, 8, 776–779. [Google Scholar] [CrossRef]
  49. Cotrufo, M.F.; Wallenstein, M.D.; Boot, C.M.; Denef, K.; Paul, E. The Microbial Efficiency-Matrix Stabilization (MEMS) framework integrates plant litter decomposition with soil organic matter stabilization: Do labile plant inputs form stable soil organic matter? Glob. Chang. Biol. 2013, 19, 988–995. [Google Scholar] [CrossRef] [Green Version]
Figure 1. Exponential and hyperbolic decay models explaining percent mass remaining of hairy vetch and cereal rye cover crop aboveground residue against cumulative decomposition degree days at 0 °C base temperature. (i) Two-parameter single exponential, (ii) three-parameter single exponential, (iii) modified three-parameter single exponential, (iv) four-parameter double exponential, (v) five-parameter double exponential, (vi) four-parameter single exponent with linear combination, (vii) two-parameter hyperbolic, and (viii) three-parameter hyperbolic. The upper equation represents hairy vetch and the lower cereal rye. Data were pooled from Exp. 1 and 2. All models were significant at P < 0.0001.
Agronomy 10 00701 g001
Figure 2. Exponential and hyperbolic decay models explaining percent nitrogen remaining of hairy vetch and cereal rye cover crop aboveground residue against cumulative decomposition degree days at 0 °C base temperature. (i) Two-parameter single exponential, (ii) three-parameter single exponential, (iii) modified three-parameter single exponential, (iv) four-parameter double exponential, (v) five-parameter double exponential, (vi) four-parameter single exponent with linear combination, (vii) two-parameter hyperbolic, and (viii) three-parameter hyperbolic. The upper equation represents hairy vetch and the lower cereal rye. Data were pooled from Exp. 1 and 2. All models were significant at P < 0.0001.
Agronomy 10 00701 g002
Table 1. Evaluation of models used to describe percent mass remaining of aboveground biomass of hairy vetch and cereal rye cover crops at Exp. 1 in 2015. Data were from no-till plots at Carbondale, IL.
Model 1CropAdj. R2RMS 2SEE 3PRESS 4AIC 5Normality 6Variance 7D-W Statistic 8Parameter Estimates
abcdyₒ
1Hairy vetch0.9180.29.04580.3250.0Fail, P = 0.005Fail, P = 0.009Fail, 0.432100.34 **0.002 **---
Cereal rye0.79161.712.79177.5284.1Pass, P = 0.259Pass, P = 0.079Pass, 1.72792.68 **0.0006 **---
2Hairy vetch0.9731.25.61815.9198.3Fail, P < 0.001Pass, P = 0.648Fail, 1.10293.85 **0.003 ** 11.89
Cereal rye0.79158.912.69017.1284.5Pass, P = 0.285Pass, P = 0.309Pass, 1.81280.71 **0.0009 **--15.24
3Hairy vetch0.9726.85.21545.9189.3Pass, P = 0.065Pass, P = 0.300Pass, 1.7104.78 **2201.52 **702.96 **--
Cereal rye0.80155.112.58779.9283.1Pass, P = 0.292Pass, P = 0.481Pass, 1.8623.32ns11699.76ns3457.59ns--
4Hairy vetch0.9728.55.31661.6194.6Fail, P < 0.001Pass, P = 0.285Fail, 1.24224.58 **0.0004 *82.90 **0.005 **-
Cereal rye0.82139.011.87785.5278.5Pass, P = 0.052Pass, P = 0.182Pass, 2.10379.82 **0.0005 **27644.80ns0.343ns-
5Hairy vetch0.9727.45.21759.5193.8Fail, P < 0.001Pass, P = 0.468Fail, 1.30061.23 *0.002 *42.62 **0.014ns9.63
Cereal rye0.82139.411.8NAN 9280.1Fail, P < 0.047Pass, P = 0.119Fail, 2.1282190.3ns0.213ns123.42ns0.0002ns−47.87
6Hairy vetch0.9728.95.41660.1195.5Fail, P < 0.001Pass, P = 0.201Fail, 1.21887.29 **0.004 **−0.004 *-19.79
Cereal rye0.82138.211.88245.4278.2Fail, P = 0.043Pass, P = 0.101Fail, 2.10037.31 **0.011ns−0.020ns-70.93
7Hairy vetch0.9727.15.21556.4189.9Fail, P = 0.001Pass, P = 0.198Fail, 1.245110.95 **189.65 **---
Cereal rye0.80150.912.38449.8280.3Pass, P = 0.203Pass, P = 0.650Pass, 1.884100.14 **832.76 **---
8Hairy vetch0.9727.25.21562.9190.6Fail, P < 0.001Pass, P = 0.186Fail, 1.281110.18 **174.06 **--1.71
Cereal rye0.80152.812.48627.8282.3Pass, P < 0.285Pass, P = 0.798Fail, 1.890106.20 **1017.81 *--−7.45
1 Decay models: 1, y = ae−bx; 2, y = aebx + yₒ; 3, y = aeb/(c + x); 4, y = ae−bx + ce−dx; 5, y = ae−bx + ce−dx + yₒ; 6, y = ae−bx + cx + yₒ; 7, y = ab/(b + x); 8, y = ab/(b + x) + yₒ. 2 Residual mean square of the model. 3 Standard error of estimate of the model parameters. 4 Predicted residual sum of squares estimate of the model. 5 Akaike information criterion value of the model. 6 Shapiro-Wilk test for normality of the data where pass and fail assumptions were made at α ≤ 0.05. 7 Constant variance test using Spearman rank correlation where pass or fail assumptions were made at α ≤ 0.05. 8 Durbin-Watson test of independence of residuals where pass or fail assumptions were made at α ≤ 0.05. 9 Not-a-number notation for non-finite residuals. * t-test significant at α ≤ 0.01, ** at α ≤ 0.001, and ns, not significant at the α = 0.01 level.
Table 2. Evaluation of models used to describe percent mass remaining of belowground biomass of hairy vetch and cereal rye cover crops at Exp. 1 in 2015. Data were from no-till plots at Carbondale, IL.
Model 1CropAdj. R2RMS 2SEE 3PRESS 4AIC 5Normality 6Variance 7D-W Statistic 8Parameter Estimates
abcdyₒ
1Hairy vetch0.88126.611.37304.6270.7Fail, P < 0.001Pass, P = 0.267Fail, 1.303104.33 **0.003 **---
Cereal rye0.69353.318.819,379.1315.4Fail, P = 0.001Pass, P = 0.121Pass, 2.14393.03 **0.0001 **---
2Hairy vetch0.9195.89.85546.6256.6Fail, P = 0.001Pass, P = 0.246Fail, 1.628100.37 **0.005 **--8.46
Cereal rye0.70338.618.418,583.3314.5Fail, P < 0.001Pass, P = 0.854Fail, 2.81185.02 **0.002 **--13.04
3Hairy vetch0.9282.29.14752.2248.2Fail, P = 0.002Pass, P = 0.158Pass, 1.7983.71 *1623.72 *472.32 *--
Cereal rye0.71328.518.118,063.2312.8Fail, P < 0.001Pass, P = 0.281Pass, 2.1904.79ns4337.90ns1418.28ns--
4Hairy vetch0.9376.88.8NAN 9245.8Fail, P = 0.003Pass, P = 0.545Pass, 1.8491026.54ns0.135ns39.78ns0.001ns-
Cereal rye0.71318.117.816,835.1311.1Fail, P < 0.060Pass, P = 0.535Pass, 2.29266.64 **0.0007 **9498.81ns0.269ns-
5Hairy vetch0.9377.58.84468.6247.8Fail, P = 0.003Pass, P = 0.388Pass, 1.88340.00 **0.001 *859.02ns0.129ns2.85
Cereal rye0.72317.617.817,428.7313.9Fail, P = 0.005Pass, P = 0.535Pass, 2.29266.51 **0.0007ns520.95ns0.130ns0.21
6Hairy vetch0.9285.09.25003.9251.4Fail, P = 0.003Pass, P = 0.408Pass, 1.74092.64 **0.008 **−0.007 **-21.00
Cereal rye0.71325.618.018,431.4313.8Fail, P = 0.030Pass, P = 0.565Pass, 2.147203.75ns0.071ns−0.018 **-53.99
7Hairy vetch0.9378.38.94458.8244.3Pass, P = 0.051Pass, P = 0.280Pass, 1.841120.03 **103.28 **---
Cereal rye0.72311.117.616,264.1309.9Pass, P = 0.001Pass, P = 0.300Pass, 2.201103.57 **393.84 **---
8Hairy vetch0.9379.78.94587.3246.5Fail, P = 0.002Pass, P = 0.322Pass, 1.836120.36 **97.08 **--0.85
Cereal rye0.72324.418.017,762.1312.2Fail, P < 0.001Pass, P = 0.222Pass, 2.209104.27 **409.89 *--−1.04
1 Decay models: 1, y = ae−bx; 2, y = aebx + yₒ; 3, y = aeb/(c + x); 4, y = ae−bx + ce−dx; 5, y = ae−bx + ce−dx + yₒ; 6, y = ae−bx + cx + yₒ; 7, y = ab/(b + x); 8, y = ab/(b + x) + yₒ. 2 Residual mean square of the model. 3 Standard error of estimate of the model parameters. 4 Predicted residual sum of squares estimate of the model. 5 Akaike information criterion value of the model. 6 Shapiro-Wilk test for normality of the data where pass and fail assumptions were made at α ≤ 0.05. 7 Constant variance test using Spearman rank correlation where pass or fail assumptions were made at α ≤ 0.05. 8 Durbin-Watson test of independence of residuals where pass or fail assumptions were made at α ≤ 0.05. 9 Not-a-number notation for non-finite residuals. * t-test significant at α ≤ 0.01, ** at α ≤ 0.001, and ns, not significant at the α = 0.01 level.
Table 3. Evaluation of models used to describe percent mass remaining of aboveground hairy vetch and cereal rye cover crops at Exp. 2 in 2017 and 2018 at Carbondale, IL. Data were pooled across tillage treatments, replicates, and years.
Model 1CropAdj. R2RMS 2SEE 3PRESS 4AIC 5Normality 6Variance 7D-W Statistic 8Parameter Estimates
abcdyₒ
1Hairy vetch0.8699.210.013,317.1611.0Fail, P = 0.011Fail, P = 0.015Fail, 1.40193.75 **0.001 **---
Cereal rye0.80133.211.517,764.8649.9Pass, P = 0.817Fail, P = 0.005Fail, 0.72897.49 **0.0008 **---
2Hairy vetch0.9074.18.69937.1573.5Pass, P = 0.090Fail, P < 0.001Pass, 1.74686.53 **0.002 **--14.82
Cereal rye0.84104.710.214,028.8619.3Pass, P = 0.067Fail, P = 0.042Pass, 1.60379.92 **0.002 **--25.37
3Hairy vetch0.9071.28.49540.4568.3Fail, P = 0.014Pass, P = 0.056Pass, 1.6874.15 *3873.53 **1198.89 **--
Cereal rye0.83108.710.414,558.5624.2Pass, P = 0.068Fail, P = 0.041Fail, 0.8807.71ns4729.64ns1803.46 **--
4Hairy vetch0.9072.58.59779.1571.8Fail, P = 0.025Fail, P = 0.049Pass, 1.68837.75 **0.0005 **66.37 **0.004 **-
Cereal rye0.84105.510.314,227.4621.4Fail, P = 0.047Fail, P = 0.042Fail, 0.90379.92 **0.002 *25.37ns4.12ns-
5Hairy vetch0.9070.78.49417.4566.3Pass, P = 0.054Pass, P = 0.151Pass, 1.65123.14 *0.017 *75.50 **0.002 **11.98
Cereal rye0.84103.910.214,053.0620.5Pass, P = 0.139Fail, P = 0.062Fail, 0.929−788.41 *0.003ns861.00 *0.003ns28.86
6Hairy vetch0.9072.78.59790.6572.2Fail, P = 0.030Fail, P = 0.014Pass, 1.69875.84 **0.003 **−0.007 *-27.63
Cereal rye0.84104.310.214,087.7619.9Pass, P = 0.063Fail, P = 0.010Fail, 0.930111.11 *0.001 *0.013ns-−6.96
7Hairy vetch0.9070.88.49833.4569.8Fail, P < 0.001Pass, P = 0.239Pass, 1.646107.55 **301.93 **---
Cereal rye0.83109.510.514,550.8624.1Pass, P = 0.081Fail, P = 0.047Fail, 0.873106.31 **652.86 **---
8Hairy vetch0.9071.08.49494.5567.9Fail, P = 0.005Pass, P = 0.185Pass, 1.656108.67 **325.01 **--−2.00
Cereal rye0.83110.310.514,765.7626.1Pass, P = 0.079Pass, P = 0.058Fail, 0.878105.03 **624.55 **--1.64
1 Decay models: 1, y = ae−bx; 2, y = aebx + yₒ; 3, y = aeb/(c + x); 4, y = ae−bx + ce−dx; 5, y = ae−bx + ce−dx + yₒ; 6, y = ae−bx + cx + yₒ; 7, y = ab/(b + x); 8, y = ab/(b + x) + yₒ. 2 Residual mean square of the model. 3 Standard error of estimate of the model parameters. 4 Predicted residual sum of squares estimate of the model. 5 Akaike information criterion value of the model. 6 Shapiro-Wilk test for normality of the data where pass and fail assumptions were made at α ≤ 0.05. 7 Constant variance test using Spearman rank correlation where pass or fail assumptions were made at α ≤ 0.05. 8 Durbin-Watson test of independence of residuals where pass or fail assumptions were made at α ≤ 0.05. * t-test significant at α ≤ 0.01, ** at α ≤ 0.001, and ns, not significant at the α = 0.01 level.
Table 4. Evaluation of models using combined data from Exp. 1 and 2 for percent mass remaining of aboveground hairy vetch and cereal rye cover crops in Carbondale, IL.
Model 1CropAdj. R2RMS 2SEE 3PRESS 4AIC 5Normality 6Variance 7D-W Statistic 8
1Hairy vetch0.87104.910.219,914.9878.9Fail, P < 0.001Fail, P = 0.020Fail, 1.012
Cereal rye0.79145.612.127,436.5935.5Pass, P = 0.415Pass, P = 0.478Fail, 1.053
2Hairy vetch0.9173.08.513,881.3811.8Fail, P < 0.001Fail, P = 0.007Fail, 1.349
Cereal rye0.82123.211.123,233.2905.4Fail, P = 0.006Fail, P < 0.001Fail, 1.224
3Hairy vetch0.9168.88.313,071.3800.6Fail, P < 0.001Fail, P = 0.562Fail, 1.349
Cereal rye0.82122.811.123,145.5904.8Fail, P = 0.006Fail, P = 0.009Fail, 1.231
4Hairy vetch0.9169.88.413,333.5804.6Fail, P < 0.001Pass, P = 0.746Fail, 1.349
Cereal rye0.82123.211.123,335.2906.5Fail, P = 0.006Fail, P = 0.003Fail, 1.231
5Hairy vetch0.9168.48.312,948.6798.5Fail, P < 0.001Pass, P = 0.557Fail, 1.330
Cereal rye0.82123.811.123,550.1908.5Fail, P = 0.006Fail, P = 0.004Fail, 1.231
6Hairy vetch0.9170.38.413,383.3805.7Fail, P < 0.001Pass, P = 0.307Fail, 1.351
Cereal rye0.82123.111.123,307.4906.3Fail, P = 0.006Fail, P = 0.004Fail, 1.231
7Hairy vetch0.9169.08.313,396.9803.3Fail, P < 0.001Pass, P = 0.548Fail, 1.330
Cereal rye0.82122.511.123,007.9903.2Fail, P = 0.007Pass, P = 0.080Fail, 1.230
8Hairy vetch0.9168.78.313,032.0800.3Fail, P < 0.001Pass, P = 0.672Fail, 1.333
Cereal rye0.82123.111.123,194.0905.3Fail, P = 0.006Fail, P = 0.016Fail, 1.232
1 Decay models: 1, y = ae−bx; 2, y = aebx + yₒ; 3, y = aeb/(c + x); 4, y = ae−bx + ce−dx; 5, y = ae−bx + ce−dx + yₒ; 6, y = ae−bx + cx + yₒ; 7, y = ab/(b + x); 8, y = ab/(b + x) + yₒ. 2 Residual mean square of the model. 3 Standard error of estimate of the model parameters. 4 Predicted residual sum of squares estimate of the model. 5 Akaike information criterion value of the model. 6 Shapiro-Wilk test for normality of the data where pass and fail assumptions were made at α ≤ 0.05. 7 Constant variance test using Spearman rank correlation where pass or fail assumptions were made at α ≤ 0.05. 8 Durbin-Watson test of independence of residuals where pass or fail assumptions were made at α ≤ 0.05.
Table 5. Evaluation of models used to describe percent N remaining of aboveground biomass of hairy vetch and cereal rye cover crops at Exp. 1 in 2015. Data were from no-till plots at Carbondale, IL.
Model 1CropAdj. R2RMS 2SEE 3PRESS 4AIC 5Normality 6Variance 7D-W Statistic 8Parameter Estimates
abcdyₒ
1Hairy vetch0.9638.46.22199.6208.8Fail, P = 0.008Pass, P = 0.104Fail, 0.429106.34 **0.004 **---
Cereal rye0.67276.416.615,599.4313.6Fail, P = 0.004Pass, P = 0.299Pass, 1.85494.65 **0.0005 **---
2Hairy vetch0.9816.14.0938.4161.4Fail, P < 0.001Fail, P = 0.028Fail, 1.028102.38 **0.005 **--6.84
Cereal rye0.67280.716.815,891.1315.8Pass, P = 0.173Pass, P = 0.155Pass, 1.848108.15 *0.0004 *--−14.74
3Hairy vetch0.9910.63.3613.6136.8Fail, P < 0.001Pass, P = 0.559Fail, 1.4702.17 **2361.90 **595.70**--
Cereal rye0.67281.116.815,926.2315.8Pass, P = 0.167Pass, P = 0.130Pass, 1.847880723.4ns174597.8ns−19078.5ns--
4Hairy vetch0.9911.23.3674.3142.1Fail, P < 0.001Pass, P = 0.161Fail, 1.45922.13 **0.0008 **89.84 **0.007 **-
Cereal rye0.68272.716.515,296.2315.5Fail, P = 0.002Pass, P = 0.289Fail, 1.98786.57 **0.0005 **1200.31ns0.212ns-
5Hairy vetch0.9910.93.3691.7142.2Fail, P < 0.001Pass, P = 0.343Fail, 1.49975.72 **0.009 *34.52 *0.002 *3.66
Cereal rye0.69263.316.2NAN 9315.0Fail, P = 0.004Pass, P = 0.260Pass, 2.076100.71ns0.076ns8662.20ns2.64ns−8582.2
6Hairy vetch0.9912.03.5703.4146.1Fail, P < 0.001Pass, P = 0.182Fail, 1.38096.77 **0.006 **−0.004 **-14.15
Cereal rye0.70258.116.114,270.3312.5Pass, P = 0.100Pass, P = 0.258Pass, 2.076258.83ns0.121ns−0.023 **-79.95
7Hairy vetch0.9910.83.3629.6138.9Fail, P < 0.001Pass, P = 0.152Fail, 1.456122.35 **93.96 **---
Cereal rye0.66289.717.016,230.0316.2Fail, P = 0.006Pass, P = 0.372Pass, 1.80899.65 **1102.91 **---
8Hairy vetch0.9910.63.3616.1138.0Fail, P < 0.001Pass, P = 0.337Fail, 1.479121.99 **100.75 **--−0.98
Cereal rye0.67279.816.715,816.8315.6Pass, P = 0.138Pass, P = 0.180Pass, 1.860162.87ns3260.55ns--−68.64
1 Decay models: 1, y = ae−bx; 2, y = aebx + yₒ; 3, y = aeb/(c + x); 4, y = ae−bx + ce−dx; 5, y = ae−bx + ce−dx + yₒ; 6, y = ae−bx + cx + yₒ; 7, y = ab/(b + x); 8, y = ab/(b + x) + yₒ. 2 Residual mean square of the model. 3 Standard error of estimate of the model parameters. 4 Predicted residual sum of squares estimate of the model, 5 Akaike information criterion value of the model. 6 Shapiro-Wilk test for normality of the data where pass and fail assumptions were made at α ≤ 0.05. 7 Constant variance test using Spearman rank correlation where pass or fail assumptions were made at α ≤ 0.05. 8 Durbin-Watson test of independence of residuals where pass or fail assumptions were made at α ≤ 0.05. 9 Not-a-number notation for non-finite residuals. * t-test significant at α ≤ 0.01, ** at α ≤ 0.001, and ns, not significant at the α = 0.01 level.
Table 6. Evaluation of models used to describe percent N remaining of belowground biomass of hairy vetch and cereal rye cover crops at Exp. 1 in 2015. Data were from no-till plots at Carbondale, IL.
Model 1CropAdj. R2RMS 2SEE 3PRESS 4AIC 5Normality 6Variance 7D-W Statistic 8Parameter Estimates
abcdyₒ
1Hairy vetch0.84184.613.68239.3229.0Fail, P < 0.001Pass, P = 0.331Fail, 1.461102.23 **0.00 3**---
Cereal rye0.48557.223.630,410.2339.6Fail, P = 0.712Pass, P = 0.302Fail, 2.13588.35 **0.0007 **---
2Hairy vetch0.88141.811.96445.3219.0Fail, P = 0.012Fail, P = 0.013Fail, 1.83294.98 **0.004 **--12.59
Cereal rye0.53505.922.527,841.2335.8Pass, P = 0.103Pass, P = 0.155Pass, 2.26272.83 **0.002 **--27.03
3Hairy vetch0.89132.311.56002.7216.0Pass, P = 0.055Pass, P = 0.066Pass, 1.8895.89ns1402.55ns474.64ns--
Cereal rye0.54496.422.327,334.6334.7Pass, P = 0.067Pass, P = 0.131Pass, 2.26917.40ns1400.68ns785.27ns--
4Hairy vetch0.88135.511.6NAN 9218.5Pass, P = 0.097Pass, P = 0.125Pass, 1.8191393.69ns0.156ns47.91ns0.001ns-
Cereal rye0.54499.522.326,909.2336.4Pass, P = 0.107Pass, P = 0.219Pass, 2.27165.16 **0.0004 *427.10ns0.119ns-
5Hairy vetch0.89133.911.6NAN219.6Pass, P = 0.114Pass, P = 0.108Pass, 1.918301.95ns0.090ns48.43ns0.002ns7.61
Cereal rye0.53506.922.527,949.1338.7Pass, P = 0.074Pass, P = 0.180Pass, 2.29253.09ns0.0009 **5394.02ns0.249ns18.38
6Hairy vetch0.88140.711.96555.7220.1Fail, P = 0.032Pass, P = 0.310Pass, 1.83688.52 **0.006**−0.005ns-20.96
Cereal rye0.53504.822.528,582.6337.0Pass, P = 0.112Pass, P = 0.160Pass, 2.25252.88 **0.005ns−0.012ns-52.64
7Hairy vetch0.89129.511.45745.2213.7Fail, P = 0.032Pass, P = 0.071Pass, 1.889114.21 **144.17 **---
Cereal rye0.54495.322.326,961.6333.7Pass, P = 0.420Pass, P = 0.675Pass, 2.28498.97**658.49 **---
8Hairy vetch0.89131.211.55936.5215.6Pass, P = 0.067Pass, P = 0.088Pass, 1.891113.4 **120.39 *--3.27
Cereal rye0.54499.222.327,227.1334.6Pass, P = 0.071Pass, P = 0.131Pass, 2.27388.50 **346.70ns--15.56
1 Decay models: 1, y = ae−bx; 2, y = aebx + yₒ; 3, y = aeb/(c + x); 4, y = ae−bx + ce−dx; 5, y = ae−bx + ce−dx + yₒ; 6, y = ae−bx + cx + yₒ; 7, y = ab/(b + x); 8, y = ab/(b + x) + yₒ. 2 Residual mean square of the model. 3 Standard error of estimate of the model parameters. 4 Predicted residual sum of squares estimate of the model. 5 Akaike information criterion value of the model. 6 Shapiro-Wilk test for normality of the data where pass and fail assumptions were made at α ≤ 0.05. 7 Constant variance test using Spearman rank correlation where a pass or fail assumptions were made at α ≤ 0.05. 8 Durbin-Watson test of independence of residuals where a pass or fail assumptions were made at α ≤ 0.05. 9 Not-a-number notation for non-finite residuals. * t-test significant at α ≤ 0.01, ** at α ≤ 0.001, and ns, not significant at the α = 0.01 level.
Table 7. Evaluation of models used to describe percent N remaining of aboveground hairy vetch and cereal rye cover crops at Exp. 2 in 2017 and 2018 at Carbondale, IL. Data were pooled across tillage treatments, replicates, and years.
Model 1CropAdj. R2RMS 2SEE 3PRESS 4AIC 5Normality 6Variance 7D-W Statistic 8Parameter Estimates
abcdyₒ
1Hairy vetch0.84112.610.615264.9627.8Fail, P < 0.001Fail, P < 0.001Pass, 1.55090.99 **0.002 **---
Cereal rye0.49307.917.539938.3737.6Fail, P = 0.008Fail, P = 0.007Fail, 0.45286.49 **0.0006 **---
2Hairy vetch0.9071.48.59665.5568.7Fail, P < 0.001Fail, P < 0.001Pass, 1.88089.97 **0.004 **--13.41
Cereal rye0.58254.516.032876.8714.3Fail, P = 0.002Fail, P < 0.001Fail, 0.47963.44 **0.002 **--37.03
3Hairy vetch0.9256.57.57612.2537.8Fail, P < 0.001Pass, P = 0.090Pass, 1.8216.30 **1409.78 **489.94 **--
Cereal rye0.59252.815.832027.1713.5Fail, P = 0.006Fail, P < 0.001Fail, 0.46326.31 **857.15 *622.09 *--
4Hairy vetch0.9351.87.27126.0527.6Fail, P < 0.030Pass, P = 0.333Pass, 1.71051.3 **0.001 **68.47 **0.014 **-
Cereal rye0.58256.416.033265.5716.4Fail, P = 0.003Fail, P < 0.001Fail, 0.47560.28 **0.003 *40.70 *0.0005ns-
5Hairy vetch0.9350.27.16966.6524.4Fail, P = 0.006Pass, P = 0.072Pass, 1.77754.58 **0.002 **63.35 **0.020 *6.77
Cereal rye0.58255.216.033569.6717.0Fail, P = 0.006Fail, P < 0.001Fail, 0.46319.57ns0.013ns52.88 *0.002ns34.54
6Hairy vetch0.9258.07.67843.6542.5Fail, P = 0.003Fail, P = 0.034Pass, 1.76181.38 **0.007 **−0.011 **-29.64
Cereal rye0.58256.516.032265.5716.4Fail, P = 0.003Fail, P < 0.001Fail, 0.47660.86 **0.003 *−0.002ns-40.04
7Hairy vetch0.9254.57.47285.9531.9Fail, P = 0.008Fail, P < 0.001Pass, 1.855112.18 **158.74 **---
Cereal rye0.55270.516.434908.2721.0Fail, P = 0.027Fail, P = 0.002Fail, 0.42695.64 **876.72 **---
8Hairy vetch0.9253.87.37231.4531.4Fail, P < 0.001Fail, P = 0.038Pass, 1.825112.07 **136.27 **--2.80
Cereal rye0.58252.915.932553.8713.5Fail, P = 0.007Fail, P < 0.001Fail, 0.46279.50 **323.88 *--25.28
1 Decay models: 1, y = ae−bx; 2, y = aebx + yₒ; 3, y = aeb/(c + x); 4, y = ae−bx + ce−dx; 5, y = ae−bx + ce−dx + yₒ; 6, y = ae−bx + cx + yₒ; 7, y = ab/(b + x); 8, y = ab/(b + x) + yₒ 2 Residual mean square of the model. 3 Standard error of estimate of the model parameters. 4 Predicted residual sum of squares estimate of the model. 5 Akaike information criterion value of the model. 6 Shapiro-Wilk test for normality of the data where pass and fail assumptions were made at α ≤ 0.05. 7 Constant variance test using Spearman rank correlation where a pass or fail assumptions were made at α ≤ 0.05. 8 Durbin-Watson test of independence of residuals where a pass or fail assumptions were made at α ≤ 0.05. * t-test significant at α ≤ 0.01, ** at α ≤ 0.001, and ns, not significant at the α = 0.01 level.
Table 8. Evaluation of models using combined data from Exp. 1 and 2 for percent mass remaining of aboveground hairy vetch and cereal rye cover crops in Carbondale, IL.
Model 1CropAdj. R2RMS 2SEE 3PRESS 4AIC 5Normality 6Variance 7D-W Statistic 8
1Hairy vetch0.87101.810.119,406.7873.3Fail, P < 0.001Fail, P < 0.001Fail, 1.139
Cereal rye0.55296.717.254,460.91040.2Fail, P = 0.015Pass, P = 0.837Fail, 0.753
2Hairy vetch0.9263.78.012,171.6786.3Fail, P < 0.002Pass, P = 0.126Fail, 1.474
Cereal rye0.58273.216.550,114.31026.2Fail, P < 0.001Fail, P < 0.027Fail, 0.764
3Hairy vetch0.9450.47.19605.9724.0Fail, P < 0.001Pass, P = 0.340Fail, 1.499
Cereal rye0.59265.616.348,616.81021.2Fail, P < 0.001Fail, P < 0.001Fail, 0.758
4Hairy vetch0.9447.66.99206.8732.5Fail, P < 0.001Pass, P = 0.358Fail, 1.438
Cereal rye0.61264.816.047,033.41016.3Fail, P = 0.009Fail, P < 0.001Fail, 0.767
5Hairy vetch0.9446.66.89079.3729.5Fail, P < 0.001Pass, P = 0.186Fail, 1.508
Cereal rye0.61258.516.147,500.31018.4Fail, P = 0.007Fail, P < 0.001Fail, 0.767
6Hairy vetch0.9451.67.29857.2747.5Fail, P < 0.001Pass, P = 0.453Fail, 1.436
Cereal rye0.61258.316.147,266.810.17.1Fail, P = 0.016Fail, P < 0.001Fail, 0.767
7Hairy vetch0.9447.96.99080.3731.4Fail, P < 0.001Pass, P = 0.220Fail, 1.510
Cereal rye0.59270.916.549,594.21023.6Fail, P = 0.003Pass, P = 0.071Fail, 0.757
8Hairy vetch0.9448.06.99134.1732.9Fail, P < 0.001Pass, P = 0.382Fail, 1.499
Cereal rye0.61257.812.348,442.01015.5Fail, P < 0.001Fail, P < 0.001Fail, 0.758
1 Decay models: 1, y = ae−bx; 2, y = aebx + yₒ; 3, y = aeb/(c + x); 4, y = ae−bx + ce−dx; 5, y = ae−bx + ce−dx + yₒ; 6, y = ae−bx + cx + yₒ; 7, y = ab/(b + x); 8, y = ab/(b + x) + yₒ. 2 Residual mean square of the model. 3 Standard error of estimate of the model parameters. 4 Predicted residual sum of squares estimate of the model. 5 Akaike information criterion value of the model. 6 Shapiro-Wilk test for normality of the data where pass and fail assumptions were made at α ≤ 0.05. 7 Constant variance test using Spearman rank correlation where a pass or fail assumptions were made at α ≤ 0.05. 8 Durbin-Watson test of independence of residuals where a pass or fail assumptions were made at α ≤ 0.05.

