Article

Evaluation of the Changes in Thermal, Qualitative, and Antioxidant Properties of Terebinth (Pistacia atlantica) Fruit under Different Drying Methods

by
Yousef Abbaspour-Gilandeh
1,*,
Mohammad Kaveh
1,
Hamideh Fatemi
2,
José Luis Hernández-Hernández
3,
Alejandro Fuentes-Penna
4 and
Mario Hernández-Hernández
5,*
1
Department of Biosystems Engineering, College of Agriculture and Natural Resources, University of Mohaghegh Ardabili, Ardabil 56199-11367, Iran
2
Department of Horticulture, College of Agriculture and Natural Resources, University of Mohaghegh Ardabili, Ardabil 56199-11367, Iran
3
Division of Research and Graduate Studies, TecNM/Technological Institute of Chilpancingo, Chilpancingo, Guerrero 39070, Mexico
4
TecNM/CIIDET, Querétaro 76000, Mexico
5
Faculty of Engineering, Autonomous University of Guerrero, Chilpancingo 39070, Mexico
*
Authors to whom correspondence should be addressed.
Agronomy 2020, 10(9), 1378; https://doi.org/10.3390/agronomy10091378
Submission received: 28 July 2020 / Revised: 4 September 2020 / Accepted: 7 September 2020 / Published: 12 September 2020
(This article belongs to the Section Horticultural and Floricultural Crops)

Abstract

:
This study aims to investigate the effect of different drying methods on the thermal, qualitative, and antioxidant properties and pH of terebinth. To perform the experiments in this study, the hot air (HA), infrared (IR), microwave (MW), hot air–infrared (IR–HA), and hot air–microwave drying (MW–HA) methods were considered. The results showed that the minimum drying time was obtained by the hot air–microwave (MW–HA) method. However, the lowest specific energy consumption (SEC) and the highest energy efficiency (ηe) were obtained by the MW method. Considering the color criteria, the best method was obtained by the MW–HA method. The highest amount of rehydration ratio (RR) and the lowest shrinkage (Sb) of the dried terebinth samples were obtained using the MW dryer compared with other drying methods. The MW and MW–HA methods resulted in higher contents of total phenol content (TPC), total flavonoid content (TFC), and antioxidant capacity (AntiOX) than other methods. According to the results of this study, the most effective drying method for terebinth was determined to be the MW and MW-HA methods.

1. Introduction

The methods of canning, freezing, and drying represent the major methods for the long-term preservation of fruits and vegetables while maintaining their nutritional properties and value. Drying is one of the commonly used methods to prevent food spoilage, increase shelf life, reduce costs along with mass and volume, and increase food productivity and quality [1,2]. For many years, the direct sunlight or wind current has been used to dry agriculture products, but there are several disadvantages to using this method, including the inappropriate changes in food quality, exposure of the samples to an uncontrolled environment, long drying time, attack of birds, and unexpected rainfall [3]. To reduce these problems, industrial methods have gradually been used to dry agricultural products. The most common type of industrial dryer is the hot airflow dryer in which, after contact with the sample, the hot air evaporates the moisture and dries the product. However, these types of dryers also have disadvantages such as superficial burns and high shrinkage in the product, long drying time, and high energy consumption [4]. Numerous research works have been undertaken on the vacuum, IR, and MW dryers and combined dryers such as IR–HA air and MW–HA [5].
One of the important indicators to consider in the drying process is the final quality of the dried product, which is the overall characteristics and properties of food that can satisfy the consumer. They include physical properties such as shape, color, and texture and nutritional properties such as vitamins, pigments, and compounds that cause food AntiOX properties. During drying, due to the heat and mass transfer from the product and the chemical reactions, the samples experience changes in these properties [6].
Heshmati and Moghaddam [7] investigated the qualitative and nutritional properties of dried kiwi slices in three HA, MW, and MW–HA drying methods and found that the most desirable kiwi slice drying methods were MW at 90 and 360 W, oven at 40 °C, and combining microwave at 90 W and oven at 40 °C. By studying the effect of different dryers (solar, HA, MW, and freeze) on Ganoderma lucidum, it was concluded that the drying time of the samples in the freeze dryer was the longest, while the MW dryer required a shorter time to dry. Higher total phenol and flavonoid contents were also obtained using this method [8]. Chan et al. [9] investigated the effects of different MW, oven, and solar drying methods on the AntiOX properties and TPC of the leaves of four plants of the ginger family and found a significant decrease in these properties in the dried samples compared to the fresh leaf samples. The effect of different temperatures (40, 60, 70, 80, and 110 °C) on mulberry leaves was investigated. The results showed that the AntiOX capacity and stability of polyphenols were higher in 40 and 60 ° C treatments than other treatments. However, the content of these substances decreased significantly above 70 °C [10]. Wen et al. [11] investigated the effect of five types of freeze–vacuum, vacuum, HA, IR, and vacuum–MW dryers on the moisture ratio, drying rate, and nutritional properties of dehulled Adlay. The results showed that the HA dryer had the longest drying time, while the shortest drying time was achieved in the freeze–vacuum dryer. The highest and lowest amounts of antioxidants were obtained in the HA and vacuum dryers, respectively.
Terebinth (Pistacia atlantica subsp. Kurdica) is a deciduous plant of the Anacardiaceae family that is widely spread in western, eastern, and central Iran. Local people use the leaf and fruit of terebinth for their nutritional and therapeutic properties. The oil and oleoresin of this fruit are also used in these regions [12]. Terebinth fruit has vitamins A, B, D, and is, therefore, a nerve tonic. Terebinth fruit is also rich in vitamin E that causes the fruit to have a strong AntiOX effect and, like a potent antibiotic, impairs the function of harmful bacteria in the body and contributes to the health and well-being of the body. Terebinth fruit has a sour taste and is dark green and is used in making pickles and making buttermilk and animal oil fragrant [13,14].
Numerous studies have investigated the qualitative, thermal, and nutritional properties of different products using various dryers, such as apple slices [2], ginger [3], onion [15], goji berries [16], potato [17], kale yogurt melts [18], lemon [19], curry tree leaves [20], green beans [21], and broccoli [22]. However, no research has been conducted on terebinth so far. Due to the widespread use of terebinth in Iran, this experiment aims to investigate the effect of different drying methods (HA, IR, MW, IR–HA, and MW–HA) on the thermal (kinetics, Deff, SEC, and η e ), qualitative (color, Sb, and RR), nutritional (AntiOX capacity, total phenol, and flavonoid content), and chemical properties (pH) of terebinth fruit.

2. Materials and Methods

2.1. Sample Preparation

Terebinth (Pistacia atlantica) fruits were obtained from the forests of Sardasht, West Azerbaijan province, Iran, and were stored in a refrigerator at +4 °C before the preparation. All experiments were performed in the laboratory of the Biosystem Engineering Department in the Faculty of Agriculture and Natural Resources of Mohaghegh Ardabili University. To reach room temperature, the samples were removed from the refrigerator two hours before the experiment. The initial moisture content (MC) of the samples was determined using an oven (Memmert, UFB500, Schwabach, Germany) over 24 h at 70 °C, averaging 3.44% on a dry matter basis (% d.m,b.) [14].

2.2. Experimental Treatments

In this study, the experimental treatments included different drying methods, which will be discussed in detail as follows.

2.2.1. Hot Air

HA dryers were used for performing the experiments. The used laboratory dryer has a centrifugal blower that blows HA parallel to the substrate. Three elements were used to supply the hot airflow. The test samples were placed in the middle of the canal on the mesh containers on a digital scale with a precision of 0.01 g, placed beneath and outside the canal. To control the temperature of the device, thermocouple K was used in the design of the device. Moreover, in order to avoid heat loss, the channel that leads into the chamber was insulated with glass wool.

2.2.2. Microwave

A microwave oven (Sharp R-I96T, Bangkok, Thailand) with the maximum power of 900 W and a resolution of 90 W was used for the experiments. This MW is capable of adjusting power levels to 90, 180, 270, 360, 450, 540, 630, and 720 W.

2.2.3. Infrared

For this method, a IR dryer capable of controlling radiation power, designed by the Department of Biosystem Engineering of Mohaghegh Ardabili University, was used for the drying. Initially, the terebinth samples, with an infrared system from an IR chamber of 120 × 90 × 90 cm dimensions, were used with different IR lamp powers (250, 500, 750, and 1000 W) at 20 cm from the sample surface.

2.2.4. Hot Air–Microwave

The terebinth samples were dried using the combined MW–HA dryer designed by the Department of Biosystem Engineering of Mohaghegh Ardabili University. The dryer consisted of a centrifugal blower (1 hp/3000 rpm), electric motor, air heater element, airflow and transfer tubes, cylindrical chamber of the dryer, microwave (Panasonic, NN-C2002W, Osaka, Japan), an inverter to adjust the blower rotation speed (Vincker VSD2, ABB Co., Taipei, Taiwan), and inlet air temperature control system. By adjusting each of the input variables, the experiments were performed at the desired temperature, blower airspeed, and microwave power levels. A thermostat (Atbin, Tehran, Iran) was used to adjust the inlet air temperature.

2.2.5. Hot Air–Infrared

The combined hot air and infrared dryer (IR–HA) consisted of a drying chamber, centrifugal blower, heating elements, and control unit, including the control of blower speed and inlet air temperature. Four IR lamps for generating IR radiation, each with a power of 250 W, were placed inside and above the drying chamber. According to the test conditions (one IR power level), up to two IR lamps (Philips model, Flemish, Belgium) with a power of 250 watts, were used to generate IR radiation. The lamps were above and about 20 cm away from the samples. To move the air and moisture out of the dryer chamber, a suction fan was used, and two valves were located above the suction fan. A thermostat (Atbin, Tehran, Iran) working with k-type thermocouples was used to adjust the inlet air temperature. The experimental parameters for terebinth drying in different dryers are presented in Table 1. All experiments were performed with three replications.
To perform the experiments, all dryers were switched on for half an hour before each test to reach a stable level. A digital scale (AND GF-6000, Osaka, Japan) with a 0.001 g resolution was used to measure the weight of the samples during the drying process. The outlet air in the dryer chamber was measured by an anemometer (Lutron-YK, 80AM, Taipei, Taiwan) with a resolution of 0.01 m/s. To measure the pressure, a manometer (ST-8897, Beijing, China) with a resolution of 0.01 kPa was used.

2.3. Moisture Ratio

The moisture ratio, characterizing the drying process, was calculated with respect to the initial moisture, equilibrium moisture, and sample moisture at each instant during the drying using Equation (1) [3].
M R =   M t   M e M b   M e

2.4. Calculation of Effective Moisture Diffusivity

The drying of terebinth occurs at the downward speed phase, and the release of water controls the process. Therefore, Fick’s second law can be used to describe the terebinth drying. The solution to this law is provided by Crank [23] for spherical objects. As such, Fick’s second law for spherical objects is written as Equation (2) [14].
M R =   6 π 2 n = 1 1 n 2 e x p ( n 2 π 2 D e f f t r e 2 )
The effective diffusivity, Deff, is obtained by calculating the slope of the line from Equation (2) by plotting the natural logarithm of MR against time. Thus, Equation (3) is used to calculate the Deff value for all the experimental treatments.
K 1 =   ( D e f f π 2 r e 2 )

2.5. Specific Energy Consumption

Specific energy consumption is the amount of energy required to evaporate one kilogram of water from the terebinth samples in various dryers. The equations for calculating the energy consumption of different dryers (HA, IR, and MW) are given in Table 2.
The specific energy consumption (kWh/Kg) of the terebinth drying process is calculated using the following equation [3].
S E C =   ( E t M w )

2.6. Energy Efficiency

Using the energy balance equation based on the first law of thermodynamics, the energy efficiency for the terebinth drying process is calculated according to Equations (9)–(11) in Table 3.

2.7. Color

The color of dried samples was examined by a portable colorimeter (HP-200, China) using L*, a*, and b* parameters. The color change (ΔE) relative to the sample color after the drying was obtained using the following relation [29].
Δ E =   ( Δ L * ) 2 +   ( Δ a * ) 2 +   ( Δ b * ) 2

2.8. Shrinkage

The volume change of the dried terebinth, relative to the fresh product before the drying, is determined by the shrinkage index obtained from Equation (13). The terebinth sample volume was measured by the toluene displacement method using a pycnometer device. Knowing the toluene density and the mean weight of the toluene-filled pycnometer, the volume of the samples inside the pycnometer can be determined. In this way, the volume of the sample before and after drying was assessed [30].
S b =   ( λ i     λ f ) λ i   × 100

2.9. Rehydration Ratio (RR)

The rehydration ratio (RR) of the dried terebinth samples was selected as the immersion of the samples in distilled water at a ratio of 1:10. The samples were removed from the water after two hours; the surface moisture was adsorbed with a towel. The water absorption capacity of the dried samples was obtained from the following relation [31].
R R =   W r W d

2.10. Measurement of AntiOX Properties by Diphenyl Picrylhydrazine (DPPH) Method

To measure the content of phenolic, flavonoid and antiOX compounds, the extraction was first performed by the modified Lin et al. [32] method. The 10% methanolic extract was homogenized by overtaxing for 2 min, placed 24 h in a shaker at room temperature, and, after that, put in an ultrasonic bath at room temperature and sonicated for 10 min. Then, the extract was filtered through filter paper (Whatman no. 4) to remove solid debris. The antiOX properties of the dried terebinth samples were measured in the laboratory of the Department of Horticulture, Faculty of Agriculture, Mohaghegh Ardabili University. For this purpose, 150 µL of the extracts was mixed with 2 mL of DPPH methanol solution (0.01 M), and then the absorption was read at room temperature in the dark after 30 min using a spectrophotometer at the wavelength of 517 nm. Total antiOX capacity was calculated as the percentage of DPPH radical scavenging with the following relation [33].
I =   A i     A t A t   × 100

2.11. Total Phenol Content (TPC)

The amount of total phenolic compounds was investigated by the Folin–Ciocalteu colorimetry method. In this method, the amount of total phenolic compounds was measured as gallic acid, and the results were expressed as equivalent gallic acid. The color intensity generated at 760 nm can be measured by a spectrophotometer. For this purpose, 20 µL of the extract prepared using the Folin reagent (15:1) was added to the above solution. After 5 min, 200 µL of 7% sodium carbonate solution was added to the solution, and the samples were kept at room temperature in the dark for 60 min. The absorption of the samples was then read by a spectrophotometer at 760 nm. To plot the calibration curve, gallic acid was used as a standard, and the results were calculated in milligrams of gallic acid per 100 g of the dry sample mass [34].

2.12. Flavonoid Content (TFC)

The flavonoid content was measured according to the method by Beketove et al. [35]. Initially, 4.5 mL of 90% ethanol, 200 µL of 2% aluminum chloride, and 100 µL of 33% acetic acid were added to 200 µL of the extracts, and, after 30 min at room temperature in the dark, the sample absorption at 414 nm was read using the spectrophotometer.

2.13. pH

The pH was measured in different drying methods by a pH meter (Atron, Tehan, Iran). For this purpose, 100 mL of distilled water was added to 100 g of terebinth and stirred for 15 min at 50 rpm with a shaker, and the pH was recorded at 25 °C [36].

2.14. Statistical Analysis

All data were analyzed by one-way ANOVA using SAS 9.4 software. Means were separated by the least significant difference (LSD) test, and p-values less than 0.05 were considered statistically significant.

3. Results and Discussion
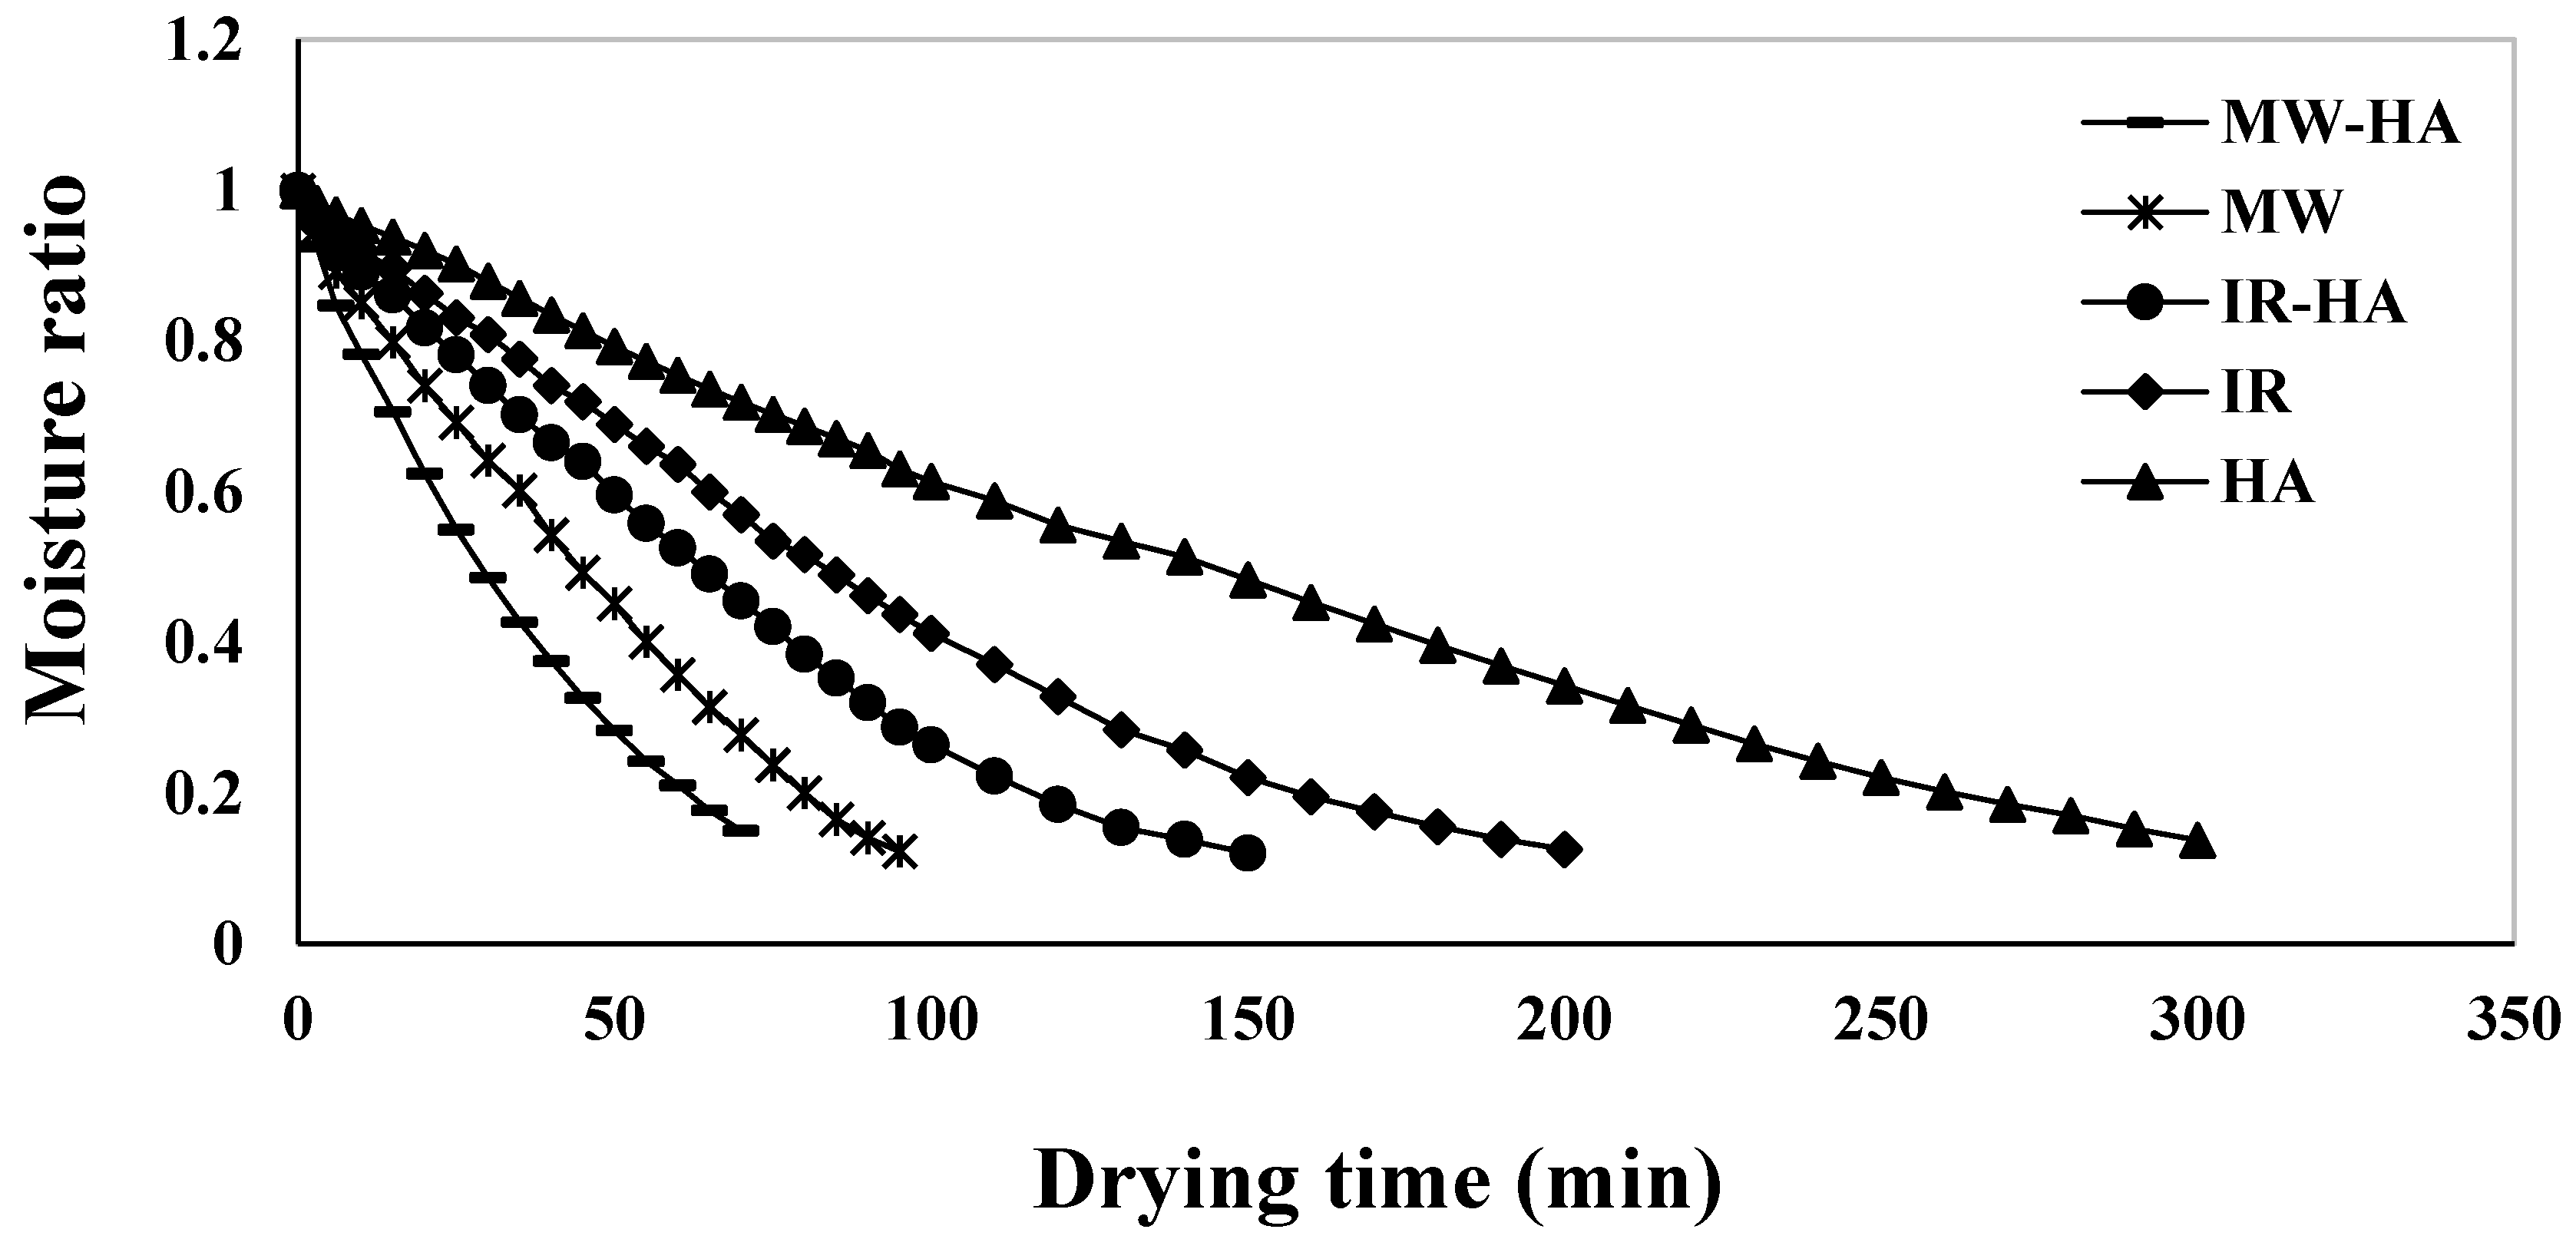
3.1. Drying Time

The results of the analysis of variance for drying time, Deff, SEC, color, Sb, RR, antiOX capacity, TPC, TFC, and pH for terebinth under different drying methods are reported in Table 4 and Table 5.
According to ANOVA drying analysis, the methods showed a significant effect on drying time (p < 0.01; Table 4). Figure 1 shows that the moisture content of the terebinth samples decreased exponentially and steadily during drying. The longest and shortest drying times were related to the use of hot air dryers for 300 min and the combined MW–HA dryer for 70 min (76% faster than the hot air dryer). The use of microwave power reduces the drying time compared to other methods because the cellular texture of the sample becomes swollen, which creates more pores in the samples and facilitates moisture removal and, thus, reduces the drying time. Additionally, when dried by hot air, the product first dries its outer layer. As a result, the sample surface dries and the permeability decreases, and by creating a hard layer on the food surface, it PREVENTS further moisture removal and prolongs the drying time [37].
Drying times for the MW, IR–HA, and IR were 95, 150, and 200 min, respectively. The MW, IR–HA, and IR dryers dried terebinth 68%, 50%, and 33% faster than the HA dryer, respectively (Table 6).
The drying time in the IR–HA dryer was less than in the IR and HA air dryers because the IR waves were in the range of wavelengths absorbed by water. The absorption of these waves by the moisture in the terebinth and the vibration of the water molecules produce uniform heat within the terebinth, and as a result, the vapor pressure transfers moisture to the terebinth surface and is easily removed by the surrounding environment. The transfer of IR dryer energy from the heat source to the food surface is carried out without heating the surrounding air, and the heat from the infrared dryer source can be transferred directly to the food surface with high efficiency [38].
Huang and Zhang [1] examined okra drying by different methods (vacuum freeze, microwave vacuum, and pulse-spouted microwave vacuum) and concluded that the shortest drying time was related to the pulse-spouted microwave vacuum dryer. They also stated that microwave power in the pulse-spouted microwave vacuum and microwave vacuum dryers reduced the drying time. Based on the findings of Wang et al. [39] for drying shiitake mushrooms using different dryers (HA, IR, and MW–HA), it can be concluded that the shortest drying time was obtained using the MW–HA dryer and it was found that the MW–HA dryer dried shiitake mushrooms 57% faster than the HA dryers. Roknul et al. [40] studied the drying of stem lettuce slices using different dryers (HA, IR, MW–HA) and showed that the shortest drying time was related to the combined MW–HA dryer. They also showed that the drying time for the combined MW–HA dryer was 61% faster than the hot air dryer.
An et al. [41] investigated the drying of a variety of ginger by different dryers (HA, IR, freeze, MW, and combined MW–HA). The results showed that using the combined MW–HA method reduced the drying time compared to other methods, as applying the combined MW–HA dryer compared to the hot dryer accelerates the moisture removal from the terebinth by 88% and, consequently, shortens the drying time. Therefore, the results of this study are in good agreement with those of other researchers.

3.2. Effective Moisture Diffusivity

A comparison between sampling sites using a two-way analysis of variance (ANOVA; Table 4) also showed that there were significant differences for Deff in different drying methods. The constant and moisture-dependent Deff values were estimated using the drying data for different dryers, and the estimated Deff are shown in Table 6. According to the results of other researchers, Deff for agricultural and food products ranges from 10−12 to 10−7 m2/s [13]. The range of Deff values calculated for the drying of terebinth in the different dryers varied from 5.95 × 10⁻¹⁰ to 5.07 × 10⁻⁹ m2/s, which are in the range of 10−12 to 10−7 m2/s. Therefore, the results of this study are in good agreement with those of other researchers. In addition, the values obtained in this study are close to the values obtained for terebinth in continuous dryers, as reported by Chayjan et al. [42], where the reported values range from 6.48 × 10⁻¹¹ to 2.34 × 10⁻¹⁰ m2/s.
According to Table 6, the highest Deff was obtained in the MW–HA dryer (5.07 × 10⁻⁹), which can be due to the higher molecular motion and surface suction by this dryer. Surface evaporation causes tension in the internal texture of the terebinth, which increases the internal mass transfer and Deff [30]. The lowest Deff was obtained in the HA dryer (5.95 × 10⁻¹⁰). One of the important reasons for these results is that in the hot air dryer, due to moisture removal from the terebinth surface and the shrinkage mechanism, the capillary tubes on the sample surface are almost blocked, and this blockage is exacerbated by the further removal of moisture. This increases the drying time and subsequently reduces Deff. Additionally, the use of the IR–HA method in comparison to the IR and HA methods increases Deff because the drying temperature and IR power simultaneously have a direct effect on the internal mass transfer values (Deff). The use of IR power and air temperature increases the molecular motion, and more water molecules exit from within the samples, thereby decreasing the drying time and, consequently, increasing Deff [37].
Since the use of MW power increases moisture penetration; thus, the use of MW power accelerates the internal mass transfer of terebinth samples [26,27]. Similar results were reported by Behera and Sutar [43] for drying paddy samples with different dryers (HA, IR–HA, and MW). Minaei et al. [4] investigated the effect of different dryers (MW, IR, vacuum, and HA) on pomegranate arils and concluded that Deff obtained from the MW-dried samples were significantly different from other dryers.

3.3. Specific Energy Consumption

Table 4 shows that drying methods had a significant effect (p < 0.01) on specific energy consumption. The SEC levels in different drying techniques (HA, IR, MW, IR–HA, and MW–IR) used for drying terebinth are given in Table 6. The lowest SEC of 23.75 ± 4.22 kWh/kg is related to the MW dryer, and the highest amount is 124.33 ± 2.64 kWh/kg using the HA dryer. The use of the MW method reduces the drying time due to the increased thermal gradient and accelerated moisture removal. However, as the overall process time is reduced, the total amount of SEC decreases [25]. According to Ismail et al.’s [5] research on the drying of okra (HA, MW, IR, and vacuum), the obtained SEC (20.54 to 69.95 kWh/kg) showed that the MW dryer had the lowest SEC, and the highest value was obtained by the HA dryer. Motevali and Tabatabaei [26] also used different dryers (HA, IR, IR–HA, MW, MW–HA, and vacuum) to dry dog-rose and stated that the lowest SEC was related to the MW dryer; they also obtained the highest SEC for the HA dryer, which is consistent with the results of the two studies.

3.4. Energy Efficiency

According to ANOVA, the studied drying methods showed a significant effect on the energy efficiency of terebinth fruits (p < 0.01; Table 4). The energy use efficiency for drying terebinth varied from 5.65 to 29.64%. According to Table 6, the highest energy use efficiency (29.64 ± 0.75%) is related to the MW dryer, and the lowest value (5.65 ± 0.45%) to the HA dryer. As can be seen in Table 5 for the MW dryer, when only the MW power is used to dry the terebinth, the moisture removal rate from the terebinth inside the drying chamber increased, thereby shortening the drying time of the terebinth and, as a result, the SEC for the drying process is reduced and consequently, energy efficiency increases [27]. The long process time is the main reason for the high-energy consumption and low energy efficiency of HA and IR dryers [28]. The energy efficiency values obtained in this study are consistent with the results reported by Motevali et al. [27] for chamomile in various dryers (HA, MW, vacuum, IR, MW–HA, IR–HA) and Torki-Harchegani et al. [24] for peppermint leaves in different dryers (MW and HA).

3.5. Color

According to ANOVA, the drying methods showed a significant effect on the color of terebinth fruits (p < 0.01; Table 4). The comparison of the results of Table 7 of the color changes in different drying methods showed that the greatest and least changes of this property occurred in the HA dryer (20.22 ± 0.31) and the MW dryer (12.20 ± 0.51), respectively. Additionally, the color changes in the MW dryer were about 39% less than the color changes in the HA dryer and 8% less than the IR–HA dryer. This may be due to the decomposition of pigments and the enzymatic and nonenzymatic browning reactions that are greatly reduced by MW drying [44]. When using hot airflow, the decomposition of pigments is done with high intensity. Kaveh et al. [13] obtained the color change values for terebinth in a combined HA–MW–IR dryer in the range of 11.38 to 17.44. Si et al. [45] and Kayacan et al. [46] dried raspberry and persimmon using different drying methods, respectively. They showed that the use of the HA dryer reduces the color quality of the dried product. In their opinion, more drying time in the HA drying process can lead to increased pigment degradation and nonenzymatic browning. In addition, in the microwave–hot air dryer, the drying time is reduced and the samples were in contact with the hot air for a shorter time when drying, followed by the reduced degradation of pigments due to the contact with the HA and MW power during the drying process. n. In addition, the color changes in the terebinth fruit samples decreased. The reason for the lower color change in the dried samples in the IR–HA method than in the IR dryer is that the higher the drying rate and the shorter the drying time, the better the preservation of the terebinth color, preventing pigment degradation [47]. On the other hand, by reducing the drying time in this method, the enzymatic activity further decreased, and the color changes during the drying process were reduced. The infrared dryer also darkens the plant color compared to the IR–HA dryer, which is caused by chlorophyll degradation after the drying process [22].
In a study on the color changes of shiitake mushrooms under different dryers (HA, IR, and MW–HA), Wang et al. [39] found that most color changes occurred in the HA dryer, while the least change was found in the combined MW–HA dryer. They showed that prolonged drying causes the greatest changes in the color of the samples, which is consistent with the results of this study. Based on the results from the study of Łechtanska et al. [48] on drying green pepper using different dryers (HA, MW–HA, MW–HA–IR), it was observed that the least change in the color were related to the MW–HA dryer. They stated that the shorter drying time reduces the color changes.

3.6. Shrinkage (Sb)

According to ANOVA, the studied drying methods showed a significant effect on the shrinkage of terebinth fruits (p < 0.01; Table 4). One of the important physical changes that occur when drying foods with the penetration of moisture out of the food is volume reduction or shrinkage. The simultaneous transfer of mass and heat during the food drying induces stresses on the cellular structure of the food, which results in deformation and shrinkage (Table 7). The variations of shrinkage showed that the highest volume changes were observed for the drying by the HA (63.64 ± 2.20%) and IR (54.49 ± 3.06%) methods. One of the important reasons for the obtained results is that the use of the heating method causes a large change in moisture to be removed during the early drying times, which leads to thermal stress and cell wall rupture in the samples and, subsequently, the shrinkage increases in the samples. The lowest amount of Sb (25.29 ± 2.46%) occurred in the MW dryer. Thus, due to the vapor pressure inside the terebinth, using the MW dryer causes cell expansion (puffing effect) and, consequently, reduces the shrinkage [47,49].
The studies on the shrinkage variations in the MW–HA drying method showed that the rate of changes and amount of shrinkage in this method was about 29–73% lower than the other three methods (IR–HA, IR, and HA). One of the important reasons for the low amount of shrinkage in the MW–HA method, compared to the three methods, is that when the fruit surface dries much faster than its center, the internal stresses increase and, inside, the fruit cracks, leaving the sample porous. In these conditions, the nonvolatile compounds migrate to the fruit surface by releasing water, precipitate on the surface, and form a husk on the sample surface. This husk helps maintain the terebinth dimensions. This mechanism often occurs at high drying rates and results in reduced sample shrinkage [50]. For drying terebinth using a HA–MW–IR dryer, Kaveh et al. [13] showed that the highest and lowest shrinkage of terebinth was 69.88% and 41.12%, respectively.
Jiang et al. [47] showed that the shrinkage for the HA drying of okra samples was higher than other drying methods such as MW–vacuum, freeze, MW–HA, and MW–freeze, which is in agreement with the results of the present study. Xu et al. [22] found that the shrinkage was the highest in the HA-dried broccoli samples compared to other methods (freeze, MW, vacuum, MW–vacuum, MW–HA). In fact, drying by HA increases the shrinkage, as the shrinkage increases with prolonged drying time.

3.7. Rehydration Ratio (RR)

A comparison between sampling sites using a two-way analysis of variance (ANOVA; Table 4) also showed that there were significant differences for RR in different drying methods (p < 0.01). The RR properties of a dried product are used as an indicator of quality [29]. The results of the study of different dryers on the terebinth RR are shown in Table 7. RR for different dryers varied from 1.72 ± 0.07 to 3.27 ± 0.06. Ismail et al. [5] noted that RR depends on the structural changes in plant tissues and food cells. The highest and lowest amounts of water uptake were obtained in the MW and HA dryers, respectively. The rehydration ratio is associated with the cellular damage of the product during the drying. In the drying process, many of the water-binding sites in the product tissue are irreversibly destroyed, and, thus, the greater the degree of cellular damage, the less the RR. In general, MW dryers cause less damage to the cut cells [49], while the damage was most frequent in the HA dryers. It is, therefore, natural to have more RR in the MW dryer due to the less cellular damage. The vessels in each plant are the place where fluid is transferred to the plant and the water site in the plant, and the site is destroyed by the HA drying process when water exits from the vessels. Additionally, according to Table 6, the effect of the combined IR–HA dryer was greater than that of the IR dryer because the IR–HA drying method causes less damage to the sample tissue and, consequently, increases the RR and reduces shrinkage in the samples by creating more porosity [51]. Shewale et al. [2] examined the effect of different dryers on apple leaf drying and observed the highest RR in the MW-dried samples and the lowest RR in the HA dryer samples. They also found that the water absorbed by the samples increased when increasing the MW power compared to the fresh sample. Roknul et al. [31] investigated the effect of different drying methods (HA, IR, and MW–HA) on RR of peach leather and showed that RR of the samples dried with the MW–HA dryer was significantly higher than the sample dried with the HA and IR dryers.

3.8. AntiOX

Table 5 shows that drying methods had a significant effect (p < 0.01) on AntiOX. AntiOX properties of the fresh and dried terebinth, as evaluated by DPPH, are presented in Table 8. The amount of AntiOX for the fresh sample was 98.81%. According to Table 8, among the various dryers, the MW–IR dryer showed the highest AntiOX capacity, as the AntiOX capacity of terebinth obtained in the mentioned dryer was 94.58%, which was higher than other dryers. The reason for the high AntiOX capacity of the combined MW–HA dryer, compared to other conditions in the present study, is probably due to the reduced drying time. In the MW dryer, the AntiOX capacity was 74.01%, which is lower AntiOX capacity than the combined MW–HA and IR–HA dryers and more than the HA and IR dryers. According to Table 8, the total AntiOX for drying terebinth fruit is a combination of MW–HA > IR–HA > MW > IR > HA. An et al. [41] investigated the effect of different drying methods on the AntiOX properties and phenolic compounds of Chinese ginger and reported that the AntiOX properties were highest in the combined MW–HA dryer, which was attributed to the reduced duration of drying from 12 to 1.5 h due to the MW power and inlet air temperature. They also noted that the lowest amount of AntiOXs was observed in the HA dryer.

3.9. TPC and TFC

According to ANOVA, the studied drying methods showed a significant effect on TPC and TFC of terebinth fruits (p < 0.01; Table 5). The outcome from our study revealed that TPC and TFC of the fresh sample were 165.27 ± 4.04 mg GAE/gdw and 43.41 ± 0.85 mg QE/gdw, respectively (Table 8). Table 8 shows the effect of different drying methods on TPC. In this figure, the highest amount of TPC was related to the sample dried by the MW–HA dryer, equal to 149.13 ± 4.25 mg GAE/g d.w. Due to the short drying time, it exhibited the least changes compared to the fresh sample. Additionally, the lowest amount of TPC was related to the sample dried by the HA dryer, equal to 103.08 ± 3.39 mg GAE/g d.w. The HA-dried sample had the lowest amount of TPC due to the prolonged drying time, which increased the decomposition of phenolic compounds and the degradation of bioactive compounds. The TPC and TFC compounds play an important role in the AntiOX of plant extracts [7]. Wojdyło et al. [52] attributed the decrease in TPC during the drying of sour cherries in the HA dryer to the occurrence of irreversible oxidative reactions and thermal decomposition during the prolonged heating. Moreover, TPC for terebinth fruit in the IR–HA, MW, and IR dryers were 143.59 ± 5.97, 134.10 ± 4.09, and 120.00 ± 2.94 mg GAE/g d.w, respectively. Fruits and vegetables are highly effective in preventing cancer and cardiovascular diseases, which is due to their antioxidant compounds, including vitamin C, carotenoids, and polyphenols found in the fruits. Polyphenol compounds are a broad and important group of secondary plant metabolites in fruits and vegetables that maintain health in humans due to the antiradicals and AntiOX. The large classes of polyphenols, such as flavonoids and nonflavonoids, have been found in terebinth. Heat is one of the main factors affecting its content.
Table 8 shows the effect of different drying methods on the TFC compounds. The highest (36.83 ± 0.74 mg QE/g d.w.) and lowest (23.35 ± 0.90 mg QE/g d.w.) amounts of TFC were related to the samples dried by the MW–HA and HA dryers, respectively. The MW–HA dryer reduces the degradation of bioactive compounds (TPC and TFC) as a result of the changes in the chemical structure and the degradation of polyphenols during the drying process. Similar results have been reported in Cordyceps militaris [6], broccoli [22], and cranberries [53]. The IR–HA-dried sample retained higher levels of TPC and TFC than the HA- and IR-dried samples because the IR–HA method releases the bioactive compounds in many products due to the changes in the structure. These changes can have adverse effects on the quality of the finished sample in terms of preserving the bioactive compounds, but the result showed a positive effect on TPC and TFC of terebinth (e.g., increased TPC and TFC). Our findings are consistent with the previous studies by Vega-Galvez et al. [54] for papaya and Si et al. [45] for raspberry. They reported that the IR-dried papaya and raspberry retain a higher percentage of TPC and TFC than when dried with other dryers (HA, solar, vacuum, and freeze).

3.10. pH

Table 5 shows that drying methods have a significant effect (p < 0.01) on the pH of terebinth fruits. According to Table 7, the lowest pH is related to the sample dried with the HA air dryer (3.88 ± 0.009), and the highest pH values in the MW and MW–HA dryers are 3.97 ± 0.007 and 3.96 ± 0.008, respectively. In the samples dried with the MW dryer and MW–HA dryer, as compared to those dried with the HA dryer, the drying time for the dried samples is short, which reduces the consumption of organic acids in the respiratory cycle. Additionally, the reason for the higher pH in the MW and MW–HA dryers can be due to the Maillard reactions and the high concentration of soluble solids.

4. Conclusions

In this study, the kinetics, specific energy consumption, drying efficiency, color, shrinkage, rehydration ratio, antioxidant capacity, total phenol content, and total flavonoid content of the extract of dried terebinth fruit were investigated under different drying methods. According to the results, the microwave dryer has the lowest specific energy consumption and the highest energy efficiency. From the point of antioxidant parameters such as antioxidants, total phenol content, and total flavonoids, it was concluded that MW–HA (hot air–microwave drying) was an effective drying method to keep nutritional values. Based on the studied quality attributes, MW (microwave) was found to exhibit the best color, shrinkage, and rehydration ratio. Taking all aspects into consideration, MW (microwave) and MW–HA (hot air–microwave drying) can achieve a balance between nutritional characteristics and other characters for terebinth fruits. This study provides an in-depth understanding of the drying kinetics and antioxidant activity of five drying processes, which will be helpful for the selection of drying methods in terebinth industries.

Author Contributions

Conceptualization, Y.A.-G. and M.K.; methodology, Y.A.-G., M.K., and H.F.; software, Y.A.-G., M.F., and H.F.; validation, Y.A.-G. and M.H.-H.; formal analysis, M.K., Y.A.-G., and H.F.; investigation, Y.A.-G. and M.K.; resources, Y.A.-G. and M.K.; data curation, M.K.; writing—original draft preparation, M.K. and H.F.; writing—review and editing, Y.A.-G., J.L.H.-H., A.F.-P., and M.H.-H.; visualization, Y.A.-G., M.K., and J.L.H.-H.; supervision, Y.A.-G.; project administration, Y.A.-G.; funding acquisition, Y.A.-G., J.L.H.-H., A.F.-P., and M.H.-H. All authors have read and agreed to the published version of the manuscript.

Funding

This study was financially supported by the University of Mohaghegh Ardabili.

Conflicts of Interest

The authors declare no conflict of interest. The funders had no role in the design of the study; in the collection, analyses, or interpretation of data; in the writing of the manuscript, or in the decision to publish the results.

Nomenclature

A Tray area (m2) R R Rehydration ratio
A i Sample absorbance r e Diameter (m)
A t Control absorbance S E C Specific energy consumption (kWh/kg)
C a Specific heat (kJ/kg °C) S b Shrinkage (cm3)
D e f f Effective moisture diffusion coefficient (m2/s) t Drying time (min)
E e v a p Energy consumed to evaporate moisture from drying samples (kJ) T a b s Absolute temperature of drying air (K)
E U t e r Thermal energy consumption (kJ) v Velocity (m/s)
E U m e c Mechanical energy consumption (kJ) W e Mass of removal water (kg)
E t Total energy input to dryer (MJ) W r Weight after rehydration
h f . g Latent heat of vaporization (kJ/kg) W d Initial weight of the samples (kg)
I DPPH radical entrapping Δ E Total color change
K Lamp power (W) Δ L * , Δ b * , Δ a * Differences between the color of the fresh and dried sample
M R Moisture ratio Δ t temperature difference (°C)
M b Initial moisture content (kg water/kg dry matter) ρ a Air density (kg/m3)
M e Equilibrium moisture content (kg water/kg dry matter) Δ P different pressure (mbar)
M t Moisture content at any time (kg water/kg dry matter) λ i Initial volume (cm3)
M W Mass of evaporated water from the product (kg) λ f Final volume (cm3)
P Microwave output power (kW) η e Energy efficiency (%)

References

  1. Huang, J.; Zhang, M. Effect of three drying methods on the drying characteristics and quality of okra. Drying Technol. 2016, 34, 900–911. [Google Scholar] [CrossRef]
  2. Shewale, S.R.; Rajoriya, D.; Hebbar, H.U. Low humidity air drying of apple slices: Effect of EMR pretreatment on mass transfer parameters, energy efficiency and quality. Innov. Food Sci. Emerg. Technol. 2019, 55, 1–10. [Google Scholar] [CrossRef]
  3. Osae, R.; Essilfie, G.; Alolga, R.N.; Bonah, E.; Ma, H.; Zhou, C. Drying of ginger slices—Evaluation of quality attributes, energy consumption, and kinetics study. J. Food Process. Eng. 2020, 43, e13348. [Google Scholar] [CrossRef]
  4. Minaei, S.; Motevali, A.; Najafi, G.; Seyedi, S.R.M. Influence of drying methods on activation energy, effective moisture diffusion and drying rate of pomegranate arils (Punica granatum). Aust. J. Crop. Sci. 2011, 6, 584–591. [Google Scholar]
  5. Ismail, O.; Kipcak, A.S.; Doymaz, I. Drying of okra by different drying methods: Comparison of drying time, product color quality, energy consumption and rehydration. Athens J. Sci. 2019, 6, 155–168. [Google Scholar] [CrossRef]
  6. Li, Y.; Yang, H.; Yang, H.; Wang, J.; Chen, H. Assessment of drying methods on the physiochemical property and antioxidant activity of Cordyceps militaris. Food Measure 2019, 13, 513–520. [Google Scholar] [CrossRef]
  7. Heshmati, M.K.; Moghaddam, A.S. Application of intermittent microwave—Convective hot air technique on quality and nutritional characteristics of dried kiwi slices. J. Food Res. 2017, 27, 111–126. (In Farsi) [Google Scholar]
  8. Dong, Q.; He, D.; Ni, X.; Zhou, H.; Yang, H. Comparative study on phenolic compounds, triterpenoids, and antioxidant activity of Ganoderma lucidum affected by different drying methods. Food Measure 2019. [Google Scholar] [CrossRef]
  9. Chan, E.W.C.; Lim, Y.Y.; Wong, S.K.; Lim, K.K.; Tan, S.P.; Lianto, F.S.; Yong, M.Y. Effects of different drying methods on the antioxidant properties of leaves and tea of ginger species. Food Chem. 2009, 113, 166–172. [Google Scholar] [CrossRef]
  10. Katsube, T.; Tsurunaga, Y.; Sugiyama, M.; Furuno, T.; Yamasaki, Y. Effect of air-drying temperature on antioxidant capacity and stability of polyphenolic compounds in mulberry (Morus alba L.) leaves. Food Chem. 2009, 113, 964–969. [Google Scholar] [CrossRef]
  11. Wen, A.; Xie, C.; Mazhar, M.; Zhu, Y.; Zeng, H.; Qin, L.; Zhu, Y. Comparative evaluation of drying methods on kinetics, biocompounds and antioxidant activity of Bacillus subtilis-fermented dehulled adlay. Drying Technol. 2019. [Google Scholar] [CrossRef]
  12. Hatamnia, A.A.; Abbaspour, N.; Darvishzadeh, R. Antioxidant activity and phenolic profile of different parts of Bene (Pistacia atlantica subsp. kurdica) fruits. Food Chem. 2014, 145, 306–311. [Google Scholar] [CrossRef]
  13. Kaveh, M.; Abbaspour-Gilandeh, Y.; Chayjan, R.A.; Taghinezhad, E.; Mohammadigol, R. Mass transfer, physical, and mechanical characteristics of terebinth fruit (Pistacia atlantica L.) under convective infrared microwave drying. Heat Mass Transf. 2018, 54, 1879–1899. [Google Scholar] [CrossRef]
  14. Kaveh, M.; Amiri Chayjan, R.; Esna-Ashari, M. Thermal and physical properties modelling of terebinth fruit (Pistacia atlantica L.) under solar drying. Res. Agric. Eng. 2015, 61, 150–161. [Google Scholar] [CrossRef] [Green Version]
  15. Wang, Y.; Duan, X.; Ren, G.; Liu, Y. Comparative study on the flavonoids extraction rate and antioxidant activity of onions treated by three different drying methods. Drying Technol. 2019, 37, 245–252. [Google Scholar] [CrossRef]
  16. Adiletta, G.; Alam, M.R.; Cinquanta, L.; Russo, P.; Albanese, D.; Di Matteo, M. Effect of Abrasive Pretreatment on Hot Dried Goji Berry. Chem. Eng. Trans. 2015, 44, 127–132. [Google Scholar]
  17. Onwude, D.I.; Hashim, N.; Abdan, K.; Janius, R.; Chen, G. The effectiveness of combined infrared and hot-air drying strategies for sweet Potato. J. Food Eng. 2019, 241, 75–87. [Google Scholar] [CrossRef]
  18. Lao, Y.; Zhang, M.; Devahastin, S.; Ye, Y. Effect of combined infrared freeze drying and microwave vacuum drying on quality of kale yoghurt melts. Drying Technol. 2019. [Google Scholar] [CrossRef]
  19. Patrón-Vázquez, J.; Baas-Dzul, L.; Medina-Torres, N.; Ayora-Talavera, T.; Sánchez-Contreras, A.; García-Cruz, U.; Pacheco, N. The Effect of drying temperature on the phenolic content and functional behavior of flours obtained from lemon wastes. Agronomy 2019, 9, 474. [Google Scholar] [CrossRef] [Green Version]
  20. Choo, C.O.; Chua, B.L.; Figiel, A.; Jałoszyński, K.; Wojdyło, A.; Szumny, A.; Łyczko, J.; Chong, C.H. Hybrid drying of Murraya koenigii leaves: Energy consumption, antioxidant capacity, profiling of volatile compounds and quality studies. Process 2020, 8, 240. [Google Scholar] [CrossRef] [Green Version]
  21. Tekin, Z.H.; Başlar, M.; Karasu, S.; Kilicli, M. Dehydration of green beans using ultrasound-assisted vacuum drying as a novel technique: Drying kinetics and quality parameters. J. Food Process Preserv. 2017, 41, e13227. [Google Scholar] [CrossRef]
  22. Xu, Y.; Xiao, Y.; Lagnika, C.; Song, J.; Li, D.; Liu, C.; Jiang, N.; Zhang, M.; Duan, X. A comparative study of drying methods on physical characteristics, nutritional properties and antioxidant capacity of broccoli. Drying Technol. 2019. [Google Scholar] [CrossRef]
  23. Crank, J. Mathematics of Diffusion, 2nd ed.; Oxford University Press: London, UK, 1975. [Google Scholar]
  24. Torki-Harchegani, M.; Ghanbarian, D.; Pirbalouti, A.G.; Sadeghi, M. Dehydration behaviour, mathematical modelling, energyefficiency and essentialoil yield of peppermint leaves under going microwave and hot air treatments. Rev. Energy Sustain. Renew. 2016, 58, 407–418. [Google Scholar] [CrossRef]
  25. Kaveh, M.; Chayjan, R.A.; Taghinezhad, E.; Sharabiani, V.R.; Motevali, A. Evaluation of specific energy consumption and GHG emissions for different drying methods (Case study: Pistacia atlantica). J. Clean. Prod. 2020, 59, 120963. [Google Scholar] [CrossRef]
  26. Motevali, A.; Tabatabaei, S.R.T. A comparison between pollutants and greenhouse gas emissions from operation of different dryers based on energy consumption of power plants. J. Clean. Prod. 2017, 154, 445–461. [Google Scholar] [CrossRef]
  27. Motevali, A.; Minaei, S.; Banakar, A.; Ghobadian, B.; Khoshtaghaza, M.H. Comparison of energy parameters in various dryers. Energy Convers. Manag. 2014, 87, 711–725. [Google Scholar] [CrossRef]
  28. Ghanbarian, D.; Torki-Harchegani, M.; Sadeghi, M.; Pirbalouti, A.G. Ultrasonically improved convective drying of peppermint leaves: Influence on the process time and energetic indices. Renew. Energy 2020, 153, 67–73. [Google Scholar] [CrossRef]
  29. Horuz, E.; Jaafar, H.J.; Maskan, M. Ultrasonication as pretreatment for drying of tomato slices in a hot air–microwave hybrid oven. Drying Technol. 2017, 35, 849–859. [Google Scholar] [CrossRef]
  30. Taghinezhad, E.; Kaveh, M.; Jahanbakhshi, A.; Golpour, I. Use of artificial intelligence for the estimation of effective moisture diffusivity, specific energy consumption, color and shrinkage in quince drying. J. Food Process Eng. 2020, e13358. [Google Scholar] [CrossRef]
  31. Roknul, A.S.M.; Zhang, M.; Law, C.L.; Mujumdar, A.S. Effects of drying methods on quality attributes of peach (Prunus persica) leather. Drying Technol. 2019, 37, 341–351. [Google Scholar] [CrossRef]
  32. Lin, M.; Tsai, M.; Wen, K. Supercritical fluid extraction of flavonoids from Scutellaria Radix. J. Chromatogr. A 1999, 830, 387–395. [Google Scholar] [CrossRef]
  33. Akowuah, G.A.; Ismail, Z.; Norhayati, I.; Sadikun, A. The effects of different extraction solvents of varying polarities on polyphenols of Orthosiphon stamineus and evaluation of the free radical scavenging activity. Food Chem. 2005, 93, 311–317. [Google Scholar] [CrossRef]
  34. Marinova, D.; Ribarova, F.; Atanassaova, M. Total phenolics and total flavonoids in Bulgarian fruits and vegetables. J. Uni. Chem. Technol. Metall. 2005, 40, 255–260. [Google Scholar]
  35. Beketove, E.V.; Pakhomov, V.P.P.; Nesterova, O.V. Improved method of flavonoid extraction from bird cherry fruits. J. Pharm. Chem. 2005, 39, 33–35. [Google Scholar] [CrossRef]
  36. Darvishi, H.; Saba, M.K.; Behroozi-Khazaei, N.; Nourbakhsh, H. Improving quality and quantity attributes of grape juice concentrate (molasses) using ohmic heating. J. Food Sci. Technol. 2020, 57, 1362–1370. [Google Scholar] [CrossRef]
  37. Motevali, A.; Hashemi, S.J. Investigating the drying parameters of Fijou fruit in a freeze dryer. Innov. Food Technol. 2018, 5, 699–713. (In Farsi) [Google Scholar]
  38. Riadh, M.H.; Ahmad, S.A.B.; Marhaban, M.H.; Soh, A.C. Infrared heating in food drying: An overview au-riadh, muhmmed hussain. Drying Technol. 2015, 33, 322–335. [Google Scholar] [CrossRef]
  39. Wang, Q.; Li, S.; Han, X.; Ni, Y.; Zhao, D.; Hao, J. Quality evaluation and drying kinetics of shitake mushrooms dried by hot air, infrared and intermittent microwave–assisted drying methods. LWT 2019, 107, 236–242. [Google Scholar] [CrossRef]
  40. Roknul, A.S.M.; Zhang, M.; Mujumdar, A.S.; Wang, Y. A comparative study of four drying methods on drying time and quality characteristics of stem lettuce slices (Lactuca sativa L.). Drying Technol. 2014, 32, 657–666. [Google Scholar] [CrossRef]
  41. An, K.; Zhao, D.; Wang, Z.; Wu, J.; Xu, Y.; Xiao, G. Comparison of different drying methods on Chinese ginger (Zingiber officinale Roscoe): Changes in volatiles, chemical profile, antioxidant properties, and microstructure. Food Chem. 2016, 197, 1292–1300. [Google Scholar] [CrossRef]
  42. Chayjan, R.A.; Kaveh, M.; Khayati, S. Modeling some thermal and physical characteristics of terebinth fruit under semi industrial continuous drying. Food Measure 2017, 11, 12–23. [Google Scholar] [CrossRef]
  43. Behera, G.; Sutar, P.P. Effect of convective, infrared and microwave heating on drying rates, mass transfer characteristics, milling quality and microstructure of steam gelatinized Paddy. J. Food Process Eng. 2018, 41, e12900. [Google Scholar] [CrossRef]
  44. Das, I.; Arora, A. Alternate microwave and convective hot air application for rapid mushroom drying. J. Food Eng. 2018, 223, 208–219. [Google Scholar] [CrossRef]
  45. Si, X.; Chen, Q.; Bi, J.; Wu, X.; Yi, J.; Zhou, L.; Li, Z. Comparison of different drying methods on the physical properties, bioactive compounds and antioxidant activity of raspberry powders. J. Sci. Food Agric. 2016, 96, 2055–2062. [Google Scholar] [CrossRef] [PubMed]
  46. Kayacan, S.; Karasu, S.; Akman, P.K.; Goktas, H.; Doymaz, I.; Sagdıc, O. Effect of different drying methods on total bioactive compounds, phenolic profile, in vitro bioaccessibility of phenolic and HMF formation of persimmon. LWT 2020, 118, 108830. [Google Scholar] [CrossRef]
  47. Jiang, N.; Zhang, Z.; Li, D.; Liu, C.; Zhang, M.; Liu, C.; Wang, D.; Niu, L. Evaluation of freeze drying combined with microwave vacuum drying for functional okra snacks: Antioxidant properties, sensory quality, and energy consumption. LWT 2017, 82, 216–226. [Google Scholar] [CrossRef]
  48. Łechtanska, J.M.; Szadzinska, J.; Kowalski, S.J. Microwave- and infrared-assisted convective drying of green pepper: Quality and energy considerations. Chem. Eng. Process 2015, 98, 155–164. [Google Scholar] [CrossRef]
  49. Aydogdu, A.; Sumnu, G.; Sahin, S. Effects of microwave-infrared combination drying on quality of eggplants. Food Bioprocess. Technol. 2015, 8, 1198–1210. [Google Scholar] [CrossRef]
  50. Abbaspour-Gilandeh, Y.; Kaveh, M.; Jahanbakhshi, A. The effect of microwave and convective dryer with ultrasound pre-treatment on drying and quality properties of walnut kernel. J. Food Process Preserv. 2019, 43, e14178. [Google Scholar] [CrossRef]
  51. Doymaz, I. Air-drying characteristics of tomatoes. J. Food Eng. 2008, 78, 1291–1297. [Google Scholar] [CrossRef]
  52. Wojdyło, A.; Figiel, A.; Lech, K.; Nowicka, P.; Oszmianski, J. Effect of convective and vacuum–microwave drying on the bioactive compounds, color, and antioxidant capacity of sour cherries. Food Bioprocess. Technol. 2014, 7, 829–841. [Google Scholar] [CrossRef] [Green Version]
  53. Zielinska, M.; Zielinska, D. Effects of freezing, convective and microwave-vacuum drying on the content of bioactive compounds and color of cranberries. LWT 2019, 104, 202–209. [Google Scholar] [CrossRef]
  54. Vega-Galvez, A.; Poblete, J.; Quispe-Fuentes, I.; Uribe, E.; Bilbao-Sainz, C.; Pastén, A. Chemical and bioactive characterization of papaya (Vasconcellea pubescens) under different drying technologies: Evaluation of antioxidant and antidiabetic potential. Food Measure 2019, 13, 1980–1990. [Google Scholar] [CrossRef]
Figure 1. Drying kinetics of terebinth in different drying methods.
Agronomy 10 01378 g001
Table 1. Description of the drying programs.
NoAcronymDescriptionAirPower (W)
T (°C)V (m/s)MWINF
1HAConvective 65100
2IRInfrared 000500
3MWMicrowave 004500
4IR–HAInfrared-assisted convective 6510500
5MW–HAMicrowave-assisted convective 6514500
Table 2. Formulas used for determining the energy consumption of different dryers.
EquationEquation NumberEquationReference
E U t e r = ( A   v   ρ a   C a   Δ T   t )   (4)Et (HA)= Equation (4) + Equation (5)[24]
E U m e c = Δ P   M a i r   t (5)Et (MW)= Equation (7)[25]
E U t e r = ( A   v   ρ a   C a   Δ T   t + K   t ) (6)Et (MW- HA)= Equation (4) + Equation (5) + Equation (7)[26]
E U t e r = ( P   t )   3600 (7)Et (IR)= Equation (6)[25]
Et (IR- HA)= Equation (5) + Equation (6)[27]
Table 3. Formulas used for determining the energy efficiency of different dryers.
Equation Equation NumberReference
η e = ( E e v a p S E C ) × 100 (9)[24]
E e v a p = h f . g . M w (10)[27]
h f . g . = 2.503 × 10 3 2.386 ( T a b s 273.16 )
h f . g .   = ( 7.33 × 10 6 16 T a b s 2 ) 0.5
273.16     T a b s   338.72
338.72     T a b s   533.16
(11)[28]
Table 4. Analysis of variance (ANOVA) for the effect of drying methods on drying time, effective diffusivity (Deff), specific energy consumption (SEC), color, rehydration ratio (RR), and shrinkage (Sb) of terebinth.
S.O.VDfTimeDeffSECηeColorRRSb (%)
Drying method425185.00 **1.01 **5876.75 **314.65 **32.06 **1.18 **379.15 **
error10557.832.620.1770.300.0020.282
CV 4.542.972.382.753.471.981.16
** Significant at 1% probability level.
Table 5. Analysis of variance (ANOVA) for the effect of drying methods on antioxidant capacity (AntiOX), total phenol content (TPC), total flavonoid content (TFC), and pH of terebinth.
S.O.VDfTPCTFCAntiOXpH
Drying method51459.97 **179.59 **1174.51 **0.0095 **
error106.320.552.620.00015
CV 1.852.401.550.31
** Significant at 1% probability level.
Table 6. Influence of different drying methods on drying parameters of terebinth.
HAIRMWIR–HAMW–HA
Drying time (min)300 ± 12a200 ± 7b95 ± 5d150 ± 9c70 ± 4e
Reduced drying time (%)-33685076
Deff (m2/s)5.95 × 10−10e2.14 × 10−9d4.50 × 10−9b2.50 × 10−9c5.07 × 10−9a
SEC (kWh/kg)124.33 ± 2.64a55.55 ± 3.09c23.75 ± 4.22b103.83 ± 2.67e32.35 ± 3.89d
ηe (%)5.65 ± 0.45e12.67 ± 0.69c29.64 ± 0.75a6.76 ± 0.42d21.76 ± 0.51b
Different letters for the same segment represent statistically significant differences at a confidence level of 95%.
Table 7. The results of color, Sb, RR, and pH.
Drying MethodsColorSbRRpH
HA20.22 ± 0.31a63.64 ± 2.20a1.72 ± 0.07e3.88 ± 0.009c
IR17.76 ± 0.47b54.49 ± 3.06b2.19 ± 0.10d3.91 ± 0.006b
MW12.20 ± 0.51e25.29 ± 2.46e3.27 ± 0.06a3.97 ± 0.007a
IR–HA15.21 ± 0.38c47.45 ± 2.01c2.67 ± 0.09c3.93 ± 0.006b
MW–HA13.29 ± 0.61d36.67 ± 1.59d3.03 ± 0.08b3.96 ± 0.008a
Different letters for the same segment represent statistically significant differences at a confidence level of 95%.
Table 8. Results of AntiOXs, TPC, and TFC of terebinth samples under different drying methods.
Drying MethodsAntiOX (%)TPC (mg GAE/g d.w.)TFC (mg QE/g d.w.)
Fresh98.81 ± 1.8a165.27 ± 4.04a43.41 ± 0.85a
HA44.04 ± 1.62f103.08 ± 3.39f23.35 ± 0.90f
IR68.59 ± 1.55e120.00 ± 2.94e23.78 ± 1.06e
MW74.01 ± 2.29d134.10 ± 4.09d30.30 ± 0.82c
IR–HA76.17 ± 1.94c143.59 ± 5.97c27.26 ± 0.96d
MW–HA94.58 ± 1.95b149.13 ± 4.25b36.83 ± 0.74b
Different letters for the same segment represent statistically significant differences at a confidence level of 95%.

