Floristic Composition Mediates Change in Forage Nutritive Quality of Atlantic Mountain Grasslands after Experimental Grazing Exclusion


Abstract
:1. Introduction
2. Materials and Methods
2.1. Study Area
2.2. Experimental Design and Sampling Procedure
2.3. Mixed Modelling
2.4. Mediation Analysis
2.5. Data Availability
3. Results
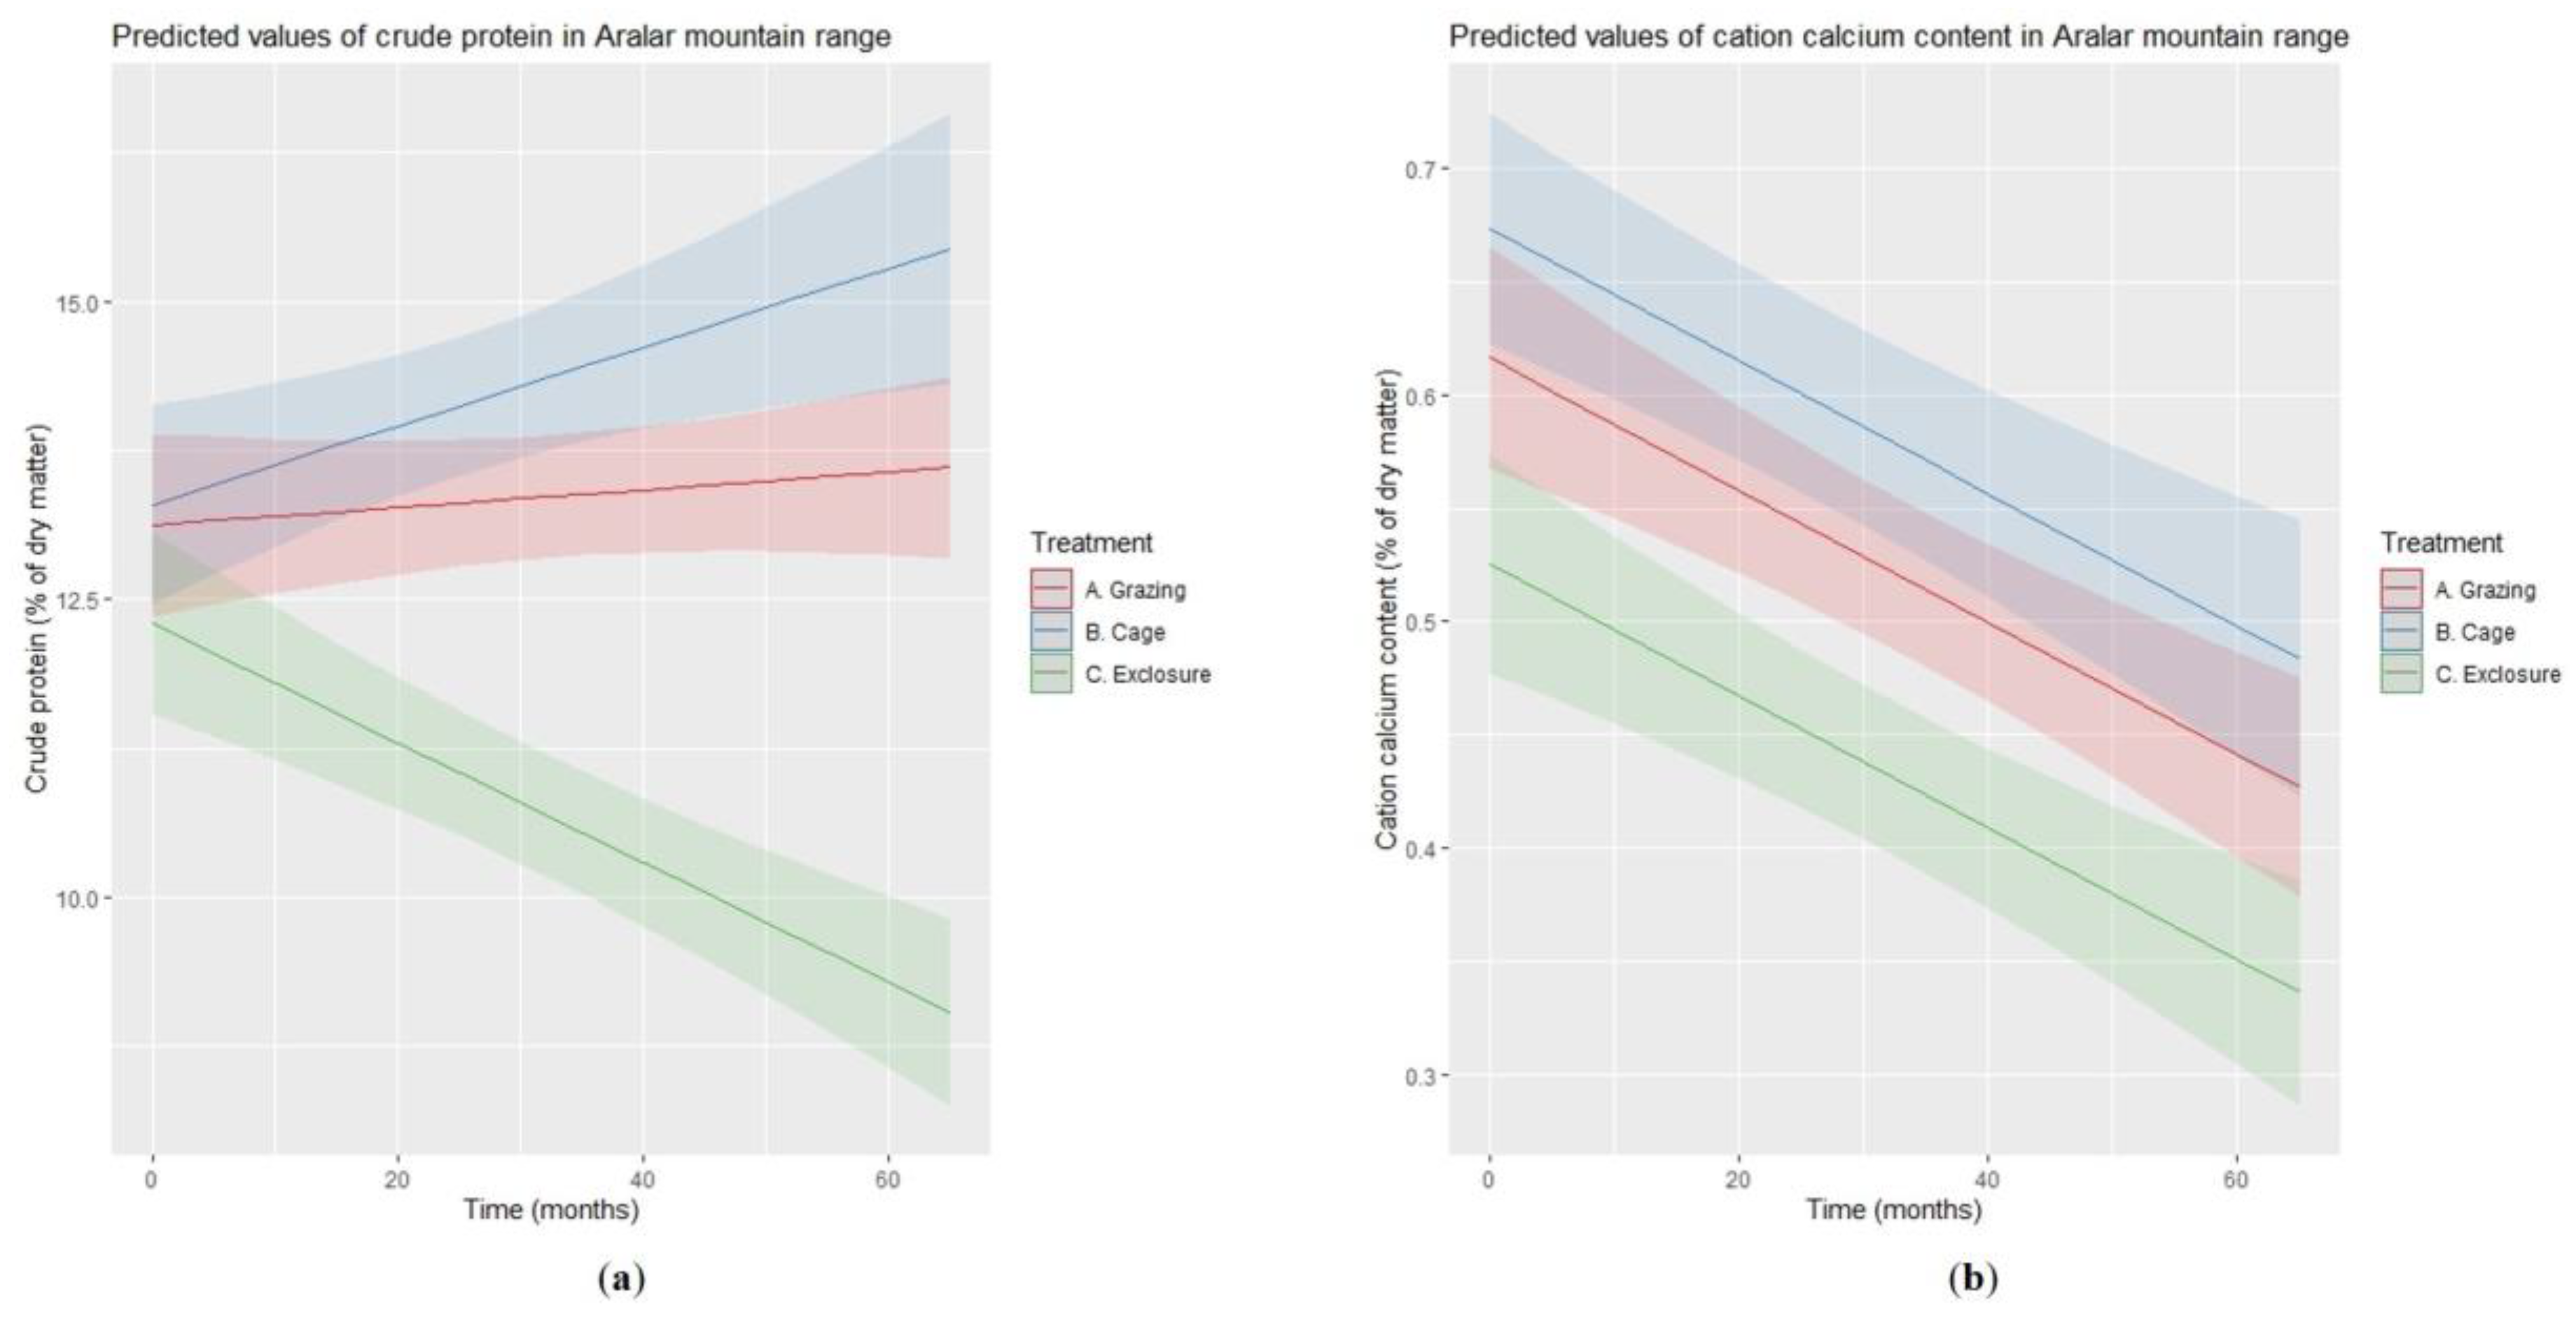
3.1. Forage Quality
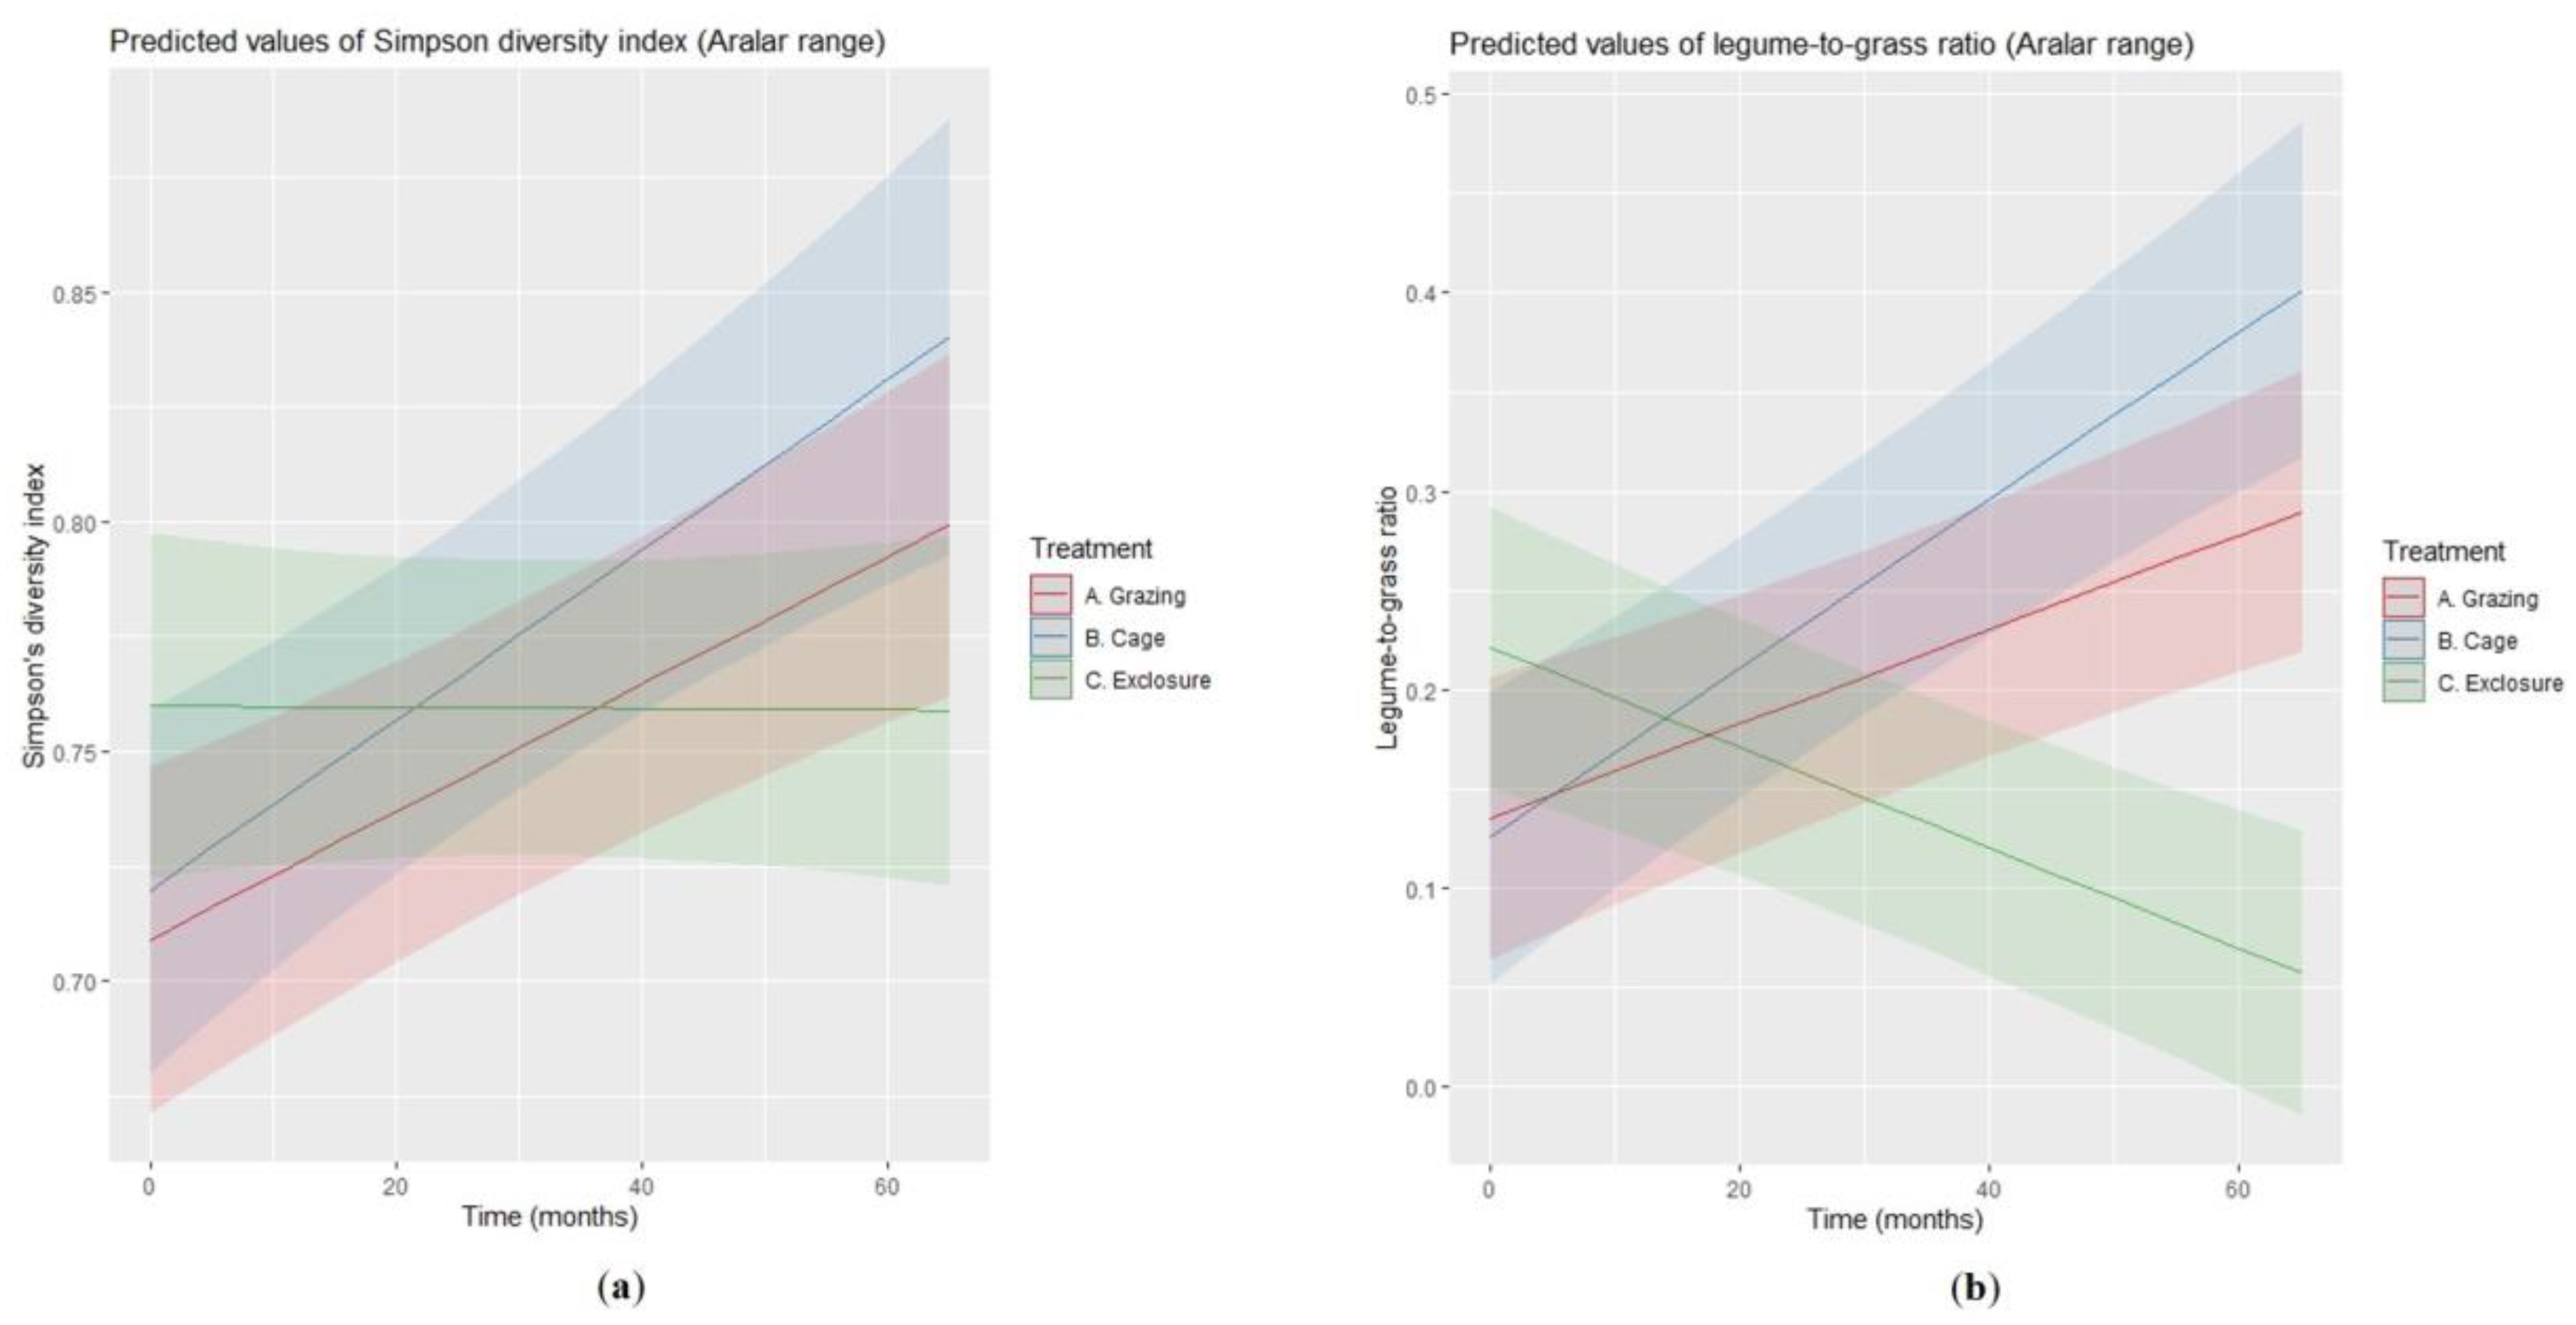
3.2. Floristic Composition
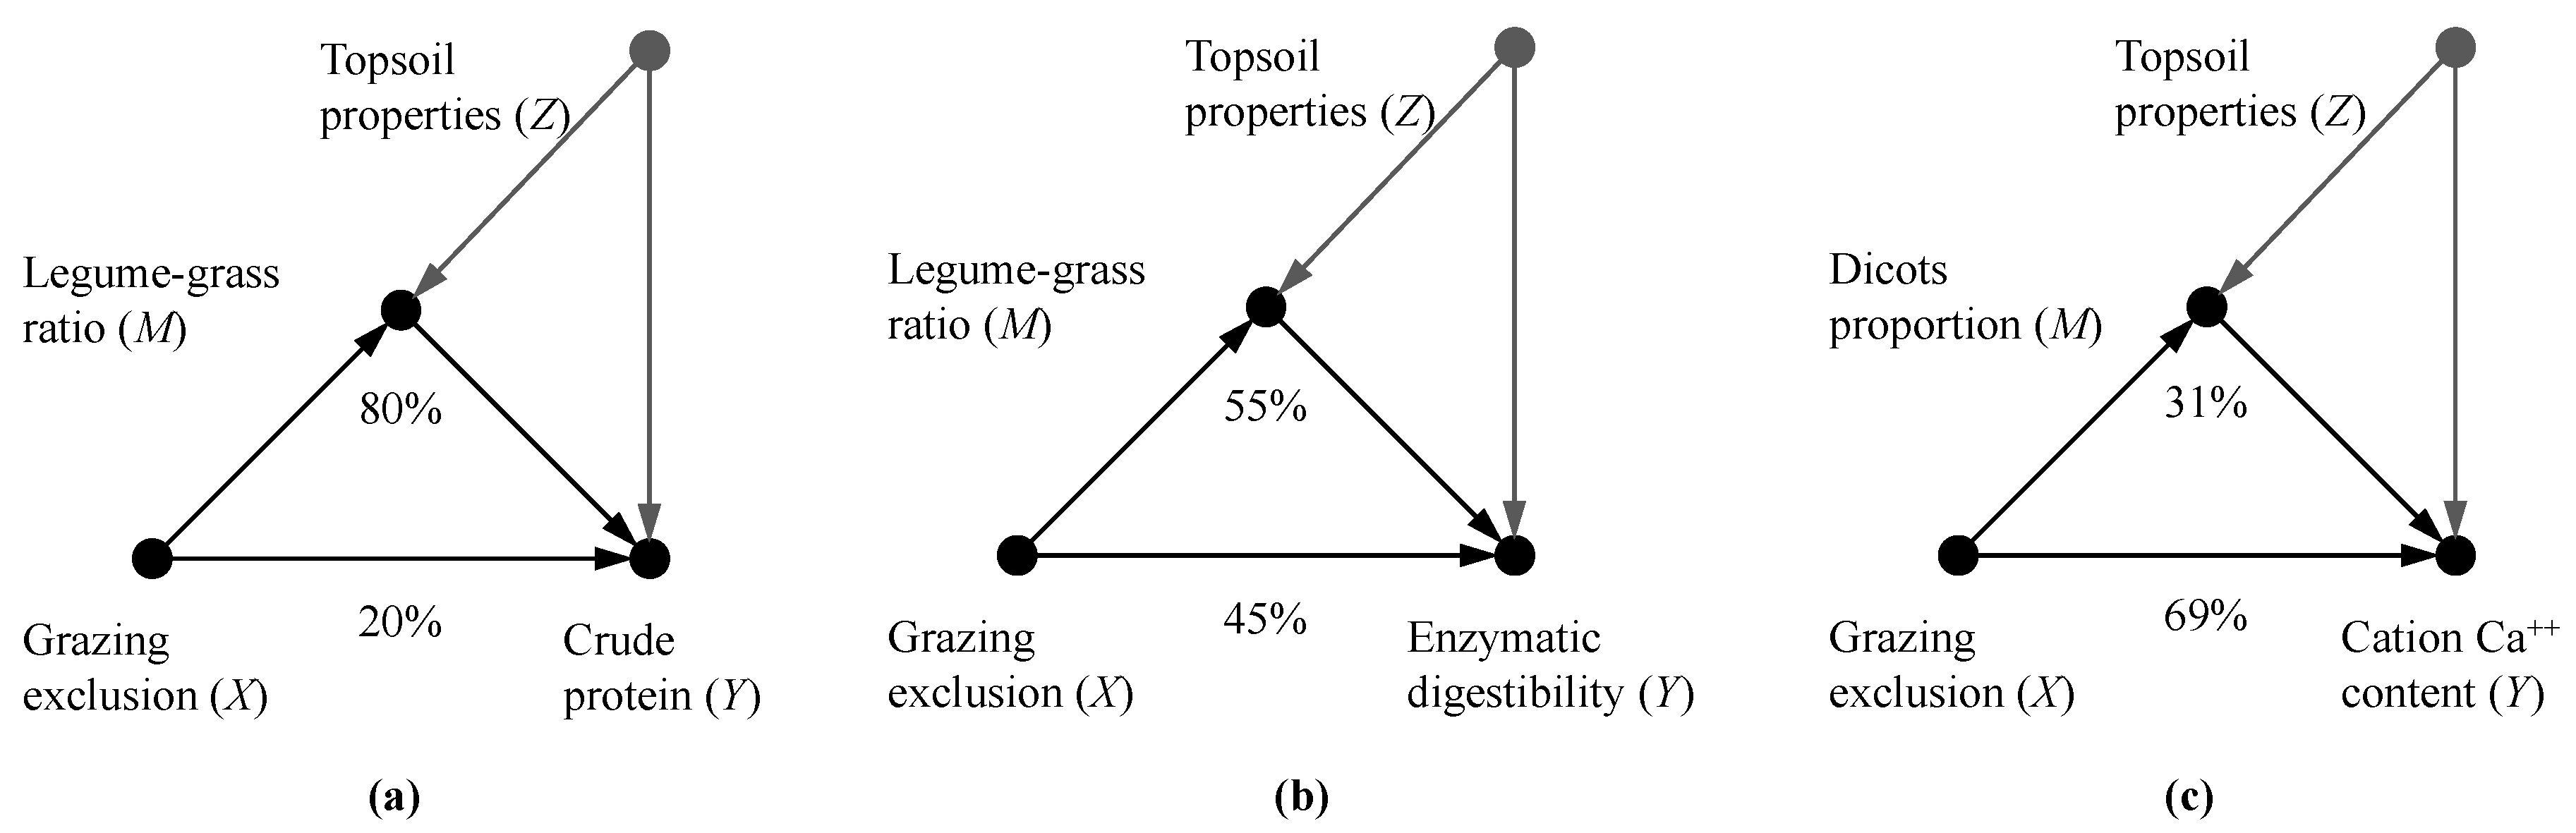
3.3. Mediation Analysis
4. Discussion
5. Conclusions
Supplementary Materials
Author Contributions
Funding
Acknowledgments
Conflicts of Interest
References
- Dengler, J.; Janišová, M.; Török, P.; Wellstein, C. Biodiversity of Palaearctic grasslands: A synthesis. Agric. Ecosyst. Environ. 2014, 182, 1–14. [Google Scholar] [CrossRef] [Green Version]
- Cardinale, B.J.; Srivastava, D.S.; Duffy, J.E.; Wright, J.P.; Downing, A.L.; Sankaran, M.; Jouseau, C. Effects of biodiversity on the functioning of trophic groups and ecosystems. Nature 2006, 443, 989–992. [Google Scholar] [CrossRef] [PubMed]
- Wang, L.; Delgado-Baquerizo, M.; Wang, D.; Isbell, F.; Liu, J.; Feng, C.; Liu, J.; Zhong, Z.; Zhu, H.; Yuan, X.; et al. Diversifying livestock promotes multidiversity and multifunctionality in managed grasslands. Proc. Natl. Acad. Sci. USA 2019, 116, 6187–6192. [Google Scholar] [CrossRef] [PubMed] [Green Version]
- Schaub, S.; Finger, R.; Leiber, F.; Probst, S.; Kreuzer, M.; Weigelt, A.; Buchmann, N.; Scherer-Lorenzen, M. Plant diversity effects on forage quality, yield and revenues of semi-natural grasslands. Nat. Commun. 2020, 11, 1–11. [Google Scholar] [CrossRef] [Green Version]
- Augustine, D.J.; Frank, D.A. Effects of Migratory Grazers on Spatial Heterogeneity of Soil Nitrogen Properties in a Grassland Ecosystem. Ecology 2001, 82, 3149–3162. [Google Scholar] [CrossRef]
- Pärtel, M.; Bruun, H.; Sammul, M. Biodiversity in temperate European grasslands: Origin and conservation. In Proceedings of the 13th International Occasional Symposium of the European Grassland Federation, Integrating Efficient Grassland Farming and Biodiversity; Lillak, R., Viiralt, R., Linke, A., Geherman, V., Eds.; Organising Committee of the 13th International Occasional Symposium of the European Grassland Federation and Estonian Grassland Society (EGS): Tartu, Estonia, 2005; pp. 1–14. [Google Scholar]
- Odriozola, I.; García-Baquero, G.; Fortin, M.-J.; Laskurain, N.A.; Aldezabal, A. Grazing exclusion unleashes competitive plant responses in Iberian Atlantic mountain grasslands. Appl. Veg. Sci. 2017, 20, 50–61. [Google Scholar] [CrossRef]
- Odriozola, I.; García-Baquero, G.; Laskurain, N.A.; Aldezabal, A. Livestock grazing modifies the effect of environmental factors on soil temperature and water content in a temperate grassland. Geoderma 2014, 235–236, 347–354. [Google Scholar] [CrossRef]
- Peco, B.; Navarro, E.; Carmona, C.P.; Medina, N.G.; Marques, M.J. Effects of grazing abandonment on soil multifunctionality: The role of plant functional traits. Agric. Ecosyst. Environ. 2017, 249, 215–225. [Google Scholar] [CrossRef]
- Cingolani, A.M.; Posse, G.; Collantes, M.B. Plant functional traits, herbivore selectivity and response to sheep grazing in Patagonian steppe grasslands. J. Appl. Ecol. 2005, 42, 50–59. [Google Scholar] [CrossRef]
- Aldezabal, A.; Moragues, L.; Odriozola, I.; Mijangos, I. Impact of grazing abandonment on plant and soil microbial communities in an Atlantic mountain grassland. Appl. Soil Ecol. 2015, 96, 251–260. [Google Scholar] [CrossRef]
- Semmartin, M.; Aguiar, M.R.; Distel, R.A.; Moretto, A.S.; Ghersa, C.M. Litter quality and nutrient cycling affected by grazing-induced species replacements along a precipitation gradient. Oikos 2004, 107, 148–160. [Google Scholar] [CrossRef]
- Frank, D.A.; Evans, R.D. Effects of native grazers on grassland N cycling in Yellowstone National Park. Ecology 1997, 78, 2238–2248. [Google Scholar] [CrossRef]
- McNaughton, S.J.; Zuniga, G.; McNaughton, M.M.; Banyikwa, F.F. Ecosystem catalysis: Soil urease activity and grazing in the ecosystem Serengeti. Oikos 1997, 80, 467–469. [Google Scholar] [CrossRef]
- Carvalheiro, L.G.; Kunin, W.E.; Keil, P.; Aguirre-Gutiérrez, J.; Ellis, W.N.; Fox, R.; Groom, Q.; Hennekens, S.; Van Landuyt, W.; Maes, D.; et al. Species richness declines and biotic homogenisation have slowed down for NW-European pollinators and plants. Ecol. Lett. 2013, 16, 870–878. [Google Scholar] [CrossRef] [Green Version]
- Rosa García, R.; Fraser, M.D.; Celaya, R.; Ferreira, L.M.M.; García, U.; Osoro, K. Grazing land management and biodiversity in the Atlantic European heathlands: A review. Agrofor. Syst. 2013, 87, 19–43. [Google Scholar] [CrossRef]
- Scohier, A.; Dumont, B. How do sheep affect plant communities and arthropod populations in temperate grasslands? Animal 2012, 6, 1129–1138. [Google Scholar] [CrossRef] [Green Version]
- Batalla, I.; Knudsen, M.T.; Mogensen, L.; Hierro, Ó.; Del Pinto, M.; Hermansen, J.E. Carbon footprint of milk from sheep farming systems in Northern Spain including soil carbon sequestration in grasslands. J. Clean. Prod. 2015, 104, 121–129. [Google Scholar] [CrossRef]
- Gerber, P.J.; Steinfeld, H.; Henderson, B.; Mottet, A.; Opio, C.; Dijkman, J.; Falcucci, A.; Tempio, G. Tackling Climate Change Through Livestock—A Global Assessment of Emissions and Mitigation Opportunities; Food and Agriculture Organization of the United Nations (FAO): Rome, Italy, 2013; ISBN 978-92-5-107920-1. [Google Scholar]
- Bernués, A.; Ruiz, R.; Olaizola, A.; Villalba, D.; Casasús, I. Sustainability of pasture-based livestock farming systems in the European Mediterranean context: Synergies and trade-offs. Livest. Sci. 2011, 139, 44–57. [Google Scholar] [CrossRef]
- Pe’er, G.; Dicks, L.V.; Visconti, P.; Arlettaz, R.; Báldi, A.; Benton, T.G.; Collins, S.; Dieterich, M.; Gregory, R.D.; Hartig, F.; et al. EU agricultural reform fails on biodiversity. Science 2014, 344, 1090–1092. [Google Scholar] [CrossRef]
- MacDonald, D.; Crabtree, J.R.; Wiesinger, G.; Dax, T.; Stamou, N.; Fleury, P.; Gutierrez Lazpita, J.; Gibon, A. Agricultural abandonment in mountain areas of Europe: Environmental consequences and policy response. J. Environ. Manag. 2000, 59, 47–69. [Google Scholar] [CrossRef]
- Lasanta, T.; Nadal-Romero, E.; Arnáez, J. Managing abandoned farmland to control the impact of re-vegetation on the environment. The state of the art in Europe. Environ. Sci. Policy 2015, 52, 99–109. [Google Scholar] [CrossRef] [Green Version]
- Díaz, S.; Noy-Meir, I.; Cabido, M. Can grazing response of herbaceous plants be predicted from simple vegetative traits? J. Appl. Ecol. 2001, 38, 497–508. [Google Scholar] [CrossRef] [Green Version]
- Strauss, S.Y.; Agrawal, A.A. The ecology and evolution of plant tolerance to herbivory. Trends Ecol. Evol. 1999, 14, 179–185. [Google Scholar] [CrossRef]
- Deléglise, C.; Meisser, M.; Mosimann, E.; Spiegelberger, T.; Signarbieux, C.; Jeangros, B.; Buttler, A. Drought-induced shifts in plants traits, yields and nutritive value under realistic grazing and mowing managements in a mountain grassland. Agric. Ecosyst. Environ. 2015, 213, 94–104. [Google Scholar] [CrossRef]
- Evju, M.; Austrheim, G.; Halvorsen, R.; Mysterud, A. Grazing responses in herbs in relation to herbivore selectivity and plant traits in an alpine ecosystem. Oecologia 2009, 161, 77–85. [Google Scholar] [CrossRef]
- Wilson, J.B. The twelve theories of co-existence in plant communities: The doubtful, the important and the unexplored. J. Veg. Sci. 2011, 22, 184–195. [Google Scholar] [CrossRef]
- Koutsoukis, C.; Roukos, C.; Demertzis, P.G.; Kandrelis, S.; Akrida-Demertzi, K. The variation of the chemical composition of the main plant species in a subalpine grassland in northwestern Greece. Legum. Sci. 2019, 1. [Google Scholar] [CrossRef]
- Darch, T.; McGrath, S.P.; Lee, M.R.F.; Beaumont, D.A.; Blackwell, M.S.A.; Horrocks, C.A.; Evans, J.; Storkey, J. The Mineral Composition of Wild-Type and Cultivated Varieties of Pasture Species. Agronomy 2020, 10, 1463. [Google Scholar] [CrossRef]
- Odriozola, I.; García-Baquero, G.; Etxeberria, A.; Aldezabal, A. Patterns of species relatedness created by competitive exclusion depend on species niche differences: Evidence from Iberian Atlantic grasslands. Perspect. Plant Ecol. Evol. Syst. 2017, 28, 36–46. [Google Scholar] [CrossRef]
- Tansley, A.G.; Adamson, R.S. Studies of the vegetation of the English chalk: III. The chalk grasslands of Hampshire-Sussex border. J. Ecol. 1925, 13, 177–223. [Google Scholar] [CrossRef] [Green Version]
- Pearl, J. Causal inference in statistics: An overview. Stat. Surv. 2009, 3, 96–146. [Google Scholar] [CrossRef]
- Pearl, J. Interpretation and identification of causal mediation. Psychol. Methods 2014, 19, 459–481. [Google Scholar] [CrossRef] [PubMed]
- Tahmasebi Kohyani, P.; Bossuyt, B.; Bonte, D.; Hoffmann, M. Grazing as a management tool in dune grasslands: Evidence of soil and scale dependence of the effect of large herbivores on plant diversity. Biol. Conserv. 2008, 141, 1687–1694. [Google Scholar] [CrossRef]
- Stohlgren, T.J.; Schell, L.D.; Vanden Heuvel, B. How grazing and soil quality affect native and exotic plant diversity in Rocky Mountain grasslands. Ecol. Appl. 1999, 9, 45–64. [Google Scholar] [CrossRef]
- Hulshof, C.M.; Spasojevic, M.J. The edaphic control of plant diversity. Glob. Ecol. Biogeogr. 2020, 1–16. [Google Scholar] [CrossRef]
- Frank, D.A. The interactive effects of grazing ungulates and aboveground production on grassland diversity. Oecologia 2005, 143, 629–634. [Google Scholar] [CrossRef]
- Aldezabal, A.; Odriozola, I.; García-Baquero, G. Grazing Abandonment Delays the Effect of Temperature on Aboveground Net Primary Production in Atlantic Grasslands. Rangel. Ecol. Manag. 2019, 72, 822–831. [Google Scholar] [CrossRef]
- Casella, G. Statistical Design; Casella, G., Fienberg, S., Olkin, I., Eds.; Springer: Gainesville, FL, USA, 2008; ISBN 9780387759647. [Google Scholar]
- Higgins, K.F.; Oldemeyer, J.L.; Jenkins, K.J.; Clambey, G.K.; Harlow, R.F. Vegetation sampling and measurement. In Research and Management Techniques for Wildlife and Habitats; Bookhout, T.A., Ed.; The Wildlife Society: Bethesda, MD, USA, 1994; pp. 567–591. ISBN 9780935868814. [Google Scholar]
- Riveros, E.; Argamentería, A. Métodos encimáticos de la predicción de la digestibilidad in vivo de la materia orgánica de forrajes. 1. Forrajes verdes. 2. Ensilados y pajas. Av. En Prod. Anim. 1987, 12, 49–75. [Google Scholar]
- Jackson, E.; Farrington, D.S.; Henderson, K. The Analysis of Agricultural Materials: A Manual of the Analytical Methods Used by the Agricultural Development and Advisory Service; Ministry of Agriculture, Fisheries and Food: London, UK, 1986; ISBN 0-11-242762-6.
- Tukey, J.W. Exploratory Data Analysis; Addison-Wesley Publishing Company: Reading, MA, USA, 1977. [Google Scholar]
- Pinheiro, J.C.; Bates, D.M. Mixed-Effects Models in S and S-PLUS; Springer: Berlin, Germany, 2000. [Google Scholar]
- Pinheiro, J.; Bates, D.; DebRoy, S.; Sarkar, D.; Team, R.C. Nlme: Linear and Nonlinear Mixed Effects Models. R Package Version 3.1-147. 2020. Available online: http://CRAN.R-project.org/package=nlme (accessed on 10 December 2020).
- R Core Team. R: A Language and Environment for Statistical Computing; R Core Team: Vienna, Austria, 2017. [Google Scholar]
- Barton, K. MuMIn: Multi-Model Inference. R Package Version 1.43.17. 2020. Available online: http://CRAN.R-project.org/package=MuMIn (accessed on 15 April 2020).
- Lüdecke, D. sjPlot: Data Visualization for Statistics in Social Science. R package version 2.8.4. 2018. Available online: http://CRAN.R-project.org/package=sjPlot (accessed on 28 October 2020).
- Tingley, D.; Yamamoto, T.; Hirose, K.; Keele, L.; Imai, K. Mediation: R Package for Causal Mediation Analysis. J. Stat. Softw. 2014, 59, 1–38. [Google Scholar] [CrossRef] [Green Version]
- Imai, K.; Keele, L.; Tingley, D. A General Approach to Causal Mediation Analysis. Psychol. Methods 2010, 15, 309–334. [Google Scholar] [CrossRef] [Green Version]
- Imai, K.; Yamamoto, T. Identification and Sensitivity Analysis for Multiple Causal Mechanisms: Revisiting Evidence from Framing Experiments. Polit. Anal. 2013, 21, 141–171. [Google Scholar] [CrossRef]
- Simpson, E.H. Measurment of Diversity. Nature 1949, 163, 688. [Google Scholar] [CrossRef]
- Robins, J.M.; Greenland, S. Identifiability and exchangeability for direct and indirect effects. Epidemiology 1992, 3, 143–155. [Google Scholar] [CrossRef] [Green Version]
- Pearl, J. Direct and indirect effects. In Proceedings of the Seventeenth Conference on Uncertainty in Artificial Intelligence; Morgan Kaufmann Publishers Inc.: Seattle, WA, USA, 2001; pp. 411–420. [Google Scholar]
- Fisher, R.A. Statistical Methods, Experimental Design and Scientific Inference. A Re-Issue of Statistical Methods for Research Workers, The Design of Experiments, and Statistical Methods and Scientific Inference; Oxford University Press: Oxford, UK, 1990. [Google Scholar]
- Imai, K.; Keele, L.; Tingley, D.; Yamamoto, T. Unpacking the Black Box of Causality: Learning about Causal Mechanisms from Experimental and Observational Studies. Am. Polit. Sci. Rev. 2011, 105, 765–789. [Google Scholar] [CrossRef]
- Chapman, D.F.; Lemaire, G. Tissues flows in grazed plant communities. In The Ecology and Management of Grazing Systems; Hodgson, J.G., Illius, A.W., Eds.; CAB International: Guilford, UK, 1996; pp. 3–36. [Google Scholar]
- Pavlů, V.; Hejcman, M.; Pavlů, L.; Gaisler, J.; Nežerková, P. Effect of continuous grazing on forage quality, quantity and animal performance. Agric. Ecosyst. Environ. 2006, 113, 349–355. [Google Scholar] [CrossRef]
- Cruz, P.; De Quadros, F.L.F.; Theau, J.P.; Frizzo, A.; Jouany, C.; Duru, M.; Carvalho, P.C.F. Leaf Traits as Functional Descriptors of the Intensity of Continuous Grazing in Native Grasslands in the South of Brazil. Rangel. Ecol. Manag. 2010, 63, 350–358. [Google Scholar] [CrossRef]
- Aldezabal, A.; Zubeldia, I.; Mandaluniz, N.; Laskurain, N.A. Estudio de la evolución temporal y los cambios paisajísticos en los pastos de montaña de interés comunitario del País Vasco. In Pastos y PAC 2014-2020; Busqué, J., Salcedo, G., Serrano, E., Mora, M.J., Fernández, B., Eds.; S.E.E.P.: Potes, Spain, 2014; pp. 81–88. ISBN 978-84-697-0561-2. [Google Scholar]
- Lezama, F.; Paruelo, J.M. Disentangling grazing effects: Trampling, defoliation and urine deposition. Appl. Veg. Sci. 2016, 19, 557–566. [Google Scholar] [CrossRef]
- Pontes, L.D.S.; Louault, F.; Carrère, P.; Maire, V.; Andueza, D.; Soussana, J.F. The role of plant traits and their plasticity in the response of pasture grasses to nutrients and cutting frequency. Ann. Bot. 2010, 105, 957–965. [Google Scholar] [CrossRef] [Green Version]
- Pontes, L.D.S.; Soussana, J.F.; Louault, F.; Andueza, D.; Carrère, P. Leaf traits affect the above-ground productivity and quality of pasture grasses. Funct. Ecol. 2007, 21, 844–853. [Google Scholar] [CrossRef]
- Milcu, A.; Gessler, A.; Roscher, C.; Rose, L.; Kayler, Z.; Bachmann, D.; Pirhofer-Walzl, K.; Zavadlav, S.; Galiano, L.; Buchmann, T.; et al. Top canopy nitrogen allocation linked to increased grassland carbon uptake in stands of varying species richness. Sci. Rep. 2017, 7, 1–11. [Google Scholar] [CrossRef]
- Van Soest, P.J. Plant, Animal and Environment. In Nutritional Ecology of the Ruminant; Cornell University Press: London, UK, 1994; pp. 77–92. [Google Scholar]
- Cingolani, A.M.; Noy-Meir, I.; Díaz, S. Grazing Effects on Rangeland Diversity: A Synthesis of Contemporary Models. Ecol. Appl. 2005, 15, 757–773. [Google Scholar] [CrossRef]
- Milchunas, D.G.; Sala, O.E.; Lauenroth, W.K. A generalized model of the effects of grazing by large herbivores on grassland community structure. Am. Nat. 1988, 132, 87–106. [Google Scholar] [CrossRef]
- Olff, H.; Ritchie, M.E. Effects of herbivores on grassland plant diversity. Trends Ecol. Evol. 1998, 13, 261–265. [Google Scholar] [CrossRef] [Green Version]
- Bullock, J.M.; Hill, B.C.; Silvertown, J.; Sutton, M. Gap Colonization as a Source of Grassland Community Change: Effects of Gap Size and Grazing on the Rate and Mode of Colonization by Different Species. Oikos 1995, 72, 273–282. [Google Scholar] [CrossRef]
- Lee, M.A.; Davis, A.P.; Chagunda, M.G.G.; Manning, P. Forage quality declines with rising temperatures, with implications for livestock production and methane emissions. Biogeosciences 2017, 14, 1403–1417. [Google Scholar] [CrossRef] [Green Version]
- Waghorn, G.C.; Clark, D.A. Feeding value of pastures for ruminants. N. Z. Vet. J. 2004, 52, 320–331. [Google Scholar] [CrossRef]
- Dubljević, R.; Marković, B.; Radonjić, D.; Stešević, D.; Marković, M. Influence of changes in botanical diversity and quality of wet grasslands through phenological phases on cow milk fatty acid composition. Sustainability 2020, 12, 6320. [Google Scholar] [CrossRef]
- Bravo-Lamas, L.; Aldai, N.; Kramer, J.K.G.; Barron, L.J.R. Case study using commercial dairy sheep flocks: Comparison of the fat nutritional quality of milk produced in mountain and valley farms. LWT Food Sci. Technol. 2018, 89, 374–380. [Google Scholar] [CrossRef]


| Treatment | Time | Treat. × Time | FF R2 | RF R2 | |
|---|---|---|---|---|---|
| Ash | 26.40 (2, 333) *** | 0.39 (1, 333) | n.s. | 0.107 | 0.211 |
| Ca | 18.44 (2, 331) *** | 28.14 (1, 331) *** | n.s. | 0.161 | 0.000 |
| Mg | 39.14 (2, 331) *** | 0.54 (2, 331) | 14.26 (2, 331) *** | 0.210 | 0.130 |
| K | 18.77 (2, 331) *** | 2.01 (2, 331) | 16.49 (2, 331) *** | 0.157 | 0.113 |
| P | 26.71 (2, 331) *** | 9.45 (1, 331) ** | 8.64 (2, 331) *** | 0.137 | 0.285 |
| CP | 88.62 (2, 331) *** | 2.90 (1, 331) | 17.83 (2, 331) *** | 0.381 | 0.022 |
| NDF | 16.95 (2, 331) *** | 0.35 (1, 331) | 8.10 (2, 331) *** | 0.128 | 0.014 |
| NDFcel | 18.44 (2, 329) *** | 1.59 (1, 329) | 13.08 (2, 329) *** | 0.156 | 0.030 |
| Simpson’s index | 0.69 (2, 329) | 22.84 (1, 329) *** | 7.86 (2, 329) *** | 0.091 | 0.140 |
| Legume-to-grass ratio | 20.78 (2, 329) *** | 7.69 (1, 329) ** | 40.20 (2, 329) *** | 0.228 | 0.182 |
| Dicots proportion | 21.60 (2, 329) *** | 1.50 (1, 329) | 27.81 (2, 329) *** | 0.149 | 0.353 |
| Variable | Level of Reference: Grazing (<intercept>) | Exclosure vs. Grazing | Time | Exclosure × Time | σb | σ |
|---|---|---|---|---|---|---|
| Ash | 7.96 | −1.65 | - | - | 1.16 | 2.08 |
| Ca | 0.62 | −0.09 | −0.003 | - | 0.00 | 0.20 |
| Mg | 0.14 | −0.01 | 0.000 | −0.001 | 0.02 | 0.03 |
| K | 0.94 | 0.18 | 0.001 | −0.008 | 0.11 | 0.29 |
| P | 0.24 | −0.01 | −0.0003 | −0.0005 | 0.03 | 0.04 |
| CP | 13.12 | −0.82 | 0.01 | −0.06 | 0.38 | 2.02 |
| NDF | 67.55 | 0.24 | −0.04 | 0.09 | 0.59 | 4.62 |
| NDFcel | 42.64 | 0.51 | 0.02 | −0.11 | 0.92 | 4.77 |
| Simpson’s index | 0.71 | 0.05 | 0.001 | −0.001 | 0.03 | 0.07 |
| Legume-to-grass ratio | 0.14 | 0.09 | 0.002 | −0.005 | 0.06 | 0.11 |
| Dicots proportion | 0.31 | 0.04 | 0.001 | −0.003 | 0.06 | 0.08 |
Publisher’s Note: MDPI stays neutral with regard to jurisdictional claims in published maps and institutional affiliations. |
© 2020 by the authors. Licensee MDPI, Basel, Switzerland. This article is an open access article distributed under the terms and conditions of the Creative Commons Attribution (CC BY) license (http://creativecommons.org/licenses/by/4.0/).
Share and Cite
García-Baquero, G.; Odriozola, I.; Aldezabal, A. Floristic Composition Mediates Change in Forage Nutritive Quality of Atlantic Mountain Grasslands after Experimental Grazing Exclusion. Agronomy 2021, 11, 25. https://doi.org/10.3390/agronomy11010025
García-Baquero G, Odriozola I, Aldezabal A. Floristic Composition Mediates Change in Forage Nutritive Quality of Atlantic Mountain Grasslands after Experimental Grazing Exclusion. Agronomy. 2021; 11(1):25. https://doi.org/10.3390/agronomy11010025
Chicago/Turabian StyleGarcía-Baquero, Gonzalo, Iñaki Odriozola, and Arantza Aldezabal. 2021. "Floristic Composition Mediates Change in Forage Nutritive Quality of Atlantic Mountain Grasslands after Experimental Grazing Exclusion" Agronomy 11, no. 1: 25. https://doi.org/10.3390/agronomy11010025