Review

Factors That Influence Nitrous Oxide Emissions from Agricultural Soils as Well as Their Representation in Simulation Models: A Review

1
Department of Water, Atmosphere and Environment, Institute for Hydrology and Water Management, University of Natural Resources & Life Science, 1190 Vienna, Austria
2
Leibniz Institute for Agricultural Engineering and Bioeconomy, 14469 Potsdam, Germany
3
Faculty of Civil Engineering, Architecture and Environmental Engineering, University of Zielona Góra, Licealna 9/9, 65-417 Zielona Góra, Poland
4
Department of Crop Science, Institute of Agronomy, University of Natural Resources & Life Science, 3430 Tulln an der Donau, Austria
*
Author to whom correspondence should be addressed.
Agronomy 2021, 11(4), 770; https://doi.org/10.3390/agronomy11040770
Submission received: 11 March 2021 / Revised: 31 March 2021 / Accepted: 10 April 2021 / Published: 14 April 2021

Abstract

:
Nitrous oxide (N2O) is a long-lived greenhouse gas that contributes to global warming. Emissions of N2O mainly stem from agricultural soils. This review highlights the principal factors from peer-reviewed literature affecting N2O emissions from agricultural soils, by grouping the factors into three categories: environmental, management and measurement. Within these categories, each impact factor is explained in detail and its influence on N2O emissions from the soil is summarized. It is also shown how each impact factor influences other impact factors. Process-based simulation models used for estimating N2O emissions are reviewed regarding their ability to consider the impact factors in simulating N2O. The model strengths and weaknesses in simulating N2O emissions from managed soils are summarized. Finally, three selected process-based simulation models (Daily Century (DAYCENT), DeNitrification-DeComposition (DNDC), and Soil and Water Assessment Tool (SWAT)) are discussed that are widely used to simulate N2O emissions from cropping systems. Their ability to simulate N2O emissions is evaluated by describing the model components that are relevant to N2O processes and their representation in the model.

1. Introduction

Agricultural activities are responsible for two-thirds of the total anthropogenic nitrous oxide (N2O) emissions worldwide [1]. Most of the N2O emissions stem from fertilizer and animal manure application [2,3,4,5]. A main reason for N2O emissions from agricultural soils is the application of inorganic fertilizers and/or manure when the crops cannot uptake all of the applied nitrogen (N) due to the growth stage not requiring all of it. This excess N in the soil environment leads to a lower than maximum nitrogen use efficiency [6,7,8]. With agricultural activities intensifying globally, N2O emissions are presently increasing at a rate of 0.25% per year [2]. Between 2001 and 2011, N2O emissions from agricultural soils increased overall, with contributions from Asia (63%), the Americas (20%), Europe (13%) and Africa (3%) [9]. In some parts of the world in recent years, a reduction in N2O emissions can be detected. For example, in Europe in 2016, a decrease in N2O emissions of 37% from 1990 levels was reported, due to both European and country specific policies on agriculture and the environment that reduced the amount of reactive nitrogen being emitted into the environment [10].
The global warming potential (GWP) is the internationally agreed method published by the Intergovernmental Panel on Climate Change (IPCC) to convert greenhouse gases (GHG) into CO2 equivalents. The GWP is defined as the time-integrated radiative forcing due to a pulse emission of a given component, relative to a pulse emission of an equal mass of CO2 [8]. Based on a 100-year GWP level, the GWP of N2O emissions has been 298 times as potent as CO2 as a factor in global warming [8]. N2O emissions are responsible for 6% of annual global GHG emissions in terms of CO2 equivalent [11].
The IPCC also uses a metric known as the emission factor (EF) for N2O, which is calculated as kg N2O-N/kg N input, and can be used to compare N2O emissions under different conditions [12,13,14]. Until 2019, the default method for calculating the EF for direct N2O emissions from managed soils was to use a linear factor equal to 1% of the total N amount applied to the soil. In 2019, the IPCC revised and updated the default EF based on a much larger number of measurements available to estimate N2O emissions from managed soils [13,15]. From its Tier 1 level of methodological complexity, which corresponds to the basic method using data on fertilizer production, import/export, or sales data, the revised emission factors for direct and indirect emissions of N2O are now disaggregated by climate zone as well as by fertilizer type. In wet climates, the default EF has been set at 0.6% of organic N inputs and 1.6% of synthetic N inputs. In dry climates, the default EF has been set at 0.5% of N inputs for both organic and synthetic N [13].
The principal processes causing N2O emissions in the soil are nitrification, nitrifier denitrification, and denitrification [1,16]. These are shown in Figure 1. Nitrification is the microbial oxidation of ammonium (NH4+) to nitrate (NO3), with N2O emitted as a by-product. Nitrifier denitrification is the reduction of nitrite (NO2) to nitrogen monoxide (NO), then to N2O, and finally to dinitrogen (N2). Denitrification is a two-step process whereby NO3 is converted to N2O and then into inert N2 under anaerobic conditions. In the denitrification pathway, NO2, NO and N2O are obligate intermediates.
A number of factors regulate N2O emissions during the nitrification and denitrification processes. Such factors include the soil N concentration, soil moisture, soil temperature, fertilizer application amounts, and land use management [17]. Careful consideration of these impact factors in estimating N2O emissions from agricultural soils is important to avoid overestimating the N emitted (e.g., NOx and N2, which are also produced through nitrification and denitrification processes). On the other hand, N2O emissions can also be underestimated, for example, due to the length of insufficient N2O measurements [18]. The consideration of impact factors in general is important to identify N2O emission hot spots and hot moments in a region and to identity N2O mitigation options.
Several papers have been published that classify and describe the main factors affecting N2O emissions from agricultural sites [16,19,20,21,22,23]. For example, Stehfest and Bouwman [18] estimated global annual N2O emissions from agricultural fields and natural vegetation by considering factors such as soil N concentration, soil organic carbon (SOC) content, soil pH and texture, fertilizer types and length of N2O emissions measurement. Weier et al. [24] analyzed the impacts of soil water content, available C and NO3 concentration on denitrification in North America, as well as the N2/N2O ratio based on laboratory data. These laboratory data were also used by Parton et al. [25] to develop semi-empirical equations for developing an N2O emission model. In another study, Bouwman et al. [20] determined factors affecting N2O emissions and grouped them into environmental, management and measurement categories. These measurement factors are particularly important to contribute to the process of understandingN2O emissions and hence how they are represented in simulation models. Factors related to nitrification and denitrification processes have been reviewed by Cameron et al. [26], Oertel et al. [27], Signor et al. [17] and Ghimire et al. [28], while Saggar et al. [29] reviewed factors impacting denitrification and the N2/N2O ratio.
In this review we go beyond the current reviews; we review and summarize all of the relevant factors leading to N2O emissions, and we describe the impact of these factors on nitrification, denitrification and on N2/N2O partitioning. Furthermore, we identify the role of the impact factors in widely used N2O simulation models and their representation for simulating N2O effectively. Consideration of factors that influence N2O emissions is important for N2O modelling purposes, because ideally, by including as many impact factors in a model as possible, the uncertainties related to the simulation of N2O emissions may be reduced [25].

Methods

For this review, we performed a literature search for relevant peer-reviewed scientific papers using the SCOPUS searchable scientific database. Using the combined terms “N2O” AND “agriculture” to search papers since 1990, we found more than 2000 published papers with the number of papers steadily increasing per year since 2005. In Figure 2, these papers are grouped into three groups: review related, research related, and model related. From these results, the review related papers were selected by using the terms “N2O”, AND “agriculture”, with “factors” and “review” to report on factors that influence N2O emissions (Table S1). Research related papers for the environmental factors were selected by using the terms “N2O”, “nitrification”, “denitrification”, “N2/N2O ratio” and each impact factor respectively (e.g., “soil N”, “SOC”, “soil temperature”). Research related papers for the management and measurement factors were searched by using the terms “N2O”, “agriculture”, “factors” and each factor respectively (e.g., “N fertilizer”, “tillage”). We obtained the model related papers relevant to the simulation of nitrification and denitrification from the above researched papers. Finally, the specific model related papers were searched with the terms “N2O”, “agriculture”, and the respective models “DAYCENT”, “DNDC” or “SWAT”. These three models were chosen because they are process-based models that dynamically respond to the impact factors we researched, they are widely used, and lastly are well documented in peer-reviewed literature.
This literature review firstly summarizes the empirical factors that influence N2O emissions from agricultural soils (Table S1). These factors are divided into three categories, as in Bouwman et al. [20]: environmental factors, management factors, and measurement factors. Measurement factors are not presented in the same depth as the environmental factors and management factors, because they do not directly influence N2O emissions, but are useful to compare to the model performance. We explain how each impact factor affects N2O emissions from the soil and also summarize their interactions. Secondly, the review describes three process-based simulation models that calculate N2O emissions and that are widely used for modelling agricultural systems. The process-based models include DAYCENT (Daily Century) [30], DNDC (DeNitrification-DeComposition) [31] and SWAT (Soil and Water Assessment Tool) [32]. We describe the most relevant formulas in the models for calculating N2O emissions. Each model contains process descriptions that consider different impact factors to describe N2O emissions from agricultural soils. We describe the factors in each model and how they are represented in the respective model.

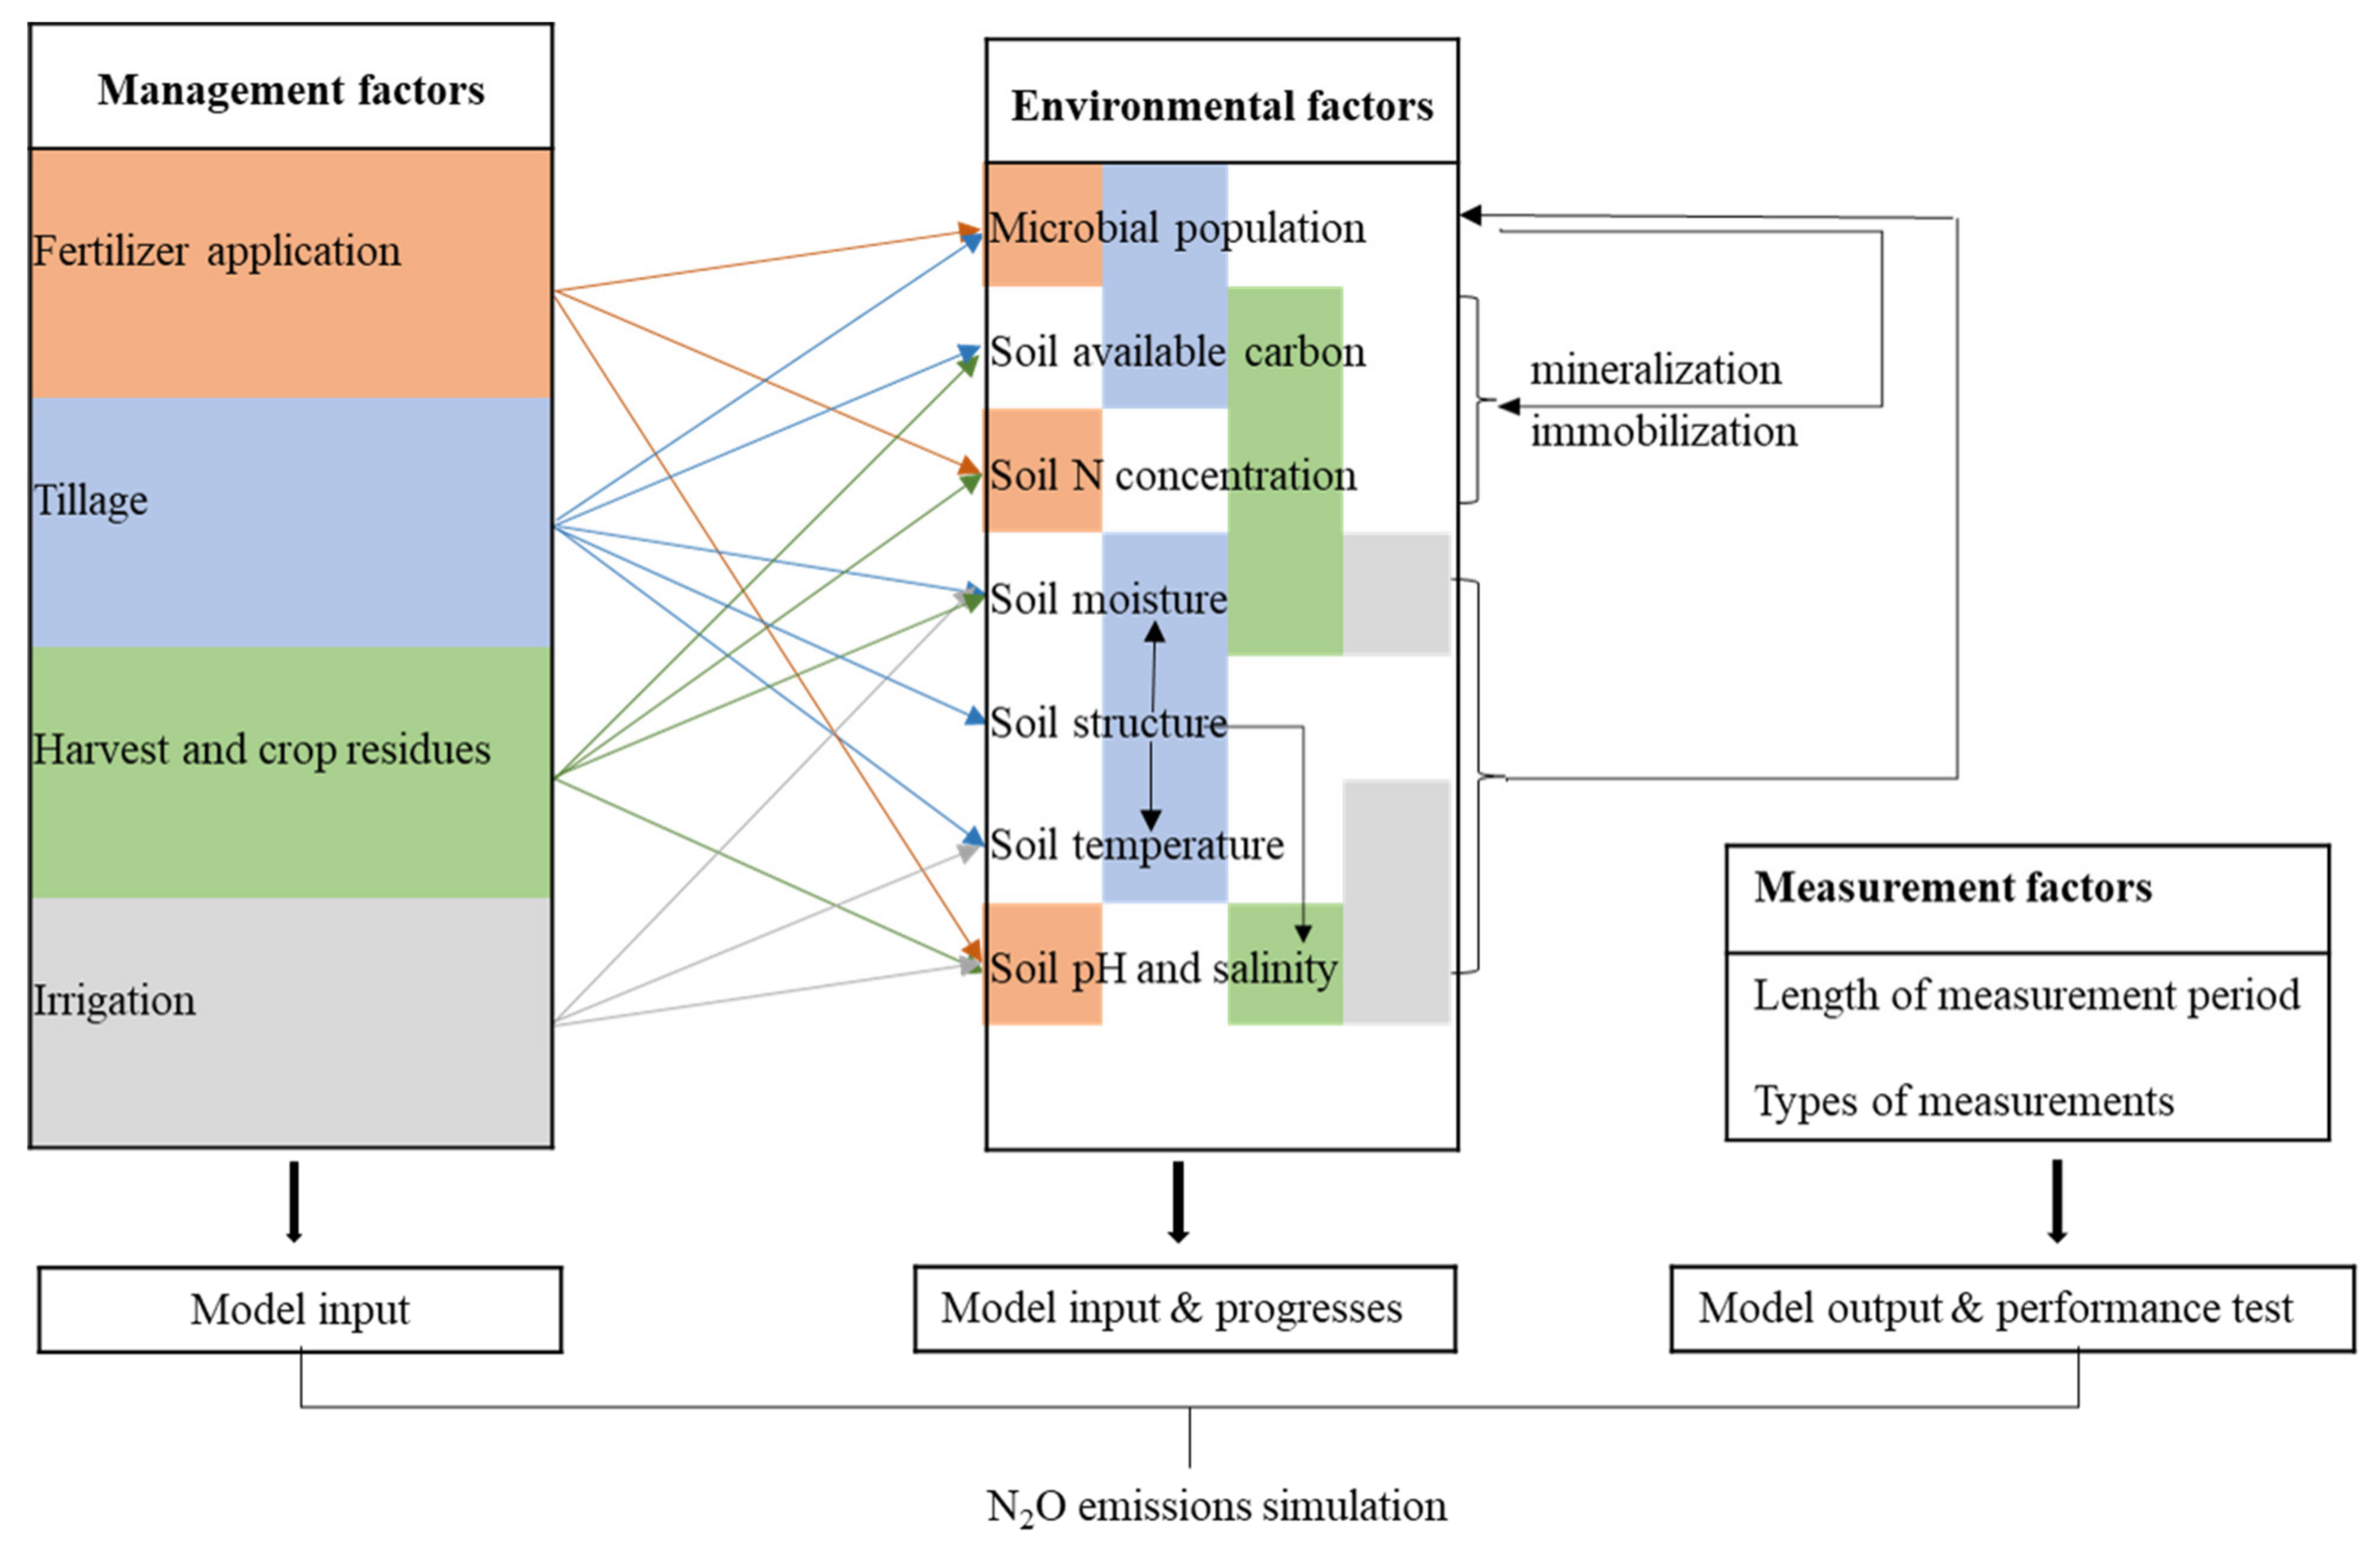
2. Factors That Influence Nitrous Oxide Emissions

The subcategories environmental factors, management factors and measurement factors are listed in Table 1. Due to the spatial and temporal heterogeneity of the environment and the agricultural management practices reported, the threshold values at which nitrification and denitrification occur across various catchment characteristics are rather different [12,29,33] and these are not reported in detail in this review. In the following sections, we provide a comprehensive explanation of how each impact factor affects N2O emissions from agricultural soils and we extract generalized relationships between each factor and N2O emissions.

2.1. Environmental Factors

Soil microbial populations that are responsible for nitrification and denitrification processes leading to N2O emission require specific environmental conditions. These conditions have been measured to directly influence the activities of certain microbes and lead to instantaneous changes in the rates of nitrification and denitrification and in the N2/N2O ratio [29]. The environmental factors that impact N2O emissions by influencing nitrification, denitrification and the N2/N2O ratio are described in this section.

2.1.1. Microbial Populations

Soil microorganisms are responsible for nitrification and denitrification processes [34,35]. Nitrification is primarily carried out by autotrophic bacteria (e.g., Nitrosomonas and Nitrobacter) [30]. Denitrification is carried out by microorganisms that include phototrophs, lithotrophs, and organotrophs that derive energy from light, inorganic N, and organic C, respectively. The dominant de-nitrifiers in soils are organotrophs, and species of Pseudomonas, which predominate in the group, presumably because of their versatility and ability to compete for C substrates. Most of the other de-nitrifiers in soils are species of Alcaligenes, which are closely related to Pseudomonas [16,36].
Soil microorganisms can also influence N2O emissions by affecting the N product ratio (e.g., N2/N2O) of denitrification [34,35]. Chen et al. [37] isolated Pseudomonas denitrificans G1, which could remove 90%–98% of NO3 and 97%–99% of NO2 in 24 h under anaerobic conditions, in which Pseudomonas denitrificans G1 grew relatively slowly compared to under aerobic conditions, but could achieve effective denitrification so that the final product was N2.
Environmental impact factors also affect the distribution of soil microbes and microbial activity. For example, the suitable conditions for the denitrification of Pseudomonas denitrificans G1 to occur are a C/N ratio of 5–22, a dissolved oxygen of 0–4.68 mg/L, a salinity of 0–30 g NaCl/L, and a pH 7–9.5 [37].

2.1.2. Soil Available Carbon

The availability of soil C generally provides an energy source for soil microorganisms [17,38] and hence increases microbial activity. Nitrifiers and denitrifiers require a readily available C source for the oxidation of ammonium (NH4+) and the reduction of NO3. The capacity for soil nitrification and denitrification to take place increases with increasing SOC content, especially the water-soluble C content, because this is the source most readily available for microbes and leads to an increased microbial activity [22,39,40]. Chen et al. [41] investigated the influence of soil C on the N2O emissions from a paddy field in southern China and found the mass fraction of N2O in the total N gas emissions were 35% and 50% with 28 mg kg−1 and 300 mg kg−1 of soil organic C, respectively.
The amount of organic C as a substrate for bacteria will determine whether de-nitrifiers produce mostly N2 or N2O [42]. Weier et al. [24] analyzed the impacts of available carbon on the N2/N2O ratio emitted in a sand and silt loam soil in California with different treatment of glucose-C (0, 0.5, and 1.0 mg glucose-C g−1 soil). The largest N2/N2O ratio (up to 549) was found at the highest treatment of glucose-C (1.0 mg glucose-C g−1 soil). The findings indicate that SOC could increase microbial activity and the consumption of N2O, and other studies contain similar findings [43,44]. However, Saggar et al. [29] found, the impact of SOC on the N2/N2O ratio varies with soil N, which is supported by Köster et al. [45], who investigated N2 and N2O emissions from soil with different C/N ratio. The low N2O emissions could be attributed to the promoting effect of SOC input on N2O reduction when soil N is low.
Research with biochar suggest its suppression of N2O emissions from soil depends on the biochar-induced soil C/N ratio, and potentially low subsequent soil N availability. Biochar is a carbon-rich material with a high C/N ratio that is applied in some farming systems as a soil amendment. Due to biochar’s high sorption capacity and elevated recalcitrance to biodegradation, it can be used to sequester carbon [46]. Feng et al. [47] studied the impact of biochar on N2O emissions from maize fields in China and found the N2O emissions decreased with increasing biochar application rates. Cumulative N2O emissions from soils with additions of 0.5%, 1%, and 2% biochar were measured to be 120.9 g N/ha, 61.7 g N/ha and 47.6 g N/ha, respectively.

2.1.3. Soil N Concentration

All forms of N input into agricultural soils, such as inorganic N fertilizer, and organic N sources in the form of manures, slurry, legumes or post-harvest crop residues, represent a potential contribution to N substrates for N2O emissions [16,48,49]. During nitrification, NH4+ is oxidized to NO3. Thereafter the NO3 is reduced to N2O by denitrifying bacteria. The nitrate molecule is the primary requirement for denitrification to take place. Soil NO3 concentration is dynamic and at any given time depends on net mineralization and nitrification rates, the plant N uptake, the microbial immobilization rate and the NO3 movement through the soil by leaching and lateral flow [26]. In the literature, it is agreed that the relationship between N input and nitrification is positive. However, the proportion of N2O emissions as nitrified N varies according to the soil type and climate [50].
Several studies show that high soil NO3 concentrations inhibit the reduction of N2O to N2 [42,51,52]. In sand and silt loam soils in California, Weier et al. [24] performed experiments to analyze the N2/N2O ratio as affected by different soil NO3 concentrations (0, 139, and 277 ug KNO3-N g−1 soil), and found the highest soil NO3 concentration (277 ug KNO3-N g−1 soil) inhibited N2O reductase activity, which reduced the conversion of N2O to N2 and resulted in a low N2/N2O ratio.

2.1.4. Soil Moisture

Almost all studies have reported increased N2O emissions after the application of N fertilizer, especially with high soil moisture. Furthermore, N2O is generally emitted most rapidly when the soil has >60% water-filled-pore space (WFPS) [53,54,55,56]. The equations for calculating the WFPS are provided in the Supplementary Section (Equations (S3) and (S4)). When WFPS is greater than 60%, the soil pore water displaces the amount of available O2 in the soil pores, and therefore leads to anaerobic soil moisture conditions, which are conductive to the production of N2O. Under such conditions, the soil NO3 is reduced by facultative anaerobic bacteria (e.g., Pseudomonas citronellolis) to NO2, N2O and then N2 [7,22,27,48]. However, the optimum WFPS for nitrification and denitrification processes to occur varies with soil texture [24,25].
Bateman et al. [53] studied N2O production during denitrification, autotrophic nitrification and heterotrophic nitrification in a fertilized (200 kg N ha−1) silt loam soil in England with the WFPS ranging from 20%–70%. They found that at 70% WFPS all of the N2O emitted was through denitrification, but at 35%–60% WFPS nitrification was the main process producing N2O. Ruser et al. [56] analyzed the impact of different soil moisture levels between 40% and 98% WFPS on N2O emissions from a fine-loamy soil in Germany. They found N2O emissions by denitrification increased when soil moisture rose above 60–70% WFPS.
The proportion of N2 gas (N2/N2O ratio) during denitrification, however, is higher when the soil moisture is greater than 90%, because N2O is consumed under anaerobic conditions [55,56,57]. Ciarlo et al. [54] analyzed the influence of different soil moisture contents on the ratio of N2/N2O, which was emitted from a grassland in Argentina. The N2O/(N2O+N2) ratio was low (0–0.051) under 120% WFPS (with 100% WFPS plus a 2-cm surface water layer) and increased with decreasing soil moisture, but was still above 60% WFPS. The greatest N2O emissions occurred at 80% WFPS treatment. Friedl et al. [55] investigated the influence of different soil moisture contents on N2 and N2O emissions from a subtropical dairy pasture in Australia. N2 emissions exceeded N2O emissions by a factor of 8 when the soil was at 80% WFPS and by a factor of 17 at 100% WFPS.
It is not surprising that N2O emissions are higher in wet environments, e.g., during seasons with higher precipitation and higher soil water contents. For example, Choudhary et al. [58] confirmed this in a study on permanent pastureland on silty clay loam soil in New Zealand during dry and wet seasons. In another study on grain sorghum and sunflower in sub-tropical Australia, Schwenke et al. [59] measured the rate of N2O loss to be five times greater during the wet season compared to the dry season. During the drier season, the ratio of N2/N2O was 43%, whereas the ratio declined from 29% to 12% with increased N fertilizer rate during the wetter season.
The N2O emission factors are considered separately for dry and wet climates. In 2019, the IPCC revised the N2O EF so that in wet climates the default EF has been set at 0.6% of organic N inputs and 1.6% of synthetic N inputs. In dry climates, the default EF has been set at 0.5% of N for both organic and synthetic N applications [13].

2.1.5. Soil Texture

Finer textured soils can emit higher amounts of N2O than sandy soils [60]. They have more capillary pores within aggregates than sandy soils, thereby holding soil water more tightly [24,25]. As a result, anaerobic conditions may be potentially more easily reached and maintained for longer periods within aggregates in finer textured soils than in sandy soils [18,20]. Weier et al. [24] and Parton et al. [25] found that denitrification generally increased as soil texture became finer and as the WFPS increased. When the WFPS decreases, the denitrification rate decreases most rapidly in the fine-textured soils, followed by medium- and coarse- textured soils. The best fit curve (WFPS/N2O emissions) for clay soils increases very rapidly as WFPS increases over 40% and reaches the highest emission value for WFPS greater than 70% [25].
Soil texture mainly affects N2O emissions by determining how likely it is for aerobic or anaerobic conditions in the soil to prevail [21,60,61]. Soil texture also affects N2O emissions due to differences in SOC, N availability, and microbial population [62].
Site exposure (e.g., elevation, morphological position, plant cover) can also influence soil temperature and moisture. N2O emissions are higher in depressions than on sloped land and ridges, due to the increased soil moisture content mostly found in low-lying lands. Yet lower air pressure found at higher elevation facilitates N2O emissions due to a reduced counter pressure on the soil [27,48,63].

2.1.6. Soil Temperature

Soil temperature affects N2O emissions by directly influencing the kinetic reaction and the growth of microbial communities (e.g., Pseudomonas) [7,16,19,60]. Moreover, soil temperature controls biological oxygen consumption by altering the growth of microbial communities, which leads to a depletion of soil oxygen concentrations and an increase of anaerobic status in soil [39,64].
In most studies, nitrification rates increase with rising temperature and the general peaks are around 20 to 35 °C [25,30], even though Lai et al. [65] reported that the temperature peaks for nitrification were between 35 and 40 °C and Prentice [66] reported the optimum temperature for nitrification to be 38 °C. Lai et al. [65] found that soil temperature variations have less impact on the proportion of N2O emissions from nitrified N, when compared to the impact of variations in soil type [65].
Overall, studies show that nitrification and denitrification processes are similar with respect to temperature dependency and increase with increasing soil temperature, although Saggar et al. [29] found no relationship between denitrification rate and soil temperature. Peak denitrification occurs between 40 and 60 °C [22,65,67]. It is worth noting that the temperature for peak nitrification and denitrification to occur may vary somewhat by climatic region [67].
Soil temperature also influences N2O emissions by affecting the ratio of N2/N2O [16,22,68,69]. Maag et al. [70] found that N2/N2O increased exponentially with increasing temperature, which implies a linear relationship between the log (N2/N2O) and temperature. Lai and Denton [67] analyzed N2O and N2 emissions from a dairy farm in southwest Australia with different temperature levels (25 °C, 35 °C, 45 °C). The highest rate of N2O emissions occurred at 35 °C. A decrease in N2O emissions above 35 °C was partially attributed to an increase in N2O reduction and N2 production. Increased N2 production at 45 °C decreased the N2O/N2 ratio by 33% to 85%. The literature strongly agrees that the reduction of N2O to N2 increases with increasing soil temperature.
Soil temperature also influences freeze-thaw cycles, which increase the availability and accessibility of the N in the soil and also create anaerobic conditions, and thus impact on the release of N2O and N2 [29,71]. In some regions (e.g., in mid to higher latitudes and at higher elevations of the world), the topsoil is routinely frozen for parts of the winter and these soils can also be subject to successive freeze-thaw cycles. It has been determined that a substantial part of the total annual N2O emissions may occur within a brief period after thawing [59]. The principal cause is the development of conditions that stimulate anaerobic microbial activity, in particular the release of labile C and N compounds from dead microbial biomass, when soil-water content is high [49].

2.1.7. Soil pH and Salinity

Several studies show contradictory results when describing the impacts of soil pH on nitrification and denitrification. Clough et al. [72] examined the effect of raising the soil pH (through liming the soil) on N2O emissions from a silt loam. They found that autotrophic nitrification is limited at soil Ph < 4.5. Liming of acid soils can stimulate nitrification and has been shown to influence both the nitrification rate and the N2O flux. Denitrification rates decrease with decreasing soil pH. Scholefield et al. [52] developed a “flow-over” helium atmosphere core incubation technique to investigate mechanisms of denitrification in agricultural soils. They found that denitrification decreased with increasing soil pH within the range 5.1–9.4. In a review of the past 50 years of studying the impact of soil pH on denitrification, Šimek and Cooper [73] stated that it is not possible to generalize the relationship between pH and denitrification in soils.
The soil pH also affects the emission ratio of N2/N2O. It is well agreed that soil pH influences N2O emissions by affecting the activity of nitrifying and denitrifying bacteria in the soil [22,27,60]. The soil pH determines if NO2 and NO3 chemically decompose into N2O or into N2. Under acidic conditions N2O is emitted by denitrifier bacteria, such as Pseudomonas [42]. Therefore, a greater proportion of N2O relative to N2 is emitted from acidic soils (pH < 6.0), whereas approximately equivalent amounts of N2O and N2 are emitted from soils with pH 6.0 [74]. This is confirmed by Šimek et al. [75], who found that at a pH < 6.0, the only denitrification product was N2O, but at higher pH values, N2 was the principal product of denitrification. They examined five mineral soils with a similar texture but with differing pHs in Czech Republic. In soils in which the pH was 8.3–8.5, the N2O/N2 mole fraction was found to be about 0.024 from grey clay soils with irrigated cotton in Australia [74].
Soil salinity influences the production and consumption of N2O [76]. Wei et al. [77] conducted an experiment on a silty clay soils used to grow vegetables in China, and analyzed the impacts of different salinity levels (2, 5, 8 g/L) (NaCl and CaCl2 of 1, 2.5, and 4 g/L equivalent) and fertilizer levels on N2O emissions. Compared to fresh water irrigated soil, cumulative N2O fluxes were reduced by 22.7% and 39.6% (0 kg N fertilizer), and 29.1% and 39.2% (120 kg N fertilizer) for soils irrigated with 2 and 8 g/L saline water, respectively. For soils irrigated with 5 g/L saline water, cumulative N2O fluxes were increased by 87.7% (0 kg N fertilizer) and 58.3% (120 kg N fertilizer). These results suggest that desalinating brackish water to a low salinity level (e.g., 2 g/L) before it is used for irrigation, might be helpful for mitigating soil N2O emissions.
Based on the above literature, we extracted generalized relationships between each environmental factor and N2O emissions in Table 2.

2.2. Management Factors

The type of field management plays an important role in influencing N2O emissions, especially as it determines the soil N input and thereby potentially changes the soil environmental and subsequent microbial conditions. Management factors include, for example, the amounts and the types of fertilizer application, the crops planted, and tillage operations undertaken, which also affect how much crop residues are left on the surface. This section provides a detailed description of how selected agricultural management operations influence N2O emissions.

2.2.1. Fertilizer Application

The influence of fertilizer on N2O emissions is related to the fertilizer type, the amount and the timing of application [59,78,79,80]. Nitrogen fertilizer types include synthetic (mineral) fertilizers (e.g., urea, ammonium nitrate, ammonium sulfate and NPK compound fertilizers, including slow-release fertilizers), solid organic fertilizer (e.g., organic manure, composted municipal soil waste, composted animal manure, and residues of crops), and liquid organic fertilizer (e.g., raw and digested pig slurries).
In the IPCC Refinement to the N2O Guidelines, the aggregated N2O EF is set at 1% of the amount of N applied to soils [13]. In the literature, several EF values have been measured [81] and Table 3 shows the breadth of N2O EF values reported for selected crops grown in various countries and on differing soils.
The fertilizers influence the mass of N2O emissions mainly because of the different amounts of NH4+, NO3 and organic C contained in them. Grave et al. [129] conducted experiments to determine the effects of the N sources on soil N2O emissions from a maize-wheat rotation field in Brazil. Compared to the control experiment, cumulative N2O emissions from urea and slurry in tilled soil increased by 33% and 46%, respectively. The EFs of N2O calculated with the application of urea and slurry were 0.27% and 0.76%. Chen et al. [130] studied the impact of 13 years of nitrogen fertilization on N2O emissions from temperate grassland in northeast China, and found that the soil temperature, soil water contents, SOC and soil NH4+ were greatly changed during the growing season, when a significant cumulative effect of fertilizer N addition on N2O emissions was measured.
The amounts of fertilizer applied add a source of N to the soil, which contributes to N2O emissions. Bordoloi et al. [131] analyzed N2O emissions from an Indian wheat cropping system under different levels of urea (from 0 to 100 kg N ha−1). Fertilized plots had higher N2O emissions than unfertilized plots by an average of up to 174% measured in the highest fertilized treatment with 100 kg N/ha, and in which the N2O EF was 3.15%. Lebender et al. [88] conducted an experiment to analyze the impact of fertilizer application rates on N2O emissions from winter wheat in north-west Germany. Nitrogen was applied as calcium-ammonium-nitrate, with application rates ranging between 0 and 400 kg N ha−1. Over a one-year period, yield-scaled N2O emissions from the 400 kg N ha−1 treatment were twice as high as from the 220 kg N ha−1 treatment. The N2O EFs ranged between 0.46% and 0.53%.
The time of fertilizer application influences the efficiency of fertilizer use and crop yields. Schwenke et al. [132] investigated the impacts of the timing of N fertilizer application on N2O emissions from grain sorghum field in Australia. Compared to urea applied at sowing, delayed application of urea at booting reduced the N2O emissions by 67%–81%. However, crop N uptake, grain yield and protein content tended to be lower due to dry soil conditions during the mid-season. Applying split-N (33% sowing; 67% booting) using urea reduced N2O emissions by 59% compared to urea applied at the time of sowing, but maintained crop N uptake, grain yield and protein content. When mineral fertilizer or manure are applied before or at sowing, N2O emissions can increase because of the large pool of soil N in the early crop growth stages that cannot be assimilated by the crop, and furthermore N2O can be enhanced because of potential rainfall events, which increase the soil moisture [132].

2.2.2. Tillage Systems

Soil tillage results in changes in the soil structure, soil aeration, microbial activity, rate of residue decomposition and loss of soil organic matter from the system, as well as soil temperature and moisture [127,133]. It was also found that the presence or absence of tillage, the tillage period and tillage implements had an influence on N2O emissions [131,134].
Grave et al. [129] studied the effects of tillage practices on N2O emissions from a maize-wheat rotation field in Brazil. Cumulative N2O emissions were 107% higher when N was applied on the no-till soil in comparison with the tilled soil. Higher N2O emissions were measured from no-till soil in response to increased WFPS (>60%) and higher N availability (C/N around 1.58) compared with tilled soil [133]. Grass is a perennial monocotyledon plant that has a longer growing season and denser rooting system than annual crops. As such, N applied to grassland is rapidly (within a few days or weeks) taken up by the grass or immobilized in the rooting system [20,60]. Due to the absence of soil tillage in grasslands (soil aeration status), in combination with high C input by grass roots and residues and manure, the organic C content of grasslands is higher than in arable cropping systems [135].
From a vegetable field in the USA, Chen et al. [37] measured the impacts of strip till, no-till, tillage with black plastic mulch and bare-ground on N2O emissions, whereby the yield-scaled N2O emissions were 4.21%, 3.18%, 10.17%, 5.57%, respectively. Tillage with black plastic mulch promoted N mineralization, and the plastic mulch was found to increase the soil temperature, which contributed to greater N2O fluxes.
Choudhary et al. [58] evaluated the effects of continuous long-term tillage on N2O emissions from maize fields in New Zealand. Average annual N2O emissions from the 34-year and 17-year fields were 2.37 and 3.42 kg N2O ha−1, respectively. In the 34-year plots, due to continuous intensive cropping, low surface residue cover and a decreased water holding capacity, the depleted total C and N content were found to be low, which may have limited the denitrification process.

2.2.3. Harvest and Crop Residues

Applying crop residues to the soil generally increases N2O production mainly because the increased available organic C can be used in the N mineralization processes [108,136,137]. In addition, crop residues decomposition requires aerobic conditions, following which the drawdown of soil oxygen activates denitrification [44]. Badagliacca et al. [138] investigated the addition of wheat and fava bean residues on N2O emissions from two soils. In the clay soil with low-soil organic C (2.4%) and high pH (8.1), N2O emissions from fava bean residue-added pots were 0.81 kg ha−1 and from pots added with wheat were 0.67 kg ha−1. In the sandy-loam soil with high organic C (4.3%) and low pH (6.6), N2O emissions in the pots added with wheat residue were 15.98 kg ha−1 and that of the pots added with fava bean was 12.7 kg N2O ha−1.
Different crop harvesting frequencies and intensities influence the proportions of dead material that are left on the surface of the soil, which affect C and N cycling due to the biochemical composition (e.g., N concentration in plant tissues) and subsequently influence the soil microbial population and diversity [16]. Liu et al. [139] analyzed the impact of harvesting reeds on the N2O emissions from alkaline wetlands in northeast China. The annual average N2O flux on plots without harvesting was two times higher than that of the harvested plots, because the harvesting of reeds decreased the total organic C and total N. Da Silva et al. [140] studied how grazing intensity (light, moderate and heavy, i.e., 35 cm, 25 cm, and 15 cm height of grass, respectively) affects N2O emissions in grasslands in Brazil. Grazing intensity had a negative linear effect on annual cumulative N2O emissions.

2.2.4. Irrigation

Irrigation can include rain fed systems, high-watered systems (furrow, sprinkler and micro-sprinkler irrigation), and low-watered systems (surface and subsurface drip irrigation techniques). Irrigation influences the denitrification process by changing soil moisture and temperature, providing anaerobic conditions, and altering soil salinity [141,142,143]. An increase in WFPS may lead to reduced soil aeration resulting in low oxygen concentrations and anaerobic conditions, which support denitrification. An increased soil microbial activity may also lead to a decrease in the soil oxygen concentration [59,143]. The altered environmental factors could collectively affect dissolution/crystallization, oxidation/reduction, adsorption/desorption and other reactions that will finally change the production and consumption of N2O in the soil [19].
Sanchez-Martin et al. [144] carried out a field experiment to compare the difference between different irrigation systems on N2O emissions. They found that drip irrigation reduced total N2O emissions with respect to values for furrow irrigation. Tang et al. [145] studied the effects of irrigation regime on N2O emissions from a saline alkaline paddy field in northeast China. Continuous flooding irrigation kept the water depth on the soil at 3 to 5 cm. The main difference in N2O emissions was during the mature stage, in which continuous flooding emitted twice as much N2O compared to intermittent flooding. Ye et al. [146] analyzed the impact of irrigation methods on N2O emissions from vegetable soils in China. Compared to conventional furrow irrigation, N2O emissions from mulched drip irrigation and drip filtration irrigation decreased by 16.4% and 60.9%, respectively.

2.3. Measurement Factors

The measurement factors do not directly influence N2O emissions (although disturbance of natural conditions may occur when taking a sample, e.g., with chambers). However, the measurements are important factors to report because they affect the accuracy of the measured N2O amount and are useful for reporting on the uncertainties of the N2O measurements. The N2O measurements are a link to our understanding of what happens in the soil and what can be modelled. The measurements therefore also influence various modelling stages (e.g., model development, parameter optimization and model validation). The effect of insufficient N2O sample measurements from the soil either spatially or temporally can lead to an overestimation or to an underestimation of N2O emissions [18,147]. The main factors that contribute to measurement uncertainties are the methods applied for measuring N2O emissions and the temporal and spatial scales of measurement [148,149,150,151].

2.3.1. Length of Measurement Period

Establishing a regionally-specific EF usually requires the measurement of a whole year of N2O emissions [20]. Shang et al. [147] reviewed 21 studies including N2O emissions measured both during the whole-year and during the growing-season. For most crop types, the whole year EF was significantly greater than the growing season EF. Vegetables showed the largest EF difference (0.19%) among all crops (0.07%), followed by paddy rice (0.11%). Neglecting to account for emissions from the non-growing season may underestimate the N2O emission factor by 30% for paddy fields, and almost three times that for non-vegetable upland crops.
Obtaining too few samples was highlighted in a study by Smith [142], who reviewed the relationship between the period length (days) of N2O being sampled to estimate N2O emissions from agricultural land, and found N2O emissions (% of N fertilizer applied) during three different lengths of measurement periods (>30, >100, >200 days) to be 0.6, 1.1 and 1.6, respectively.

2.3.2. Types of Measurement

Many methods are used to measure N2O emissions in terrestrial and aquatic environments, for example chamber methods, static core methods and micrometeorological techniques [148]. Chambers are widely used to study N2O fluxes spatially at different scales (e.g., landscape). The static core method is used locally to estimate potential N2O emissions from managed soils to capture nitrification and denitrification processes. Micrometeorological techniques are the preferred methods for measuring N2O fluxes on a landscape (field) scale [149,150].
However, because of the high spatial and temporal variability of N2O emissions, each measuring method has advantages and disadvantages, even at small landscape units [22]. Chamber methods represent the most accessible techniques for measuring N2O fluxes when chambers are placed on the soil surface for short periods. Nitric oxide and N2O fluxes can be measured using open- and closed- chamber techniques [150]. The flow rate of air through the open chamber can be too high to measure differences directly between the N2O concentrations in the air streams entering and leaving the chamber, and sometimes the closed chamber is only suitable for short height crops. Micrometeorological methods have to some extent been used to measure N2O emissions from the soil, and have the advantage over chambers in terms of their spatial and temporal integration [22]. Schäfer et al. [151] reported higher N2O emissions measured by closed chambers than by micrometeorological field-scale methods. In addition, when N2O emissions are measured at the hourly time step and at small spatial scale and then upscaled to the daily time step and the field scale, N2O fluxes may be overestimated [119,151].
The uncertainties of measured N2O emissions are also high [151,152]. Schäfer et al. [151] reported the impacts of daily meteorological conditions on N2O measurement and concluded that all measurements should run from about sunset throughout the night when the atmosphere is usually more stable. Venterea [152] reported the differences of measured N2O emissions from three chambers in the same field ranging from 0.05 to 0.5 mg N m−3. These three chambers have slightly different soil bulk density, water content, temperature and pH.
For further information on a review of the strengths and weaknesses of the N2O measurement methods, the reader is referred to Groffman et al. [148,153].

2.4. Summary of Factors

In this section, the factors’ interactions within and between each group are depicted, to show how the three groups are connected, which is important when modelling N2O emissions. Figure 3 shows the factors’ interactions within and between each group. Crops determine the amounts of N fertilizer application, irrigation, harvest frequencies and intensities, and the amounts of crop residues. Fertilizer application influences soil microbial population, soil N concentration and soil pH. Tillage systems influence kinds of soil microbial population, soil carbon, soil moisture, soil structure, and soil temperature. Harvest and crop residues influence soil C, soil N, soil moisture and soil pH. Irrigation controls soil moisture and anaerobic conditions. Microbial population, which is affected by soil moisture, soil structure, soil pH and soil temperature, influences the soil C:N ratio by mineralization and immobilization. Soil structure influences soil moisture, soil temperature and soil pH.
Management factors can be considered as an input in terms of management practices into N2O simulation models. Environment factors are considered in a model either as model inputs (e.g., precipitation, air temperature, and soil properties), or as model internal processes (soil C, soil N, soil pH, and soil temperature in model time step). Data from the measurement factors are extremely useful to test the model performance.
Process-based models used to estimate N2O emissions may include a single factor or several of the above described impact factors to simulate N2O emissions, all depending on the model’s complexity and level of detail in the process-representation. Careful consideration of several important factors relevant to the research question at hand when estimating N2O emissions can avoid overestimation or underestimation of N2O amounts.

3. Current Process-Based Simulation Models

A number of mathematical models have been developed to simulate nitrification and denitrification (Table 4) [154,155,156,157,158,159,160,161,162,163,164,165,166,167]. These models represent N2O emission processes to varying degrees, and each model has focused on one or several of the N2O impact factors outlined above, albeit to a different extent.
Empirical models are not considered in this review because they can be challenging to apply outside of known conditions and thus have limited utility to test management practices or to predict the effects of future processes, such as climate change [154,156,165]. Therefore, the uncertainty of applying empirical models to conditions other than those used for their development is very high [154,156].
Process-based modelling tools have the ability to simulate environmental conditions (e.g., soil moisture and temperature), crop growth and N fluxes under different management practices at the daily time step and at different scales (e.g., field, landscape or catchment) and once the required parameters are satisfactorily calibrated and validated they are helpful in identifying emission hot-spots and hot-moments, and are also useful in assessing the effectiveness of different management options for evaluating the impacts of climate and land use changes [141,168,169,170,171]. Compared to other process-based models in Table 4, the biogeochemical models (e.g., DAYCENT and DNDC) and the eco-hydrological model SWAT are among the most widely used models to simulate N2O emissions from agricultural systems and are well documented [30,31,32,172]. The SWAT model also includes the EPIC submodule, which simulates crop growth and N transport from the field [32,173]. Table 5 summarizes these three models in simulating N2O emissions from managed soils, specifically in terms of the input data required for the model, the model components, processes and the impact factors that are considered in each model [25,30,168,173]. For the SWAT model, we also include the current SWAT N2O submodules, which are reviewed in Ghimire et al. [28].
We programmed the main equations responsible for N2O emissions in the models DAYCENT, DNDC and SWAT using “R” programming language to plot and visualize the differences of the representation of each environmental factor on N2O. The results for each model are discussed below and presented in Figure 4, Figure 5 and Figure 6. The link to related R codes refers to Supplementary materials.

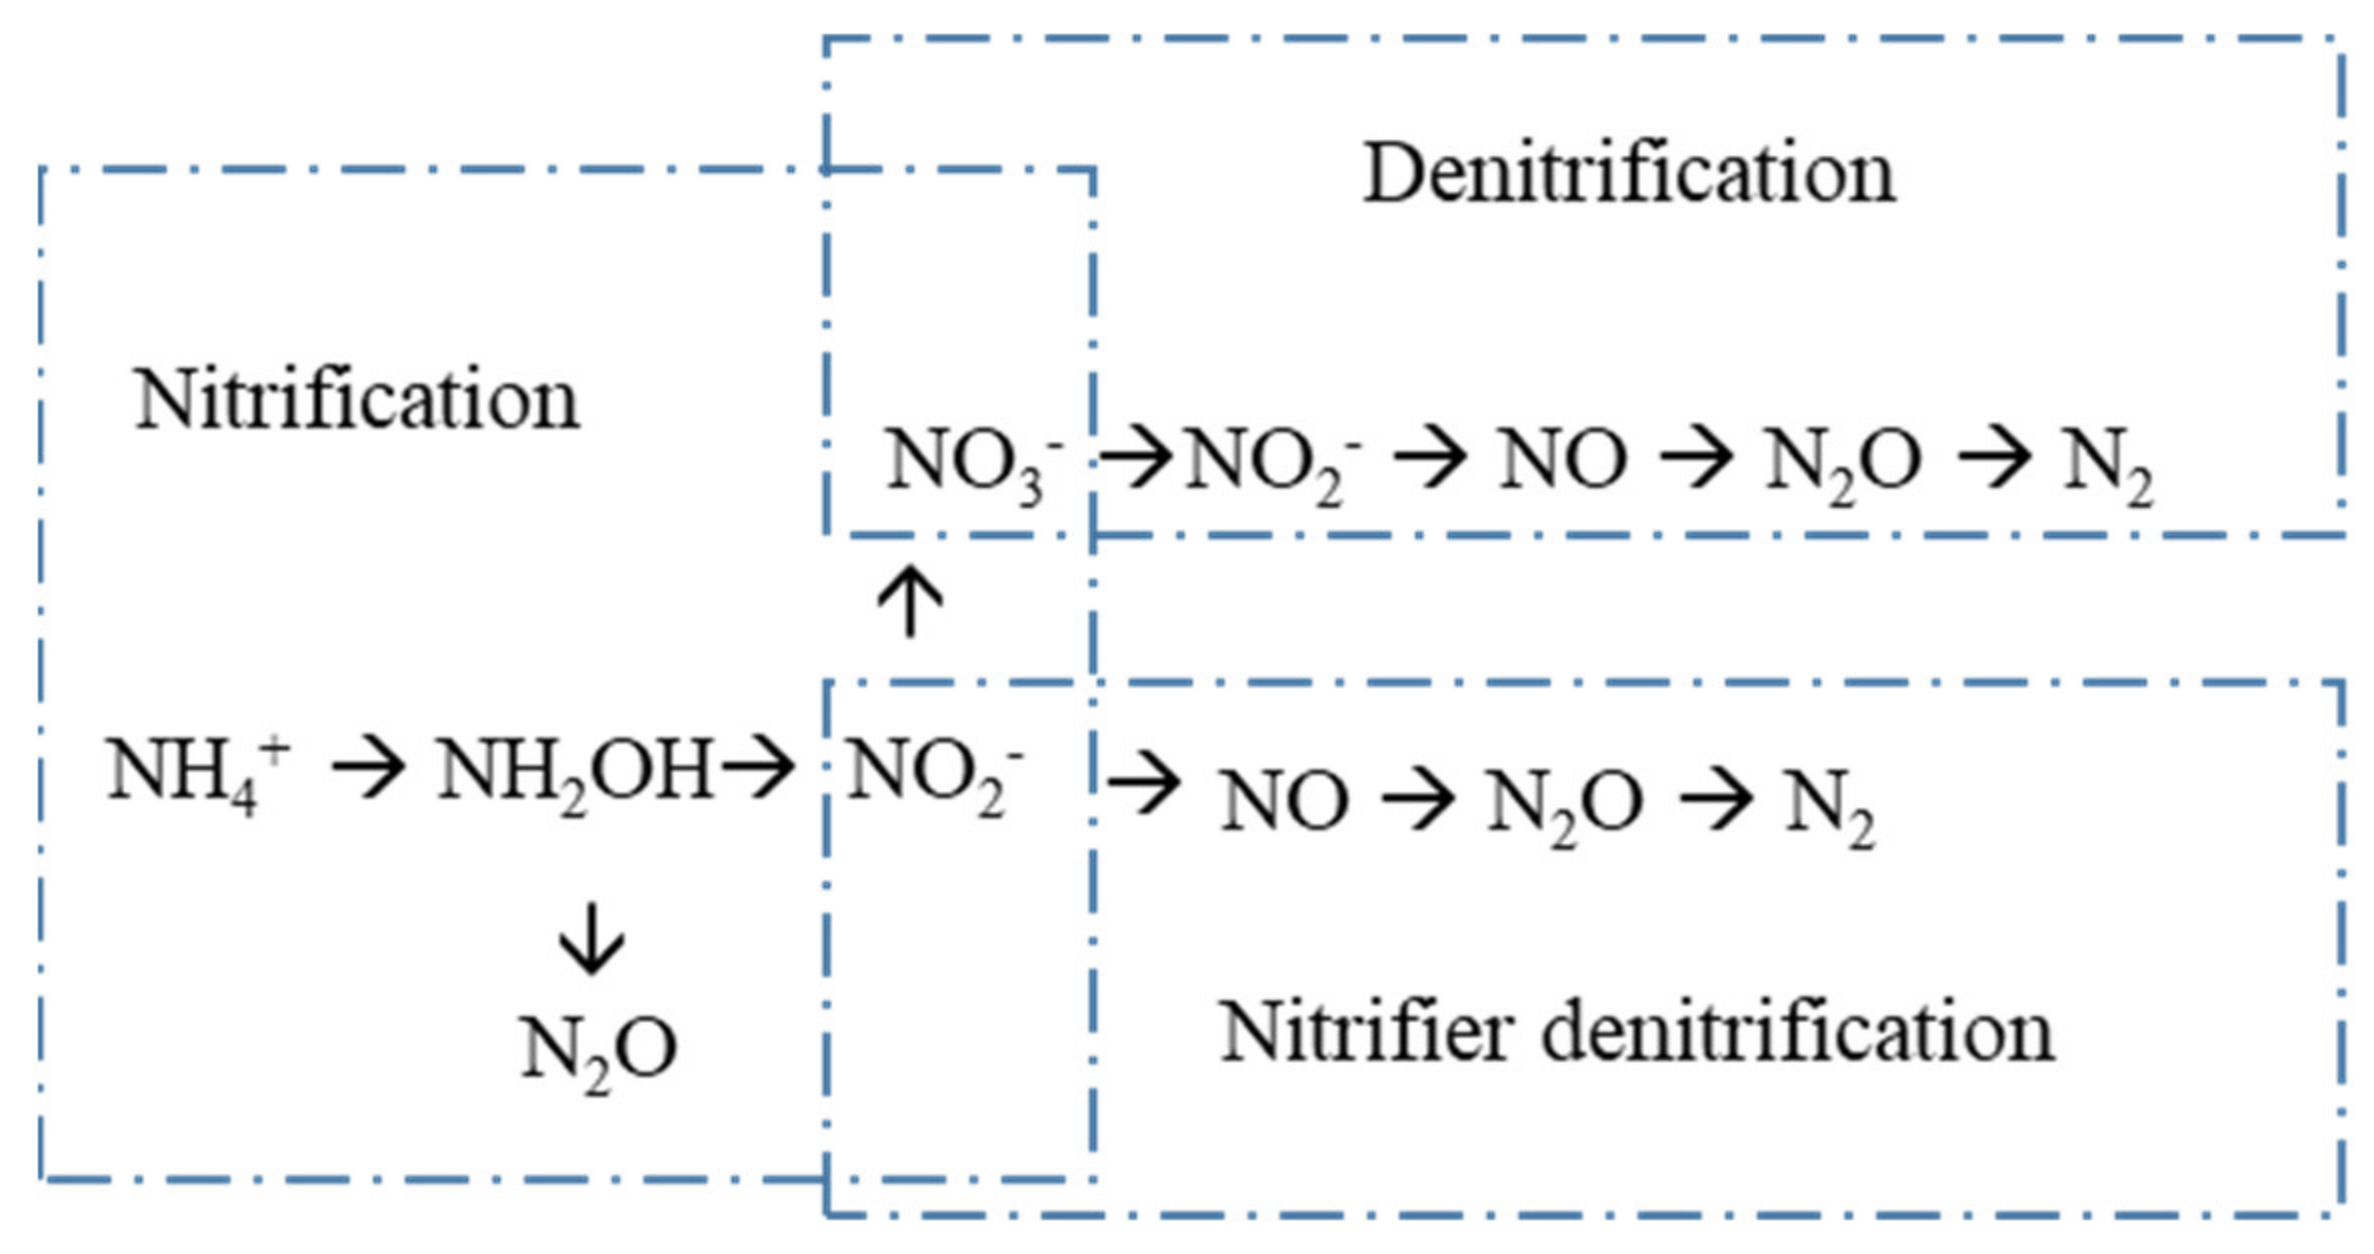
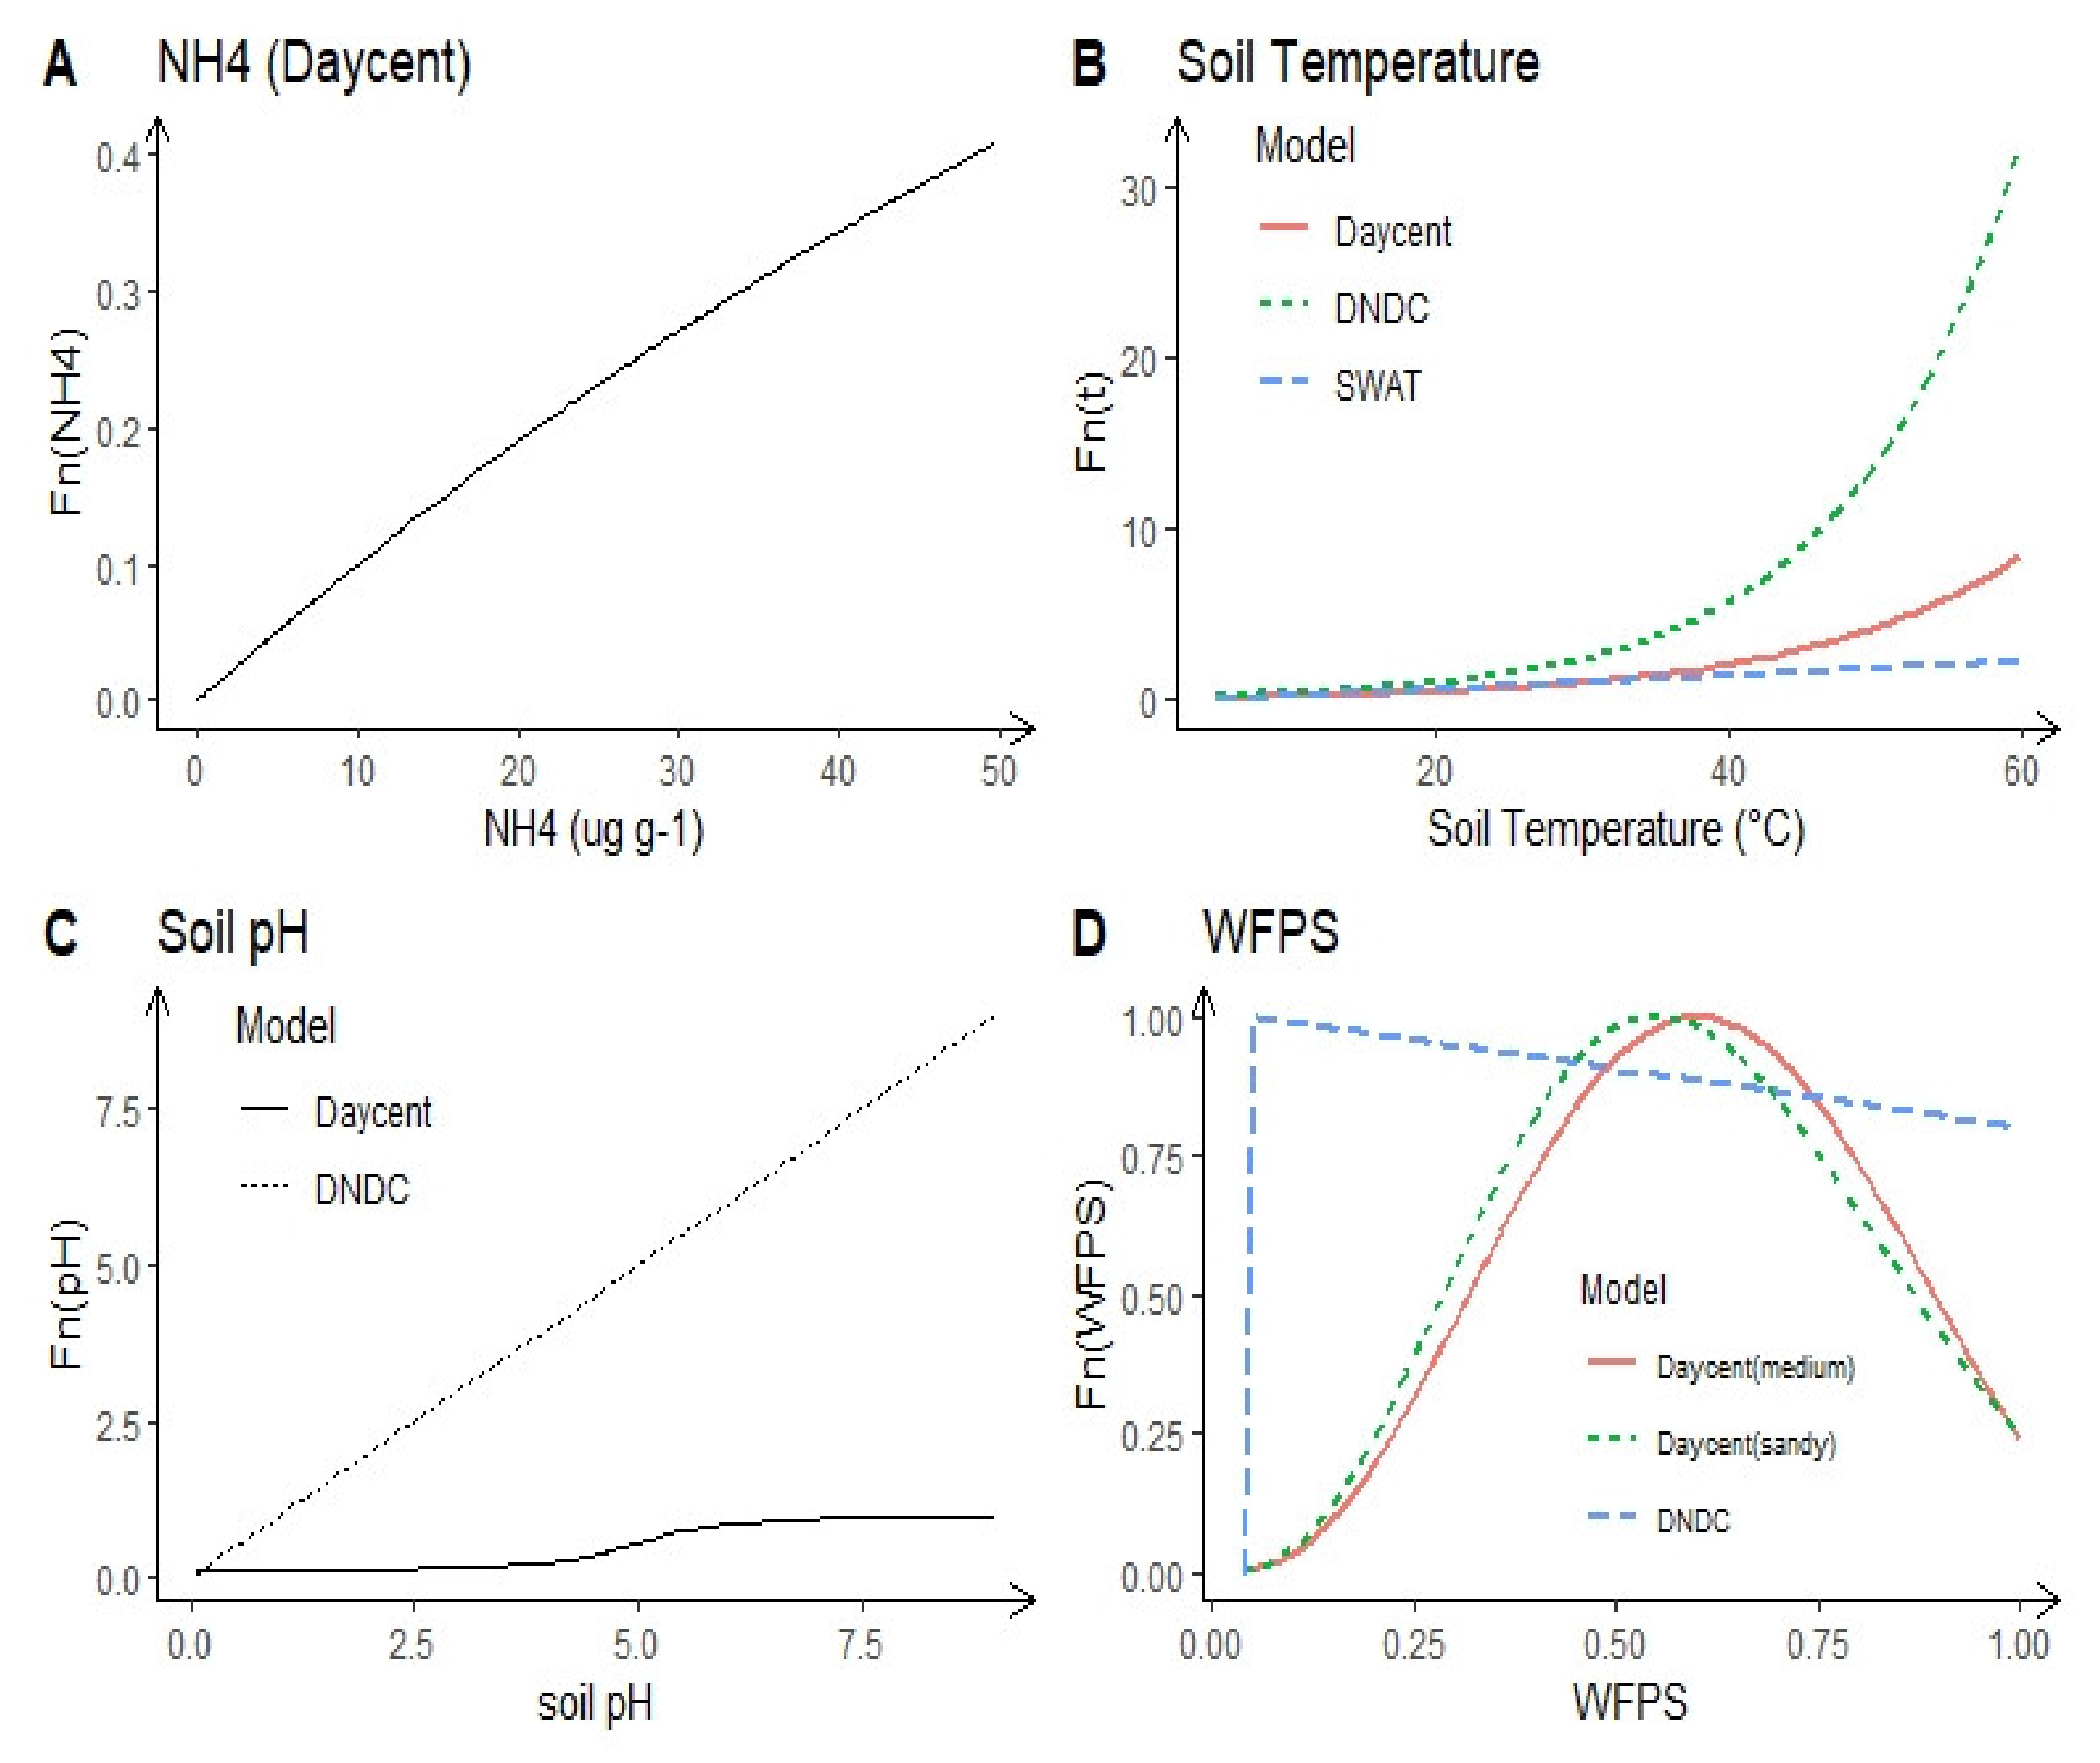
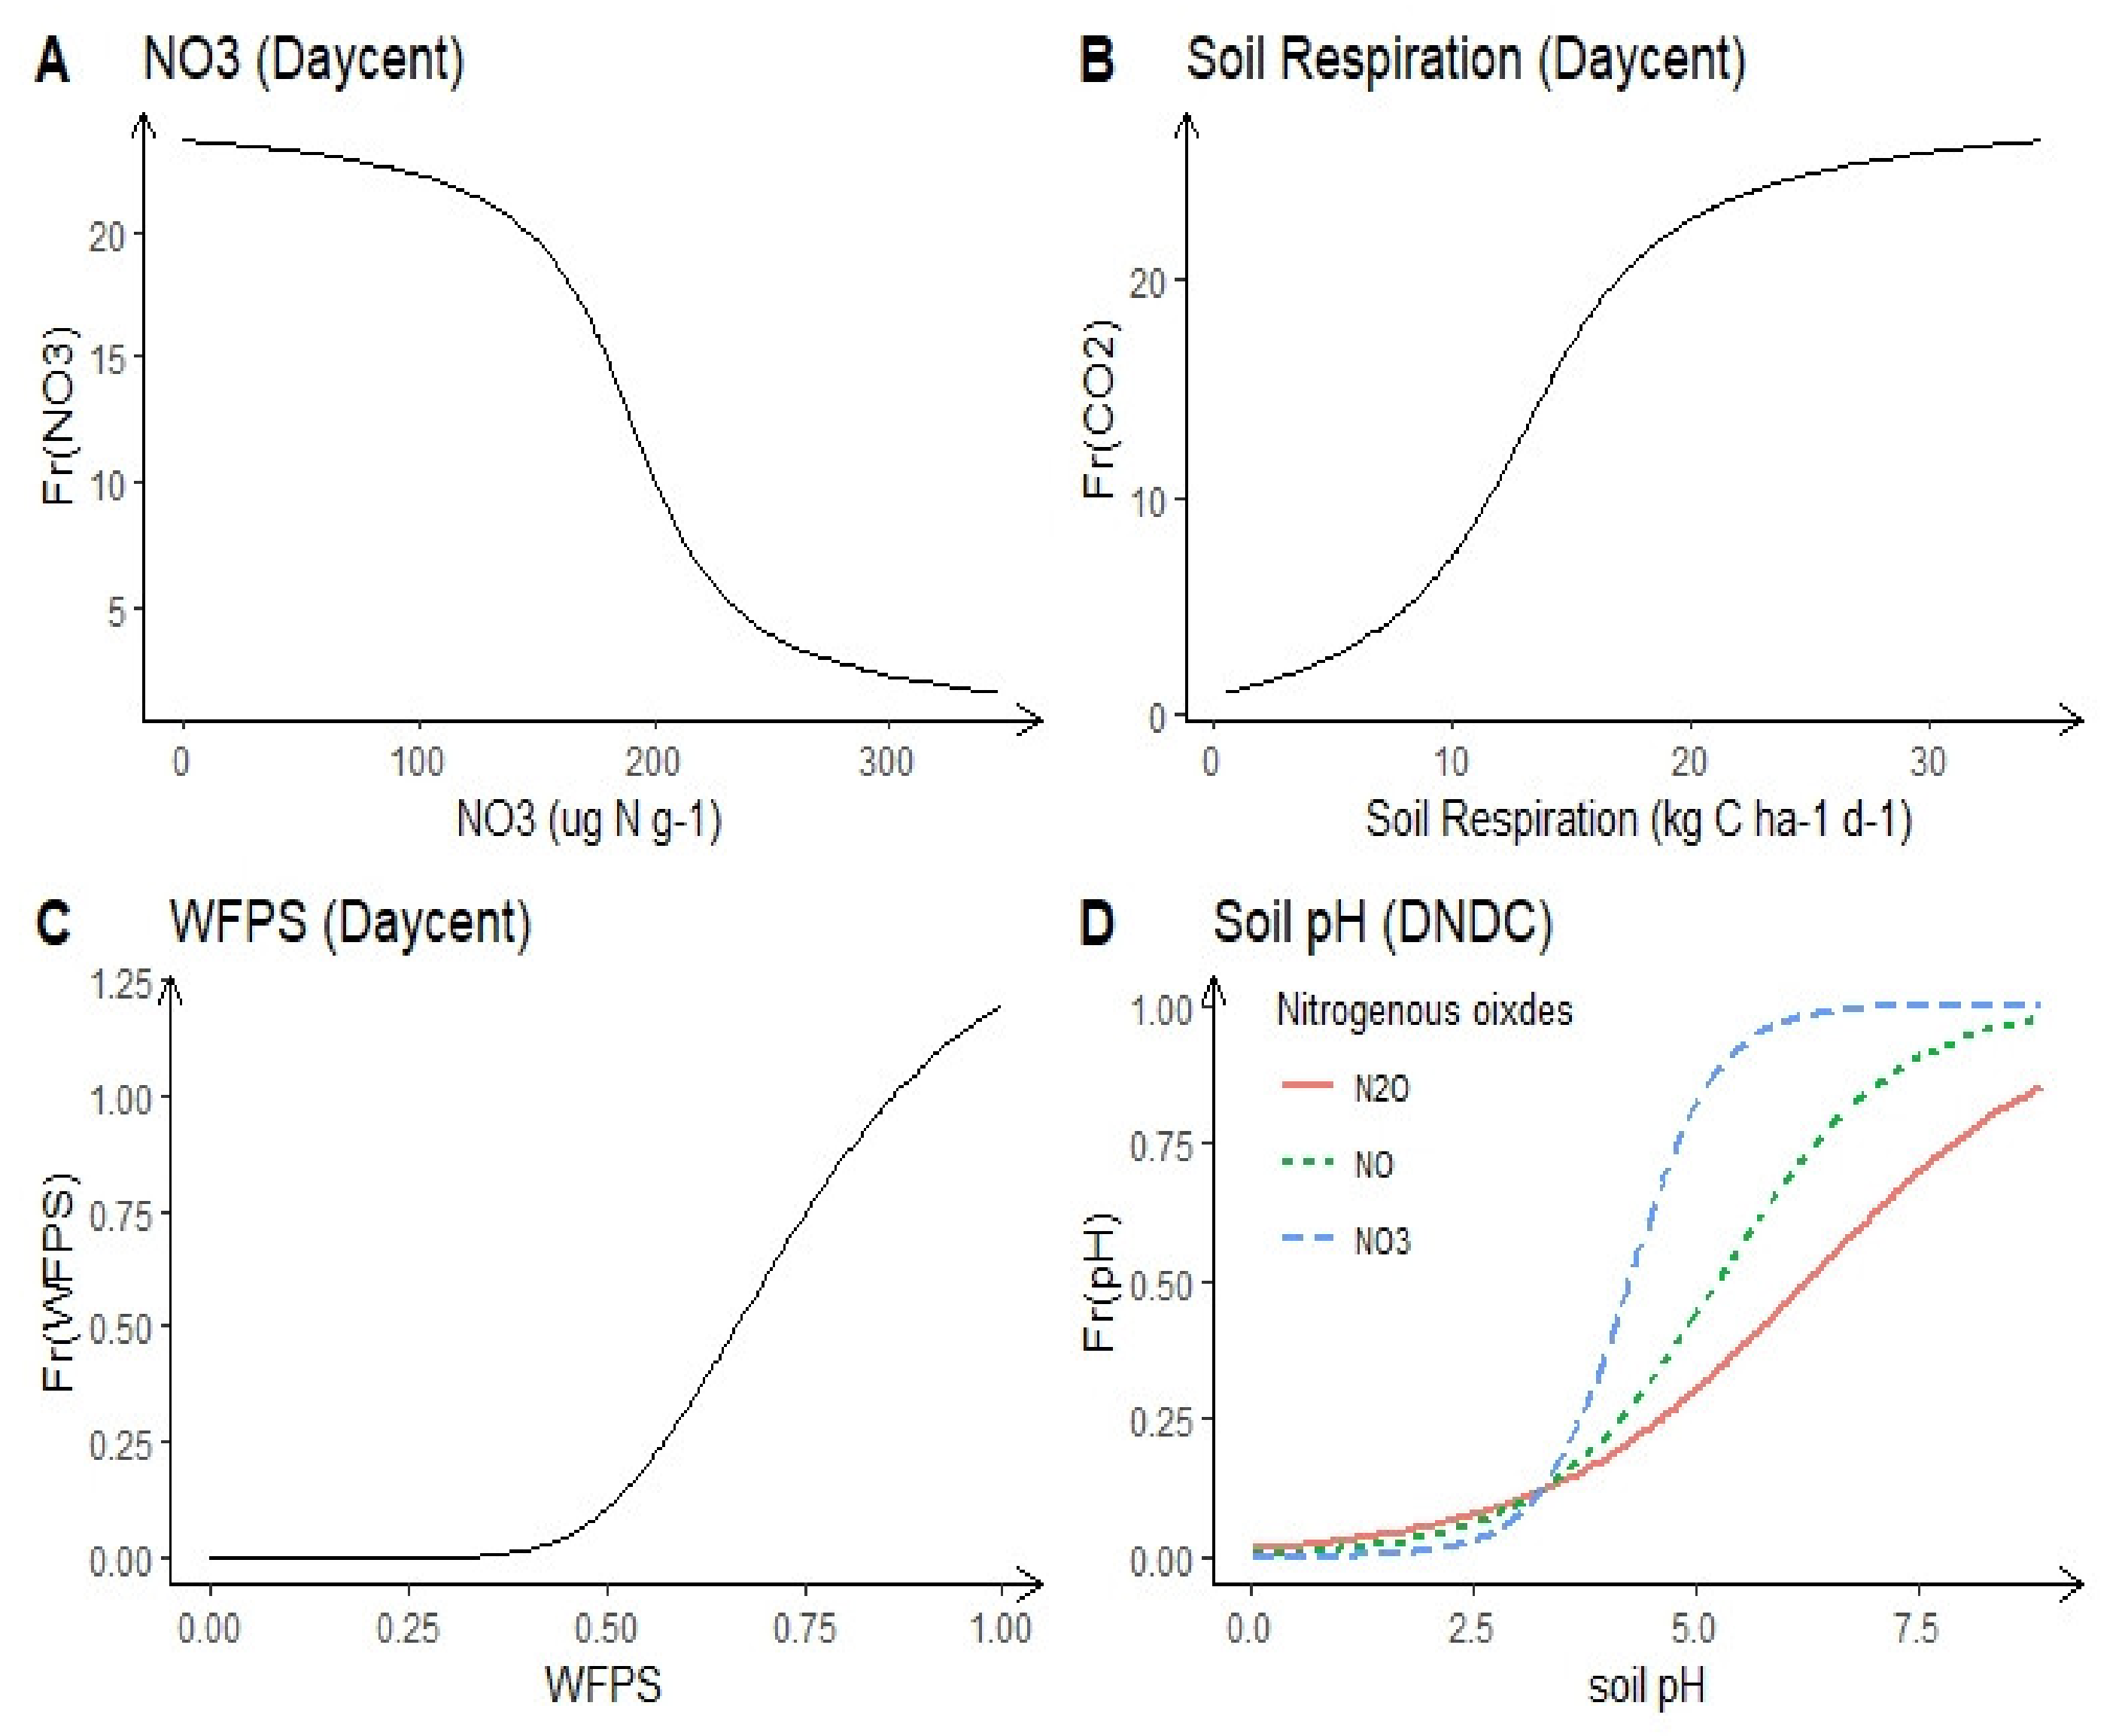
3.1. Nitrification Processes

The DAYCENT model calculates nitrification as a function of soil NH4+ level, soil temperature, soil pH, soil moisture and a N turnover coefficient (Equations (S1)–(S7)) [25]. The N turnover coefficient is a function of the soil texture, soil N fertility, N fertilizer additions, and soil management practices. In DAYCENT, the nitrification rate increases exponentially with increasing NH4+ levels and soil temperature (Figure 4A,B). In DAYCENT, the relationship between the nitrification rate and soil pH is the inverse of tangent function (Figure 4C). The effect of WFPS on nitrification is a function of the soil texture, whereby a maximum nitrification rate is reached for sandy soils at WFPS 0.55 and for medium texture soils at WFPS 0.61 (Figure 4D). In DAYCENT, the N turnover coefficient is treated as a site specific parameter that needs to be estimated using observed N2O data or observed potential soil N mineralized data.
The rate of nitrification in the DNDC model is regulated by soil temperature, soil moisture, soil pH and nitrifier activity, which relies on two substrates: the dissolved organic C and NH4+ concentration (Equations (S20)–(S27)) [136]. The nitrification rate linearly increases as the concentration of NH4+ increases in the soil [172]. Similar to DAYCENT, the nitrification rate in the DNDC model also increases exponentially with soil temperature. However, the magnitude is much higher (Figure 4B). The effect of soil pH on nitrification is linear with a slope of 1 (Figure 4C). In the DNDC model, when WFPS <0.05, the impact on nitrification is zero. When the WFPS > 0.05, the effect on nitrification has a negative linear association (Figure 4D).
The SWAT model considers nitrification to be a function of soil NH4+, soil moisture and soil temperature (Equations (S44)–(S49)) [173]. The SWAT model uses the amount of NH4+ in each soil layer, the nitrification regulator and volatilization regulator to calculate the total amount of nitrification and ammonia volatilization, and then partitions N between the two processes. The nitrification regulator is a function of soil temperature and soil water content. The volatilization regulator is a function of soil temperature, volatilization depth and cation exchange. In SWAT, nitrification occurs only when the soil temperature exceeds 5 °C and the correlation is linear, which is different to DAYCENT and DNDC (Figure 4B). The SWAT model calculates the impact of soil water on nitrification not by using the WFPS, but rather by using the soil water content of each soil layer, the wilting point water content, and the field capacity water content (Equations (S46) and (S47)), which vary with soil texture, climate and crop type [137]. SWAT does not take into account the changes of soil pH and therefore does not consider the impact of soil pH on nitrification.

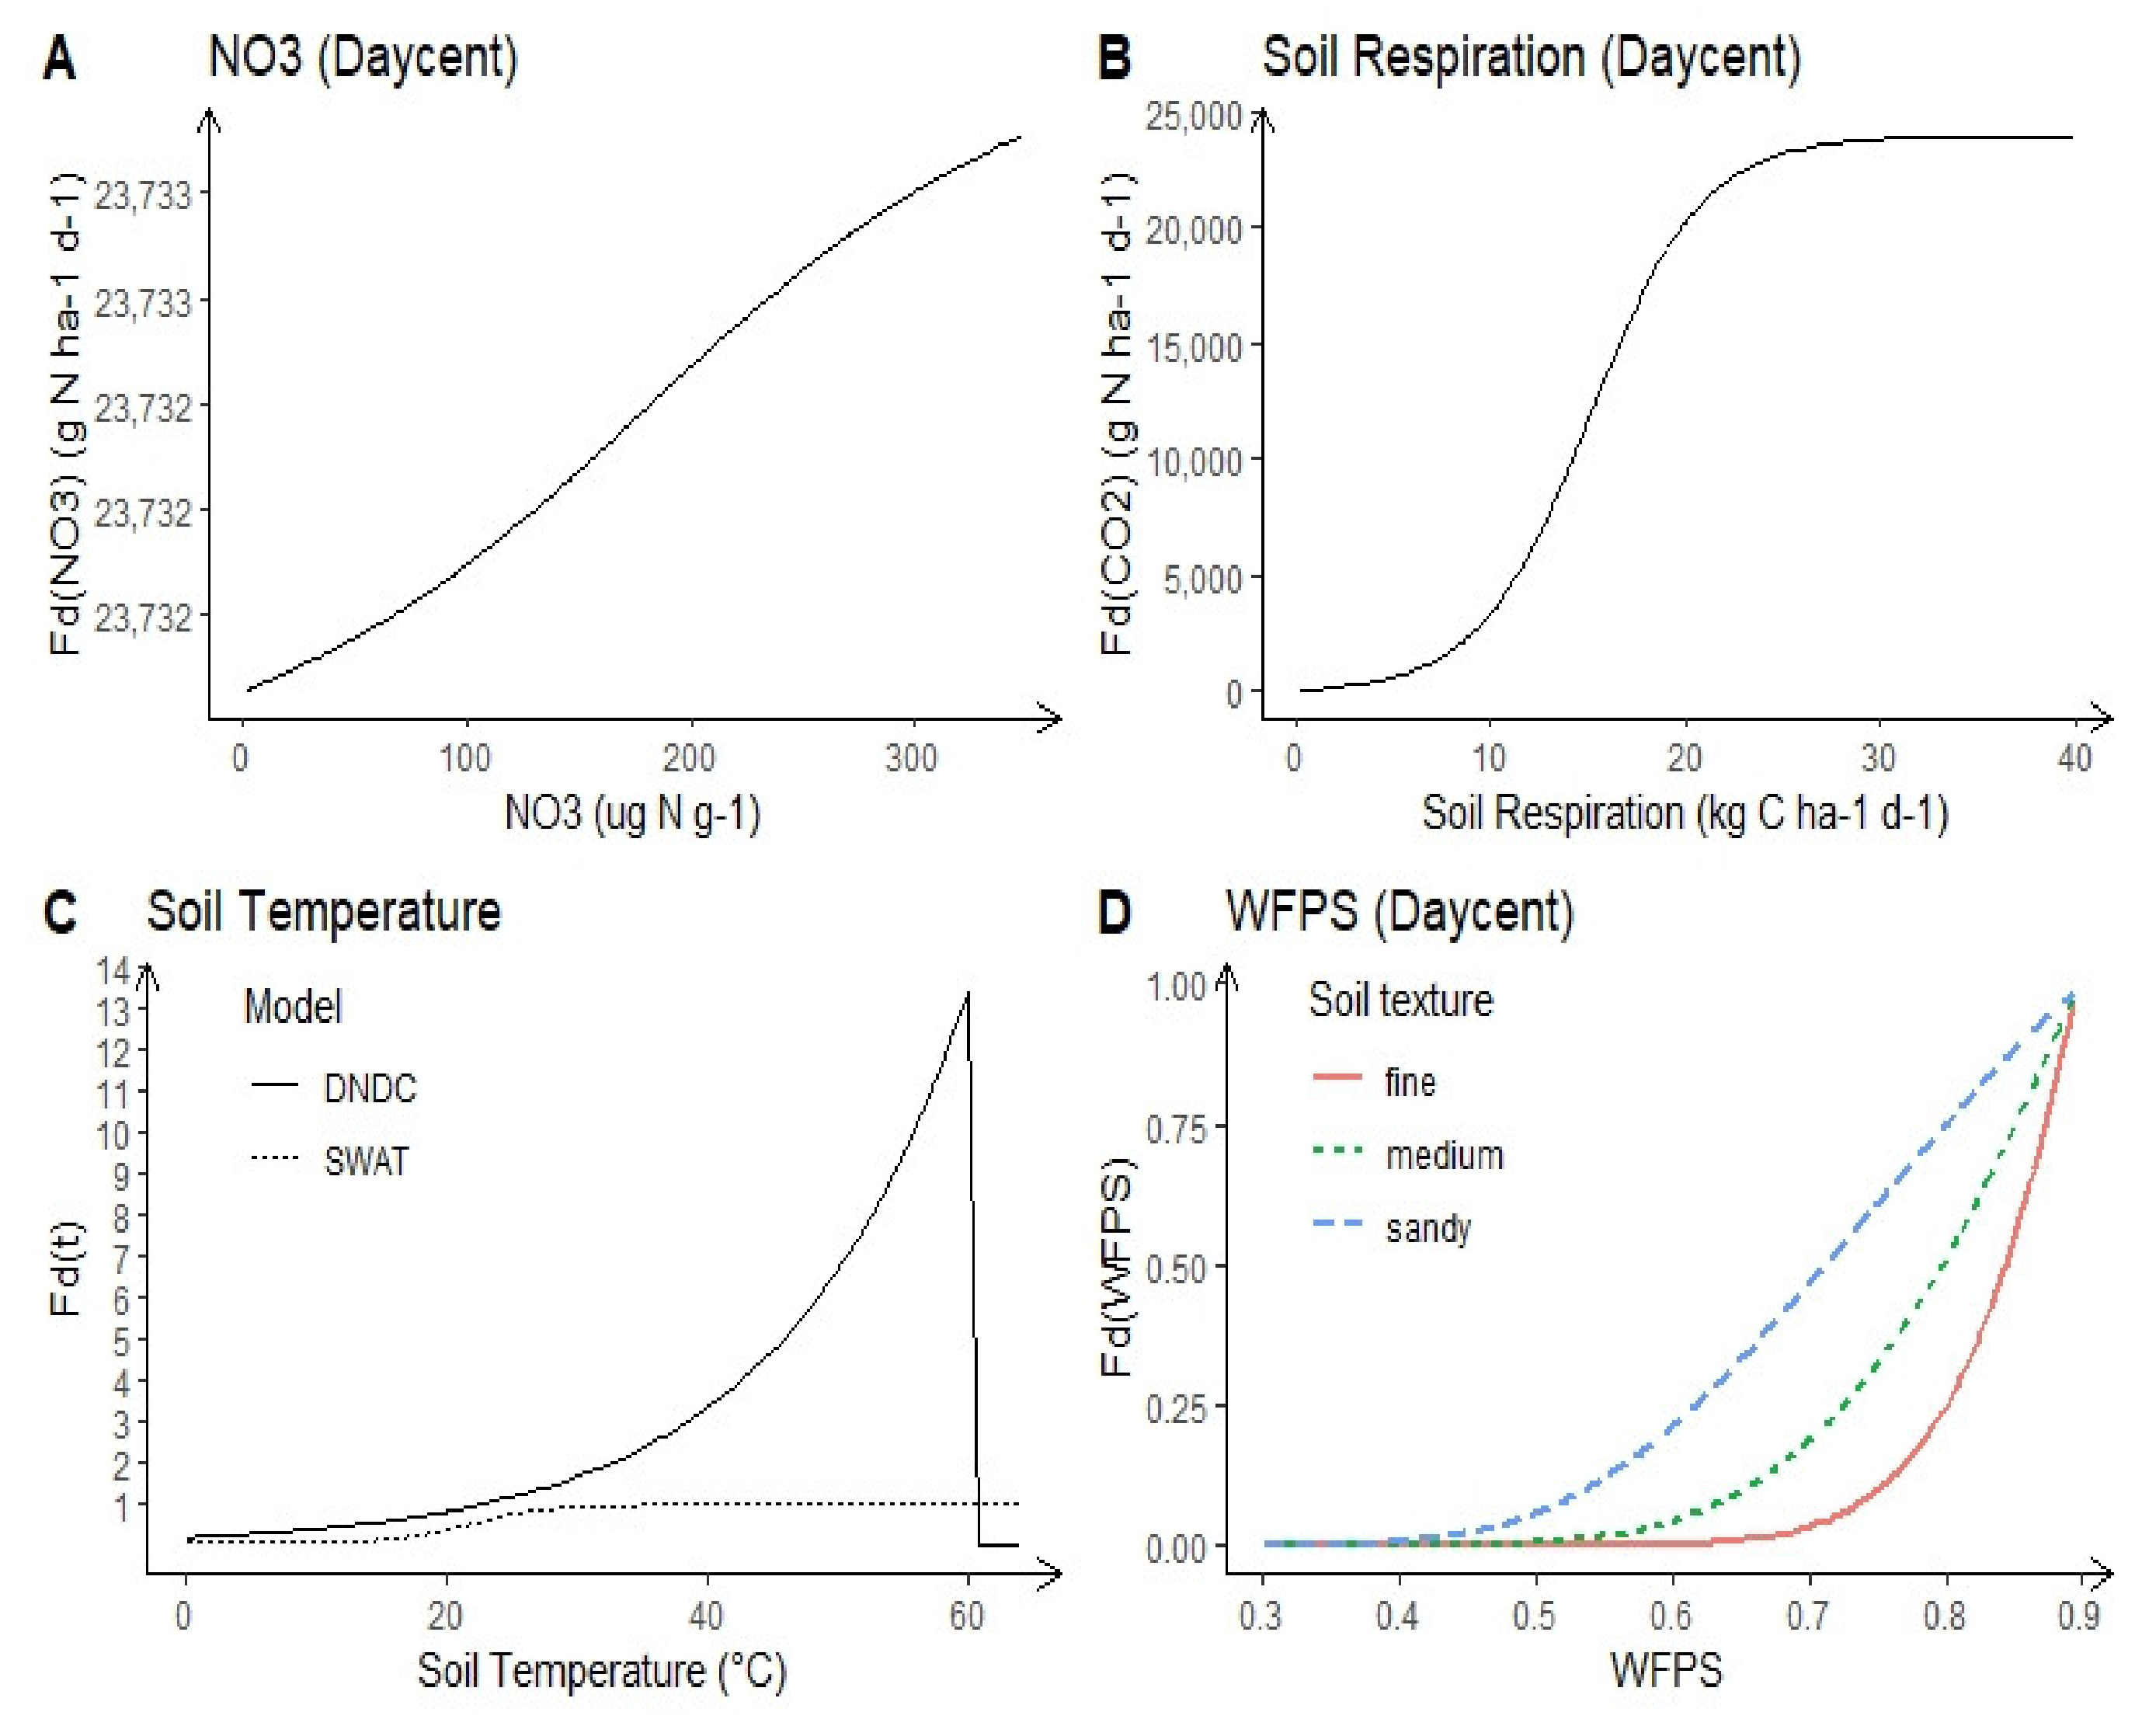
3.2. Denitrification Processes

The DAYCENT model calculates denitrification to be a function of soil NO3, soil respiration and the WFPS (Equations (S8)–(S11)). The impact of soil NO3 on denitrification is the inverse of a tangent function (Figure 5A), and the effect of soil respiration on denitrification is an exponential function (Figure 5B). Soil respiration is assumed to be correlated to the C substrate. The denitrification rate increases exponentially with increasing values of WFPS, and particularly when WFPS > 0.6, in all soil textures. In finer textured soil, the denitrification rate is slower at lower WFPS and only increases significantly after WFPS > 0.7 (Figure 5D). The representation of the impact of soil moisture on simulated N2O emissions fits well with the literature described in chapter 2. The DAYCENT model does not consider the impacts of soil temperature and soil pH on denitrification.
In the DNDC model, the denitrification process is a series of microbe-mediated reactions that sequentially reduce NO3 to NO2, NO, N2O, and finally to N2. The rate of each reduction step is a function of denitrifiers, DOC, corresponding nitrogenous oxides, temperature, Eh and pH in soils (Equations (S28)–(S43)) [172]. The DOC and the concentration of nitrogenous oxides control the growth of denitrifiers. The relationship between soil temperature and the reduction rate is exponential when soil temperature is <60 °C. When soil temperature is >60 °C, the impact on denitrification is zero (Figure 5C). Denitrifying soil conditions are assumed if the environmental Eh drops to 500 mV or lower due to the oxygen depletion in the soil [172]. In DNDC the denitrification rate increases exponentially with increasing soil pH, and the slopes are different depending on nitrogenous oxides (Figure 6D). The impact of soil pH on simulated N2O mimics the findings of Rochester et al. [74].
The SWAT model treats denitrification as a function of soil NO3, soil organic C, soil temperature, and soil moisture (Equations (S50)–(S53)) whereby the soil organic C amount is an input value. The denitrification rate increases exponentially with increasing soil temperature (Figure 5C), but the rate never falls below 0.1. The impact of soil moisture on denitrification is based on the ratio of soil water content and the water content at field capacity, which changes with soil texture, climate and crops. The impact of soil moisture on denitrification never falls below 0.05.

3.3. Partitioning N2O from N2

DAYCENT firstly models the total denitrification rate (N2+N2O) and then partitions N2 from N2O. It considers the N2/N2O ratio as a function of soil NO3, soil respiration and WFPS (Equations (S12)–(S15)) (Figure 6A–C). The N2/N2O ratio decreases as soil NO3 increases (Figure 6A), and high soil NO3 inhibits the reduction of N2O to N2. The relationship of soil respiration to the N2/N2O ratio is the inverse of tangent function (Figure 6B) whereby the N2/N2O ratio increases with increasing soil respiration. When WFPS > 0.5, the N2/N2O ratio also exponentially increases (Figure 6C). The impact of soil NO3, soil respiration and WFPS on simulated N2O emissions in the DAYCENT model is similar to the information presented in chapter 2.
Similar to the denitrification process in DNDC, the DNDC model partitions nitrogenous oxides by sequentially reducing NO3 to NO2, NO, N2O, and finally to N2.
The SWAT model does not partition N2O from nitrification and denitrification products (e.g., NOx and N2). Some studies have been undertaken to specially develop an N2O-submodule based on the SWAT model. Yang et al. [174] enhanced the SWAT model by directly integrating the DAYCENT model into the SWAT model. Shrestha et al. [170] developed a SWAT N2O-submodule mainly by using equations from Parton et al. [25,30], which were used to develop DAYCENT, and added the equation for the impact of soil temperature on denitrification (Equation (S52)). Wagena et al. [175] developed a SWAT-GHG model by also using the equations from Parton et al. [25]; however, their study considered the impacts of soil NH4+ and soil moisture on nitrification that are based on the SWAT model and not directly on Parton’s equations (Equations (S44)–(S47) and (S49)). Wagena et al. [175] also developed equations for considering the impacts of soil temperature and soil pH on denitrification as well as the impacts of soil pH on the N2/N2O ratio (Equations (S52), (S54) and (S55)). They treat soil pH as one value for the region instead of differentiating based on soil type at the local HRU level.
Based on the above analysis, we can state that the representations of soil temperature on nitrification in DAYCENT and in DNDC are as an exponential function, while in SWAT it is linear. Furthermore, the calculated N2O values based on the temperature formulas in these three models vary greatly.
Equations in the models showing the relations between soil NH4+ and nitrification in SWAT and DNDC are linear, while in DAYCENT this is exponential. The impacts of soil pH on nitrification are greater in DNDC than DAYCENT while in SWAT they are neglected. The impact of WFPS on nitrification in DNDC is negative linear whereby the maximum nitrification occurs when WFPS = 0.05, then decreases as WFPS increases. This is not in accordance with the peer-reviewed literature. However, Li et al. [31] showed DNDC simulated nitrification reasonably, whereas DAYCENT overestimated the nitrification.
Other model differences are mainly related to the partitioning of N2O. The SWAT N2O-submodule and the DAYCENT model firstly calculate total denitrification (N2O+N2) and then partition N2O from N2. The DAYCENT model even partitions N2O from NOx. The impacts of environmental factors on denitrification and the N2/N2O ratio are considered separately. The DNDC model simulates each stage of denitrification explicitly and the NOx, N2O and N2 amounts, which are calculated directly. The impacts of soil N, SOC and soil pH on each stage depend on different functions of nitrogenous oxides, SOC and soil pH. David et al. [176] compared simulated denitrification for a corn and soybean agroecosystem from DAYCENT, SWAT and DNDC. The DAYCENT and DNDC models, which are biogeochemistry-constructed models, are more similar to each other, and overall simulate lower denitrification fluxes compared to the agronomist-developed and crop-oriented SWAT model [176]. DAYCENT predicted an even split of 50% of denitrification for N2O and N2, whereas the simulated N2O from DNDC depends on the model version and its simulated denitrification (~22–75% denitrification).
The biogeochemical DAYCENT model considers partitioning N2O from both N2 and NOx. In DAYCENT, the semi-empirical equations for describing the impacts of environmental factors on N2O emissions are developed based on experimental data, and are also used to develop N2O submodules for other models [169,174,175]. Especially, the impacts of WFPS on nitrification and denitrification are considered for different soil texture. However, the DAYCENT model does not include the impacts of soil temperature and soil pH on denitrification and the ratio of N2/N2O. In addition, the consideration of land management strategies is not possible in the DAYCENT model, for example, fertilizer type and placement are not represented, although the current DAYCENT model can simulate limited management events (e.g., the amounts of N input) [177].
The DNDC model is also a kinetic model, which requires some parameters that are not commonly measured in the field, for example, it is difficult to measure and/or validate soil microbial biomass [178]. Even though some researchers use crop yield to validate model simulations, the uncertainty of the simulated N2O emissions using the DNDC model still needs to be more widely quantified [179,180].
The SWAT model is an eco-hydrological model, which can be used to simulate hydrological processes, crop growth and nutrient fluxes at the catchment scale. However, SWAT does not partition N2O from other products (e.g., NOx and N2). Even though a few studies developed SWAT N2O submodules, the partitioning of N2O from NOx is still missing in all of the current developed SWAT submodules [32,169,175]. In addition, the widely used SWAT model does not simulate the dynamics of changing soil pH, thus the impact of soil pH on nitrification and denitrification is not considered. The SWAT submodules developed specifically for N2O emissions also treat soil pH only as one value instead of differentiating at the HRU level [175].
The DAYCENT, DNDC models and the SWAT N2O-submodule can be used to simulate long-term N2O emissions from agricultural soils at the daily time step and at different scales. Compared to the measured N2O data, the models’ performances are highly variable and there is little agreement in the literature. Zimmermann et al. [80] reported that DAYCENT and DNDC overestimated cumulative N2O fluxes, while Gaillard et al. [180] reported underestimation of N2O fluxes for both models. Fitton et al. [181] showed that DAYCENT could provide a good estimation of annual N2O emissions. The different versions of SWAT N2O-submodules also report a wide range of performances for simulating N2O emissions [169,175].
In addition to the simulated comparisons with measured N2O data, other environmental processes can be compared to measured data. For example, DAYCENT and DNDC can simulate crop yields well when compared to observed crop yields [118,179,181,182]. Current literature on the SWAT N2O submodule did not report on SWAT performance for simulating crop yields. However, the SWAT model is based on the EPIC submodule and indeed has the ability to simulate crop growth and crop yields [32,173].
Soil moisture is another variable that can be compared in the models. DAYCENT and DNDC had relatively poor performances for simulating soil water [80], whereas SWAT could simulate soil moisture quite well, which reflects the robust hydrological processes in the SWAT model [169].
The models’ performances for simulating nitrification, denitrification and N2O emissions indicates that processes and parameters governing management practices, crop growth, and water fluxes in each model show large differences and strongly influence the simulations of soil microbes, soil N, SOC, soil temperature, soil pH and soil water availability [183,184]. These environmental factors further affect the rates of nitrification, denitrification and N2O emissions as discussed in chapter 2. Different types of field observations (e.g., soil moisture, soil temperature, soil NO3 and crop yields) should be compared with simulated values to improve model performance for simulating the N-cycle and N2O emissions [180,182]. In addition, the measurement of N2O emissions (e.g., length of measurements, applied method for N2O measurement and the scales) also influence the evaluation of model performance [119,185].

4. Summary & Conclusions

In this review, we group factors that influence N2O emissions into environmental factors, management factors and measurement factors. Environmental factors control the rate of nitrification and denitrification. Management factors control how much N is input into soils, and influence the environmental factors. Measurement factors contribute to our process of understanding N2O emissions, and while they do not influence N2O emissions directly, they affect the accuracy (and uncertainty) of measured N2O data, which in turn is important for model development and validation. We described how these factors influence nitrification and denitrification processes and the products of the N2/N2O ratio.
Overall, there is general agreement in the literature about the main factors that influence N2O emissions; however, the factors and the significance of their impacts on nitrification, denitrification and the N2/N2O ratio vary with soil and climate types. The impacts of environmental factors on N2O emissions and the proportion of N2O emissions from nitrified N also vary with soil and climate type, and are not sufficiently researched. The effect of soil pH and how it affects denitrification is another area which is not resolved.
We compared and analyzed the algorithms responsible for N2O simulations in DAYCENT, DNDC, and SWAT for each of the impact factors. The representation of most of the impact factors in these three models are in accordance with the literature that we reviewed, although some simulated N2O results are clearly different from the literature. Current models for simulating N2O emissions use empirical equations or values, which were developed/regressed for specific soil and climate types. For example, the proportion of N2O emissions from nitrification processes are set to a single value in the DNDC model and in the recently developed SWAT N2O submodules.
The three widely used process-based models (DAYCENT, DNDC, and SWAT) have advantages and weaknesses for simulating N2O emissions from managed soils. DAYCENT and DNDC are biogeochemical models and can be used to simulate small-scale N dynamics in soils. SWAT is an eco-hydrological model and can be used to simulate N fluxes from crop production and at the catchment scale because reactive nitrogen is highly mobile and is easily transported by water. The main disadvantages of the models include the following: a particular weakness of DAYCENT is the inability to represent land management strategies, because N2O is mainly emitted from agriculturally managed soils. Some parameters (e.g., soil microbial biomass) included in the DNDC model are difficult to validate. The SWAT model cannot completely partition N2O from NOx and N2, and does not capture the dynamic changes in soil pH.
It is difficult to conclude which simulation model is better for representing N2O fluxes, or which model consistently overestimates or underestimates N2O emissions because of the interactions of several simulated impact factors on simulated N components in the model. Most model-based studies focus on regions where field measured data are available for model calibration and validation. We recommend a more holistic approach to model calibration/validation whereby several simulated variables related to N2O emissions in the model, such as soil NO3, soil water, or crop yields should be compared with measured data when possible, as this would improve the simulation of N2O in the soil system.

Supplementary Materials

The following are available online at https://www.mdpi.com/article/10.3390/agronomy11040770/s1. Table S1. Factors that influence N2O emissions from peer-reviewed literature. Table S2. Soil texture parameters for nitrification rate. Table S3. Soil texture parameters for denitrification rate.

Author Contributions

Conceptualization, C.W. and B.M.; writing—original draft preparation, C.W. and B.M.; writing—review and editing, B.A., K.S., and B.M.; supervision, B.M., K.S. and B.A. All authors have read and agreed to the published version of the manuscript.

Funding

This work is supported by the China Scholarship Council [grant number 201708620181]. Open access funding is provided by the University of Natural Resources and Life sciences, Vienna (BOKU) and Human river systems in the 21st century (HR21) (BOKU).

Institutional Review Board Statement

Not applicable.

Informed Consent Statement

Not applicable.

Data Availability Statement

No new data were created or analyzed in this study. Data sharing is not applicable to this article.

Conflicts of Interest

The authors declare no conflict of interest.

References

  1. Fowler, D.; Steadman, C.E.; Stevenson, D.; Coyle, M.; Rees, R.M.; Skiba, U.M.; Sutton, M.A.; Cape, J.N.; Dore, A.J.; Vieno, M.; et al. Effects of global change during the 21st century on the nitrogen cycle. Atmos. Chem. Phys. 2015, 15, 13849–13893. [Google Scholar] [CrossRef] [Green Version]
  2. Beaulieu, J.J.; Tank, J.L.; Hamilton, S.K.; Wollheim, W.M.; Hall, R.O.; Mulholland, P.J.; Peterson, B.J.; Ashkenas, L.R.; Cooper, L.W.; Dahm, C.N.; et al. Nitrous oxide emission from denitrification in stream and river networks. Proc. Natl. Acad. Sci. USA 2010, 108, 214–219. [Google Scholar] [CrossRef] [PubMed] [Green Version]
  3. Flückiger, J.; Dällenbach, A.; Blunier, T.; Stauffer, B.; Stocker, T.F.; Raynaud, D.; Barnola, J.-M. Variations in Atmospheric N2O Concentration during Abrupt Climatic Changes. Science 1999, 285, 227–230. [Google Scholar] [CrossRef] [Green Version]
  4. Seitzinger, S.P.; Phillips, L. Nitrogen stewardship in the Anthropocene. Science 2017, 357, 350–351. [Google Scholar] [CrossRef] [PubMed]
  5. Smith, P.; Clark, H.; Dong, H.; Elsiddig, E.A.; Haberl, H.; Harper, R.; House, J.; Jafari, M.; Masera, O.; Mbow, C.; et al. Agriculture, Forestry and Other Land Use (AFOLU). In Climate Change 2014: Mitigation of Climate Change. Contribution of Working Group III to the Fifth Assessment Report of the Intergovernmental Panel on Climate Change; Edenhofer, O.R., Pichs-Madruga, Y., Sokona, E., Farahani, S., Kadner, K., Seyboth, A., Adler, I., Baum, S., Brunner, P., Eickemeier, B., et al., Eds.; Cambridge University Press: Cambridge, UK; New York, NY, USA; Available online: https://www.ipcc.ch/pdf/assessment-report/ar5/wg3/ipcc_wg3_ar5_chapter11.pdf (accessed on 20 August 2018).
  6. Kravchenko, A.N.; Toosi, E.R.; Guber, A.K.; Ostrom, N.E.; Yu, J.; Azeem, K.; Rivers, M.L.; Robertson, G.P. Hotspots of soil N2O emission enhanced through water absorption by plant residue. Nat. Geosci. 2017, 10, 496–500. [Google Scholar] [CrossRef]
  7. Mosier, A.R. Nitrous oxide emissions from agricultural soils. Fertil. Res. 1994, 37, 191–200. [Google Scholar] [CrossRef]
  8. Myhre, G.D.; Shindell, F.-M.; Bréon, W.; Collins, J.; Fuglestvedt, J.; Huang, D.; Koch, J.-F.; Lamarque, D.; Lee, B.; Mendoza, T.; et al. Anthropogenic and Natural Radiative Forcing. In Climate Change 2013: The Physical Science Basis. Contribution of Working Group I to the Fifth Assessment Report of the Intergovernmental Panel on Climate Change; Stocker, T.F., Qin, D., Plattner, G.-K., Tignor, M., Allen, S.K., Boschung, J., Nauels, A., Xia, Y., Bex, V., Midgley, P.M., Eds.; Cambridge University Press: Cambridge, UK; New York, NY, USA; Available online: https://www.ipcc.ch/site/assets/uploads/2018/02/WG1AR5_Chapter08_FINAL.pdf (accessed on 20 August 2018).
  9. Tubiello, F.N.; Salvatore, M.; Cóndor Golec, R.D.; Ferrara, A.; Rossi, S.; Biancalani, R.; Federici, S.; Jacobs, H.; Flammini, A. Agriculture, Forestry and Other Land Use Emissions by Sources and Removals by Sinks, ESS Working Paper No.2; FAO: Rome, Italy, 2014. [Google Scholar] [CrossRef]
  10. Petrescu, A.M.R.; Peters, G.P.; Janssens-Maenhout, G.; Ciais, P.; Tubiello, F.N.; Grassi, G.; Nabuurs, G.-J.; Leip, A.; Carmona-Garcia, G.; Winiwarter, W.; et al. European anthropogenic AFOLU emissions and their uncertainties: A review and benchmark data. Earth Syst. Sci. Data 2019, 12, 961–1001. [Google Scholar] [CrossRef]
  11. Ciais, P.C.; Sabine, G.; Bala, L.; Bopp, V.; Brovkin, J.; Canadell, A.; Chhabra, R.; DeFries, J.; Galloway, M.; Heimann, C.; et al. Carbon and Other Biogeochemical Cycles. In In Climate Change 2013: The Physical Science Basis. Contribution of Working Group I to the Fifth Assessment Report of the Intergovernmental Panel on Climate Change; Stocker, T.F., Qin, D., Plattner, G.-K., Tignor, M., Allen, S.K., Boschung, J., Nauels, A., Xia, Y., Bex, V., Midgley, P.M., Eds.; Cambridge University Press: Cambridge, UK; New York, NY, USA; Available online: https://www.ipcc.ch/site/assets/uploads/2018/02/WG1AR5_Chapter06_FINAL.pdf (accessed on 21 August 2018).
  12. De Klein, C.A.M.; Sherlock, R.R.; Cameron, K.C.; Van Der Weerden, T.J. Nitrous oxide emissions from agricultural soils in New Zealand—A review of current knowledge and directions for future research. J. R. Soc. N. Z. 2001, 31, 543–574. [Google Scholar] [CrossRef]
  13. Hergoualc’h, K.; Akiyama, H.; Bernoux, M.; Chirinda, N.; del Prado, A.; Kasimir, Å.; MacDonald, J.D.; Ogle, S.M.; Regina, K.; van der Weerden, T.J. IPCC: N2O Emissions from Managed Soils, and CO2 Emissions from Lime and Urea Application, Chap.11, In 2019 Refinement to the 2006 IPCC Guidelines for National Greenhouse Gas Inventories. Available online: https://www.ipcc-nggip.iges.or.jp/public/2019rf/pdf/4_Volume4/19R_V4_Ch11_Soils_N2O_CO2.pdf (accessed on 23 September 2019).
  14. Winiwarter, W.; Klimont, Z. The role of N-gases (N2O, NOx, NH3) in cost-effective strategies to reduce greenhouse gas emissions and air pollution in Europe. Curr. Opin. Environ. Sustain. 2011, 3, 438–445. [Google Scholar] [CrossRef]
  15. De Klein, C.; Novoa, R.S.A.; Ogle, S.; Smith, K.A.; Rochette, P.; Wirth, C.T.; McConkey, B.G.; Mosier, A.; Williams, S.A. In 2006 IPCC Guidelines for National Greenhouse Gas Inventories. Volume 4: Agriculture, Forestry and Other Land Use. Chapter 11: N2O Emissions from Managed Soils, and CO2 Emissions from Lime and Urea Application. Intergovernmental Panel on Climate Change (IPCC), Technical Report 4-88788-032-4, Geneva, Switzerland. Available online: https://www.ipcc-nggip.iges.or.jp/public/2006gl/pdf/4_Volume4/V4_11_Ch11_N2O&CO2.pdf (accessed on 19 August 2018).
  16. Abdalla, M.; Smith, P.; Williams, M. Emissions of nitrous oxide from agriculture: Responses to management and climate change. In Understanding Greenhouse Gas Emissions from Agricultural Management; American Chemical Society (ACS): Washington, DC, USA, 2011; pp. 343–370. [Google Scholar]
  17. Signor, D.; Cerri, C.E.P. Nitrous oxide emissions in agricultural soils: A review. Pesqui. Agropecuária Trop. 2013, 43, 322–338. [Google Scholar] [CrossRef]
  18. Stehfest, E.; Bouwman, L. N2O and NO emission from agricultural fields and soils under natural vegetation: Summarizing available measurement data and modeling of global annual emissions. Nutr. Cycl. Agroecosystems 2006, 74, 207–228. [Google Scholar] [CrossRef]
  19. Aguilera, E.; Lassaletta, L.; Sanz-Cobena, A.; Garnier, J.; Vallejo, A. The potential of organic fertilizers and water management to reduce N2O emissions in Mediterranean climate cropping systems. A review. Agric. Ecosyst. Environ. 2013, 164, 32–52. [Google Scholar] [CrossRef] [Green Version]
  20. Bouwman, A.F.; Boumans, L.J.M.; Batjes, N.H. Modeling global annual N2O and NO emissions from fertilized fields. Glob. Biogeochem. Cycles 2002, 16, 28. [Google Scholar] [CrossRef]
  21. Charles, A.; Rochette, P.; Whalen, J.K.; Angers, D.A.; Chantigny, M.H.; Bertrand, N. Global nitrous oxide emission factors from agricultural soils after addition of organic amendments: A meta-analysis. Agric. Ecosyst. Environ. 2017, 236, 88–98. [Google Scholar] [CrossRef]
  22. Dalal, R.C.; Wang, W.; Robertson, G.P.; Parton, W.J. Nitrous oxide emission from Australian agricultural lands and mitigation options: A review. Soil Res. 2003, 41, 165–195. [Google Scholar] [CrossRef]
  23. Uchida, Y.; Akiyama, H. Mitigation of postharvest nitrous oxide emissions from soybean ecosystems: A review. Soil Sci. Plant Nutr. 2013, 59, 477–487. [Google Scholar] [CrossRef] [Green Version]
  24. Weier, K.L.; Doran, J.W.; Power, J.F.; Walters, D.T. Denitrification and the Dinitrogen/Nitrous Oxide Ratio as Affected by Soil Water, Available Carbon, and Nitrate. Soil Sci. Soc. Am. J. 1993, 57, 66–72. [Google Scholar] [CrossRef] [Green Version]
  25. Parton, W.J.; Mosier, A.R.; Ojima, D.S.; Valentine, D.W.; Schimel, D.S.; Weier, K.; Kulmala, A.E. Generalized model for N2and N2O production from nitrification and denitrification. Glob. Biogeochem. Cycles 1996, 10, 401–412. [Google Scholar] [CrossRef]
  26. Cameron, K.C.; Di, H.; Moir, J.L. Nitrogen losses from the soil/plant system: A review. Ann. Appl. Biol. 2013, 162, 145–173. [Google Scholar] [CrossRef]
  27. Oertel, C.; Matschullat, J.; Zurba, K.; Zimmermann, F.; Erasmi, S. Greenhouse gas emissions from soils—A review. Geochemistry 2016, 76, 327–352. [Google Scholar] [CrossRef] [Green Version]
  28. Ghimire, U.; Shrestha, N.K.; Biswas, A.; Wagner-Riddle, C.; Yang, W.; Prasher, S.; Rudra, R.; Daggupati, P. A Review of Ongoing Advancements in Soil and Water Assessment Tool (SWAT) for Nitrous Oxide (N2O) Modeling. Atmosphere 2020, 11, 450. [Google Scholar] [CrossRef]
  29. Saggar, S.; Jha, N.; Deslippe, J.; Bolan, N.S.; Luo, J.; Giltrap, D.L.; Kim, D.-G.; Zaman, M.; Tillman, R.W. Denitrification and N2O:N2 production in temperate grasslands: Processes, measurements, modelling and mitigating negative impacts. Sci. Total. Environ. 2013, 465, 173–195. [Google Scholar] [CrossRef] [PubMed]
  30. Parton, W.J.; Holland, E.A.; Del Grosso, S.J.; Hartman, M.D.; Martin, R.E.; Mosier, A.R.; Ojima, D.S.; Schimel, D.S. Generalized model for NOxand N2O emissions from soils. J. Geophys. Res. Space Phys. 2001, 106, 17403–17419. [Google Scholar] [CrossRef]
  31. Li, Y.; Chen, D.; Zhang, Y.; Edis, R.; Ding, H. Comparison of three modeling approaches for simulating denitrification and nitrous oxide emissions from loam-textured arable soils. Glob. Biogeochem. Cycles 2005, 19, 1–15. [Google Scholar] [CrossRef]
  32. Arnold, J.G.; Srinivasan, R.; Muttiah, R.S.; Williams, J.R. Large area hydrologic modeling and assessment part I: Model development. JAWRA J. Am. Water Resour. Assoc. 1998, 34, 73–89. [Google Scholar] [CrossRef]
  33. Wu, L.; Rees, R.; Tarsitano, D.; Zhang, X.; Jones, S.; Whitmore, A. Simulation of nitrous oxide emissions at field scale using the SPACSYS model. Sci. Total. Environ. 2015, 530–531, 76–86. [Google Scholar] [CrossRef] [PubMed] [Green Version]
  34. Blackmer, A.M.; Bremner, J.M. Inhibitory effect of nitrate on reduction of N2O to N2 by soil microorganisms. Soil Biol. Biochem. 1978, 10, 187–191. [Google Scholar] [CrossRef]
  35. Williams, E.J.; Hutchinson, G.L.; Fehsenfeld, F.C. NOx and N2O Emissions from Soil. Glob. Biogeochem. Cycles 1992, 6, 351–388. [Google Scholar] [CrossRef]
  36. Bremner, J.M. Sources of nitrous oxide in soils. Nutr. Cycl. Agroecosystems 1997, 49, 7–16. [Google Scholar] [CrossRef]
  37. Chen, G.; Kolb, L.; Cavigelli, M.A.; Weil, R.R.; Hooks, C.R. Can conservation tillage reduce N2O emissions on cropland transitioning to organic vegetable production? Sci. Total. Environ. 2018, 618, 927–940. [Google Scholar] [CrossRef] [PubMed]
  38. Mehnaz, K.R.; Keitel, C.; Dijkstra, F.A. Effects of carbon and phosphorus addition on microbial respiration, N2O emission, and gross nitrogen mineralization in a phosphorus-limited grassland soil. Biol. Fertil. Soils 2018, 54, 481–493. [Google Scholar] [CrossRef]
  39. Butterbach-Bahl, K.; Baggs, E.M.; Dannenmann, M.; Kiese, R.; Zechmeister-Boltenstern, S. Nitrous oxide emissions from soils: How well do we understand the processes and their controls? Philos. Trans. R. Soc. B Biol. Sci. 2013, 368, 20130122. [Google Scholar] [CrossRef]
  40. Steinbach, H.S.; Alvarez, R. Changes in Soil Organic Carbon Contents and Nitrous Oxide Emissions after Introduction of No-Till in Pampean Agroecosystems. J. Environ. Qual. 2006, 35, 3–13. [Google Scholar] [CrossRef] [PubMed]
  41. Chen, N.; Liao, T.-T.; Wang, R.; Zheng, X.-H.; Hu, R.-G.; Butterbach-Bahl, K. Effect of carbon substrate concentration on N2, N2O, NO, CO2, and CH4 emissions from a paddy soil in anaerobic condition. Huan Jing Ke Xue 2014, 35, 3595–3604. [Google Scholar]
  42. Stein, L.Y.; Yung, Y.L. Production, isotopic composition, and atmospheric fate of biologically produced nitrous oxide. Annu. Rev. Earth Planet. Sci. 2003, 31, 329–356. [Google Scholar] [CrossRef]
  43. Benckiser, G.; Eilts, R.; Linn, A.; Lorch, H.J.; Sümer, E.; Weiske, A.; Wenzhöfer, F. N2O emissions from different cropping systems and from aerated, nitrifying and denitrifying tanks of a municipal waste water treatment plant. Biol. Fertil. Soils 1996, 23, 257–265. [Google Scholar] [CrossRef]
  44. Miller, M.N.; Zebarth, B.; Dandie, C.E.; Burton, D.L.; Goyer, C.; Trevors, J.T. Crop residue influence on denitrification, N2O emissions and denitrifier community abundance in soil. Soil Biol. Biochem. 2008, 40, 2553–2562. [Google Scholar] [CrossRef]
  45. Köster, J.R.; Cárdenas, L.M.; Bol, R.; Lewicka-Szczebak, D.; Senbayram, M.; Well, R.; Giesemann, A.; Dittert, K. Anaerobic digestates lower N2O emissions compared to cattle slurry by affecting rate and product stoichiometry of denitrification–An N2O isotopomer case study. Soil Biol. Biochem. 2015, 84, 65–74. [Google Scholar] [CrossRef]
  46. Ribas, A.; Mattana, S.; Llurba, R.; Debouk, H.; Sebastià, M.; Domene, X. Biochar application and summer temperatures reduce N2O and enhance CH4 emissions in a Mediterranean agroecosystem: Role of biologically-induced anoxic microsites. Sci. Total. Environ. 2019, 685, 1075–1086. [Google Scholar] [CrossRef] [PubMed]
  47. Feng, Z.; Zhu, L. Impact of biochar on soil N2O emissions under different biochar-carbon/fertilizer-nitrogen ratios at a constant moisture condition on a silt loam soil. Sci. Total. Environ. 2017, 584–585, 776–782. [Google Scholar] [CrossRef]
  48. Butterbach-Bahl, K.; Dannenmann, M. Denitrification and associated soil N2O emissions due to agricultural activities in a changing climate. Curr. Opin. Environ. Sustain. 2011, 3, 389–395. [Google Scholar] [CrossRef]
  49. Smith, K.A. Changing views of nitrous oxide emissions from agricultural soil: Key controlling processes and assessment at different spatial scales. Eur. J. Soil Sci. 2017, 68, 137–155. [Google Scholar] [CrossRef]
  50. Farquharson, R. Nitrification rates and associated nitrous oxide emissions from agricultural soils—A synopsis. Soil Res. 2016, 54, 469–480. [Google Scholar] [CrossRef]
  51. Bol, R.; Toyoda, S.; Yamulki, S.; Hawkins, J.M.B.; Cardenas, L.M.; Yoshida, N. Dual isotope and isotopomer ratios of N2O emitted from a temperate grassland soil after fertiliser application. Rapid Commun. Mass Spectrom. 2003, 17, 2550–2556. [Google Scholar] [CrossRef] [PubMed]
  52. Scholefield, D.; Hawkins, J.M.B.; Jackson, S.M. Use of a flowing helium atmosphere incubation technique to measure the effects of denitrification controls applied to intact cores of a clay soil. Soil Biol. Biochem. 1997, 29, 1337–1344. [Google Scholar] [CrossRef]
  53. Bateman, E.J.; Baggs, E.M. Contributions of nitrification and denitrification to N2O emissions from soils at different water-filled pore space. Biol. Fertil. Soils 2005, 41, 379–388. [Google Scholar] [CrossRef]
  54. Ciarlo, E.; Conti, M.; Bartoloni, N.; Rubio, G. The effect of moisture on nitrous oxide emissions from soil and the N2O/(N2O+N2) ratio under laboratory conditions. Biol. Fertil. Soils 2006, 43, 675–681. [Google Scholar] [CrossRef]
  55. Friedl, J.; Scheer, C.; Rowlings, D.W.; McIntosh, H.V.; Strazzabosco, A.; Warner, D.I.; Grace, P.R. Denitrification losses from an intensively managed sub-tropical pasture–Impact of soil moisture on the partitioning of N2 and N2O emissions. Soil Biol. Biochem. 2016, 92, 58–66. [Google Scholar] [CrossRef]
  56. Ruser, R.; Flessa, H.; Russow, R.; Schmidt, G.; Buegger, F.; Munch, J. Emission of N2O, N2 and CO2 from soil fertilized with nitrate: Effect of compaction, soil moisture and rewetting. Soil Biol. Biochem. 2006, 38, 263–274. [Google Scholar] [CrossRef]
  57. Wu, D.; Cárdenas, L.M.; Calvet, S.; Brüggemann, N.; Loick, N.; Liu, S.; Bol, R. The effect of nitrification inhibitor on N2O, NO and N2 emissions under different soil moisture levels in a permanent grassland soil. Soil Biol. Biochem. 2017, 113, 153–160. [Google Scholar] [CrossRef]
  58. Choudhary, M.A.; Akramkhanov, A.; Saggar, S. Nitrous oxide emissions in soils cropped with maize under long-term tillage and under permanent pasture in New Zealand. Soil Tillage Res. 2001, 62, 61–71. [Google Scholar] [CrossRef]
  59. Schwenke, G.D.; Haigh, B.M. The interaction of seasonal rainfall and nitrogen fertiliser rate on soil N2O emission, total N loss and crop yield of dryland sorghum and sunflower grown on sub-tropical Vertosols. Soil Res. 2016, 54, 604–618. [Google Scholar] [CrossRef] [Green Version]
  60. Lesschen, J.P.; Velthof, G.L.; De Vries, W.; Kros, J. Differentiation of nitrous oxide emission factors for agricultural soils. Environ. Pollut. 2011, 159, 3215–3222. [Google Scholar] [CrossRef] [PubMed]
  61. Meurer, K.H.; Franko, U.; Stange, C.F.; Dalla Rosa, J.; Madari, B.E.; Jungkunst, H.F. Direct nitrous oxide (N2O) fluxes from soils under different land use in Brazil—A critical review. Environ. Res. Lett. 2016, 11, 23001. [Google Scholar] [CrossRef]
  62. Xu, Y.; Xu, Z.; Cai, Z.; Reverchon, F. Review of denitrification in tropical and subtropical soils of terrestrial ecosystems. J. Soils Sediments 2013, 13, 699–710. [Google Scholar] [CrossRef]
  63. Hefting, M.M.; Bobbink, R.; De Caluwe, H. Nitrous Oxide Emission and Denitrification in Chronically Nitrate-Loaded Riparian Buffer Zones. J. Environ. Qual. 2003, 32, 1194–1203. [Google Scholar] [CrossRef]
  64. Hénault, C.; Grossel, A.; Mary, B.; Roussel, M.; Léonard, J. Nitrous Oxide Emission by Agricultural Soils: A Review of Spatial and Temporal Variability for Mitigation. Pedosphere 2012, 22, 426–433. [Google Scholar] [CrossRef]
  65. Lai, T.V.; Farquharson, R.; Denton, M.D. High soil temperatures alter the rates of nitrification, denitrification and associated N2O emissions. J. Soils Sediments 2019, 19, 2176–2189. [Google Scholar] [CrossRef]
  66. Prentice, I.C. Terrestrial nitrogen cycle simulation with a dynamic global vegetation model. Glob. Chang. Biol. 2008, 14, 1745–1764. [Google Scholar] [CrossRef]
  67. Lai, T.V.; Denton, M.D. N2O and N2 emissions from denitrification respond differently to temperature and nitrogen supply. J. Soils Sediments 2018, 18, 1548–1557. [Google Scholar] [CrossRef]
  68. Sun, X.; Han, X.; Ping, F.; Zhang, L.; Zhang, K.; Chen, M.; Wu, W. Effect of rice-straw biochar on nitrous oxide emissions from paddy soils under elevated CO2 and temperature. Sci. Total. Environ. 2018, 628, 1009–1016. [Google Scholar] [CrossRef] [PubMed]
  69. Vargas, V.P.; Soares, J.R.; Oliveira, B.G.; Lourenço, K.S.; Martins, A.A.; Del Grosso, S.J.; Carmo, J.B.D.; Cantarella, H. Sugarcane Straw, Soil Temperature, and Nitrification Inhibitor Impact N2O Emissions from N Fertilizer. BioEnergy Res. 2019, 12, 801–812. [Google Scholar] [CrossRef]
  70. Maag, M.; Vinther, F. Nitrous oxide emission by nitrification and denitrification in different soil types and at different soil moisture contents and temperatures. Appl. Soil Ecol. 1996, 4, 5–14. [Google Scholar] [CrossRef]
  71. Lassey, K.; Harvey, M. Nitrous oxide: The serious side of laughing gas. Water Atmos. 2007, 15, 10–11. Available online: https://niwa.co.nz/sites/niwa.co.nz/files/import/attachments/oxide.pdf (accessed on 26 February 2019).
  72. Clough, T.J.; Sherlock, R.R.; Kelliher, F.M. Can liming mitigate N2O fluxes from a urine-amended soil? Soil Res. 2003, 41, 439–457. [Google Scholar] [CrossRef]
  73. Šimek, M.; Cooper, J.E. The influence of soil pH on denitrification: Progress towards the understanding of this interaction over the last 50 years. Eur. J. Soil Sci. 2002, 53, 345–354. [Google Scholar] [CrossRef]
  74. Rochester, I.J. Estimating nitrous oxide emissions from flood-irrigated alkaline grey clays. Soil Res. 2003, 41, 197–206. [Google Scholar] [CrossRef]
  75. Šimek, M.; Jíšová, L.; Hopkins, D.W. What is the so-called optimum pH for denitrification in soil? Soil Biol. Biochem. 2002, 34, 1227–1234. [Google Scholar] [CrossRef]
  76. Tsuneda, S.; Mikami, M.; Kimochi, Y.; Hirata, A. Effect of salinity on nitrous oxide emission in the biological nitrogen removal process for industrial wastewater. J. Hazard. Mater. 2005, 119, 93–98. [Google Scholar] [CrossRef] [PubMed]
  77. Wei, Q.; Xu, J.; Liao, L.; Li, Y.; Wang, H.; Rahim, S.F. Water Salinity Should Be Reduced for Irrigation to Minimize Its Risk of Increased Soil N2O Emissions. Int. J. Environ. Res. Public Health 2018, 15, 2114. [Google Scholar] [CrossRef] [PubMed] [Green Version]
  78. Bell, M.J.; Cloy, J.M.; Topp, C.F.E.; Ball, B.C.; Bagnall, A.; Rees, R.M.; Chadwick, D.R. Quantifying N2O emissions from intensive grassland production: The role of synthetic fertilizer type, application rate, timing and nitrification inhibitors. J. Agric. Sci. 2016, 154, 812–827. [Google Scholar] [CrossRef] [Green Version]
  79. Snyder, C.; Bruulsema, T.; Jensen, T.; Fixen, P. Review of greenhouse gas emissions from crop production systems and fertilizer management effects. Agric. Ecosyst. Environ. 2009, 133, 247–266. [Google Scholar] [CrossRef]
  80. Zimmermann, J.; Carolan, R.; Forrestal, P.; Harty, M.; Lanigan, G.; Richards, K.; Roche, L.; Whitfield, M.; Jones, M. Assessing the performance of three frequently used biogeochemical models when simulating N2O emissions from a range of soil types and fertiliser treatments. Geochemistry 2018, 331, 53–69. [Google Scholar] [CrossRef]
  81. Leip, A.; Busto, M.; Winiwarter, W. Developing spatially stratified N2O emission factors for Europe. Environ. Pollut. 2011, 159, 3223–3232. [Google Scholar] [CrossRef] [PubMed]
  82. Dechow, R.; Freibauer, A. Assessment of German nitrous oxide emissions using empirical modelling approaches. Nutr. Cycl. Agroecosystems 2011, 91, 235–254. [Google Scholar] [CrossRef]
  83. Hoben, J.P.; Gehl, R.J.; Millar, N.; Grace, P.R.; Robertson, G.P. Nonlinear nitrous oxide (N2O) response to nitrogen fertilizer in on-farm corn crops of the US Midwest. Glob. Chang. Biol. 2010, 17, 1140–1152. [Google Scholar] [CrossRef]
  84. Cheng, J.; Lee, X.; Zhou, Z.; Wang, B.; Xing, Y.; Cheng, H. Nitrous oxide emissions from different land use patterns in a typical karst region, Southwest China. Chin. J. Geochem. 2013, 32, 137–145. [Google Scholar] [CrossRef]
  85. de Morais, R.F.; Boddey, R.M.; Urquiaga, S.; Jantalia, C.P.; Alves, B.J. Ammonia volatilization and nitrous oxide emissions during soil preparation and N fertilization of elephant grass (Pennisetum purpureum Schum.). Soil Biol. Biochem. 2013, 64, 80–88. [Google Scholar] [CrossRef]
  86. Pal, P.; Clough, T.J.; Kelliher, F.M.; Sherlock, R.R. Nitrous Oxide Emissions from In Situ Deposition of 15 N-Labeled Ryegrass Litter in a Pasture Soil. J. Environ. Qual. 2013, 42, 323–331. [Google Scholar] [CrossRef] [Green Version]
  87. Gao, B.; Ju, X.; Su, F.; Meng, Q.; Oenema, O.; Christie, P.; Chen, X.; Zhang, F. Nitrous oxide and methane emissions from optimized and alternative cereal cropping systems on the North China Plain: A two-year field study. Sci. Total. Environ. 2014, 472, 112–124. [Google Scholar] [CrossRef] [PubMed]
  88. Lebender, U.; Senbayram, M.; Lammel, J.; Kuhlmann, H. Impact of mineral N fertilizer application rates on N2O emissions from arable soils under winter wheat. Nutr. Cycl. Agroecosyst. 2014, 100, 111–120. [Google Scholar] [CrossRef]
  89. Shi, Y.-F.; Wu, W.-L.; Meng, F.-Q.; Zheng, L.; Wang, D.-P.; Ye, H.; Ding, G.-W. Nitrous Oxide and Methane Fluxes during the Maize Season Under Optimized Management in Intensive Farming Systems of the North China Plain. Pedosphere 2014, 24, 487–497. [Google Scholar] [CrossRef]
  90. Sordi, A.; Dieckow, J.; Bayer, C.; Alburquerque, M.A.; Piva, J.T.; Zanatta, J.A.; Tomazi, M.; da Rosa, C.M.; de Moraes, A. Nitrous oxide emission factors for urine and dung patches in a subtropical Brazilian pastureland. Agric. Ecosyst. Environ. 2014, 190, 94–103. [Google Scholar] [CrossRef]
  91. Zhang, Y.; Mu, Y.; Zhou, Y.; Liu, J.; Zhang, C. Nitrous oxide emissions from maize–wheat field during 4 successive years in the North China Plain. Biogeosciences 2014, 11, 1717–1726. [Google Scholar] [CrossRef] [Green Version]
  92. Aita, C.; Schirmann, J.; Pujol, S.B.; Giacomini, S.J.; Rochette, P.; Angers, D.A.; Chantigny, M.H.; Gonzatto, R.; Giacomini, D.A.; Doneda, A.A. Reducing nitrous oxide emissions from a maize-wheat sequence by decreasing soil nitrate concentration: Effects of split application of pig slurry and dicyandiamide. Eur. J. Soil Sci. 2015, 66, 359–368. [Google Scholar] [CrossRef]
  93. Hinton, N.; Cloy, J.; Bell, M.; Chadwick, D.; Topp, C.; Rees, R. Managing fertiliser nitrogen to reduce nitrous oxide emissions and emission intensities from a cultivated Cambisol in Scotland. Geoderma Reg. 2015, 4, 55–65. [Google Scholar] [CrossRef]
  94. Huérfano, X.; Fuertes-Mendizábal, T.; Duñabeitia, M.K.; González-Murua, C.; Estavillo, J.M.; Menéndez, S. Splitting the application of 3,4-dimethylpyrazole phosphate (DMPP): Influence on greenhouse gases emissions and wheat yield and quality under humid Mediterranean conditions. Eur. J. Agron. 2015, 64, 47–57. [Google Scholar] [CrossRef]
  95. Martins, M.R.; Jantalia, C.P.; Polidoro, J.C.; Batista, J.N.; Alves, B.J.; Boddey, R.M.; Urquiaga, S. Nitrous oxide and ammonia emissions from N fertilization of maize crop under no-till in a Cerrado soil. Soil Tillage Res. 2015, 151, 75–81. [Google Scholar] [CrossRef]
  96. Shepherd, A.; Yan, X.; Nayak, D.; Newbold, J.; Moran, D.; Dhanoa, M.S.; Goulding, K.; Smith, P.; Cárdenas, L.M. Disaggregated N2O emission factors in China based on cropping parameters create a robust approach to the IPCC Tier 2 methodology. Atmos. Environ. 2015, 122, 272–281. [Google Scholar] [CrossRef] [Green Version]
  97. van der Weerden, T.; Cox, N.; Luo, J.; Di, H.; Podolyan, A.; Phillips, R.; Saggar, S.; de Klein, C.; Ettema, P.; Rys, G. Refining the New Zealand nitrous oxide emission factor for urea fertiliser and farm dairy effluent. Agric. Ecosyst. Environ. 2016, 222, 133–137. [Google Scholar] [CrossRef]
  98. Harty, M.; Forrestal, P.; Watson, C.; McGeough, K.; Carolan, R.; Elliot, C.; Krol, D.; Laughlin, R.; Richards, K.; Lanigan, G. Reducing nitrous oxide emissions by changing N fertiliser use from calcium ammonium nitrate (CAN) to urea based formulations. Sci. Total. Environ. 2016, 563–564, 576–586. [Google Scholar] [CrossRef] [PubMed] [Green Version]
  99. Krol, D.; Carolan, R.; Minet, E.; McGeough, K.; Watson, C.; Forrestal, P.; Lanigan, G.; Richards, K. Improving and disaggregating N2O emission factors for ruminant excreta on temperate pasture soils. Sci. Total. Environ. 2016, 568, 327–338. [Google Scholar] [CrossRef] [PubMed] [Green Version]
  100. Macdonald, B.C.T.; Denmead, O.T.; White, I.; Naylor, T.; Salter, B.; Wilson, S.R.; Griffith, D.W. Emissions of nitrogen gases from sugarcane soils. In Proceedings of the 2009 Conference of the Australian Society of Sugar Cane Technologists held at Ballina, Ballina, NSW, Australia, 5–8 May 2009; Australian Society of Sugar Cane Technologists. pp. 85–92. Available online: http://hdl.handle.net/11079/14180 (accessed on 4 March 2019).
  101. Roche, L.; Forrestal, P.; Lanigan, G.; Richards, K.; Shaw, L.; Wall, D. Impact of fertiliser nitrogen formulation, and N stabilisers on nitrous oxide emissions in spring barley. Agric. Ecosyst. Environ. 2016, 233, 229–237. [Google Scholar] [CrossRef]
  102. Faubert, P.; Lemay-Bélisle, C.; Bertrand, N.; Bouchard, S.; Chantigny, M.H.; Durocher, S.; Paré, M.C.; Rochette, P.; Tremblay, P.; Ziadi, N.; et al. Greenhouse gas emissions following land application of pulp and paper mill sludge on a clay loam soil. Agric. Ecosyst. Environ. 2017, 250, 102–112. [Google Scholar] [CrossRef] [Green Version]
  103. Forte, A.; Fagnano, M.; Fierro, A. Potential role of compost and green manure amendment to mitigate soil GHGs emissions in Mediterranean drip irrigated maize production systems. J. Environ. Manag. 2017, 192, 68–78. [Google Scholar] [CrossRef] [Green Version]
  104. Gillette, K.; Ma, L.; Malone, R.W.; Fang, Q.; Halvorson, A.D.; Hatfield, J.L.; Ahuja, L. Simulating N 2 O emissions under different tillage systems of irrigated corn using RZ-SHAW model. Soil Tillage Res. 2017, 165, 268–278. [Google Scholar] [CrossRef]
  105. Htun, Y.M.; Tong, Y.; Gao, P.; Xiaotang, J. Coupled effects of straw and nitrogen management on N 2 O and CH 4 emissions of rainfed agriculture in Northwest China. Atmos. Environ. 2017, 157, 156–166. [Google Scholar] [CrossRef]
  106. Laville, P.; Bosco, S.; Volpi, I.; Virgili, G.; Neri, S.; Continanza, D.; Bonari, E. Temporal integration of soil N2O fluxes: Validation of IPNOA station automatic chamber prototype. Environ. Monit. Assess. 2017, 189, 485. [Google Scholar] [CrossRef] [PubMed]
  107. Krauss, M.; Ruser, R.; Müller, T.; Hansen, S.; Mäder, P.; Gattinger, A. Impact of reduced tillage on greenhouse gas emissions and soil carbon stocks in an organic grass-clover ley-winter wheat cropping sequence. Agric. Ecosyst. Environ. 2017, 239, 324–333. [Google Scholar] [CrossRef] [PubMed]
  108. Pugesgaard, S.; Petersen, S.O.; Chirinda, N.; Olesen, J.E. Crop residues as driver for N2O emissions from a sandy loam soil. Agric. For. Meteorol. 2017, 233, 45–54. [Google Scholar] [CrossRef]
  109. Xie, B.; Gu, J.; Yu, J.; Han, G.; Zheng, X.; Xu, Y.; Lin, H. Effects of N Fertilizer Application on Soil N2O Emissions and CH4 Uptake: A Two-Year Study in an Apple Orchard in Eastern China. Atmosphere 2017, 8, 181. [Google Scholar] [CrossRef] [Green Version]
  110. Zhou, M.; Zhu, B.; Wang, X.; Wang, Y. Long-term field measurements of annual methane and nitrous oxide emissions from a Chinese subtropical wheat-rice rotation system. Soil Biol. Biochem. 2017, 115, 21–34. [Google Scholar] [CrossRef]
  111. Badagliacca, G.; Benítez, E.; Amato, G.; Badalucco, L.; Giambalvo, D.; Laudicina, V.A.; Ruisi, P. Long-term effects of contrasting tillage on soil organic carbon, nitrous oxide and ammonia emissions in a Mediterranean Vertisol under different crop sequences. Sci. Total. Environ. 2018, 619–620, 18–27. [Google Scholar] [CrossRef] [PubMed]
  112. Dong, D.; Kou, Y.; Yang, W.; Chen, G.; Xu, H. Effects of urease and nitrification inhibitors on nitrous oxide emissions and nitrifying/denitrifying microbial communities in a rainfed maize soil: A 6-year field observation. Soil Tillage Res. 2018, 180, 82–90. [Google Scholar] [CrossRef]
  113. Plaza-Bonilla, D.; Álvaro-Fuentes, J.; Bareche, J.; Pareja-Sánchez, E.; Justes, É.; Cantero-Martínez, C. No-tillage reduces long-term yield-scaled soil nitrous oxide emissions in rainfed Mediterranean agroecosystems: A field and modelling approach. Agric. Ecosyst. Environ. 2018, 262, 36–47. [Google Scholar] [CrossRef]
  114. Reinsch, T.; Loges, R.; Kluß, C.; Taube, F. Renovation and conversion of permanent grass-clover swards to pasture or crops: Effects on annual N 2 O emissions in the year after ploughing. Soil Tillage Res. 2018, 175, 119–129. [Google Scholar] [CrossRef]
  115. Simon, P.L.; Dieckow, J.; de Klein, C.A.; Zanatta, J.A.; van der Weerden, T.J.; Ramalho, B.; Bayer, C. Nitrous oxide emission factors from cattle urine and dung, and dicyandiamide (DCD) as a mitigation strategy in subtropical pastures. Agric. Ecosyst. Environ. 2018, 267, 74–82. [Google Scholar] [CrossRef]
  116. Campanha, M.M.; de Oliveira, A.D.; Marriel, I.E.; Neto, M.M.G.; Malaquias, J.V.; Landau, E.C.; Filho, M.R.D.A.; Ribeiro, F.P.; de Carvalho, A.M. Effect of soil tillage and N fertilization on N2O mitigation in maize in the Brazilian Cerrado. Sci. Total. Environ. 2019, 692, 1165–1174. [Google Scholar] [CrossRef] [PubMed]
  117. Kasper, M.; Foldal, C.; Kitzler, B.; Haas, E.; Strauss, P.; Eder, A.; Zechmeister-Boltenstern, S.; Amon, B. N2O emissions and NO3− leaching from two contrasting regions in Austria and influence of soil, crops and climate: A modelling approach. Nutr. Cycl. Agroecosystems 2019, 113, 95–111. [Google Scholar] [CrossRef] [Green Version]
  118. Mumford, M.; Rowlings, D.; Scheer, C.; De Rosa, D.; Grace, P. Effect of irrigation scheduling on nitrous oxide emissions in intensively managed pastures. Agric. Ecosyst. Environ. 2019, 272, 126–134. [Google Scholar] [CrossRef]
  119. Myrgiotis, V.; Williams, M.; Rees, R.M.; Topp, C.F. Estimating the soil N2O emission intensity of croplands in northwest Europe. Biogeosciences 2019, 16, 1641–1655. [Google Scholar] [CrossRef] [Green Version]
  120. Shen, J.; Treu, R.; Wang, J.; Hao, X.; Thomas, B.W. Modeling growing season and annual cumulative nitrous oxide emissions and emission factors from organically fertilized soils planted with barley in Lethbridge, Alberta, Canada. Agric. Syst. 2019, 176, 102654. [Google Scholar] [CrossRef]
  121. Zhang, X.; Meng, F.; Li, H.; Wang, L.; Wu, S.; Xiao, G.; Wu, W. Optimized fertigation maintains high yield and mitigates N2O and NO emissions in an intensified wheat–maize cropping system. Agric. Water Manag. 2019, 211, 26–36. [Google Scholar] [CrossRef]
  122. Baral, K.R.; Lærke, P.E.; Petersen, S.O. Nitrous oxide emissions after renovation of festulolium, and mitigation potential of 3,4-dimethyl pyrazole phosphate (DMPP). Geoderma 2020, 376, 114551. [Google Scholar] [CrossRef]
  123. Cowan, N.; Levy, P.; Maire, J.; Coyle, M.; Leeson, S.; Famulari, D.; Carozzi, M.; Nemitz, E.; Skiba, U. An evaluation of four years of nitrous oxide fluxes after application of ammonium nitrate and urea fertilisers measured using the eddy covariance method. Agric. For. Meteorol. 2020, 280, 107812. [Google Scholar] [CrossRef]
  124. Krol, D.; Forrestal, P.; Wall, D.; Lanigan, G.; Sanz-Gomez, J.; Richards, K. Nitrogen fertilisers with urease inhibitors reduce nitrous oxide and ammonia losses, while retaining yield in temperate grassland. Sci. Total. Environ. 2020, 725, 138329. [Google Scholar] [CrossRef] [PubMed]
  125. Kudeyarov, V.N. Nitrous Oxide Emission from Fertilized Soils: An Analytical Review. Eurasian Soil Sci. 2020, 53, 1396–1407. [Google Scholar] [CrossRef]
  126. Wang, R.; Pan, Z.; Zheng, X.; Ju, X.; Yao, Z.; Butterbach-Bahl, K.; Zhang, C.; Wei, H.; Huang, B. Using field-measured soil N2O fluxes and laboratory scale parameterization of N2O/(N2O+N2) ratios to quantify field-scale soil N2 emissions. Soil Biol. Biochem. 2020, 148, 107904. [Google Scholar] [CrossRef]
  127. Pareja-Sánchez, E.; Cantero-Martínez, C.; Álvaro-Fuentes, J.; Plaza-Bonilla, D. Impact of tillage and N fertilization rate on soil N2O emissions in irrigated maize in a Mediterranean agroecosystem. Agric. Ecosyst. Environ. 2020, 287, 106687. [Google Scholar] [CrossRef]
  128. Yang, Y.; Tong, Y.; Gao, P.; Htun, Y.M.; Feng, T. Evaluation of N2O emission from rainfed wheat field in northwest agricultural land in China. Environ. Sci. Pollut. Res. 2020, 27, 43466–43479. [Google Scholar] [CrossRef] [PubMed]
  129. Grave, R.A.; Nicoloso, R.D.S.; Cassol, P.C.; da Silva, M.L.B.; Mezzari, M.P.; Aita, C.; Wuaden, C.R. Determining the effects of tillage and nitrogen sources on soil N2O emission. Soil Tillage Res. 2018, 175, 1–12. [Google Scholar] [CrossRef]
  130. Chen, S.; Hao, T.; Goulding, K.; Misselbrook, T.; Liu, X. Impact of 13-years of nitrogen addition on nitrous oxide and methane fluxes and ecosystem respiration in a temperate grassland. Environ. Pollut. 2019, 252, 675–681. [Google Scholar] [CrossRef] [PubMed]
  131. Bordoloi, N.; Baruah, K.K.; Bhattacharyya, P. Emission estimation of nitrous oxide (N2O) from a wheat cropping system under varying tillage practices and different levels of nitrogen fertiliser. Soil Res. 2016, 54, 767–776. [Google Scholar] [CrossRef]
  132. Schwenke, G.D.; Haigh, B.M. Can split or delayed application of N fertiliser to grain sorghum reduce soil N2O emissions from sub-tropical Vertosols and maintain grain yields? Soil Res. 2019, 57, 859–874. [Google Scholar] [CrossRef]
  133. Yang, X.M.; Drury, C.F.; Reeb, M.R. No-Tillage had Warmer Over-Winter Soil Temperatures than Conventional Tillage in a Brookston Clay Loam Soils in Southwestern Ontario. Soil Sci. Soc. Am. J. 2018, 82, 307–314. [Google Scholar] [CrossRef]
  134. Žurovec, O.; Sitaula, B.K.; Čustović, H.; Žurovec, J.; Dörsch, P. Effects of tillage practice on soil structure, N2O emissions and economics in cereal production under current socio-economic conditions in central Bosnia and Herzegovina. PLoS ONE 2017, 12, e0187681. [Google Scholar] [CrossRef] [Green Version]
  135. Wang, J.; Chadwick, D.R.; Cheng, Y.; Yan, X. Global analysis of agricultural soil denitrification in response to fertilizer nitrogen. Sci. Total. Environ. 2018, 616–617, 908–917. [Google Scholar] [CrossRef]
  136. Duan, Y.-F.; Hallin, S.; Jones, C.M.; Priemé, A.; Labouriau, R.; Petersen, S.O. Catch Crop Residues Stimulate N2O Emissions during Spring, Without Affecting the Genetic Potential for Nitrite and N2O Reduction. Front. Microbiol. 2018, 9, 2629. [Google Scholar] [CrossRef] [PubMed]
  137. Yuan, M.; Greer, K.D.; Nafziger, E.D.; Villamil, M.B.; Pittelkow, C.M. Soil N2 O emissions as affected by long-term residue removal and no-till practices in continuous corn. GCB Bioenergy 2018, 10, 972–985. [Google Scholar] [CrossRef]
  138. Badagliacca, G.; Ruisi, P.; Rees, R.M.; Saia, S. An assessment of factors controlling N2O and CO2 emissions from crop residues using different measurement approaches. Biol. Fertil. Soils 2017, 53, 547–561. [Google Scholar] [CrossRef] [Green Version]
  139. Liu, F.; Zhang, Y.; Liang, H.; Gao, D. Long-term harvesting of reeds affects greenhouse gas emissions and microbial functional genes in alkaline wetlands. Water Res. 2019, 164, 114936. [Google Scholar] [CrossRef] [PubMed]
  140. da Silva Cardoso, A.; de Figueiredo Brito, L.; Janusckiewicz, E.R.; da Silva Morgado, E.; Barbero, R.P.; Koscheck, J.F.W.; Reis, R.A.; Ruggieri, A.C. Impact of Grazing Intensity and Seasons on Greenhouse Gas Emissions in Tropical Grassland. Ecosystems 2017, 20, 845–859. [Google Scholar] [CrossRef]
  141. Deng, J.; Li, C.; Burger, M.; Horwath, W.R.; Smart, D.; Six, J.; Guo, L.; Salas, W.; Frolking, S. Assessing Short-Term Impacts of Management Practices on N2O Emissions from Diverse Mediterranean Agricultural Ecosystems Using a Biogeochemical Model. J. Geophys. Res. Biogeosci. 2018, 123, 1557–1571. [Google Scholar] [CrossRef] [Green Version]
  142. Smith, K.A.; McTaggart, I.P.; Tsuruta, H. Emissions of N2O and NO associated with nitrogen fertilization in intensive agriculture, and the potential for mitigation. Soil Use Manag. 1997, 13, 296–304. [Google Scholar] [CrossRef]
  143. Trost, B.; Prochnow, A.; Drastig, K.; Meyer-Aurich, A.; Ellmer, F.; Baumecker, M. Irrigation, soil organic carbon and N2O emissions. A review. Agron. Sustain. Dev. 2013, 33, 733–749. [Google Scholar] [CrossRef] [Green Version]
  144. Sánchez-Martín, L.; Arce, A.; Benito, A.; Garcia-Torres, L.; Vallejo, A. Influence of drip and furrow irrigation systems on nitrogen oxide emissions from a horticultural crop. Soil Biol. Biochem. 2008, 40, 1698–1706. [Google Scholar] [CrossRef]
  145. Tang, J.; Wang, J.; Li, Z.; Wang, S.; Qu, Y. Effects of Irrigation Regime and Nitrogen Fertilizer Management on CH4, N2O and CO2 Emissions from Saline–Alkaline Paddy Fields in Northeast China. Sustainability 2018, 10, 475. [Google Scholar] [CrossRef] [Green Version]
  146. Ye, X.; Liu, H.; Zhang, X.; Ma, J.; Han, B.; Li, W.; Zou, H.; Zhang, Y.; Lin, X. Impacts of irrigation methods on greenhouse gas emissions/absorptions from vegetable soils. J. Soils Sediments 2019, 20, 723–733. [Google Scholar] [CrossRef]
  147. Shang, Z.; Abdalla, M.; Kuhnert, M.; Albanito, F.; Zhou, F.; Xia, L.; Smith, P. Measurement of N2O emissions over the whole year is necessary for estimating reliable emission factors. Environ. Pollut. 2020, 259, 113864. [Google Scholar] [CrossRef]
  148. Groffman, P.M.; Altabet, M.A.; Böhlke, J.K.; Butterbach-Bahl, K.; David, M.B.; Firestone, M.K.; Giblin, A.E.; Kana, T.M.; Nielsen, L.P.; Voytek, M.A. Methods for Measuring Denitrification: Diverse Approaches to a Difficult Problem. Ecol. Appl. 2006, 16, 2091–2122. [Google Scholar] [CrossRef]
  149. Beauchamp, E.G. Nitrous oxide emission from agricultural soils. Can. J. Soil Sci. 1997, 77, 113–123. [Google Scholar] [CrossRef]
  150. Skiba, U.; Hargreaves, K.; Fowler, D.; Smith, K. Fluxes of nitric and nitrous oxides from agricultural soils in a cool temperate climate. Atmos. Environ. Part A. Gen. Top. 1992, 26, 2477–2488. [Google Scholar] [CrossRef]
  151. Schäfer, K.G.; Böttcher, J.; Weymann, D.; Von Der Heide, C.; Duijnisveld, W.H.M. Evaluation of a Closed Tunnel for Field-Scale Measurements of Nitrous Oxide Fluxes from an Unfertilized Grassland Soil. J. Environ. Qual. 2012, 41, 1383–1392. [Google Scholar] [CrossRef] [PubMed]
  152. Venterea, R.T. Simplified Method for Quantifying Theoretical Underestimation of Chamber-Based Trace Gas Fluxes. J. Environ. Qual. 2010, 39, 126–135. [Google Scholar] [CrossRef] [PubMed] [Green Version]
  153. Hensen, A.; Skiba, U.; Famulari, D. Low cost and state of the art methods to measure nitrous oxide emissions. Environ. Res. Lett. 2013, 8, 025022. [Google Scholar] [CrossRef]
  154. Adu, J.; Kumarasamy, M.V. Assessing Non-Point Source Pollution Models: A Review. Pol. J. Environ. Stud. 2018, 27, 1913–1922. [Google Scholar] [CrossRef]
  155. Frolking, S.; Mosier, A.; Ojima, D.; Li, C.; Parton, W.; Potter, C.; Priesack, E.; Stenger, R.; Haberbosch, C.; Dörsch, P.; et al. Comparison of N2O emissions from soils at three temperate agricultural sites: Simulations of year-round measurements by four models. Nutr. Cycl. Agroecosyst. 1998, 52, 77–105. [Google Scholar] [CrossRef]
  156. Heinen, M. Simplified denitrification models: Overview and properties. Geoderma 2006, 133, 444–463. [Google Scholar] [CrossRef]
  157. Li, X.; Yeluripati, J.; Jones, E.O.; Uchida, Y.; Hatano, R. Hierarchical Bayesian calibration of nitrous oxide (N2O) and nitrogen monoxide (NO) flux module of an agro-ecosystem model: ECOSSE. Ecol. Model. 2015, 316, 14–27. [Google Scholar] [CrossRef]
  158. Snow, V.; Rotz, C.; Moore, A.; Martin-Clouaire, R.; Johnson, I.; Hutchings, N.; Eckard, R. The challenges–and some solutions–to process-based modelling of grazed agricultural systems. Environ. Model. Softw. 2014, 62, 420–436. [Google Scholar] [CrossRef]
  159. Williams, J.R.; Izaurralde, R.C.; Steglich, E.M. Agricultural policy/environmental extender model. Theor. Doc. 2008, 604, 2008–2017. Available online: https://agrilifecdn.tamu.edu/epicapex/files/2017/03/THE-APEX0806-theoretical-documentation-Oct-2015.pdf (accessed on 21 December 2018).
  160. Lehuger, S.; Gabrielle, B.; Van Oijen, M.; Makowski, D.; Germon, J.-C.; Morvan, T.; Hénault, C. Bayesian calibration of the nitrous oxide emission module of an agro-ecosystem model. Agric. Ecosyst. Environ. 2009, 133, 208–222. [Google Scholar] [CrossRef] [Green Version]
  161. Youssef, M.A.; Skaggs, R.W.; Chescheir, G.M.; Gilliam, J.W. The nitrogen simulation model, DRAINMOD-N II. Trans. ASAE 2005, 48, 611–626. [Google Scholar] [CrossRef]
  162. Gassman, P.W.; Williams, J.R.; Benson, V.W.; Izaurralde, R.C.; Hauck, L.M.; Jones, C.A.; Atwood, J.D.; Kiniry, J.R.; Flowers, J.D. Historical development and applications of the EPIC and APEX models. In Proceedings of the 2005 ASAE Annual Meeting (p. 1). American Society of Agricultural and Biological Engineers, Ottawa, ON, Canada, 1–4 August 2004; p. 1. [Google Scholar] [CrossRef] [Green Version]
  163. Chatskikh, D.; Olesen, J.E.; Berntsen, J.; Regina, K.; Yamulki, S. Simulation of Effects of Soils, Climate and Management on N2O Emission from Grasslands. Biogeochemistry 2005, 76, 395–419. [Google Scholar] [CrossRef] [Green Version]
  164. Zhang, K.; Peng, C.; Wang, M.; Zhou, X.; Li, M.; Wang, K.; Ding, J.; Zhu, Q. Process-based TRIPLEX-GHG model for simulating N2O emissions from global forests and grasslands: Model development and evaluation. J. Adv. Model. Earth Syst. 2017, 9, 2079–2102. [Google Scholar] [CrossRef]
  165. Adams, H.D.; Williams, A.P.; Xu, C.; Rauscher, S.A.; Jiang, X.; McDowell, N.G. Empirical and process-based approaches to climate-induced forest mortality models. Front. Plant Sci. 2013, 4, 438. [Google Scholar] [CrossRef] [Green Version]
  166. Izaurralde, R.C.; McGill, W.B.; Williams, J.R.; Jones, C.D.; Link, R.P.; Manowitz, D.H.; Schwab, D.E.; Zhang, X.; Robertson, G.P.; Millar, N. Simulating microbial denitrification with EPIC: Model description and evaluation. Ecol. Model. 2017, 359, 349–362. [Google Scholar] [CrossRef]
  167. Foltz, M.E.; Zilles, J.L.; Koloutsou-Vakakis, S. Prediction of N2O emissions under different field management practices and climate conditions. Sci. Total. Environ. 2019, 646, 872–879. [Google Scholar] [CrossRef]
  168. Bouraoui, F.; Grizzetti, B. Modelling mitigation options to reduce diffuse nitrogen water pollution from agriculture. Sci. Total. Environ. 2014, 468–469, 1267–1277. [Google Scholar] [CrossRef] [PubMed]
  169. Shrestha, N.K.; Thomas, B.W.; Du, X.; Hao, X.; Wang, J. Modeling nitrous oxide emissions from rough fescue grassland soils subjected to long-term grazing of different intensities using the Soil and Water Assessment Tool (SWAT). Environ. Sci. Pollut. Res. 2018, 25, 27362–27377. [Google Scholar] [CrossRef] [PubMed]
  170. Shrestha, N.K.; Wang, J. Current and future hot-spots and hot-moments of nitrous oxide emission in a cold climate river basin. Environ. Pollut. 2018, 239, 648–660. [Google Scholar] [CrossRef] [PubMed]
  171. Tian, H.; Yang, J.; Lu, C.; Xu, R.; Canadell, J.G.; Jackson, R.B.; Arneth, A.; Chang, J.; Chen, G.; Ciais, P.; et al. The global N2O Model Intercomparison Project. Bull. Am. Meteorol. Soc. 2018, 99, 1231–1251. [Google Scholar] [CrossRef] [Green Version]
  172. Li, C. User’s Guide for the DNDC Model (Version 9.5) 2012. University of New Hampshire. Available online: http://www.dndc.sr.unh.edu/model/GuideDNDC95.pdf (accessed on 25 January 2020).
  173. Neitsch, S.L.; Arnold, J.G.; Kiniry, J.R.; Williams, J.R. Soil and water assessment tool theoretical documentation version 2009. Texas Wat. Resour. Inst. 2011. Available online: https://swat.tamu.edu/media/99192/swat2009-theory.pdf (accessed on 9 March 2018).
  174. Yang, Q.; Zhang, X.; Abraha, M.; Del Grosso, S.; Robertson, G.P.; Chen, J. Enhancing the soil and water assessment tool model for simulating N2O emissions of three agricultural systems. Ecosyst. Health Sustain. 2017, 3, e01259. [Google Scholar] [CrossRef] [Green Version]
  175. Wagena, M.B.; Bock, E.M.; Sommerlot, A.R.; Fuka, D.R.; Easton, Z.M. Development of a nitrous oxide routine for the SWAT model to assess greenhouse gas emissions from agroecosystems. Environ. Model. Softw. 2017, 89, 131–143. [Google Scholar] [CrossRef] [Green Version]
  176. David, M.B.; Del Grosso, S.J.; Hu, X.; Marshall, E.P.; McIsaac, G.F.; Parton, W.J.; Tonitto, C.; Youssef, M.A. Modeling denitrification in a tile-drained, corn and soybean agroecosystem of Illinois, USA. Biogeochemistry 2009, 93, 7–30. [Google Scholar] [CrossRef]
  177. Del Grosso, S.J.; Parton, W.J.; Adler, P.R.; Davis, S.C.; Keough, C.; Marx, E. DayCent model simulations for estimating soil carbon dynamics and greenhouse gas fluxes from agricultural production systems. In Managing Agricultural Greenhouse Gases: Coordinated Agricultural Research through GRACEnet to Address our Changing Climate; Academic Press: San Diego, CA, USA, 2012; pp. 241–250. [Google Scholar]
  178. Bosatta, E. A qualitative analysis of the stability of the root-microorganism soil system I. carbon-nitrogen status and nitrogen mineralization. Ecol. Model. 1981, 13, 223–236. [Google Scholar] [CrossRef]
  179. Cui, F.; Zheng, X.; Liu, C.; Wang, K.; Zhou, Z.; Deng, J. Assessing biogeochemical effects and best management practice for a wheat–maize cropping system using the DNDC model. Biogeosciences 2014, 11, 91–107. [Google Scholar] [CrossRef] [Green Version]
  180. Gaillard, R.K.; Jones, C.D.; Ingraham, P.; Collier, S.; Izaurralde, R.C.; Jokela, W.; Osterholz, W.; Salas, W.; Vadas, P.; Ruark, M.D. Underestimation of N2 O emissions in a comparison of the DayCent, DNDC, and EPIC models. Ecol. Appl. 2018, 28, 694–708. [Google Scholar] [CrossRef]
  181. Fitton, N.; Datta, A.; Smith, K.; Williams, J.R.; Hastings, A.; Kuhnert, M.; Topp, C.F.E.; Smith, P. Assessing the sensitivity of modelled estimates of N2O emissions and yield to input uncertainty at a UK cropland experimental site using the DailyDayCent model. Nutr. Cycl. Agroecosyst. 2014, 99, 119–133. [Google Scholar] [CrossRef]
  182. Necpálová, M.; Anex, R.P.; Fienen, M.N.; Del Grosso, S.J.; Castellano, M.J.; Sawyer, J.E.; Iqbal, J.; Pantoja, J.L.; Barker, D.W. Understanding the DayCent model: Calibration, sensitivity, and identifiability through inverse modeling. Environ. Model. Softw. 2015, 66, 110–130. [Google Scholar] [CrossRef] [Green Version]
  183. Myrgiotis, V.; Rees, R.M.; Topp, C.F.; Williams, M. A systematic approach to identifying key parameters and processes in agroecosystem models. Ecol. Model. 2018, 368, 344–356. [Google Scholar] [CrossRef] [Green Version]
  184. Wang, G.; Chen, S. A review on parameterization and uncertainty in modeling greenhouse gas emissions from soil. Geoderma 2012, 170, 206–216. [Google Scholar] [CrossRef]
  185. Myrgiotis, V.; Williams, M.; Rees, R.M.; Smith, K.E.; Thorman, R.E.; Topp, C.F. Model evaluation in relation to soil N2O emissions: An algorithmic method which accounts for variability in measurements and possible time lags. Environ. Model. Softw. 2016, 84, 251–262. [Google Scholar] [CrossRef] [Green Version]
Figure 1. Principle N transformations leading to the emission of N2O in soils.
Agronomy 11 00770 g001
Figure 2. Peer-reviewed publications on N2O and agriculture since 1990 searched in the SCOPUS database.
Agronomy 11 00770 g002
Figure 3. Schematic diagram of the impact factors on N2O emissions, their interactions, and how they may be considered in modelling N2O emissions. Color indicates which management factor affects which environmental factors.
Agronomy 11 00770 g003
Figure 4. The impact of soil NH4+ (A), soil temperature (B), soil pH (C) and WFPS (D) on nitrification processes in DAYCENT, DNDC and SWAT.
Agronomy 11 00770 g004
Figure 5. The impact of soil NO3 (A), soil respiration (B), soil temperature (C), and WFPS (D) on denitrification processes in DAYCENT, DNDC and SWAT.
Agronomy 11 00770 g005
Figure 6. The impact of soil NO3 (A), soil respiration (B), WFPS (C), and soil pH (D) on the N2/N2O ratio in DAYCENT and DNDC. The DNDC model shows the impact of soil pH on each nitrogenous oxide (D).
Agronomy 11 00770 g006
Table 1. Impact factors that directly and indirectly influence N2O emissions from managed soils.
Environmental FactorsManagement FactorsMeasurement Factors
Microbial populationFertilizer applicationLength of measurement period
Soil available carbonTillage systemTypes of measurements
Soil N concentrationHarvest and crop residues
Soil moistureIrrigation
Soil texture
Soil temperature
Soil pH and salinity
Table 2. The relationships between environmental factors and N2O emissions.
ProcessesSoil NSOCSoil Moisture
(Water-Filled-Pore-Space (WFPS))
Soil TemperatureSoil pH
Nitrification++~60%: ++Need more research
Denitrification++60–80%: ++Need more research
N2/N2O ratio+ (depends on N)>90%: ++<6.0: more N2O; =6.0:equivalent;
>6.0: more N2
Table 3. The emission factor (EF) for N2O as reported in the literature.
SourceCropsEF (%)CountryFertilizer TypeSoil TypeN Fertilizer (kg/ha)
Rochester et al. [74]Cotton1.1AustraliaMineral NClay180
Dechow et al. [82]Grassland0.92GermanyMineral N 100
Cropland0.9GermanyMineral N 0–225
Hoben et al. [83]Corn0.6–1.5USAMineral NLoam0–225
Lesschen et al. [60]Grassland1.1EuropeMineral N 300–400
Grassland0.83NetherlandsOrganic N
Cheng et al. [84]Corn0.34ChinaMineral NSand266
de Morais et al. [85]Grassland0.51BrazilMineral NClay80/100
Pal et al. [86]Pasture1.2New ZealandOrganic NClay loam213
Gao et al. [87]Winter wheat0.17ChinaMineral NSilty loam300
Corn0.53ChinaMineral NSilty loam250
Lebender et al. [88]Winter wheat0.46GermanyMineral N
Shi et al. [89]Corn0.42ChinaMineral NSandy loam300
Corn0.29ChinaMineral NSandy loam186
Sordi et al. [90]Pasture0.15BrazilOrganic NClay
Pasture0.26BrazilOrganic NClay
Zhang et al. [91]Corn2.5ChinaMineral NClay173
Winter wheat2ChinaMineral NClay165
Aita et al. [92]Corn1.39BrazilMineral NLoam130
Corn1.18BrazilOrganic NLoam333
Winter wheat1.14BrazilMineral NLoam110
Winter wheat1.55BrazilOrganic NLoam269
Hinton et al. [93]Spring barley1.35UKMineral NSandy loam120
Huérfano et al. [94]Winter wheat0.21SpainMineral NClay loam180
Martins et al. [95]Corn0.2BrazilMineral NSandy loam120
Shepherd et al. [96]Corn1.4ChinaMineral NClay150
Wheat0.71ChinaMineral NSilty clay150
Wheat1ChinaMineral NClay loam150
Bell et al. [78]Grassland1.06–1.34UKMineral NSandy loam80–320
Van der Weerden et al. [97]Pasture0.6New ZealandMineral N 50
Pasture0.3New ZealandOrganic N 101
Harty et al. [98]Pasture1.49IrelandMineral NClay/sandy loam200
Krol et al. [99]Grassland0.31IrelandOrganic NSandy loam280
Grassland1.18IrelandOrganic NSandy loam507
Macdonald et al. [100]Sugarcane3AustraliaMineral NSandy loam
Roche et al. [101]Spring barley0.35IrelandMineral NLoam150
Spring barley0.27IrelandMineral NLoam
Faubert et al. [102]Spring barley0.8–3.1CanadaOrganic NClay loam90–120
Forte et al. [103]Corn0.55ItalyMineral NSandy-clay-loam130
Gillette et al. [104]Corn0.66USAMineral NClay loam224
Corn0.75USAMineral NClay loam246
Htun et al. [105]Winter wheat0.43ChinaMineral NSilty loam220
Laville et al. [106]Corn1.8ItalyMineral NSandy loam170
Krauss et al. [107]Winter wheat1.64SwitzerlandOrganic NClay
Grassland0.71SwitzerlandOrganic N
Pugesgaard et al. [108]Spring barley0.65DenmarkOrganic NSandy loam150
Xie et al. [109]Apple orchard1.34ChinaOrganic NSand
Zhou et al. [110]Wheat1.05ChinaMineral NLoam0–250
Badagliacca et al. [111]Winter wheat~1.9ItalyMineral NClay120
Dong et al. [112]Corn0.308ChinaMineral NClay180
Plaza-Bonilla et al. [113]Winter wheat~0.57SpainMineral NLoam0–120
Reinsch et al. [114]Grassland0.27GermanyOrganic NSandy loam180
Corn0.74GermanyOrganic NSandy loam180
Simon et al. [115]Pasture0.34BrazilOrganic NClay516
Pasture0.11BrazilOrganic NClay
Campanha et al. [116]Corn0.96BrazilMineral NClay0–275
Kasper et al. [117]Corn0.71AustriaMineral NClay loam
Mumford et al. [118]Pasture0.49–1.17AustraliaMineral NClay340
Myrgiotis et al. [119]Winter wheat0.25UKMineral N
Spring barley0.57UKMineral N
Shen et al. [120]Spring barley0.085–1.1CanadaOrganic NClay loam100–800
Zhang et al. [121]Winter wheat0.19–0.25ChinaMineral NLoam420/600
Corn0.38–0.63ChinaMineral NLoam
Baral et al. [122]Spring barley0.53DenmarkMineral NSand169
Cowan et al. [123]Grassland0.9UKMineral NClay20–220
Krol et a. [124]Grassland0.58IrelandMineral NLoam200
Kudeyarov et al. [125]Cereal crops0.66–0.7RussiaMineral N 67
Wang et al. [126]Corn1.85ChinaMineral NClay loam130
Pareja-Sanchez et al. [127]Corn0.2SpainMineral NSandy loam0/60/120
Yang et al. [128]Winter wheat0.41ChinaMineral NSilty loam220
The blank cells in the soil type and N fertilizer columns indicate that the EFs are the average value of different soil types and N fertilizer application. The EFs are mean values for the range of N fertilizer.
Table 4. Dynamic models used to simulate nitrification and denitrification in agricultural fields and the impact factors considered.
ModelDescriptionNitrificationDenitrificationReference
NSOCWFPSTpHNSOCWFPSTpH
APEXAPEX is a field-scale model and is used to evaluate various land management strategies at a daily time step. Williams et al. [159]
CERES_EGCCERES-EGC is a field-scale and process-based agro-ecosystem model and is used to simulate NO3 leaching, emissions of N2O and nitrogen oxides at a daily time step. Lehuger et al. [160]
Daily Century (DAYCENT)DAYCENT is the daily time step version of the CENTURY, and is used to simulate exchanges of C, nutrients, and trace gases among the atmosphere, soil and plants. Parton et al. [30]
DNDCDNDC is a field-scale and process-based model and is used to study N and C dynamics in agroecosystems at daily time step. Li et al. [31]
DRAINMOD-N IIDRAINMOD-N II is a field-scale, daily time step and process-based model and is used to simulate C and N dynamics for artificially drained soils. Youssef et al. [161]
EPICEPIC is a field-scale agroecosystem model that simulates crop production. Gassman et al. [162]
FASSETFASSET is used to simulate crop growth and yield, as well as daily soil N and C fluxes in the plant–soil–atmosphere continuum. Chatskikh et al. [163]
SPACSYSSPACSYS is a field-scale model and is used to simulate daily N and C emissions from arable land and grassland. Wu et al. [33]
SWATSWAT is a field or catchment scale, process based model and is run at the daily time step for simulating the impacts of agricultural management practices on hydrology and water quality. Arnold et al. [32]
TRIPLEX_GHGTRIPLEX-GHG is developed to simulate N2O emissions from global forests and grassland. Zhang et al. [164]
where N is the N concentration and T is the soil temperature. √ indicates the impact factor is considered.
Table 5. Summary of three process-based models in simulating N2O emissions.
ModelInput DataPhysical Processes and Products PartitioningConsidered Environmental Factors
DAYCENTDaily weather variables, site-specific soil properties, and land use. NitrificationSoil N, temperature, WFPS and pH
DenitrificationSoil N, SOC and WFPS
N2/N2OSoil N, SOC and WFPS
NOx/N2OSoil WFPS
DNDCDaily weather variables, soil properties, and management practices. NitrificationNitrifiers, soil N, WFPS, temperature, and pH
DenitrificationDe-nitrifiers, SOC, soil N, temperature, and pH
NOx, N2Soil pH
SWATDEM, soil properties, daily weather variables, and management practices.NitrificationSoil N, WFPS, temperature and pH
DenitrificationSoil N, SOC, moisture, temperature and pH
Publisher’s Note: MDPI stays neutral with regard to jurisdictional claims in published maps and institutional affiliations.

