Article

Effect of a Newly-Developed Nutrient Solution and Electrical Conductivity on Growth and Bioactive Compounds in Perilla frutescens var. crispa

1
Division of Animal, Horticultural and Food Sciences, Chungbuk National University, Cheongju 28644, Korea
2
Brain Korea 21 Center for Bio-Health Industry, Chungbuk National University, Cheongju 28644, Korea
*
Author to whom correspondence should be addressed.
Agronomy 2021, 11(5), 932; https://doi.org/10.3390/agronomy11050932
Submission received: 19 April 2021 / Revised: 3 May 2021 / Accepted: 5 May 2021 / Published: 9 May 2021

Abstract

:
We evaluated the effect of a newly-developed nutrient solution of red perilla (NSP) with various electrical conductivity (EC) levels on plant growth, mineral content, and bioactive compounds. Four-week-old seedlings were grown in greenhouse nutrient solution as control (CT) (EC 1–3 dS m−1) or NSP (EC 1–6 dS m−1). NSP 1 dS m−1 induced better growth characteristics, whereas higher EC levels inhibited plant growth. Most of the macro-elements contents significantly decreased under NSP 6 dS m−1, whereas the micro-elements contents fluctuated according to EC levels. Total phenolic concentration in NSP was lower than that in CT, and total phenolic content was highest under NSP 1 dS m−1. Total anthocyanin and antioxidant concentrations and contents increased at lower EC levels. Rosmarinic and caffeic acids concentrations increased at higher EC levels, whereas there were no significant differences in these compound contents among the EC levels. No difference in perillaldehyde concentration was observed, whereas the content was higher at lower EC levels. Overall, these results suggest that NSP 1 dS m−1 is suitable for cultivating red perilla in plant factories.

1. Introduction

Perilla (Perilla frutescens) belongs to the Labiatae family. It is consumed as a functional food and widely cultivated as an annual herb in China, Korea, Japan, Vietnam, and Thailand [1]. Perilla leaves have traditionally been used as a crucial medicine for treating cough, anxiety, depression, tumors, and some intestinal disorders because it possesses antiallergic, anti-inflammatory, antioxidative, anticancer, and antibacterial bioactivities [2,3,4,5]. The high content of bioactive compounds found in perilla, such as rosmarinic acid, caffeic acid, and anthocyanins, contributes to perilla’s health-promoting effects [6]. Perillaldehyde is the main component, comprising up to 50%, of the essential oils extracted from perilla plants. It is responsible for the unique smell and taste of perilla, which is important not only for the flavor of food but also for medical treatment, such as depressive effects on the central nervous system and antibacterial activity [7]. Perilla is conventionally grown in fields and greenhouses, where environmental conditions are variable; this results in an unstable harvest and variable bioactive compounds [8]. Therefore, a new approach that cultivates perilla in a closed controlled environment system has been utilized to improve the productivity and quality of perilla plants for market and consumer needs.
Plant factories, advanced types of protected horticultural systems developed in recent years, provide larger cultivation space with multilayer shelves. The well-controlled lighting, temperature, humidity, and CO2 allow year-round crop production while increasing productivity and quality [9]. Hydroponic culture is an essential technique in plant factories because of its advantages, including efficient management of nutrient components, lack of soil contamination, rapid plant growth, and reduced crop cycles. Nutrient film technique (NFT) and deep flow technique (DFT) are the most popular hydroponic systems used to grow leafy vegetables. In the NFT, the plant roots are suspended in the flow of nutrient solution, and the nutrient solution is recirculated continuously by pumping water from a nutrient solution reservoir. Meanwhile, the deep flow technique (DFT) is a modified hydroponic culture method, in which the plant’s roots grow into a static and circulating nutrient solution. For overcoming the limited oxygen exchange between the atmosphere and the nutrient solution in static DFT, the nutrient solution is aerated by an air bubbler connecting with the pump in order to provide adequate root oxygenation [10].
Many studies have reported that medicinal herbs and vegetables grown in hydroponic systems possess better qualities than conventional soil-based systems [11]. Nutrient factors (macro- and micro-elements, pH, and electrical conductivity [EC]) are crucial for growing plants in hydroponic systems. The optimal macro- and micro-elements in the nutrient solution can determine plant growth characteristics such as leaf number and area, marketable yield, and quality crops such as mineral and chlorophyll contents [12]. Each plant species has a proper uptake rate of the nutrient solution; excessively high or low levels of nutrient solution have a negative effect on plants [13]. Establishing a nutrient solution that provides a favorable ratio of ions for plant growth and development is an important step in cultivating crops in hydroponic systems in plant factories.
EC is an important factor in nutrient solutions and reflects the total content of macro- and micro-elements available to plants [14]. Generally, low EC levels lead to nutrient deficiencies and growth inhibition, whereas high EC levels impede nutrient uptake by increasing osmotic pressure and salt stress. Thus, creating waste nutrients that increase nutrient solution discharge into the environment, resulting in environmental pollution [15,16]. The optimal EC level range should be from 1.5 to 3.5 dS m−1 for most hydroponic crops, but this value varies between crop species and phenological stages [17]. Many studies have been conducted to investigate the effects of EC levels on nutrient solutions of vegetables, crops, and medicinal plants [18,19,20,21]. This study aimed to establish a new nutrient solution for a suitable absorption rate of red perilla and evaluate the effect of EC levels of newly-developed nutrient solution for perilla on the growth, mineral content, and bioactive compounds accumulation in red perilla grown in plant factories.

2. Materials and Methods

2.1. Plant Material and Growth Conditions

Red perilla seeds (Perilla frutescens var. crispa, Johnny’s Selected Seeds, Winslow, ME, USA) were sown in sponges and placed in an environmental control room at air temperature of 25 °C, relative humidity of 60%, white LEDs, photosynthetic photon flux density (PPFD) of 150 μmol m2 s−1, and a light period of 16 h. Distilled water was supplied to the seeds every two days.

2.2. Development of Nutrient Solution

After 4 weeks of sowing, seedlings were grown in a deep flow technique (DFT) system that was set by the tank (L × W × H, 25.5 cm × 22 cm × 15.5 cm) with the hole cover (distance of hole is about 11 cm). Three types of nutrient solutions (pH 6.0, EC 1.5 dS m−1), such as Hoagland solution ([22], Otsuka solution [23], and greenhouse multipurpose nutrient solution [24]) was supplied into each tank to grow seedlings. Three tanks were used for each nutrient solution, and five seedlings were grown in each tank. All of the seedlings were grown in an environmental control room under the following conditions: 25 °C air temperature, 60 ± 10% relative humidity, white LEDs, 230 μmol m2 s−1 PPFD, and a 16 h light period. To supply the oxygen for seedling roots, a bubble-generating device (air stone; Mimineaqua, Incheon, Korea) was installed inside the DFT tank, which was connected to the pump by lines to aerate the nutrient solution.
For 7 weeks after transplanting, the red perilla plants were harvested and divided into the shoot part (including leaves) and the root part at the point in which the root started to grow. The shoots were freeze-dried for 72 h in a freeze dryer (Alpha 1–4 LSCplus; Martin Christ Co., Osterode am Harz, Germany), and then the dried shoots were ground in a milling tube (maximum volume of 40 mL, MMT40.1, IKA-Werke GmbH & Co. KG, Staufen, Germany) to produce a fine powder for analyzing mineral content. A wet digestion method was used to process the samples to analyze mineral contents [25]. Approximately 1 g of each dry powder was digested with 20 mL of 70% nitric acid (HNO3) at 125 °C. The remaining procedure was performed according to the method described in Park et al. [19]. The contents of K, S, P, Ca, Mg, Cu, Fe, Zn, and Mn were determined using an ICP-OES spectrophotometer (Optima 7300 DV; Perkin Elmer, Waltham, MA, USA).
The total nitrogen content was measured using a modified version of the Kjeldahl method [26], using a total nitrogen distillation apparatus (TKN-EW1080; DSlab, Seoul, Korea). Approximately 1 g of dry powder of each sample, 5 g of CuSO4-K2SO4, and 25 mL of H2SO4 were added to a digestion flask, and this mixture was heated at 180 °C for 40 min and then at 200 °C for approximately 1 h on a heating block. The decomposed mixture was cooled and massed up to 100 mL with triple-distilled water in a volumetric flask. The mass solution (10 mL) and 50 mL of NaOH (45%) were added to the distillation flask and then heated. The end of the cooling tube was dipped into an Erlenmeyer flask containing 50 mL of 2% boric acid. After the Erlenmeyer flask was filled to 70 mL, the distillation flask was stopped to heat, and the distilled solution was titrated with 0.05 N H2SO4.
Similar ratios of cations and anions of perilla plant uptake were observed when the plants were grown in different nutrient solutions above, therefore, the newly-developed nutrient solution for red perilla plants (NSP) was prepared based on these ratios (Table 1, Figure 1).

2.3. Electrical Conductivity Treatments

To determine the proper EC level of NSP, we conducted an experiment with six EC levels of NSP (1, 2, 3, 4, 5, and 6 dS m−1; pH 6). Three EC levels of greenhouse multipurpose nutrient solution (namely CT 1, 2, and 3 dS m−1; pH 6) were used as the control to provide more comparison of different EC levels to NSP. The red perilla seedlings were transplanted into the DFT described above, and each nutrient solution with each EC level was supplied into each tank. Each treatment contained three tanks, and five plants were grown in each tank. This experiment was conducted in an environmental control room under the same environmental conditions described in Section 2.2. The pH and EC values were checked every 2 days using a pH and EC meter (Multi 3430 SET F, WTW, Weilheim, Bavaria, Germany). The nutrient solution was changed every 2 weeks.

2.4. Growth Characteristics

After 7 weeks of transplanting, three plants per tank were randomly collected (total nine plants per treatment) for measuring the growth characteristics. Each plant was separated into the shoot and root parts at the point in which the roots started to grow, and the shoot and root fresh weights were measured using an electronic scale (Si-234; Denver Instrument, NY, USA). The main leaves (developed at the node of the main stem) and the side leaves (developed from the axillary or lateral buds) (size leaf ≥1 cm) were counted. Plant height was measured from the bottom point on the stem in which the roots started to grow to the top point in which the highest fully leaf expanded by using a ruler, and the total leaf area was measured using a leaf area meter (LI-3000A; Li-Cor, Lincoln, NE, USA). Then, the shoots were freeze-dried for 72 h in a freeze dryer, and the roots were dried in an oven (VS-1202D3; Vision Scientific, Daejeon, Korea) at 70 °C for 72 h. The dried shoots and roots were weighed for obtaining dry matter. SPAD value presenting the relative chlorophyll content was measured at three points of the fully expanded fourth leaf by a portable chlorophyll meter (SPAD-502, Konica Minolta, Tokyo, Japan).
Nine dried shoots per treatment were ground in a milling tube to make the fine powders. Nine shoot powders were used for the analysis of total phenolic and anthocyanin contents and antioxidant capacity, whereas six of nine shoot powders were used for the analysis of macro- and micro-elements contents and bioactive compounds.

2.5. Macro- and Micro-Elements Contents

To evaluate the effect of EC levels of NSP and CT on plant growth at 7 weeks after transplanting, the macro- and micro-elements contents were examined using the same methods as described above. The concentration and content of each element were expressed as milligrams (or micrograms) per gram of shoot dry weight (DW) (mg g−1 or µg g−1) and milligrams (or micrograms) per total shoot DW of each plant (mg or µg), respectively.

2.6. Biochemical Parameters

2.6.1. Total Phenolics

The amount of total phenolics was determined using the modified Folin-Ciocalteu reagent method [27]. Each dry powder (40 mg) was extracted with 3 mL of 80% (v/v) acetone and incubated in the dark at 4 °C overnight. The extracted sample was centrifuged at 3000× g for 2 min, and the supernatant was collected for analysis. The remaining processes were described by Lee et al. [28]. The total phenolic concentration and content were expressed as milligrams of gallic acid equivalent to per gram of shoot DW (mg g−1) and milligrams of gallic acid equivalent per total shoot DW of each plant (mg), respectively.

2.6.2. Total Anthocyanins

The total anthocyanin content was analyzed using the pH-differential method [29]. Each dry powder (50 mg) was weighed and extracted with 5 mL of methanol containing 2% HCl. The extracted samples were incubated in the dark for 48 h and then centrifuged at 15,000× g for 15 min. The supernatant of the sample was prepared in two dilutions as follows: one with pH 1.0 buffer (potassium chloride 0.025 M) and the other with pH 4.5 buffer (sodium acetate 0.4 M). The absorbance of the two dilutions was measured at 515 nm and 700 nm. The total anthocyanin concentration and content were expressed as grams of cyanidin-3-glucoside equivalents per gram of shoot DW (g g−1) and grams of cyanidin-3-glucoside equivalents per total shoot DW of each plant (g), respectively.

2.6.3. Antioxidant Capacity

The antioxidant capacity of red perilla was measured using a modified oxygen radical absorbance capacity (ORAC) assay [30]. For each sample, 20 mg of dry powder was weighed and extracted with 2 mL of 50% (v/v) acetone in an ultrasonicator (K5210HP, Hangzhou Nade Scientific Instrument, Zhejiang, China) for 5 min, followed by centrifugation at 4500× g for 30 min. The assay was carried out on a multi-plate reader (Epoch; BioTek, Winooski, VT, USA) in 96-well plates. 2,2′- Azobis (2-amidino-propane) dihydrochloride (AAPH) was used to generate peroxyl radicals; fluorescein and 6-hydroxy-2,5,7,8-tetramethylchroman-2-carboxyl acid (Trolox) was used as the substrate and standard, respectively. For each ORAC run, 150 µL of fluorescein (0.08 µM) was added to each well of a black microplate, and then either 25 µL of phosphate buffer (blank), Trolox standard, or sample were added to each well. The microplate was preheated to 37 °C for 10 min. Subsequently, 25 µL of AAPH was added to each well, and the kinetics immediately started reading. The value was calculated using the differences in areas under the decay curves between the blank and a sample and was expressed as millimoles Trolox per gram of shoot DW (mM g−1) and millimoles Trolox per total shoot DW of each plant (mM).

2.6.4. Individual Bioactive Compounds

Each dry powder sample (100 mg) was weighed and extracted in 70% methanol for rosmarinic (RA) and caffeic (CA) acids in 100% methanol for perillaldehyde (PA). We carried out RA, CA, and PA analysis using an HPLC system (YL9100, Young Lin Instrument Co. Ltd., Anyang, Korea). The whole process for the extraction of samples and analysis of these compounds in red perilla was described in our previous study [31]. The concentration and content of each compound were expressed as milligrams of the respective standard per gram of shoot DW (mg g−1) and milligrams of the respective standard per total shoot DW of each plant (mg), respectively.

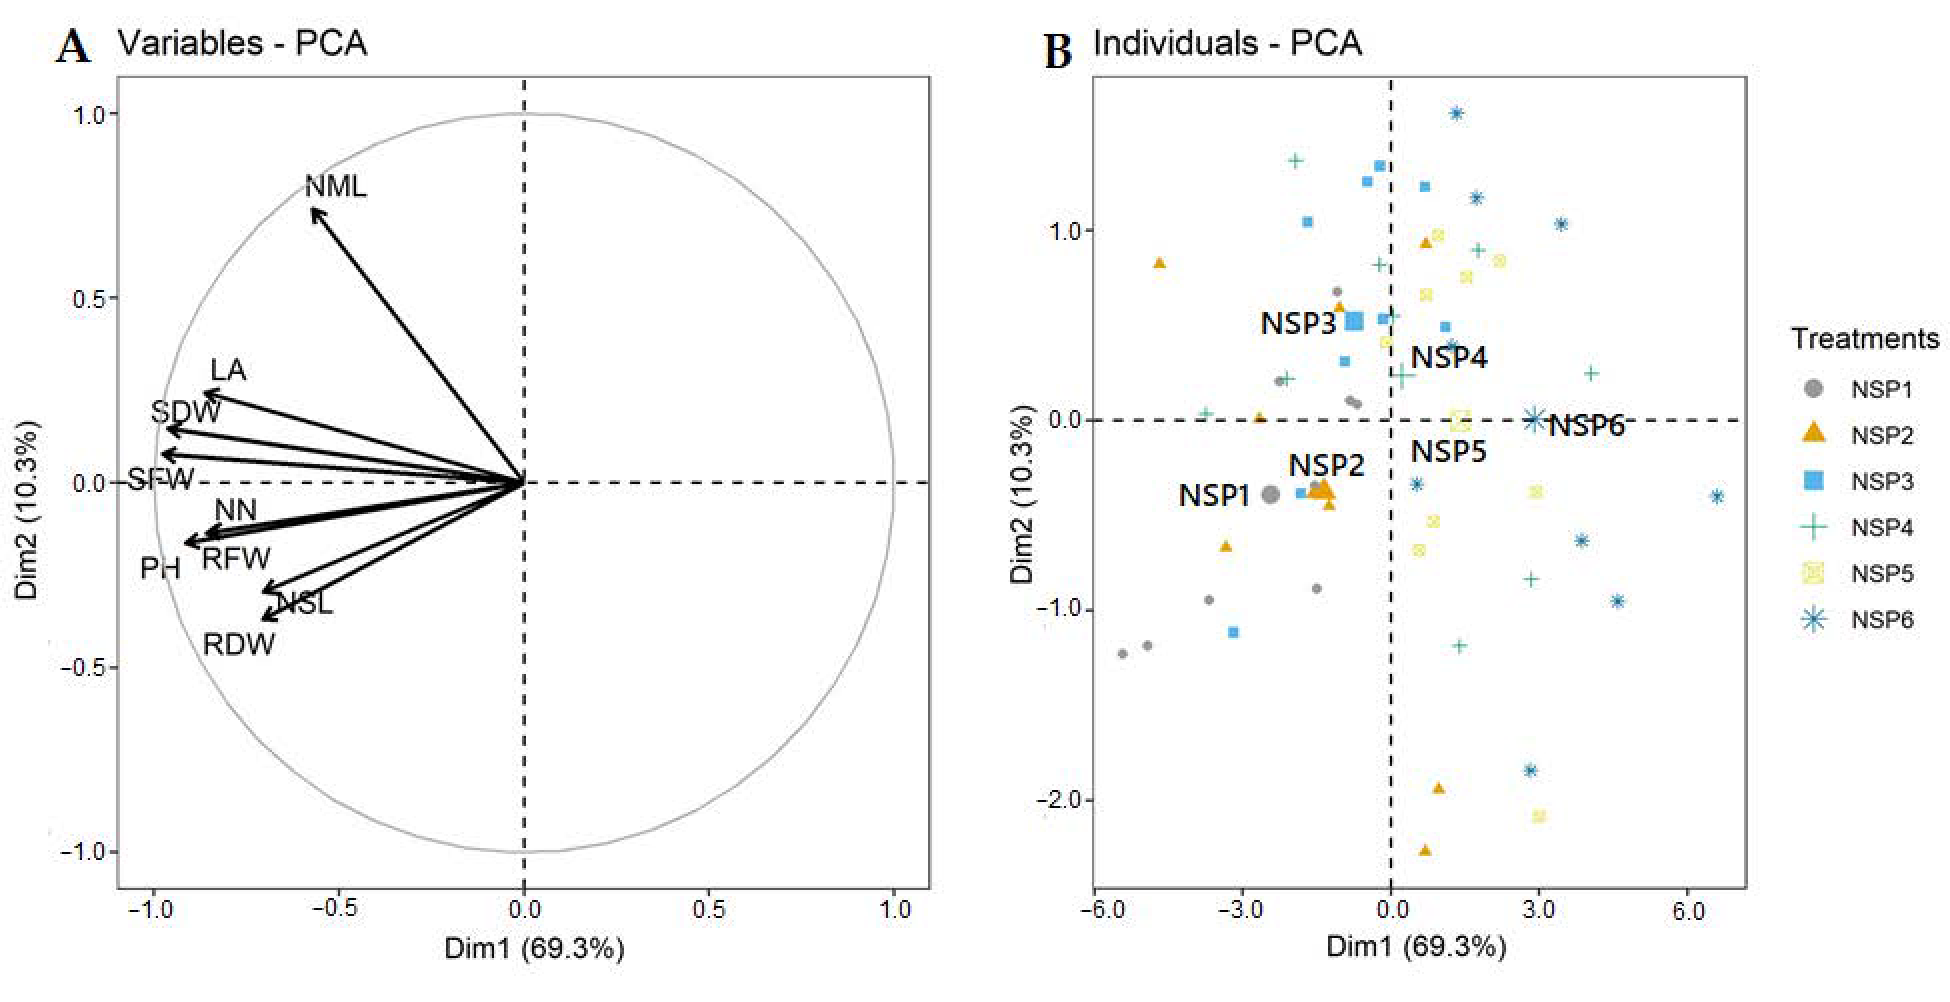
2.7. Statistical Analysis

We used a completely randomized design by placing 18 tanks at random. The SAS 9.2 program (SAS Institute Inc., Cary, NC, USA) was used to perform statistical analysis with analysis of variance, and the significant differences in all treatments were verified at p < 0.05, using Duncan’s multiple range test. The principal component analysis (PCA) was performed with R statistic software (version 4.0.3).

3. Results

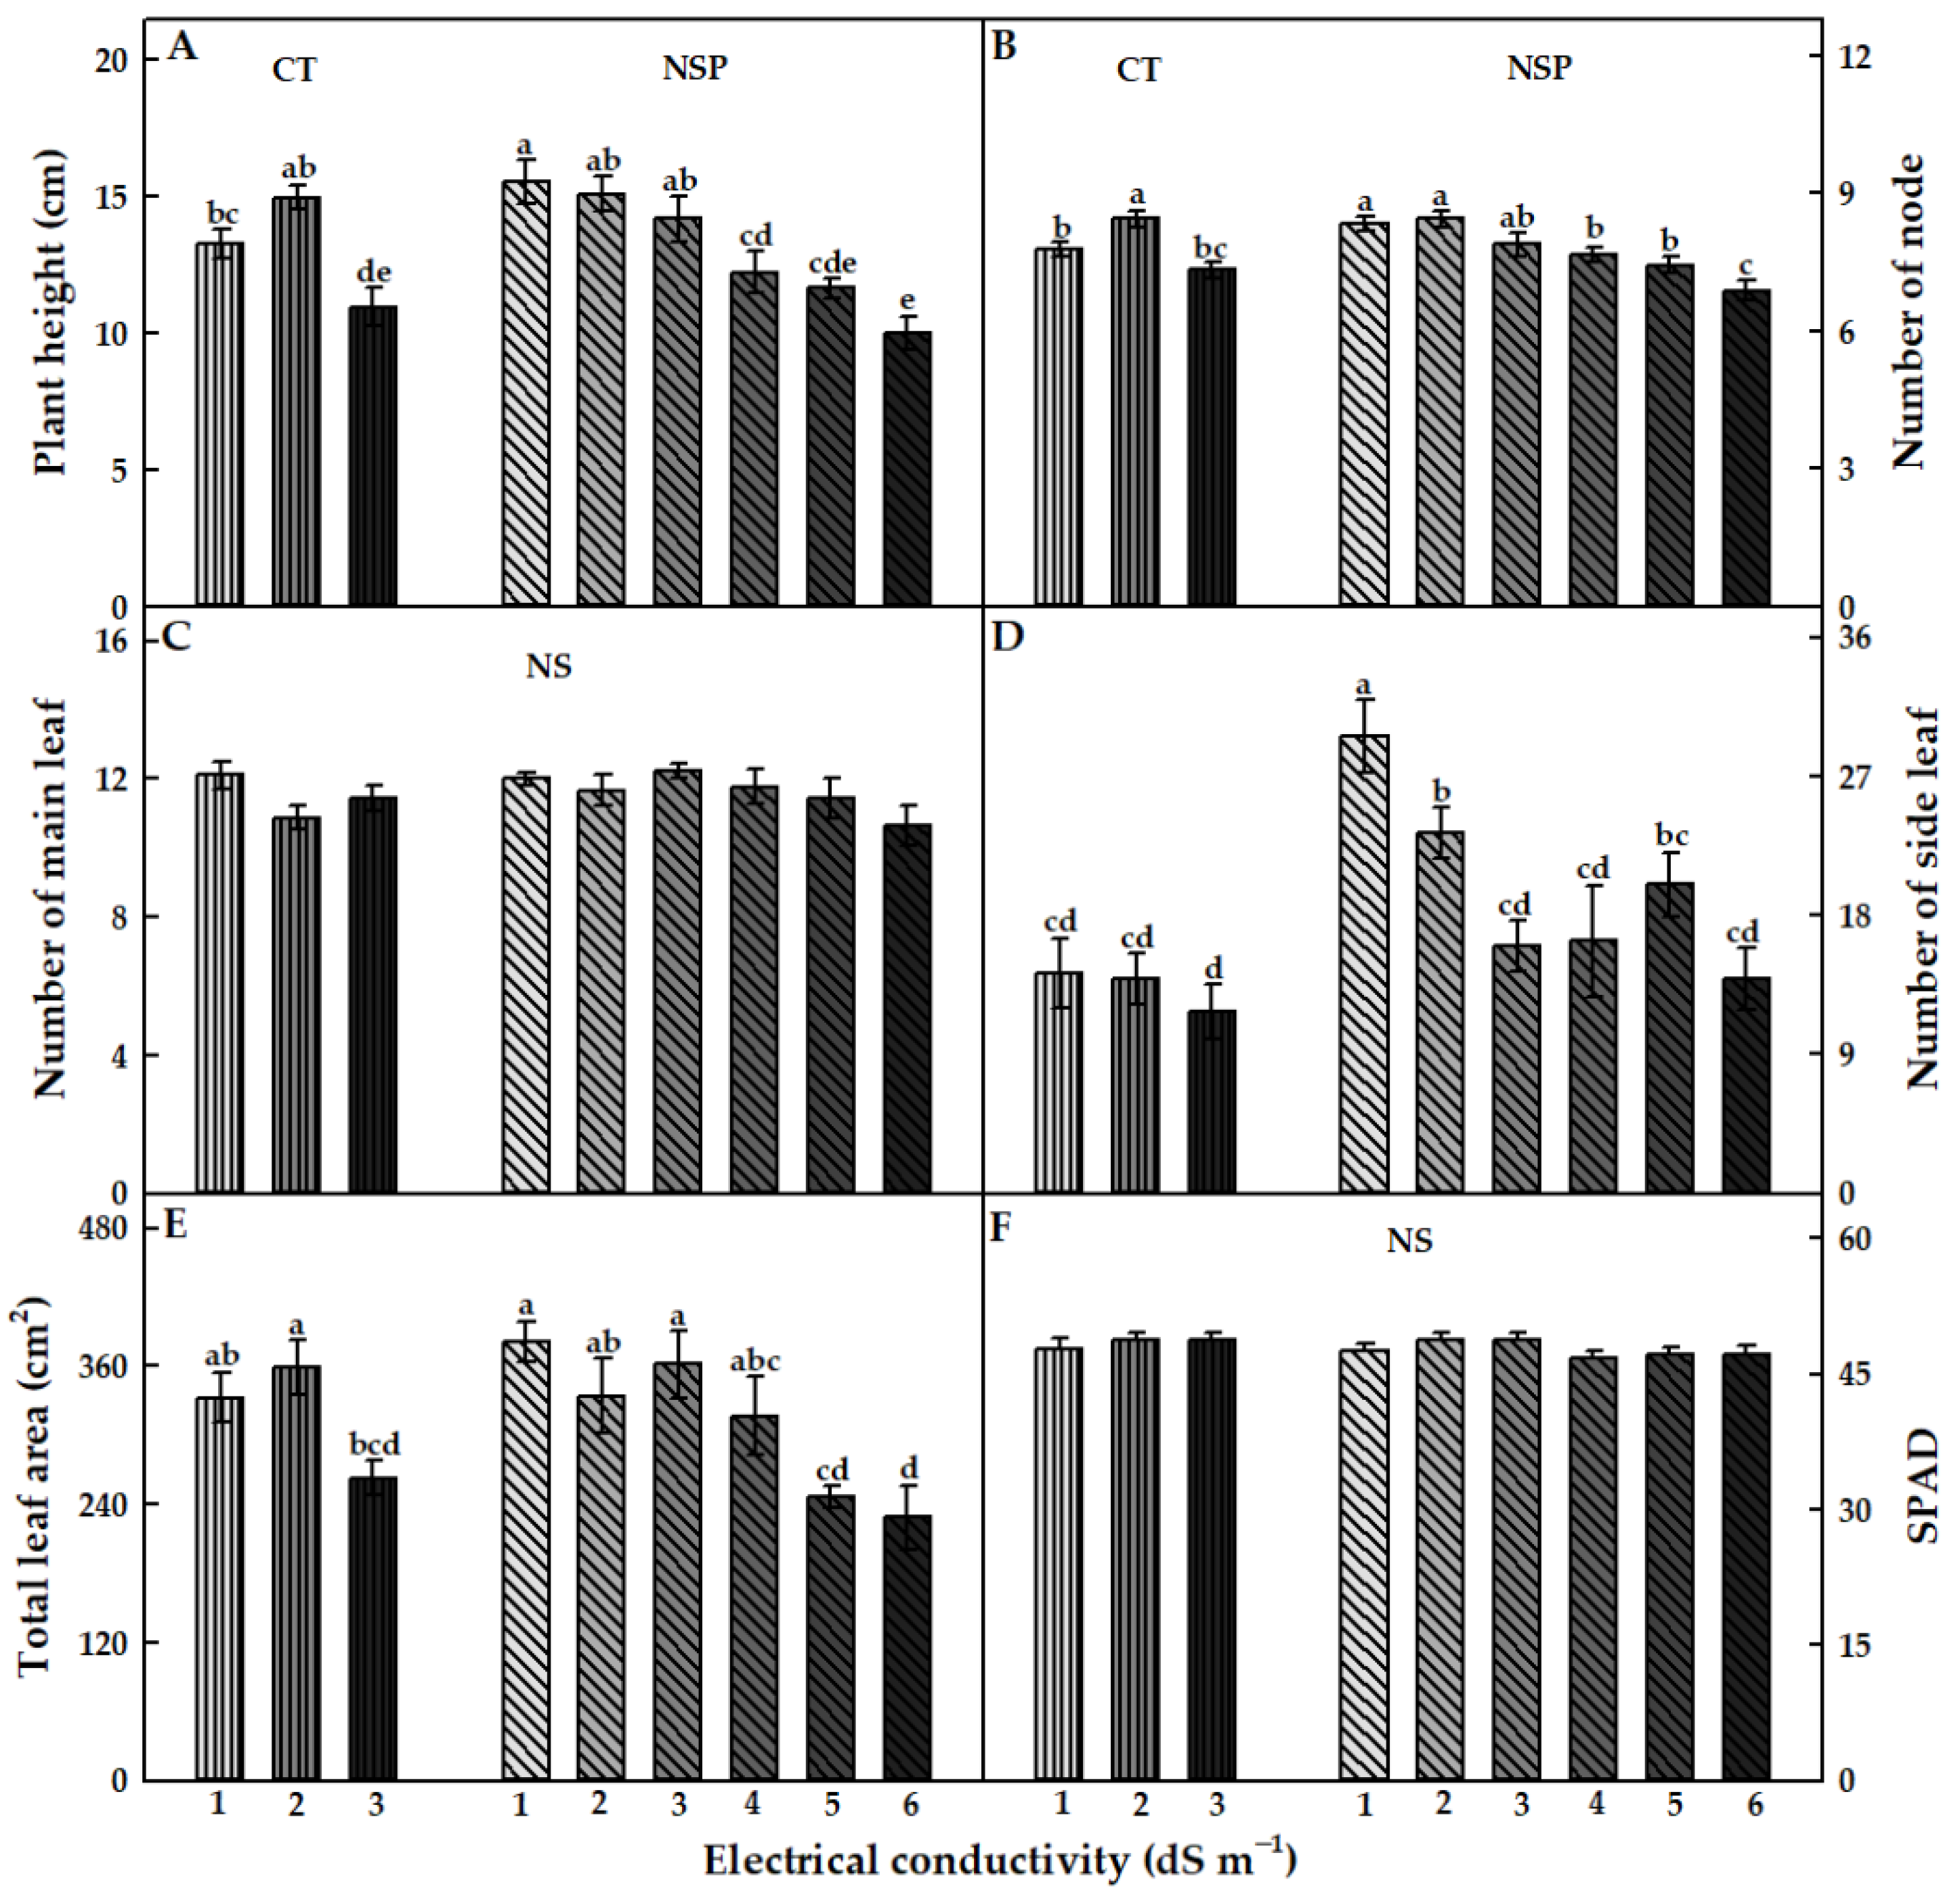
3.1. Growth Characteristics

The EC levels of CT and NSP had different effects on the growth characteristics of red perilla. Overall, the EC levels at 1 and 2 dS m−1 of CT and 1–3 dS m−1 of NSP showed an efficient effect on red perilla growth. Compared to CT, NSP 1 dS m−1 enhanced the higher fresh and dry weights of shoots and roots, although there were no statistically significant differences in shoot and root dry weights observed between NSP 1 dS m−1 and CT 1, 2 dS m−1 (Figure 2). Shoot fresh weight of plants grown under NSP 1 and 2 dS m−1 was significantly higher than those under NSP 5 and 6 dS m−1 (Figure 2A); whereas shoot dry weight was greater under NSP 1–4 dS m−1 compared with that of plants grown under NSP 6 dS m−1 (Figure 2B). Meanwhile, root fresh and dry weights in NSP 1 dS m−1 were 3.4 and 1.5 times, respectively, higher than those in NSP 6 dS m−1 (Figure 2C,D). Plants grown under NSP 1–3 dS m−1 had a significantly higher plant height than those grown under NSP 4–6 dS m−1 (Figure 3A), and the node number was greater under NSP 1–5 dS m−1 compared to 6 dS m−1 (Figure 3B). There was no significant difference in the number of main leaves between CT and NSP (Figure 3C), but interestingly, NSP 1 dS m−1 markedly increased side leaves number by approximately two times than CT and other NSP treatments (except for NSP 2 and 5 dS m−1). The total leaf area of plants under NSP 5 and 6 dS m−1 was considerably lower than those under CT (1 and 2 dS m−1) and NSP (1, 2, and 3 dS m−1) (Figure 3E), whereas SPAD values were similar among the treatments (Figure 3F). Generally, the higher EC levels of CT (3 dS m−1) and NSP (5 and 6 dS m−1) inhibited the growth of red perilla, and most of the growth characteristics were similar among CT 1, 2 dS m−1 and NSP 1, 2, and 3 dS m−1. The principal component analysis (PCA) showed the comparison of correlations among growth parameters of red perilla grown in NSP (Figure 4). The first component (Dim1) explained 69.3% of the total variables, while the second component explains 10.3% of those. The narrow angles inside the circle showed strongly positive correlations among the growth parameters (Figure 4A), and in the scatter plot, plants grown in NSP 1 dS m−1 (NSP1) was not significantly different from NSP 2 dS m−1, which was most distinct to NSP 5 and 6 dS m−1 (NSP5 and NSP6) (Figure 4B).

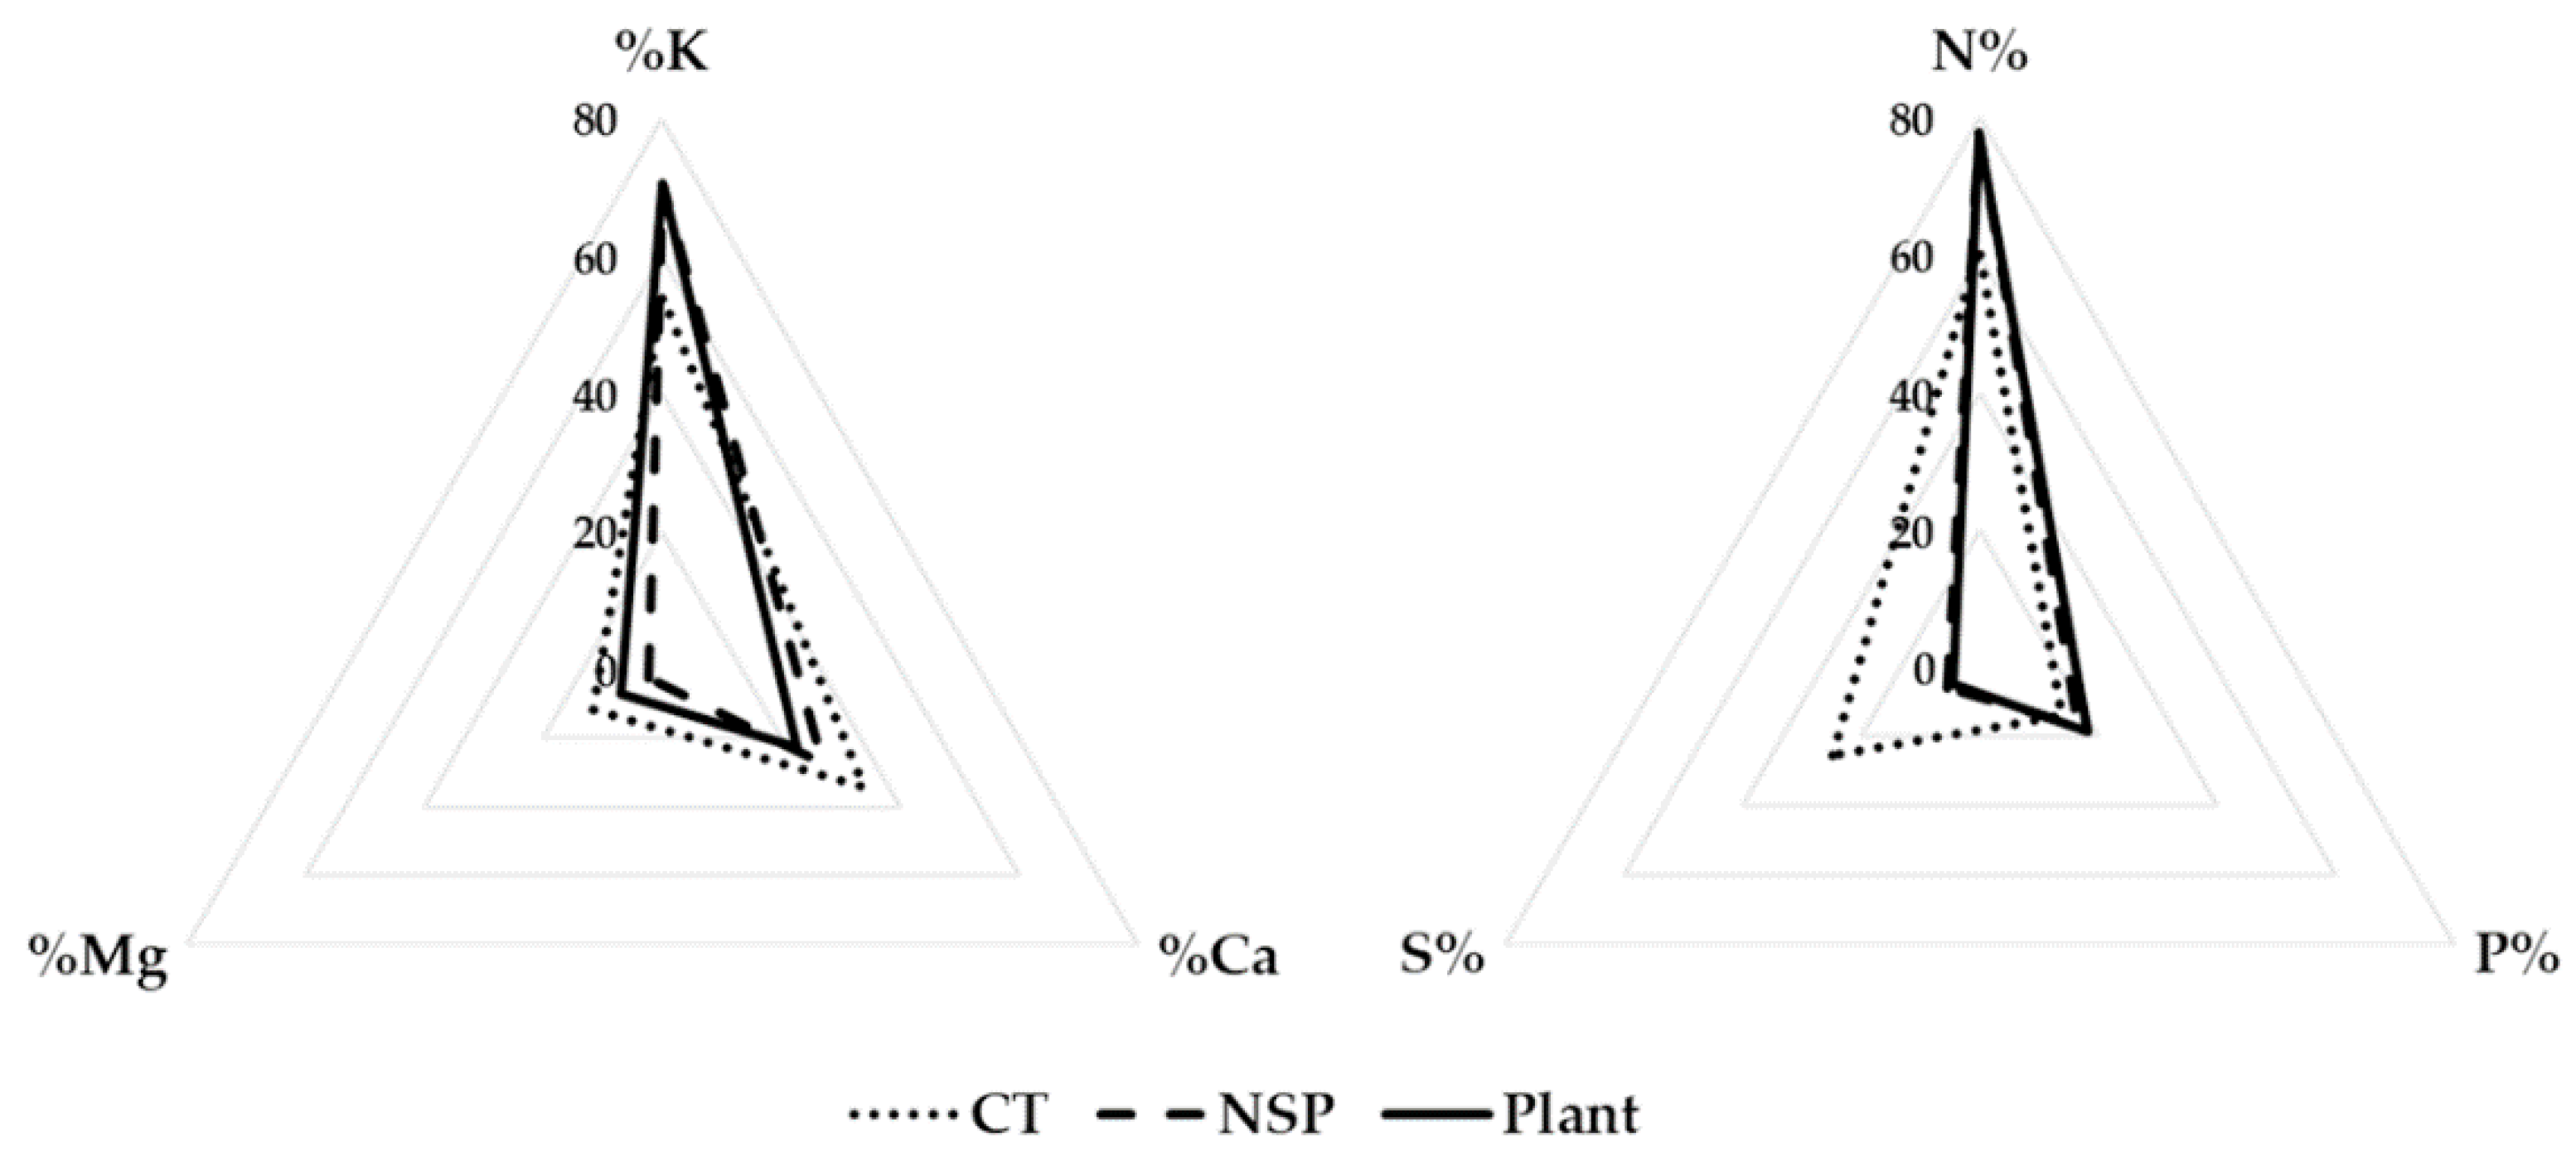
3.2. Macro- and Micro-Elements

To evaluate the nutrient uptake of plants grown under various mineral compositions and concentrations, we analyzed the mineral contents of red perilla. The macro- and micro-elements contents in red perilla were significantly different according to different EC levels of CT and NSP (Table 2 and Table 3). For macro-elements, N concentration showed no statistical difference among CT treatments while this value in NSP 1, 2 dS m−1 was considerably lower than that in NSP 5 and 6 dS m−1 (Table 2). The plants in 1 dS m−1 of both CT and NSP contained a significantly lower S concentration compared to the plants in the higher EC levels, and P concentration in 1 dS m−1 was also lower than in the other EC levels. In contrast, Ca concentration was considerably higher in CT 1, 2 dS m−1 and NSP 1 dS m−1 than in CT 3 dS m−1 and NSP 2–6 dS m−1, respectively, and Mg concentration significantly increased in 1.0 dS m−1 of CT and NSP compared to CT 2, 3 dS m−1 and NSP 5, 6 dS m−1, respectively. K concentration showed a fluctuated change in both CT and NSP. Comparisons between the same EC levels (1, 2, and 3 dS m−1) of CT and NSP, the concentrations of N, P, Ca, and S were not significantly different, whereas K concentration under NSP was slightly higher than CT, and Mg concentration and content under NSP was reduced to half of that in CT. The P, Mg, and S contents in NSP 1–4 dS m−1 were considerably higher than those of plants in NSP 5, 6 dS m−1, and the contents of N, K, and Ca under NSP 1 dS m−1 were 1.4, 1.5, and 2.2 times, respectively, higher than those of plants in NSP 6 dS m−1. Regarding the micro-elements, in CT treatments, there were no significant differences in Cu, Fe, and B concentrations, whereas CT 1 dS m−1 had the lowest Zn and Mn per gram DW and highest Mo concentration among EC levels (Table 3). Meanwhile, all the micro-element concentrations were lowest in NSP 1 dS m−1 (except for Mo). No significant differences in Cu, Fe, Zn, and B contents were observed in CT treatments, Mn content was lowest, and Mo content was highest in CT 1 dS m−1. The plants in NSP 1–4 dS m−1 had higher Cu and Mo contents compared to plants in NSP 5, 6 dS m−1, while Zn, Mn, and B contents slightly increased as the EC levels of NSP increased to 4 dS m−1. There was no significant difference in Fe content among treatments (Table 3). The ratios of cations and anions of plants grown in different EC levels of NSP were similar to these ratios in NSP nutrient solution (Figure S1).

3.3. Biochemical Parameters

3.3.1. Total Phenolics, Anthocyanins, and Antioxidant Capacity

The newly-developed nutrient solution did not enhance the total phenolic concentration of red perilla, characterized by a slightly lower value under NSP than that under CT (Figure 5A). There was no significant difference in total phenolic concentration among EC levels of CT as well as NSP (except for NSP 2 dS m−1). Meanwhile, anthocyanin concentration showed a different trend from that of the total phenolic concentration (Figure 5C). In both CT and NSP, anthocyanin concentration was greater under lower EC levels, and this value in NSP 5, 6 dS m−1 significantly decreased. Regarding antioxidant concentration, this value under CT 3 dS m−1 was greater than that of CT 1, 2 dS m−1, whereas NSP 1, 2, and 3 dS m−1 resulted in higher values than did NSP 4, 5, and 6 dS m−1 (Figure 5E). Total phenolic, anthocyanin, and antioxidant contents decreased as the EC levels of both CT and NSP increased, and these values were highest in CT 2 dS m−1 and NSP 1 dS m−1 (Figure 5B,D,F).

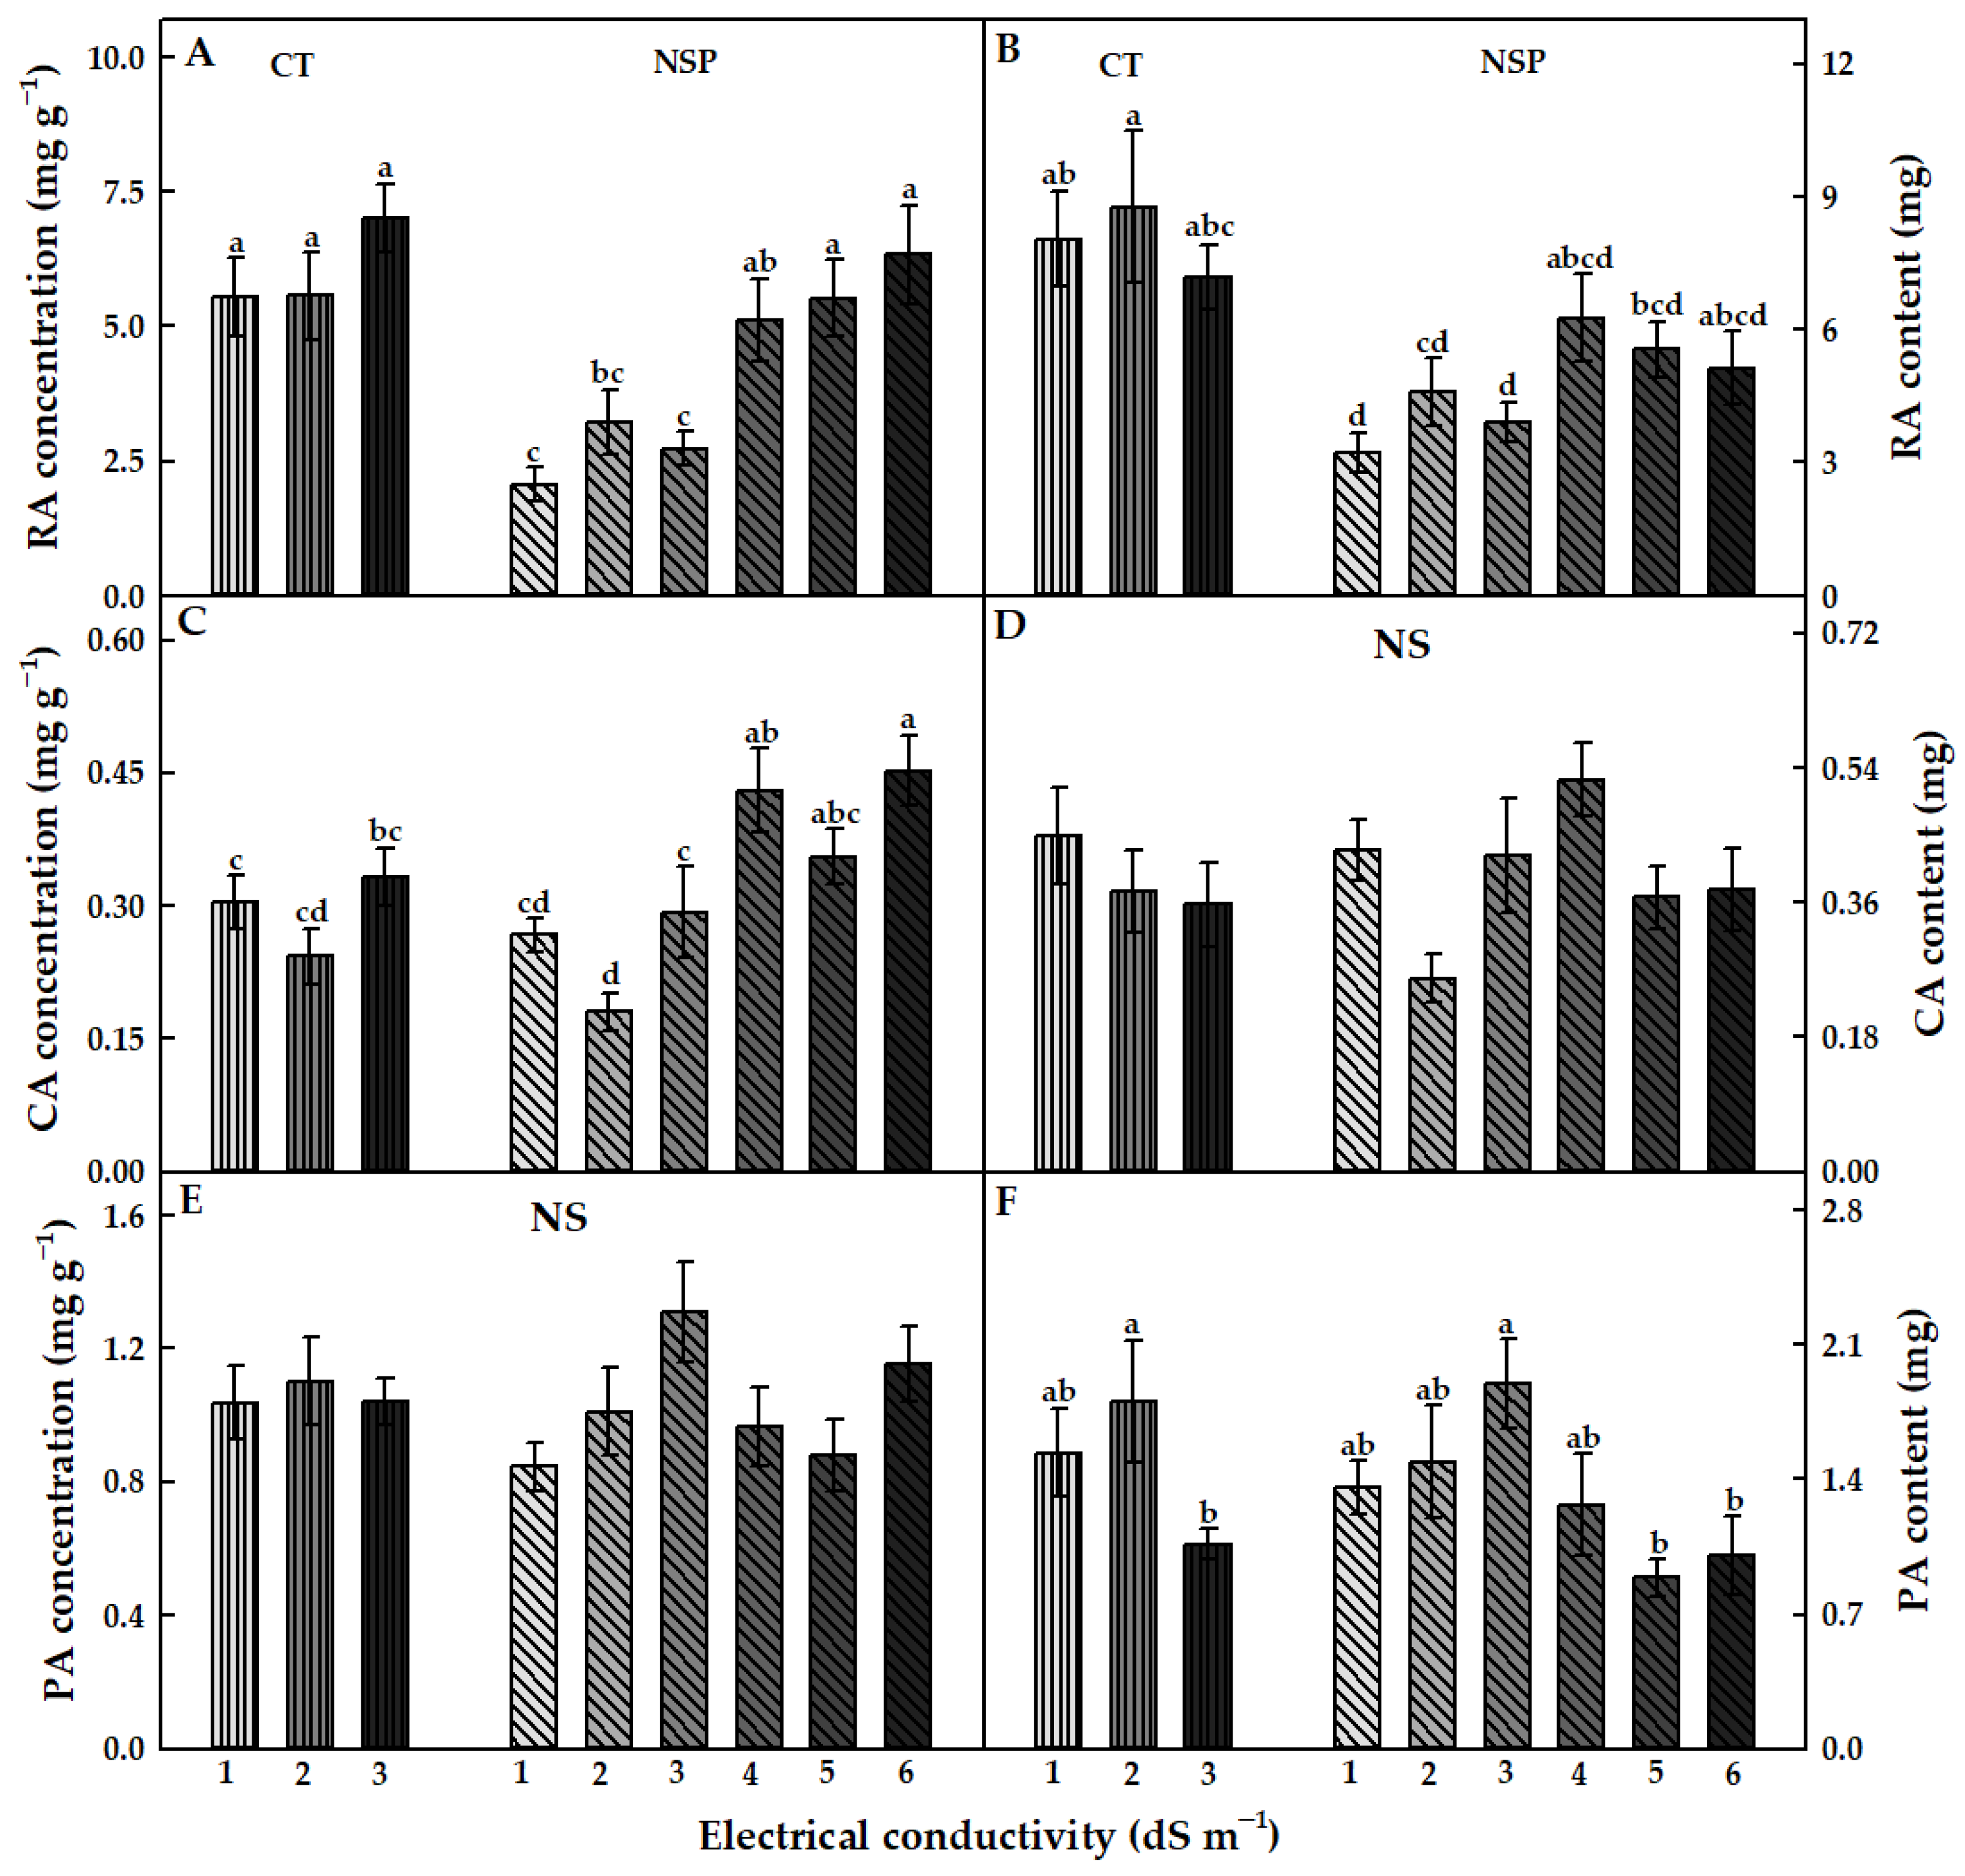
3.3.2. Individual Bioactive Compounds

The EC levels of the CT and NSP had different effects on RA, CA, and PA accumulations in red perilla (Figure 6). RA concentration and content tended to increase as the EC levels of both nutrient solutions increased (Figure 6A,B). These values were no significant differences among CT treatments. In NSP, the RA concentration in NSP 5 and 6 dS m−1 was considerably higher than that in NSP 1–3 dS m−1, and no statistical difference in RA content was obtained. In particular, RA concentration under CT 1, 2, and 3 dS m−1 were 2.7-, 1.7-, and 2.6 times, respectively, higher than those under NSP 1, 2, and 3 dS m−1, and CT 1, 2, and 3 dS m−1 plants had 2.5-, 1.9-, and 1.8 times higher RA content compared to NSP 1, 2, and 3 dS m−1, respectively. CA concentration showed a similar trend to that of RA. There was no significant difference in this concentration among CT treatments. CA concentration in NSP 1–3 dS m−1 was slightly lower than that in CT, but the respective EC levels of CT and NSP solutions showed no statistically significant difference in this value (Figure 6C). Increasing EC levels of NSP resulted in higher CA concentration and reached the highest value at 4 and 6 dS m−1. However, CA content was not significantly different among the EC levels of both nutrient solutions (Figure 6D). There were no observable differences in PA concentration among treatments (Figure 6E). PA content under CT 2 dS m−1 was 1.7 times higher than that in CT 3 dS m−1. This content was significantly higher under NSP at 3 dS m−1, which was approximately two times higher than that under 5 and 6 dS m−1 (Figure 6F).

4. Discussion

Plant factories with artificial light (PFALs), also called indoor farm or vertical farm, are a type of closed controlled environment systems, which allows growing vegetables and crops with stable yield and high quality. In hydroponic culture in PFALs, supplying essential mineral nutrition is an important factor in determining the production and quality of vegetables. Many nutrient solution formulas have been established for suitable nutrient absorbance and plant development [32]. In our study, a newly-developed nutrient solution (NSP) was established for growing red perilla basing on the ratios of cations and ions of that plant uptake. Comparing to CT, the formula of NSP contained the higher N, K, P, Zn, and B contents (by 1.2-,1.4-, 1.1-, 3-, and 1.3 times, respectively), the lower Ca, Mg, S, and Fe contents (by 1.2-, 4.4-, 4.8-, and 1.5 times lower, respectively), and the similar Mo and Mn contents (Table 1). This study investigated the effects of a newly-developed nutrient solution and its different EC levels on the growth and bioactive compounds of red perilla plants. Therefore, it could not clearly show the influence of individual mineral elements because of their interactions in nutrient solution.

4.1. Growth Characteristics

Many studies have reported that EC levels of nutrient solutions affect the growth of various crops [19,20,33]. In our study, most of the growth characteristics of red perilla decreased as the EC levels increased, and NSP 1 dS m−1 showed the highest values compared with other EC levels of CT and NSP, which implies that NSP 1 dS m−1 was appropriate for the growth of red perilla. This result is contrary to Lu et al. who reported that green and red perilla growth increased to EC 3 dS m−1, which is due to the different nutrient solution formulas between these two studies [33]. Meanwhile, the high EC exceeding 6.5 dS m−1 restricts tomato plant growth by decreasing the number of leaves and leaf areas [34]. It has been demonstrated that increasing nutrient solution concentration inhibits the water absorption of the roots and ultimately caused water stress, which results in various physiological and biological changes in plants [35].
Moreover, the individual minerals in nutrient solutions, such as primary macronutrients (P, K, and Ca) and secondary macronutrients (Ca, Mg, and S) play important roles in plant development. Among the minerals, N, P, and K are the most decisive elements in plants. Nyoki and Ndakidemi reported that N notably increased the dry matter and protein content in grain crops [36]. However, the high N content may lead to high osmotic pressure around the root, thereby reducing root and plant growth [37]. The plant’s growth characteristics were limited under inadequate P, while the adequate supply of K improved plant length, leaf number, fresh and dry weight of leaves [38,39]. In our study, the NSP solution contained a significantly higher N, P, and K content than CT (Table 1), supplying suitable mineral contents for growing red perilla. In particular, NSP 1 dS m−1 markedly increased the number of side leaves that developed from the node branches and contributed to plant productivity. The SPAD value is considered a fast estimation of chlorophyll content by using the non-linear relationships and a stress indicator for plant development [40]. It was reported that the leaf N, Mg, and Fe contents were strongly correlated with the chlorophyll content and play important role in photosynthesis [41,42,43]. In our study, the SPAD value in all treatments did not differ among the EC levels. Under the same EC level of 1 dS m−1, the plant contained similar N and Fe contents between CT and NSP while the Mg content was significantly lower in NSP than in CT. The maintained SPAD value in all treatments can indicate that the NSP provided enough Mg for red perilla chlorophyll synthesis although it contained lower Mg compared to CT.

4.2. Macro- and Micro-Elements

The influence of nutrient solution concentration on the macro- and micro-element contents in plants has been pronounced [19,44], and the management of the ratio of ions is an important task for growing plants in hydroponic culture [45]. In the present study, the EC levels showed a considerable influence on the ratio of ions as well as the uptake content of individual minerals. The red perilla plants grown in NSP 1 dS m−1 exhibited ratios of major cations (Ca, Mg, and K) and major anions (N, P, and S) similar to those under the nutrient solution compared with the plants grown in NSP 3 and 6 dS m−1 (Figure S1). Steiner suggested the ratios of ionic ions, including the ratio of anions such as NO3, H2PO4, and SO42−, and the ratio of cations such as K+, Ca2+, and Mg2+ [46]. It was reported that the strong difference between the ion ratios presented in the nutrient solution and those absorbed by plants led to the accumulation of certain ions in the nutrient solution; which caused an imbalance of mineral elements in the nutrient solution and created more energy to absorb the suitable ions [45,47]. Although the plants were supplied with suitable ion ratios, plants can easily suffer from nutrient deficiency or excess if the nutrient solution concentration is low or high [48]. Therefore, it is crucial to determine the suitable EC level of nutrient solutions with favorable ion ratios for growing plants. In the present study, the N content in red perilla plants was the highest among the macro-elements, followed by K, while Mn was the most abundant micro-element, followed by Fe and Zn, which was consistent with the results of a previous study [44].

4.3. Biochemical Parameters

Macro- and micronutrients are essential for primary and secondary metabolism. The total phenolic, RA, and CA concentration of red perilla increased as the EC levels increased, which showed an opposite trend to growth characteristics. In contrast, previous studies reported that a low-nutrient solution increased the RA content in green and red perilla, Prunella vulgaris, and Agastache rugosa [20,33,49]. The deficiency of some minerals, such as nitrogen, phosphorus, and potassium, causes a decrease in the phenolic contents of crops [50]. In the present study, the low EC level showed no positive effect on the RA and CA contents. Meanwhile, the total anthocyanin content and antioxidant capacity at low EC levels were higher than those at high EC levels. It has been shown that the presence of anthocyanin malonylshisonin is responsible for the red color of red perilla [51]. Hilbert et al. found that high nitrogen fertilizer decreased anthocyanin accumulation in the skin of berries [52], whereas Horiguchi reported that phosphorus deficiency led to a significant synthesis of anthocyanin in the leaves of corn [53]. In the present study, the N and P contents of plants grown under NSP 1 dS m−1 were lower than other treatment, which can be suitable to stimulate the anthocyanin biosynthesis. Anthocyanin is an antioxidant, and the total anthocyanin content had a similar trend to antioxidant capacity, indicating that total anthocyanin mainly contributed to antioxidant capacity in red perilla. The total phenolic and anthocyanin content, as well as antioxidant content, were related to the effect of EC levels on plant biomass, with high values in the promoted plant growth, whereas the RA content was greatly affected by EC levels, and there was no significant difference in the effect of EC levels on CA content.
In addition to these phenolic compounds, PA is a major essential oil of perilla plants and is synthesized by the monoterpene pathway [54], and mineral elements may influence the content of essential oils by changing the enzymes involved in terpenoid biosynthesis. The EC levels of nutrient solutions did not affect PA concentration of red perilla, but PA content was enhanced when plant growth was increased under lower EC levels. This result was consistent with the study of Lu et al. who reported that the PA of green and red perilla was not affected by EC or light intensity [33]. The effect of EC and certain minerals in the nutrition solution on the synthesis of essential oils from various plant species have been shown [55,56,57]. Although there was no significant difference in PA concentration in the present study, it showed a trend of increasing this value as the content of N, S, and P in the nutrient solution increased with increasing EC levels. In addition, PA is synthesized in trichomes on the abaxial red perilla leaf, and increasing leaf age leads to a decrease in trichome density [58]. Ogawa et al. reported that a high PA concentration in perilla leaves was obtained in leaves with a high trichome density [59]. In the present study, the plants grown under NSP 1 dS m−1 had a significantly higher number of side leaves than the younger leaves, which may have a higher trichome density and contribute to the high PA content.

5. Conclusions

We established a newly-developed nutrient solution for growing red perilla based on the rate of cations and anions in red perilla plants. The NSP solution at 1 dS m−1 provided sufficient mineral content to promote red perilla growth as well as the accumulation of some bioactive compounds that contributed to antioxidant capacity without showing the symptoms of nutrient deficiency in plants. Providing the most suitable nutrient solution and EC level for growing vegetables and crops in hydroponic systems helps to avoid the waste of nutrient solution, which contributes to saving production cost for growing crops in plant factories and preventing environmental pollution.

Supplementary Materials

The following are available online at https://www.mdpi.com/article/10.3390/agronomy11050932/s1, Figure S1: The ratio of cations (K, Mg, Ca) and anions (N, S, P) of newly-developed nutrient solution for red perilla (NSP) and of red perilla plants grown under different EC levels (1, 3, and 6 dS m−1) of NSP.

Author Contributions

Conceptualization, methodology, software, formal analysis, investigation, resources, data curation, writing—original draft preparation, T.K.L.N.; data curation, formal analysis, investigation, methodology, M.-S.Y.; supervision, validation, funding acquisition, writing—review and editing, M.-M.O. All authors have read and agreed to the published version of the manuscript.

Funding

This research was supported by a National Research Foundation of Korea (NRF) grant funded by the Korean government (MSIT) (No.2020R1A4A4079705).

Institutional Review Board Statement

Not applicable.

Informed Consent Statement

Not applicable.

Data Availability Statement

All the data is available in the paper.

Conflicts of Interest

The authors declare no conflict of interest.

References

  1. Lee, J.; Kim, N. Genetic diversity and relationships of cultivated and weedy types of Perilla frutescens collected from East Asia revealed by microsatellite markers. Korean J. Breed Sci. 2007, 39, 491–499. [Google Scholar]
  2. Saklani, S.; Chandra, S.; Gautam, A. Phytochemical investigation and contribution of Perilla frutescence as spices in traditional health care system. Int. J. Pharm. Technol. 2011, 3, 3543–3554. [Google Scholar]
  3. Shin, T.-Y.; Kim, S.-H.; Kim, S.-H.; Kim, Y.-K.; Park, H.-J.; Chae, B.-S.; Jung, H.-J.; Kim, H.-M. Inhibitory effect of mast cell-mediated immediate-type allergic reactions in rats by Perilla frutescens. Immunopharmacol. Immunotoxicol. 2000, 22, 489–500. [Google Scholar] [CrossRef] [PubMed]
  4. Žekonis, G.; Žekonis, J.; Šadzevičienė, R.; Šimonienė, G.; Kėvelaitis, E. Effect of Perilla frutescens aqueous extract on free radical production by human neutrophil leukocytes. Medicina 2008, 44, 699–705. [Google Scholar] [CrossRef] [PubMed] [Green Version]
  5. Wanga, Y.; Huangb, X.; Hanc, J.; Zhenga, W.; Maa, W. Extract of Perilla frutescens inhibits tumor proliferation of HCC via PI3K/AKT signal pathway. Afr. J. Tradit. Complement. Altern. Med. 2013, 10, 251–257. [Google Scholar] [CrossRef]
  6. Saita, E.; Kishimoto, Y.; Tani, M.; Iizuka, M.; Toyozaki, M.; Sugihara, N.; Kondo, K. Antioxidant activities of Perilla frutescens against low-density lipoprotein oxidation in vitro and in human subjects. J. Oleo Sci. 2012, 61, 113–120. [Google Scholar] [CrossRef] [PubMed] [Green Version]
  7. Sato, K.; Krist, S.; Buchbauer, G. Antimicrobial effect of trans-cinnamaldehyde,(−)-perillaldehyde,(−)-citronellal, citral, eugenol and carvacrol on airborne microbes using an airwasher. Biol. Pharm. Bull. 2006, 29, 2292–2294. [Google Scholar] [CrossRef] [Green Version]
  8. Iwai, M.; Ohta, M.; Tsuchiya, H.; Suzuki, T. Enhanced accumulation of caffeic acid, rosmarinic acid and luteolin-glucoside in red perilla cultivated under red diode laser and blue LED illumination followed by UV-A irradiation. J. Funct. Foods 2010, 2, 66–70. [Google Scholar] [CrossRef]
  9. Kozai, T. Resource use efficiency of closed plant production system with artificial light: Concept, estimation and application to plant factory. Proc. Jpn. Acad. Ser. B 2013, 89, 447–461. [Google Scholar] [CrossRef] [Green Version]
  10. Park, J.-S.; Kurata, K. Application of microbubbles to hydroponics solution promotes lettuce growth. HortTechology 2009, 19, 212–215. [Google Scholar] [CrossRef]
  11. Palermo, M.; Paradiso, R.; De Pascale, S.; Fogliano, V. Hydroponic cultivation improves the nutritional quality of soybean and its products. J. Agric. Food Chem. 2012, 60, 250–255. [Google Scholar] [CrossRef] [PubMed]
  12. Fallovo, C.; Rouphael, Y.; Cardarelli, M.; Rea, E.; Battistelli, A.; Colla, G. Yield and quality of leafy lettuce in response to nutrient solution composition and growing season. J. Food Agric. Environ. 2009, 7, 456–462. [Google Scholar]
  13. Savvas, D.; Adamidis, K. Automated management of nutrient solutions based on target electrical conductivity, pH, and nutrient concentration ratios. J. Plant Nutr. 1999, 22, 1415–1432. [Google Scholar] [CrossRef]
  14. Nemali, K.S.; van Iersel, M.W. Light intensity and fertilizer concentration: I. Estimating optimal fertilizer concentrations from water-use efficiency of wax begonia. HortScience 2004, 39, 1287–1292. [Google Scholar] [CrossRef] [Green Version]
  15. Gorbe, E.; Calatayud, A. Optimization of nutrition in soilless systems: A review. Adv. Bot. Res. 2010, 53, 193–245. [Google Scholar]
  16. Signore, A.; Serio, F.; Santamaria, P. A targeted management of the nutrient solution in a soilless tomato crop according to plant needs. Front. Plant Sci. 2016, 7, 391. [Google Scholar] [CrossRef] [Green Version]
  17. Resh, H.M. Hydroponics for the Home Grower; CRC Press: Boca Raton, FL, USA, 2015. [Google Scholar]
  18. Ding, X.; Jiang, Y.; Zhao, H.; Guo, D.; He, L.; Liu, F.; Zhou, Q.; Nandwani, D.; Hui, D.; Yu, J. Electrical conductivity of nutrient solution influenced photosynthesis, quality, and antioxidant enzyme activity of pakchoi (Brassica campestris L. ssp. Chinensis) in a hydroponic system. PLoS ONE 2018, 13, e0202090. [Google Scholar] [CrossRef]
  19. Park, S.Y.; Oh, S.B.; Kim, S.M.; Cho, Y.Y.; Oh, M.M. Evaluating the effects of a newly developed nutrient solution on growth, antioxidants, and chicoric acid contents in Crepidiastrum denticulatum. Hortic. Environ. Biotechnol. 2016, 57, 478–486. [Google Scholar] [CrossRef]
  20. Lam, V.P.; Lee, M.H.; Park, J.S. Optimization of Indole-3-Acetic Acid Concentration in a Nutrient Solution for Increasing Bioactive Compound Accumulation and Production of Agastache rugosa in a Plant Factory. Agriculture 2020, 10, 343. [Google Scholar] [CrossRef]
  21. Amalfitano, C.A.; Del Vacchio, L.D.V.; Somma, S.; Cuciniello, A.C.; Caruso, G. Effects of cultural cycle and nutrient solution electrical conductivity on plant growth, yield and fruit quality of ‘Friariello’pepper grown in hydroponics. Hortic. Sci. 2017, 44, 91–98. [Google Scholar]
  22. Hoagland, D.R.; Arnon, D.I. The water-culture method for growing plants without soil. Circ. Calif. Agric. Exp. Stn. 1950, 347, 32. [Google Scholar]
  23. Hikosaka, Y.; Kanechi, M.; Sato, M.; Uno, Y. Dry-fog aeroponics affects the root growth of leaf lettuce (Lactuca sativa L. cv. Greenspan) by changing the flow rate of spray fertigation. Environ. Control Biol. 2015, 53, 181–187. [Google Scholar] [CrossRef] [Green Version]
  24. Park, Y.G.; Oh, H.J.; Jeong, B.R. Growth and anthocyanin concentration of Perilla frutescens var. acuta Kudo as affected by light source and DIF under controlled environment. Hortic. Environ. Biotechnol. 2013, 54, 103–108. [Google Scholar] [CrossRef]
  25. Havlin, J.L.; Soltanpour, P. A nitric acid plant tissue digest method for use with inductively coupled plasma spectrometry. Commun. Soil Sci. Plant Anal. 1980, 11, 969–980. [Google Scholar] [CrossRef]
  26. Martre, P.; Porter, J.R.; Jamieson, P.D.; Triboï, E. Modeling grain nitrogen accumulation and protein composition to understand the sink/source regulations of nitrogen remobilization for wheat. Plant Physiol. 2003, 133, 1959–1967. [Google Scholar] [CrossRef] [PubMed] [Green Version]
  27. Ainsworth, E.A.; Gillespie, K.M. Estimation of total phenolic content and other oxidation substrates in plant tissues using Folin–Ciocalteu reagent. Nat. Protoc. 2007, 2, 875–877. [Google Scholar] [CrossRef]
  28. Lee, M.J.; Son, J.E.; Oh, M.M. Growth and phenolic compounds of Lactuca sativa L. grown in a closed-type plant production system with UV-A.,-B., or-C lamp. J. Sci. Food Agric. 2014, 94, 197–204. [Google Scholar] [CrossRef]
  29. Wrolstad, R.E.; Durst, R.W.; Lee, J. Tracking color and pigment changes in anthocyanin products. Trends Food Sci. Technol. 2005, 16, 423–428. [Google Scholar] [CrossRef]
  30. Gillespie, K.M.; Chae, J.M.; Ainsworth, E.A. Rapid measurement of total antioxidant capacity in plants. Nat. Protoc. 2007, 2, 867–870. [Google Scholar] [CrossRef]
  31. Nguyen, T.K.L.; Oh, M.M. Physiological and biochemical responses of green and red perilla to LED-based light. J. Sci. Food Agric. 2021, 101, 240–252. [Google Scholar] [CrossRef]
  32. Jones, J.B., Jr. Hydroponics: Its history and use in plant nutrition studies. J. Plant Nutr. 1982, 5, 1003–1030. [Google Scholar] [CrossRef]
  33. Lu, N.; Bernardo, E.L.; Tippayadarapanich, C.; Takagaki, M.; Kagawa, N.; Yamori, W. Growth and accumulation of secondary metabolites in perilla as affected by photosynthetic photon flux density and electrical conductivity of the nutrient solution. Front Plant Sci. 2017, 8, 708. [Google Scholar] [CrossRef] [Green Version]
  34. Li, Y.L.; Stanghellini, C. Analysis of the effect of EC and potential transpiration on vegetative growth of tomato. Sci. Hortic. 2001, 89, 9–21. [Google Scholar] [CrossRef]
  35. Klamkowski, K.; Treder, W. Response to drought stress of three strawberry cultivars grown under greenhouse conditions. J. Fruit Ornam. Plant Res. 2008, 16, 179–188. [Google Scholar]
  36. Nyoki, D.; Ndakidemi, P.A. Effects of Bradyrhizobium japonicum and phosphorus supplementation on the productivity of legumes. J. Plant Nutr. Soil Sci. 2014, 3, 894–910. [Google Scholar] [CrossRef]
  37. Savvas, D.; Passam, H.; Olympios, C.; Nasi, E.; Moustaka, E.; Mantzos, N.; Barouchas, P. Effects of ammonium nitrogen on lettuce grown on pumice in a closed hydroponic system. HortScience 2006, 41, 1667–1673. [Google Scholar] [CrossRef] [Green Version]
  38. Sadia, A.; Mahasen, M.; Shahrin, S.; Roni, M.; Uddin, A. Phsophorus levels on growth and yield of turnip (Brassica campestris var. rapifera). Bangladesh Res. Publ. J. 2013, 8, 29–33. [Google Scholar]
  39. Abou El-Magd, M.; Zaki, M.; Eldewiny, C.Y. Effect of planting dates and different levels of potassium fertilizers on growth, yield and chemical composition of sweet fennel cultivars under newly reclaimed sandy soil conditions. J. Am. Sci. 2010, 6, 89–105. [Google Scholar]
  40. Netto, A.T.; Campostrini, E.; de Oliveira, J.G.; Bressan-Smith, R.E. Photosynthetic pigments, nitrogen, chlorophyll a fluorescence and SPAD-502 readings in coffee leaves. Sci. Hortic. 2005, 104, 199–209. [Google Scholar] [CrossRef]
  41. Yang, H.; Li, J.; Yang, J.; Wang, H.; Zou, J.; He, J. Effects of nitrogen application rate and leaf age on the distribution pattern of leaf SPAD readings in the rice canopy. PLoS ONE 2014, 9, e88421. [Google Scholar]
  42. Tränkner, M.; Tavakol, E.; Jákli, B. Functioning of potassium and magnesium in photosynthesis, photosynthate translocation and photoprotection. Physiol. Plant. 2018, 163, 414–431. [Google Scholar] [CrossRef] [PubMed] [Green Version]
  43. Belkhodja, R.; Morales, F.; Sanz, M.; Abadía, A.; Abadía, J. Iron deficiency in peach trees: Effects on leaf chlorophyll and nutrient concentrations in flowers and leaves. Plant Soil 1998, 203, 257–268. [Google Scholar] [CrossRef] [Green Version]
  44. Rouphael, Y.; Cardarelli, M.; Lucini, L.; Rea, E.; Colla, G. Nutrient solution concentration affects growth, mineral composition, phenolic acids, and flavonoids in leaves of artichoke and cardoon. HortScience 2012, 47, 1424–1429. [Google Scholar] [CrossRef] [Green Version]
  45. Steiner, A.A. The selective capacity of plants for ions and its importance for the composition and treatment of the nutrient solution. Acta Hortic. 1980, 98, 87–98. [Google Scholar] [CrossRef]
  46. Steiner, A.A. A universal method for preparing nutrient solutions of a certain desired composition. Plant. Soil 1961, 15, 134–154. [Google Scholar] [CrossRef] [Green Version]
  47. Voogt, W.; Sonneveld, C. Nutrient management in closed growing systems for greenhouse production. In Plant Production in Closed Ecosystems; Springer: Berlin/Heidelberg, Germany, 1997; pp. 83–102. [Google Scholar]
  48. Winsor, G.; Adams, P.; Fiske, P.; Smith, A. Diagnosis of Mineral Disorders in Plants. v. 1. Principles.-v. 2. Vegetables.-v. 3: Glasshouse Crops; Her Majesty’s Stationery Office: London, UK, 1987.
  49. Chen, Y.; Guo, Q.; Liu, L.; Liao, L.; Zhu, Z. Influence of fertilization and drought stress on the growth and production of secondary metabolites in Prunella vulgaris L. J. Med. Plant. Res. 2011, 5, 1749–1755. [Google Scholar]
  50. Chishaki, N.; Horiguchi, T. Responses of secondary metabolism in plants to nutrient deficiency. In Plant Nutrition for Sustainable Food Production and Environment; Springer: Berlin/Heidelberg, Germany, 1997; pp. 341–345. [Google Scholar]
  51. Meng, L.; Lozano, Y.; Bombarda, I.; Gaydou, E.; Li, B. Anthocyanin and flavonoid production from Perilla frutescens: Pilot plant scale processing including cross-flow microfiltration and reverse osmosis. J. Agric. Food Chem. 2006, 54, 4297–4303. [Google Scholar] [CrossRef]
  52. Hilbert, G.; Soyer, J.; Molot, C.; Giraudon, J.; Milin, S. Effects of nitrogen supply on must quality and anthocyanin accumulation in berries of cv. Merlot. Vitis 2003, 42, 69–76. [Google Scholar]
  53. Horiguchi, T. Effects of nitrogen, phosphorus, and manganese deficiencies on the formation of anthocyanin and other phenolic compounds in plants. Jpn. J. Soil Sci. Plant. Nutr. 1989, 60, 226–232. [Google Scholar]
  54. Ito, M.; Toyoda, M.; Honda, G. Chemical composition of the essential oil of Perilla frutescens. Nat. Med. 1999, 53, 32–36. [Google Scholar]
  55. Seo, M.W.; Yang, D.S.; Kays, S.J.; Kim, J.-H.; Woo, J.H.; Park, K.W. Effects of nutrient solution electrical conductivity and sulfur, magnesium, and phosphorus concentration on sesquiterpene lactones in hydroponically grown lettuce (Lactuca sativa L.). Sci. Hortic. 2009, 122, 369–374. [Google Scholar] [CrossRef]
  56. David, E.; Mischan, M.; Marques, M.; Boaro, C. Physiological indexese macro-and micronutrients in plant tissue and essential oil of Mentha piperita L. grown in nutrient solution with variation in N, P, K and Mg levels. Rev. Bras. Plantas Med. 2014, 16, 97–106. [Google Scholar] [CrossRef] [Green Version]
  57. Chrysargyris, A.; Petropoulos, S.A.; Fernandes, Â.; Barros, L.; Tzortzakis, N.; Ferreira, I.C. Effect of phosphorus application rate on Mentha spicata L. grown in deep flow technique (DFT). Food Chem. 2019, 276, 84–92. [Google Scholar] [CrossRef] [Green Version]
  58. Yoshida, T.; Morisada, S.; Kameoka, K. On the distribution of oil gland and the accumulation of essential oil in Perilla species. Jpn. J. Crop Sci. 1969, 38, 333–337. [Google Scholar] [CrossRef] [Green Version]
  59. Ogawa, E.; Hikosaka, S.; Goto, E. Effects of nutrient solution temperature on the concentration of major bioactive compounds in red perilla. J. Agric. Meteorol. 2018, 74, 71–78. [Google Scholar] [CrossRef] [Green Version]
Figure 1. The ratio of the cations (K, Mg, Ca) and anions (N, S, P) of red perilla plant, greenhouse nutrient solution (CT), and the newly-developed nutrient solution for red perilla (NSP).
Agronomy 11 00932 g001
Figure 2. Fresh and dry weights of the shoot (A,B) and root (C,D) of red perilla plants grown under various EC levels of greenhouse nutrient solution (CT) and newly-developed nutrient solution for red perilla (NSP) after 7 weeks of transplanting. Different letters indicate significant difference at p < 0.05 (n = 9).
Agronomy 11 00932 g002
Figure 3. Plant height (A), number of node (B), number of main and side leaves (C,D), total leaf area (E), and SPAD (F) of red perilla plants grown under various EC levels of greenhouse nutrient solution (CT) and newly-developed nutrient solution for red perilla (NSP) after 7 weeks of transplanting. Different letters indicate significant difference at p < 0.05 (n = 9). NS means no statistically significant difference.
Agronomy 11 00932 g003
Figure 4. Principal component analysis (PCA) showing the effects of EC levels (1–6 dS m−1) of newly-developed nutrient solution for red perilla (NSP) on the plant growth characteristics. (A): the correlation circle of variables (SFW: shoot fresh weight, SDW: shoot dry weight, RFW: root fresh weight, RDW: root dry weight, PH: plant height, NN: number of nodes, NML: number of main leaves, NSL: number of side leaves, LA: leaf area); (B): the scatter plot of individuals (EC levels of NSP 1–6 dS m−1).
Agronomy 11 00932 g004
Figure 5. Total phenolic, total anthocyanin, and antioxidant concentration (A,C,E) and content (B,D,F) of red perilla plants grown under various EC levels of greenhouse nutrient solution (CT) and the newly-developed nutrient solution for red perilla (NSP) after 7 weeks of transplanting. Different letters indicate significant difference at p < 0.05 (n = 9).
Agronomy 11 00932 g005
Figure 6. RA, CA, and PA concentration (A,C,E) and content (B,D,F) of red perilla plants grown under various EC levels of greenhouse nutrient solution (CT) and the newly-developed nutrient solution for red perilla (NSP) after 7 weeks of transplanting. Different letters indicate significant difference at p < 0.05 (n = 6). NS means no statistically significant difference.
Agronomy 11 00932 g006
Table 1. The greenhouse nutrient solution (CT) and newly-developed nutrient solution for red perilla (NSP).
TreatmentElectrical Conductivity (dS m−1)Macro Elements (mg L−1)Micro Elements (mg L−1)
NPKCaMgSFeZnMoMnB
CT1109.324.76132.883.3828.844.571.330.070.0350.3470.16
NSP131.1727.86189.172.096.499.330.910.210.030.3350.21
Table 2. Macronutrient content of red perilla plants grown under various EC levels of greenhouse nutrient solution (CT) and the newly-developed nutrient solution for red perilla (NSP) after 7 weeks of transplanting. Different letters within the columns indicate significant differences by Duncan’s multiple range test at p ≤ 0.05 (n = 6).
TreatmentEC
(dS m−1)
Macronutrient Concentration (mg g−1)Macronutrient Content (mg)
NPKCaMgSNPKCaMgS
147.04b9.32b39.28d15.66ab4.80a2.38cd68.22abc13.47ab57.05bcd22.75ab7.00a3.46ab
CT247.92b9.70ab40.37cd15.34ab4.24b2.55ab73.30a15.01a62.24ab23.68ab6.58a3.96a
351.27ab10.31a36.76e13.43cd4.36b2.66ab57.12c11.50bc41.07e14.98de4.83b2.97b
148.40b9.22b44.63a16.20a2.45c2.31d77.64a14.72a71.50a26.00a3.90c3.69a
248.89b10.37a43.65ab15.17b2.29cd2.50bc74.27a15.59a66.02ab22.88ab3.43c3.77a
NSP350.29ab10.53a41.55bcd14.00c2.29cd2.58ab72.33ab15.17a59.87bc20.20bc3.29c3.73a
450.73ab10.31a42.00bc12.84d2.16cd2.65ab71.80ab14.66a59.68bc18.22cd3.08c3.75a
554.33a9.94ab45.16a11.73e2.04d2.68a59.53bc10.90c49.62cde12.85e2.23d2.94b
654.15a10.37a45.11a11.64e2.08d2.70a56.30c10.78c46.92de12.09e2.17d2.82b
Table 3. Micronutrient content of red perilla plants grown under various EC levels of greenhouse nutrient solution (CT) and the newly-developed nutrient solution for red perilla (NSP) after 7 weeks of transplanting. Different letters within the columns indicate significant differences by Duncan’s multiple range test at p ≤ 0.05 (n = 6).
TreatmentEC
(dS m−1)
Macronutrient Concentration (mg g−1)Macronutrient Content (mg)
NPKCaMgSNPKCaMgS
147.04b9.32b39.28d15.66ab4.80a2.38cd68.22abc13.47ab57.05bcd22.75ab7.00a3.46ab
CT247.92b9.70ab40.37cd15.34ab4.24b2.55ab73.30a15.01a62.24ab23.68ab6.58a3.96a
351.27ab10.31a36.76e13.43cd4.36b2.66ab57.12c11.50bc41.07e14.98de4.83b2.97b
148.40b9.22b44.63a16.20a2.45c2.31d77.64a14.72a71.50a26.00a3.90c3.69a
248.89b10.37a43.65ab15.17b2.29cd2.50bc74.27a15.59a66.02ab22.88ab3.43c3.77a
NSP350.29ab10.53a41.55bcd14.00c2.29cd2.58ab72.33ab15.17a59.87bc20.20bc3.29c3.73a
450.73ab10.31a42.00bc12.84d2.16cd2.65ab71.80ab14.66a59.68bc18.22cd3.08c3.75a
554.33a9.94ab45.16a11.73e2.04d2.68a59.53bc10.90c49.62cde12.85e2.23d2.94b
654.15a10.37a45.11a11.64e2.08d2.70a56.30c10.78c46.92de12.09e2.17d2.82b
Publisher’s Note: MDPI stays neutral with regard to jurisdictional claims in published maps and institutional affiliations.

