Article

Assessing the Population Structure of Colorado Potato Beetle Populations in Croatia Using Genetic and Geometric Morphometric Tools

by
Martina Kadoić Balaško
1,2,*,
Renata Bažok
1,
Katarina M. Mikac
2,
Hugo A. Benítez
3,4,
Margarita Correa
5 and
Darija Lemic
1
1
Department of Agricultural Zoology, Faculty of Agriculture, University of Zagreb, Svetošimunska 25, 10000 Zagreb, Croatia
2
Centre for Sustainable Ecosystem Solutions, School of Earth, Atmospheric and Life Sciences, Faculty of Science, Medicine and Health, University of Wollongong, Wollongong 2522, Australia
3
Laboratorio de Ecología y Morfometría Evolutiva, Centro de Investigación de Estudios Avanzados del Maule, Universidad Católica del Maule, Talca 3466706, Chile
4
Centro de Investigación en Recursos Naturales y Sustentabilidad (CIRENYS), Universidad Bernardo O’Higgins, Avenida Viel 1497, Santiago 8370993, Chile
5
Instituto de Alta Investigación, Universidad de Tarapacá, Casilla 7D, Arica 1000000, Chile
*
Author to whom correspondence should be addressed.
Agronomy 2022, 12(10), 2361; https://doi.org/10.3390/agronomy12102361
Submission received: 24 August 2022 / Revised: 25 September 2022 / Accepted: 28 September 2022 / Published: 30 September 2022

Abstract

:
The Colorado potato beetle (CPB, Leptinotarsa decemlineata Say) is one of the most successful invasive species worldwide. It has been present in Croatia since 1947, where it has caused significant damage to potato plants and developed resistance to several insecticides. Our study is the first attempt to investigate the population structure of CPBs in Croatia. SNP and GM techniques provided us with data about the population structure of the CPB population. A Bayesian model-based clustering algorithm implemented in STRUCTURE, principal component analysis (PCA), and discriminant analysis of principal components (DAPC) were used to analyze the genetic structure of CPBs. For the morphometric analysis, the hindwing shape of the same CPB individuals was examined using wing venation patterns. We detected the low genetic and phenotypic variabilities of CPB populations and the presence of a single panmictic population in the study area, well adapted to different environmental conditions, indicating high phenotypic plasticity. Due to such exceptional adaptation of the CPB population, it is necessary to implement an area-wide approach in future pest control management.

1. Introduction

Knowledge of insect pests’ invasion pathways, genetic differentiation, and dispersal routes is very important for the accurate application of control measures. The Colorado potato beetle (CPB, Leptinotarsa decemlineata Say) has been the most damaging pest of potato plants since its introduction to Europe in 1922 [1]. In Croatia, the pest was first discovered in 1947 near Zaprešić (central Croatia) and is now widespread throughout Croatia, except for a few islands [2]. The larvae and adults of CPBs can cause the complete defoliation of potato crops by feeding on leaves and stems [3]. If not controlled, the pest can severely destroy all the potatoes, resulting in total crop loss [4]. For over 80 years, CPBs have been successfully controlled with insecticides [5]. According to Gauthier et al. [6], CPBs played a major role in the emergence of the modern pesticide industry, as hundreds of chemicals were tested against them. To date, more than 300 cases of resistance to 56 insecticides have been reported worldwide [7].
The CPB is also one of the most important invasive pest species worldwide [8]. It has a complicated and diverse life history and a remarkable ability to adapt to toxins by developing resistance [4]. The high phenotypic plasticity may be one of the reasons why CPBs constantly develop resistance to all control measures that have been used against them, demonstrating their remarkable adaptability [9]. Phenotypic plasticity is the ability of an organism to change its genotype under the influence of various environmental factors and to establish and maintain a population in a given area [10,11,12,13,14]. High phenotypic plasticity is one of the most critical characteristics of invasive species, and it has profound evolutionary implications [15,16]. According to Cingel et al. [17], high resistance developing ability, together with phenotypic plasticity, makes this insect “indestructible”.
Information on the genetic structure of CPB populations is important for future sustainable control and management strategies [18,19,20,21]. The genetic study of this pest began with the work of Grapputo et al. [22]. They investigated the population structure and genetic variability of CPB populations using mtDNA and amplified fragment length polymorphism (AFLP) markers. Various molecular markers (isozymes, RAPD, RFLP, microsatellites, mtDNA) have been used to study the genetic differentiation and invasion process of CPBs [22,23,24,25,26,27,28,29,30,31,32]. Microsatellite markers have been found to be very useful in the study of invasive species [33,34]. Microsatellite markers for CPBs were developed by Grapputo in 2006 and have been used in several studies to investigate the invasive pathway of CPBs [29,31,32,35]. Recently, Crossley et al. [36] and Schoville et al. [37] used single nucleotide polymorphisms to study the CPB genome. Diversity array technology (DArT) is a method for DNA polymorphism analysis; it is a low-cost, robust, high-throughput system with minimal DNA sample requirements that provides comprehensive coverage of the genome [38]. DArTseq technology is a unified one-step method for SNP discovery and genotyping; it enables the comprehensive discovery of SNPs in a variety of non-model organisms and provides a measure of genetic divergence and diversity within major genetic groups [39]. Therefore, this method has become an affordable and accessible means to generate important data on species that would otherwise have been impossible due to the cost and availability of expertise.
In addition to genetic markers, the variability of insect populations can also be studied using geometric morphometric (GM) methods [40,41,42]. The first morphological traits to change under the influence of environmental and genetic factors are the metric traits (wing shape and size) [43,44]. That is why geometric morphometric (GM) method has been used to study the genetic variability and plasticity of different insect species [45,46,47,48,49,50] over the last several years. By analyzing wing size and shape, it is possible to reveal the invasive adaptation of the adults’ traits to different environmental influences. GM methods can also be used as a monitoring technique for detecting resistant insect populations and as a precursor for effective integrated pest management strategies [51,52,53]. GM methods are relatively simple, easy to apply, and require minimal financial investment, expert guidance, and equipment [54].
In this study, we use single nucleotide polymorphism markers and geometric morphometric methods to estimate genomic and phenotypic variations in CPB populations. This is the first study where these methods are combined to evaluate the genetic and phenotypic variations of CPBs. Our approach aims to use this data to describe the overall CPB population and to improve pest management strategies in order to delay resistance development.

2. Materials and Methods

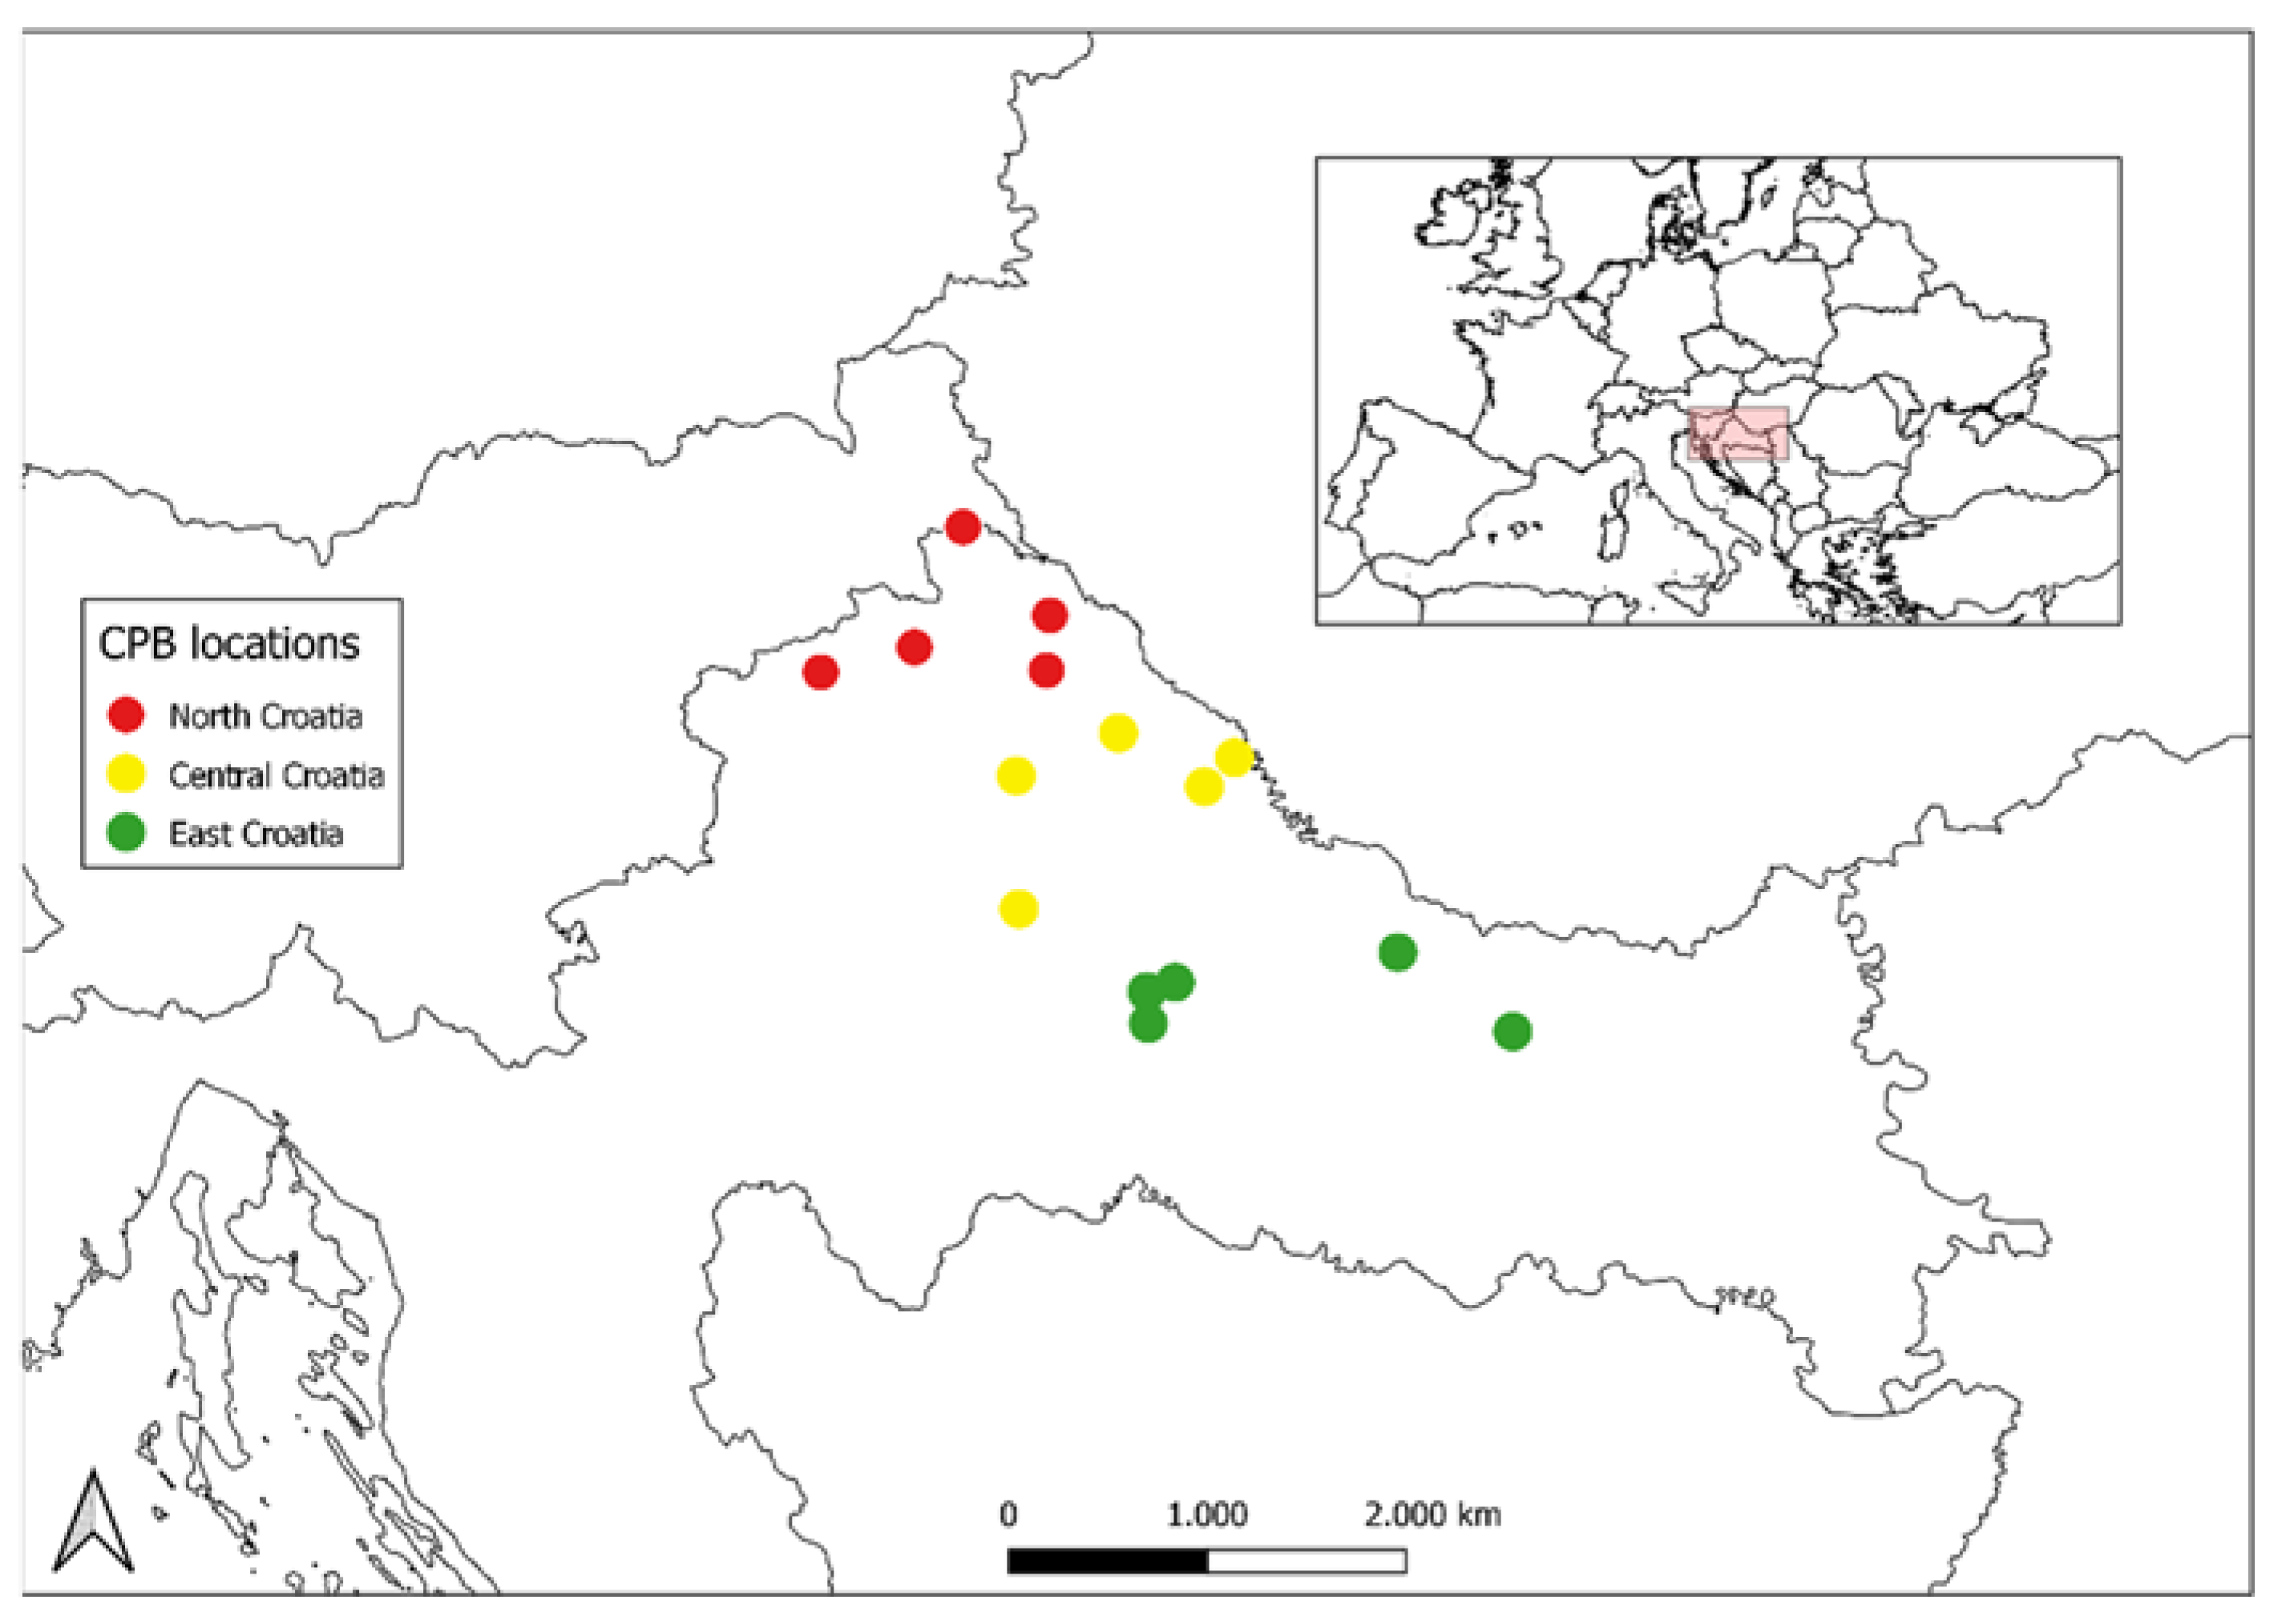
2.1. Sampling and DNA Extraction

A total of 15 putative CPB populations were sampled in this study (Table 1). Populations were collected from the main potato-growing areas in continental Croatia (Figure 1). Adult CPB individuals were collected by hand from infested potato plants during the growing seasons in the years 2017, 2018, and 2019. All samples were stored in labeled plastic cups in 95% ethanol at 4 °C. Genomic DNA was extracted from the thorax of 82 CPB individuals, and total genomic DNA was isolated using the Qiagen DNEasy Blood and Tissue Kit (Qiagen, Hilden, Germany) according to the manufacturer’s protocols. DNA quality and concentration were determined using a spectrophotometer (BioSpec–nano Micro–volume) and agarose gel electrophoresis (1% with GelGreen Nulceid Acid Stain–Biotium). Extracted DNA was sent to Diversity Array Technology, Australia, for sequencing and genotyping using DArTseq TM genotyping technology [55].

2.2. Genetic Analyses

Data received from DArT were first subjected to a filtering process using the dartR package [56] in R software [57]. Data were filtered using the following criteria: call rate <90% (i.e., removing all SNPs that have 10% missing genotypes or greater); reproducibility <95%; minor allele frequencies (MAF) >0.01; all monomorphic SNPs and fragments containing more than one SNP were removed from the data set.
The SNPRelate package [58] was used to estimate the parameters of genetic variability for each population number of different alleles (A); the number of private alleles (P); observed heterozygosity (HO); expected heterozygosity (HE). Using the filtered data set, pairwise FST was calculated between CPB populations using the gl.fst.pop command in the dartR package. To determine the overall basic population genetics statistics (observed heterozygosity (HO), inbreeding coefficient per locus (FIS), and FST corrected for the number of individuals per locus), the function gl.basic.stats in dartR was used. An analysis of molecular variance (AMOVA) was performed to estimate the variance components and their significance levels of genetic variation within and among populations using GenALEx version 6.5 [59].
In order to observe the genetic relationships between populations, principal component analysis (PCA) was carried out using the package “dartR” [56]. For further analysis of the genetic structure of CPB populations, discriminant analysis of principal components (DAPC) was implemented in the R package “adegenet” [60].
The Bayesian model-based clustering algorithm implemented in STRUCTURE v.2.3.4, the Evanno method [61], was employed to determine the genetic structure of the CPB populations investigated. The genetic clusters (K-values) ranged between 1 and 16 (one more population than the total number of populations for the complete data set), and a series of 10 replicate runs for each prior value of K was analyzed. The parameter set for each run consisted of a burn-in of 10,000 iterations, followed by 100,000 Markov chain Monte Carlo iterations based on the admixture model of ancestry with the correlated allele frequency model and the default parameters in STRUCTURE. The most suitable value of K was calculated using the DK method, as used in STRUCTURE Harvester web version 0.6.94 [62], where the highest DK value is indicative of the number of genetic clusters.
Mantel tests were conducted to test for correlations between genetic distance and geographic distance; these analyses were conducted using the vegan package in R [63].

2.3. Geometric Morphometric Analyses

The hindwings of the CPB individuals were removed prior to DNA isolation to allow the same populations to be used for both genetic and morphometric analyses. To perform the geometric morphometric analyses, we divided the CPB data into three geographical locations—central, east, and north Croatian—in which the left and right hindwings were removed from each individual and slide–mounted using the fixing agent Euparal for the analyses; 258 left slide–mounted wings were photographed using a Canon PowerShot A640 digital camera (10–megapixel) on a trinocular mount of a Zeiss Stemi 2000–C Leica stereo–microscope and saved in JPEG format using Carl Zeiss AxioVision Rel. 4.6. (Carl Zeiss Microscopy GmbH, München, Germany). Sixteen landmarks on the wing vein junctions or vein terminations (Figure 2) were digitized using the software TPS Dig2 v2.16 [64].
Landmark coordinates were determined and shape information extracted using Procrustes superimposition analysis [65], which superimposes the landmark configurations of all the individuals analyzed, fitting them to a unit centroid size and removing mathematical information from the rotation and translation of all configurations. Principal component analysis (PCA) was performed using a covariance matrix of the individual shapes to simulate the shape space. In order to identify the principal wing changes, an average shape covariance matrix was performed, and the individual mean shapes were extracted (central, east, and north). In order to identify if there was any influence of size on shape (allometry) between populations, a multivariate regression using centroid size as an independent variable and shape as a dependent value was performed. Finally, to organize the data and maximize the disparity from the variance of each geographic group, canonical variate analysis (CVA) was performed, including on a sterile population, and the scatterplot was superposed with the mean shape by all geographical zones.

3. Results

3.1. Genetic Variability

A total of 22 772 SNPs were obtained from 82 CPB individuals that were genotyped. After the filtering process (90% call rate, the minor allele frequency filter, SNPs with frequencies <1%, reproducibility set at 95%) and removing monomorphs and secondaries, 7681 SNPs were used for the final analyses.
Heterozygosity (HO and HE) was estimated for all loci, and the results showed that CPB populations from different regions of Croatia were very similar (Table 2). The average HO ranged from 0.251 (north Croatia) to 0.258 (central Croatia), while the average HE ranged from 0.320 (north Croatia) to 0.326 (east Croatia). There were no observed differences between populations from different regions. FIS was used to check the degree of inbreeding within populations, ranging from 0.201 (central Croatia) to 0.218 (east Croatia). Therefore, low levels of genetic variability across all populations are suggested.

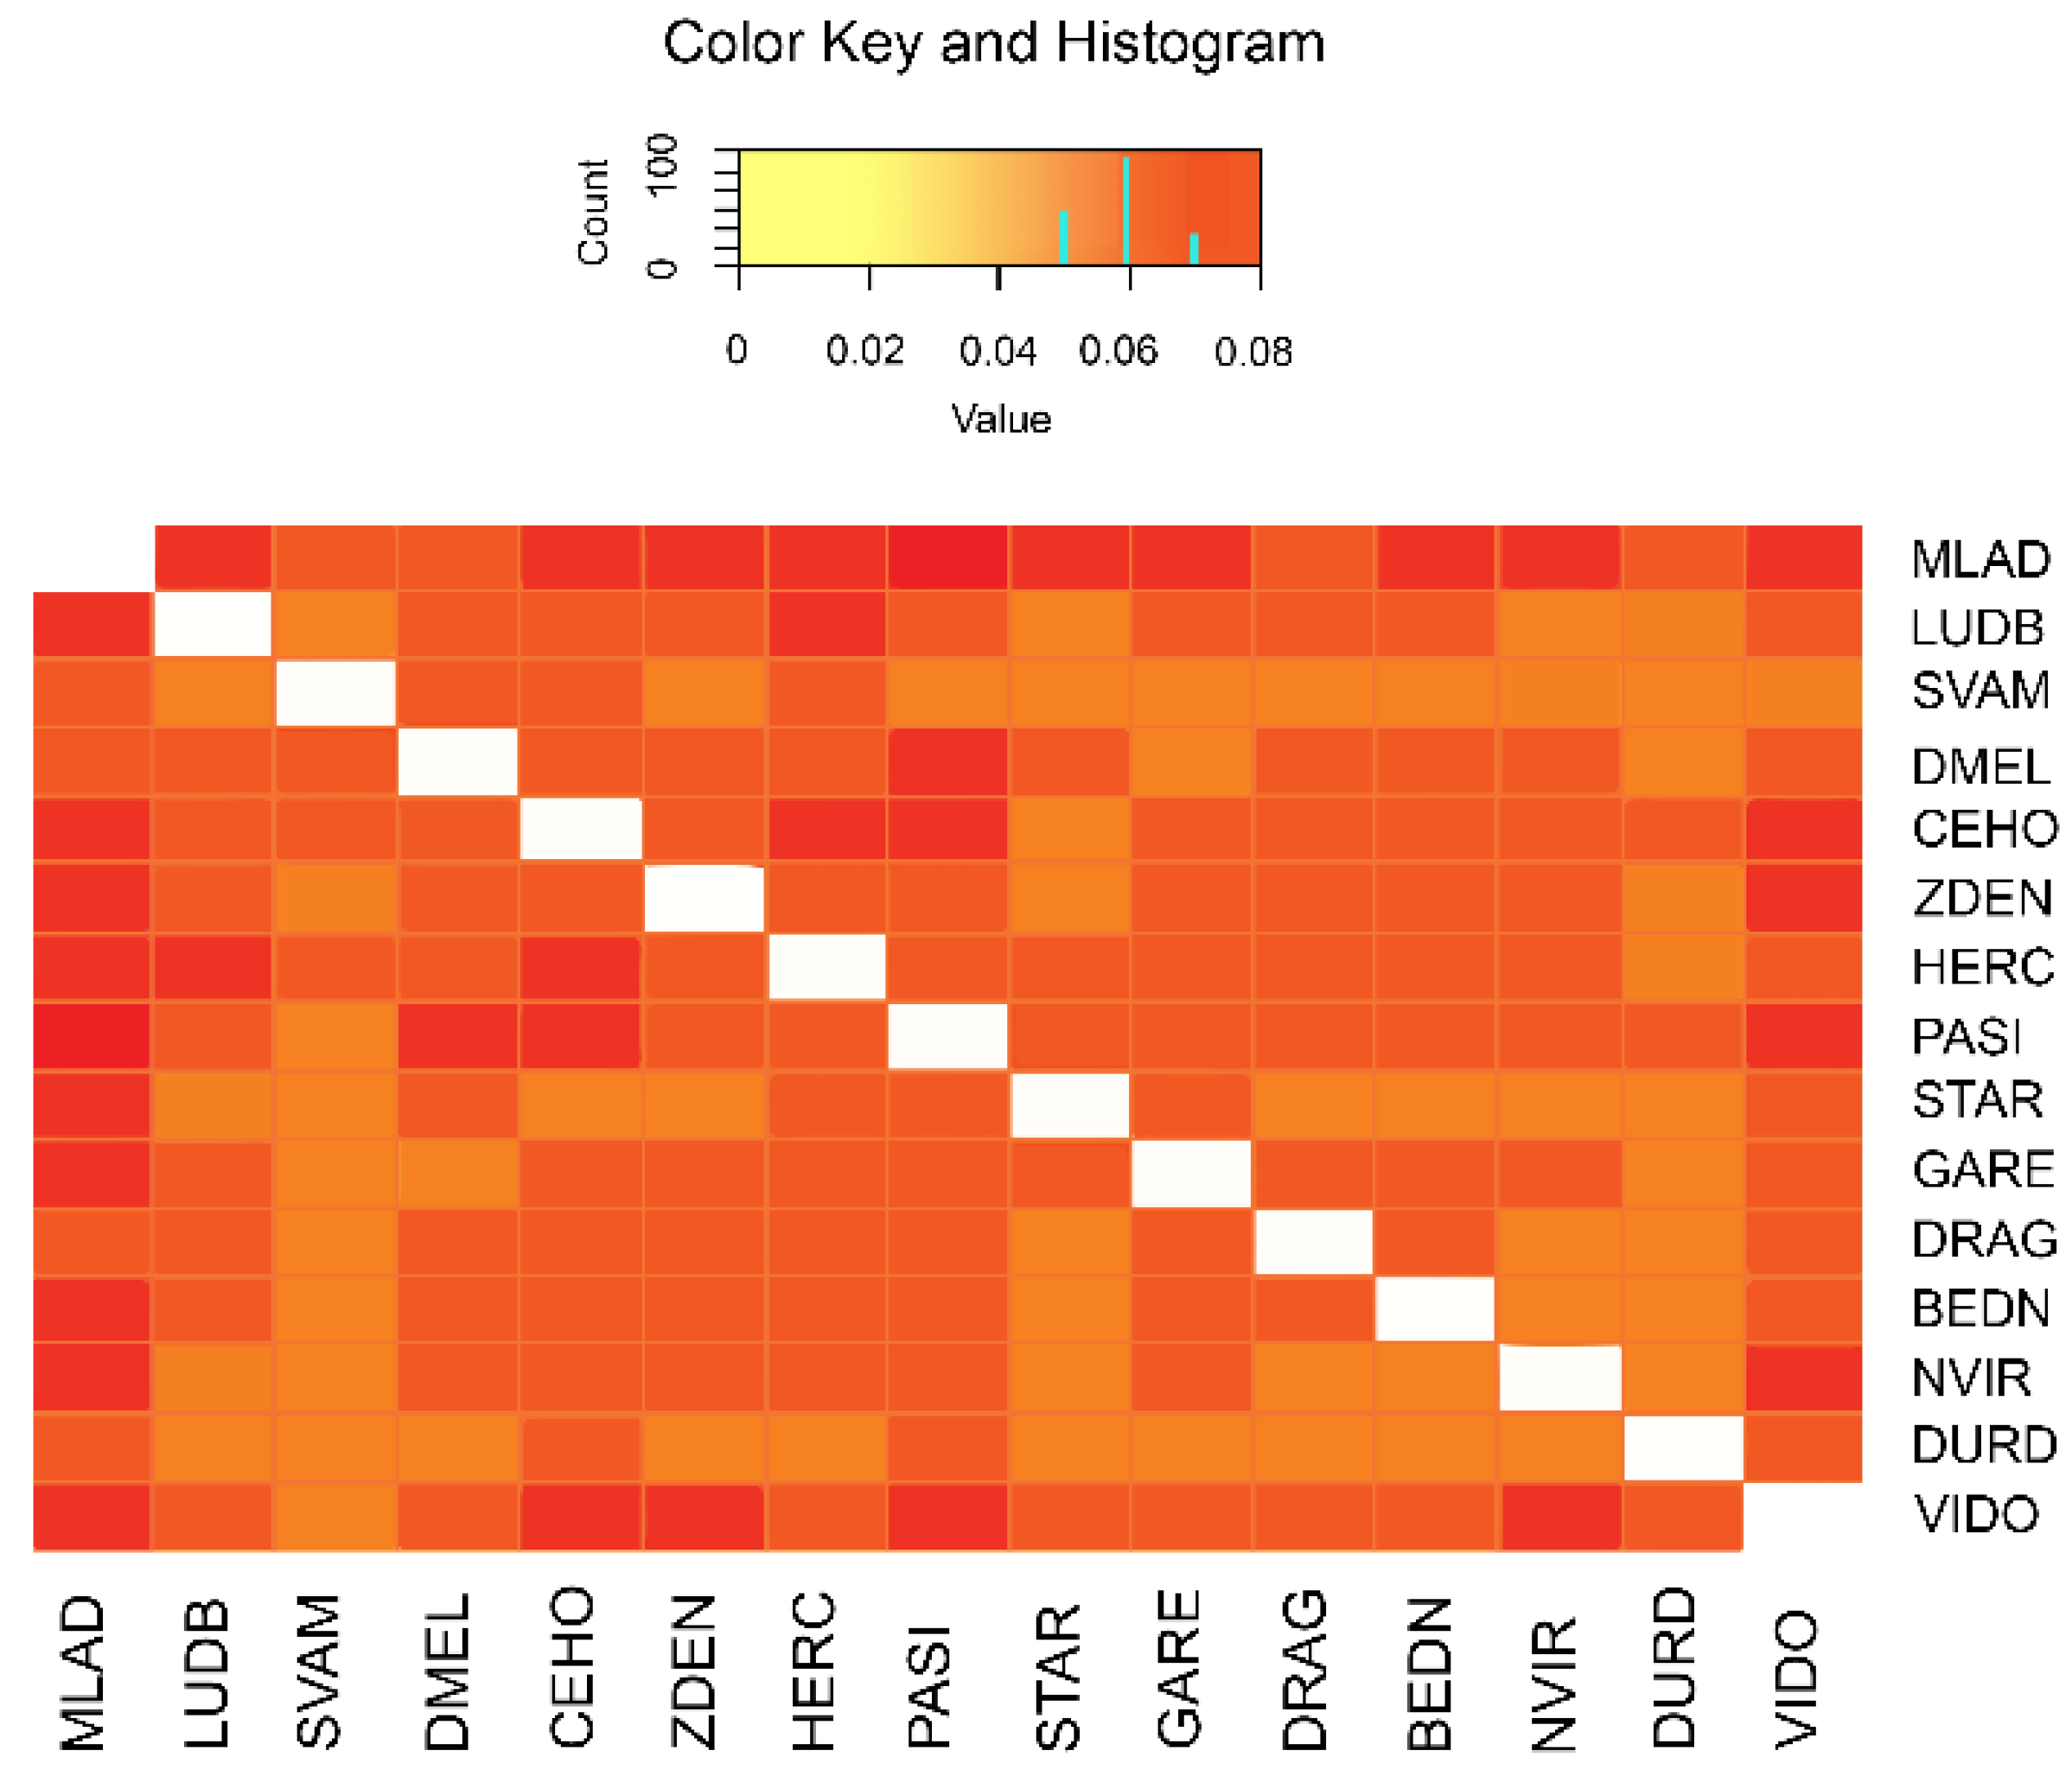
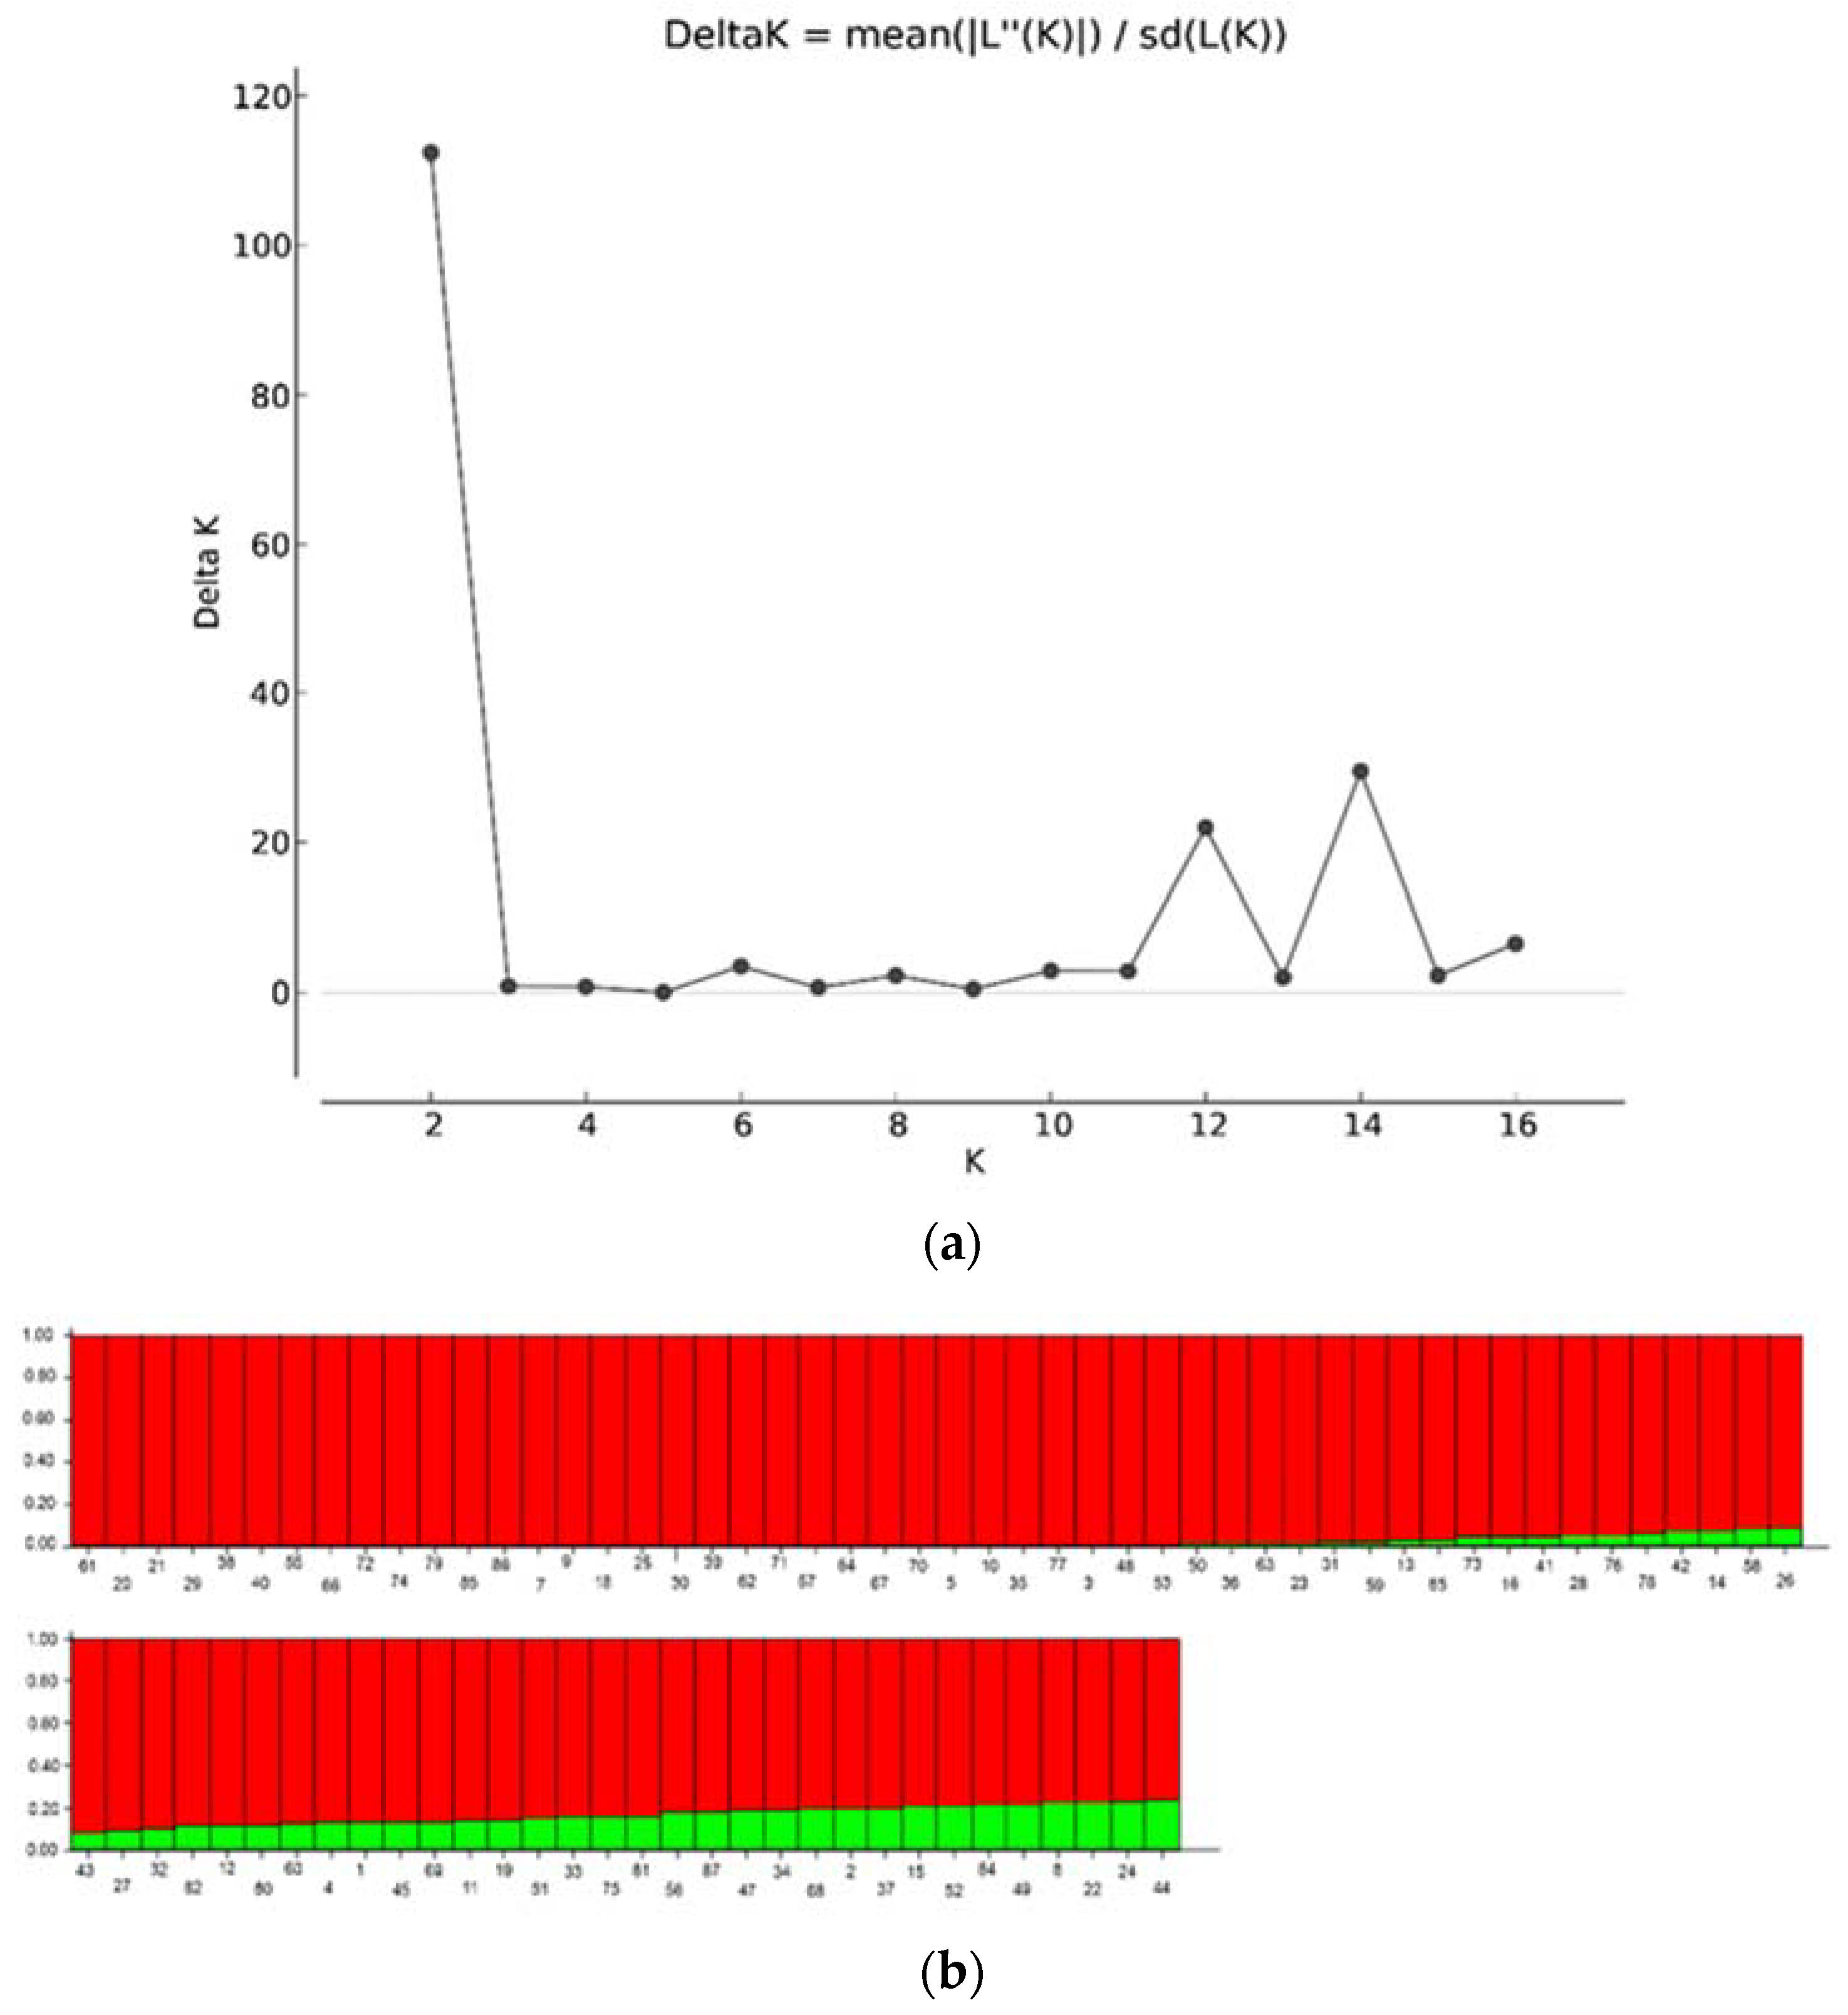
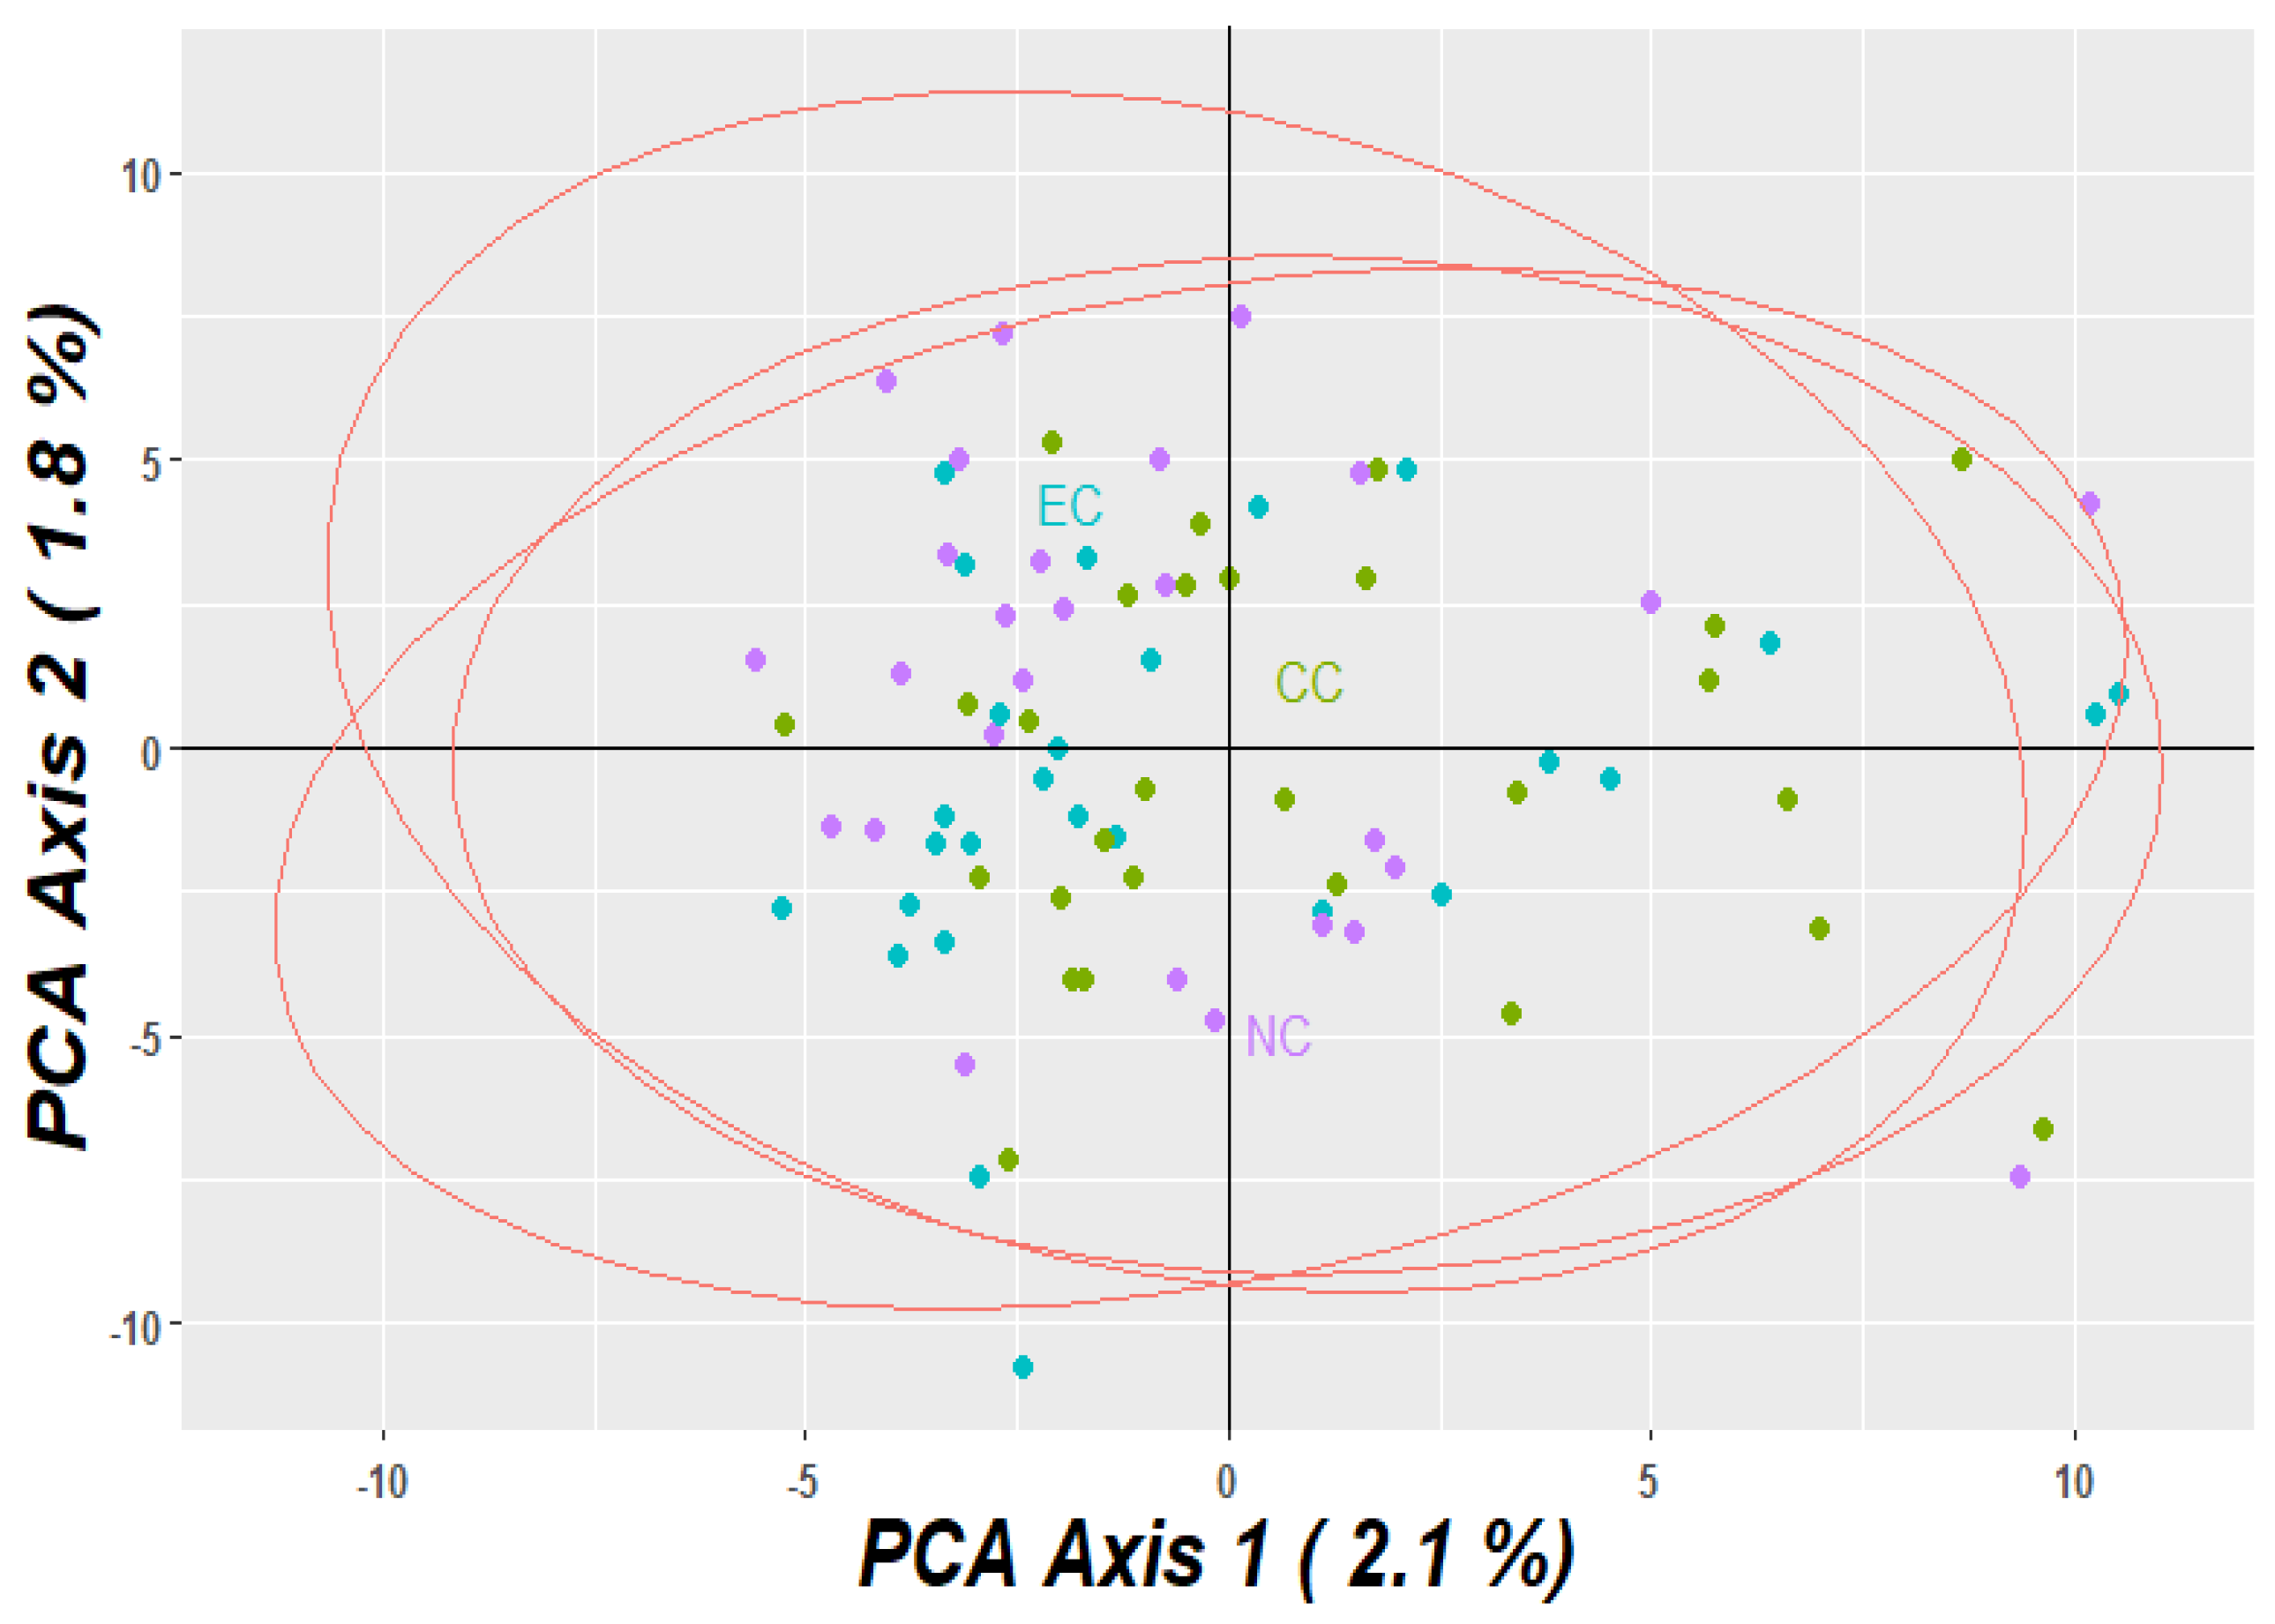
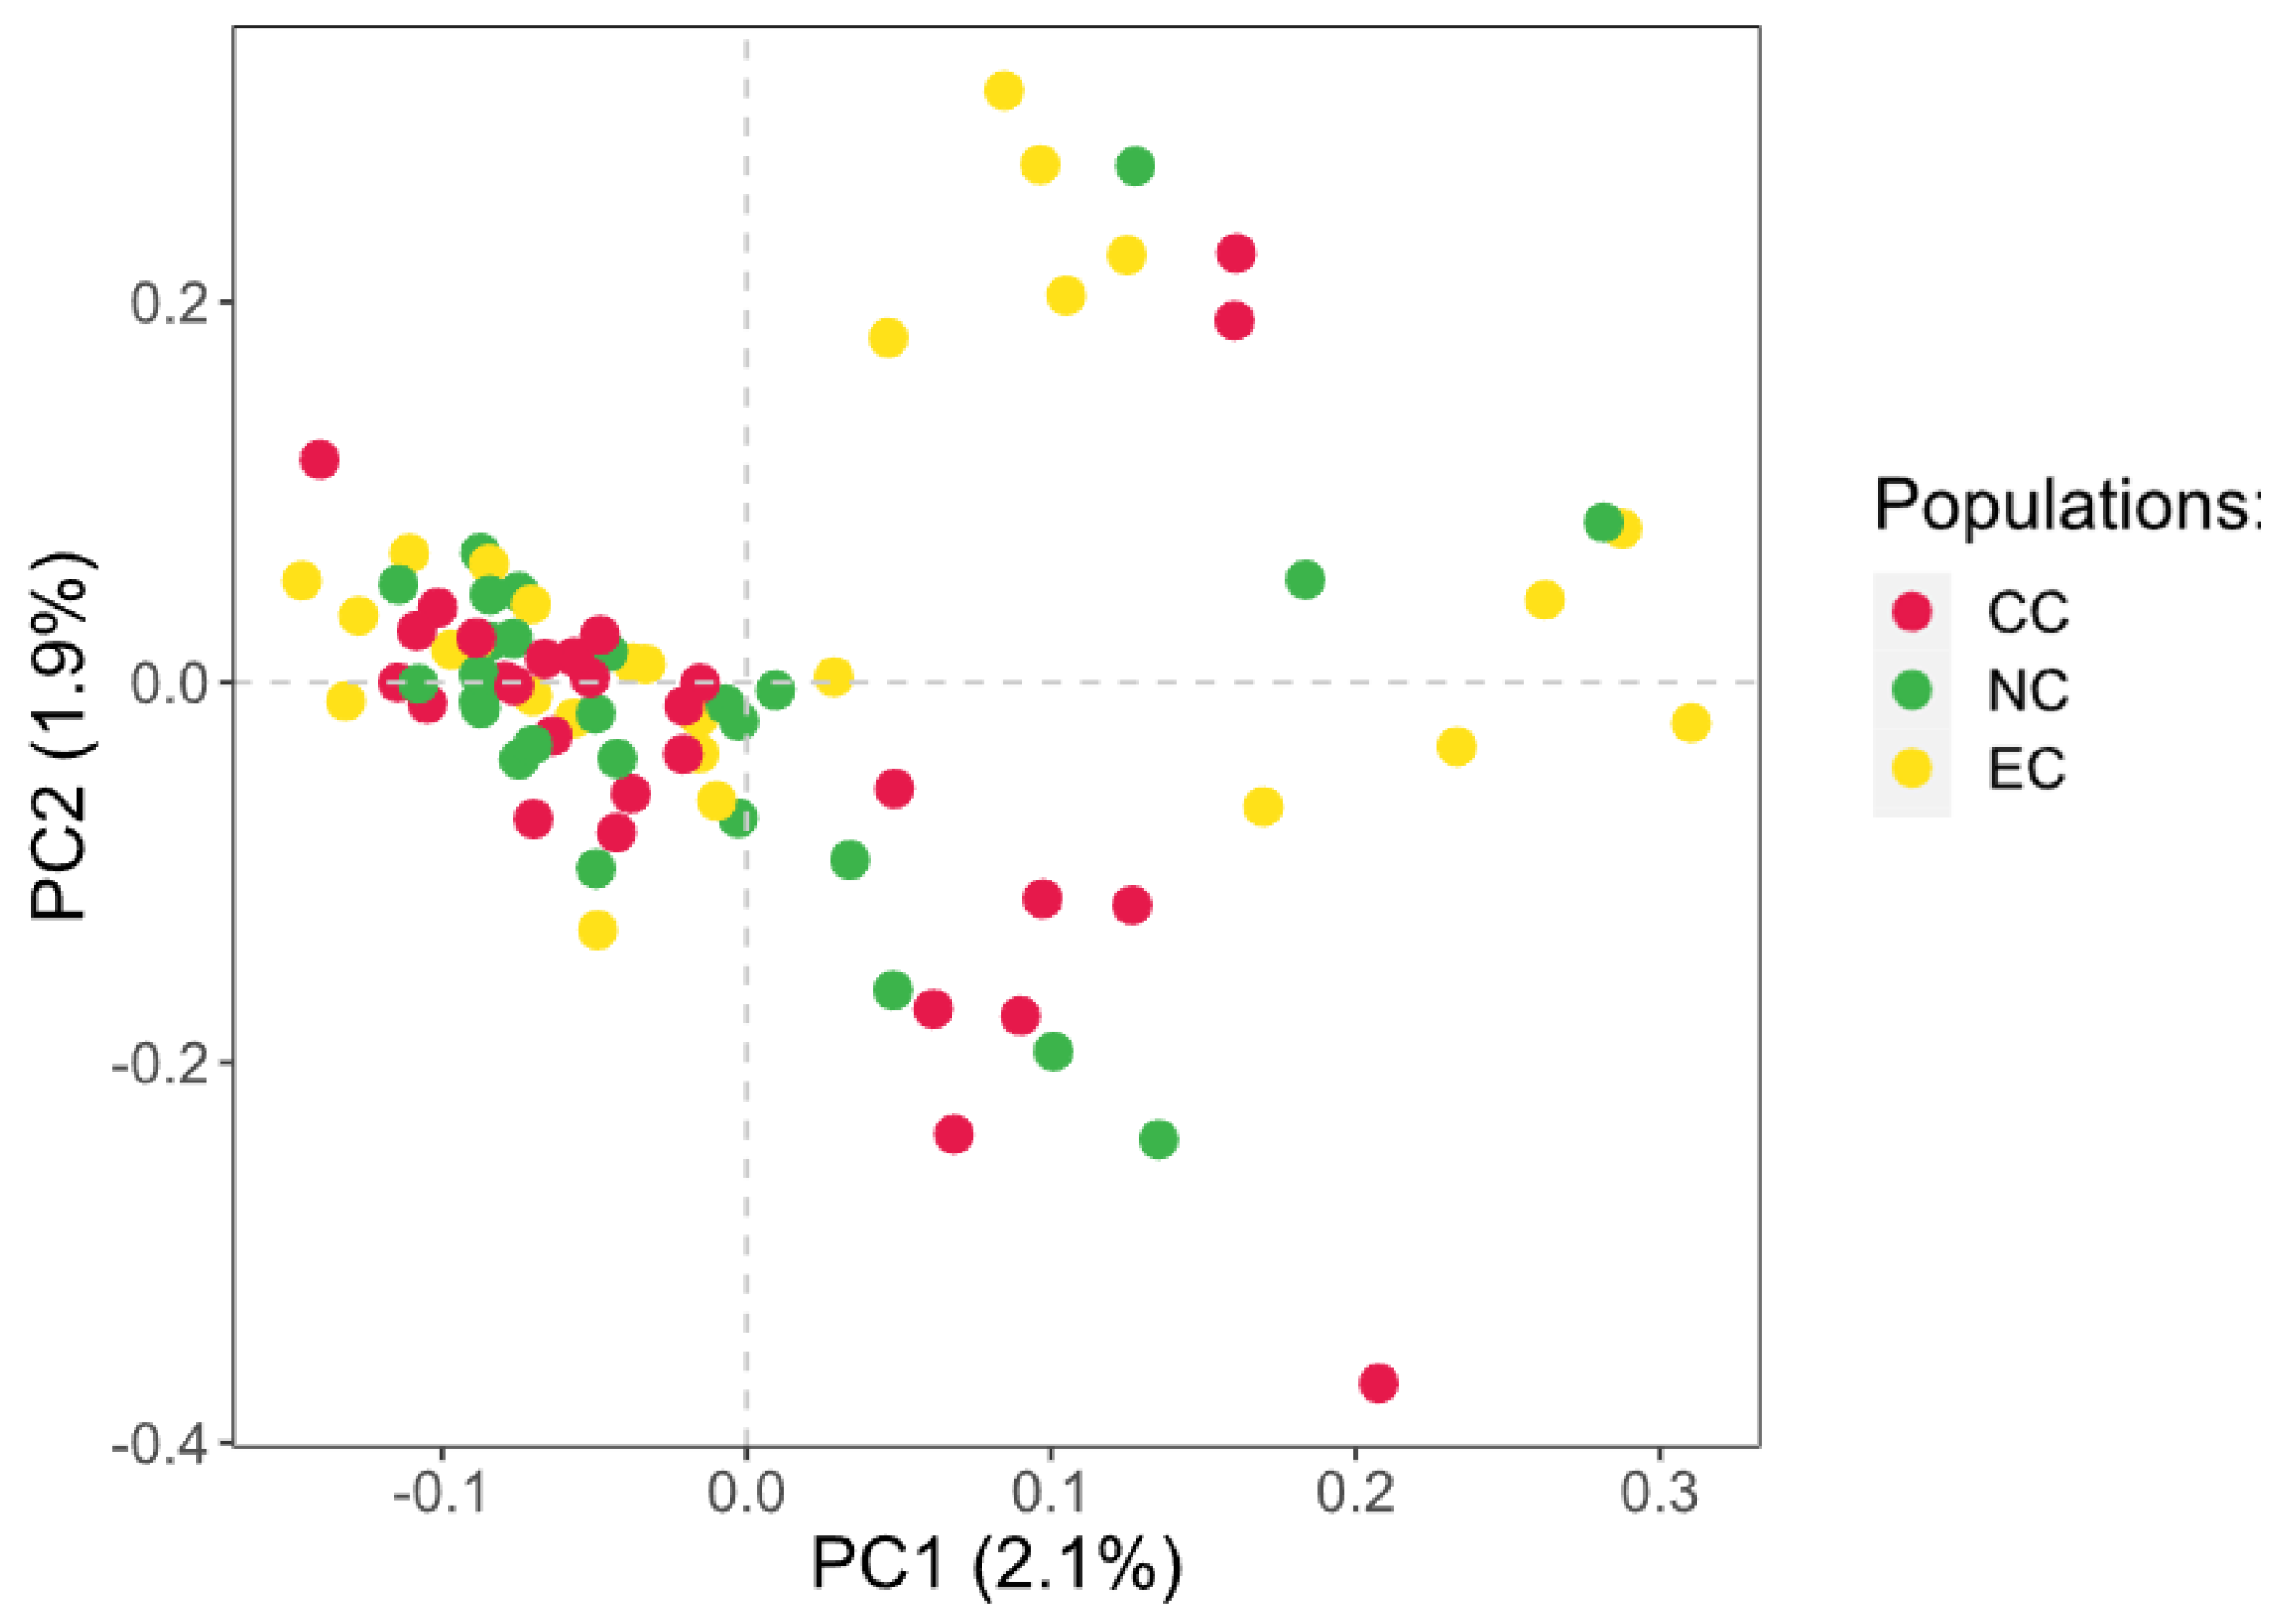
3.2. Population Relationship

Pairwise FST values were calculated to reveal the genetic relationships between the CPB populations (Figure 3). The result showed that the genetic differentiation between populations was very low. The FST values ranged from 0.05 (SVAM–LUDB) to 0.08 (MLAD–PASI) (Figure 3). The Mantel test was used to check the isolation by distance among populations. The result showed a low correlation between genetic and geographic distance, which was expected, considering that for isolation by distance, we would expect a high FST, indicating that the genetic differentiation would have been increased due to the distance. AMOVA revealed significant differences in FST values between pairwise populations in the study (F15,224 = 2.31; p < 0.05) (Table 3). There was no evidence to rule out the presence of a single large population of CPBs in continental Croatia.
The Bayesian approach of clustering by Evanno’s method demonstrated a clear peak at K = 2 (Figure 4a), indicating that two groups were distributed across the CPB populations. A complete admixture of populations was observed in the STRUCTURE plot (Figure 4b). PCA was conducted to examine the structure of CPB populations in Croatia. The PCA analysis showed genetic similarities within the data set and confirmed a single large CPB population in Croatia (Figure 5). DAPC showed the same pattern of genetic structure in the CPB populations (Figure 6). We used PCA and DAPC (different approaches) to see if there were any differences in our results. DAPC attempts to summarize the genetic differentiation between groups while ignoring the variation within groups and provides a better population structure. In DAPC, the data are first transformed using PCA, and then clusters are identified using discriminant analysis (DA) [66]. PCA aims to summarize the total variability between individuals, which includes both the divergence between groups (i.e., structured genetic variability) and the variation within groups; therefore, it is not always suitable for obtaining a clear picture of variation between populations. However, the results were complementary.

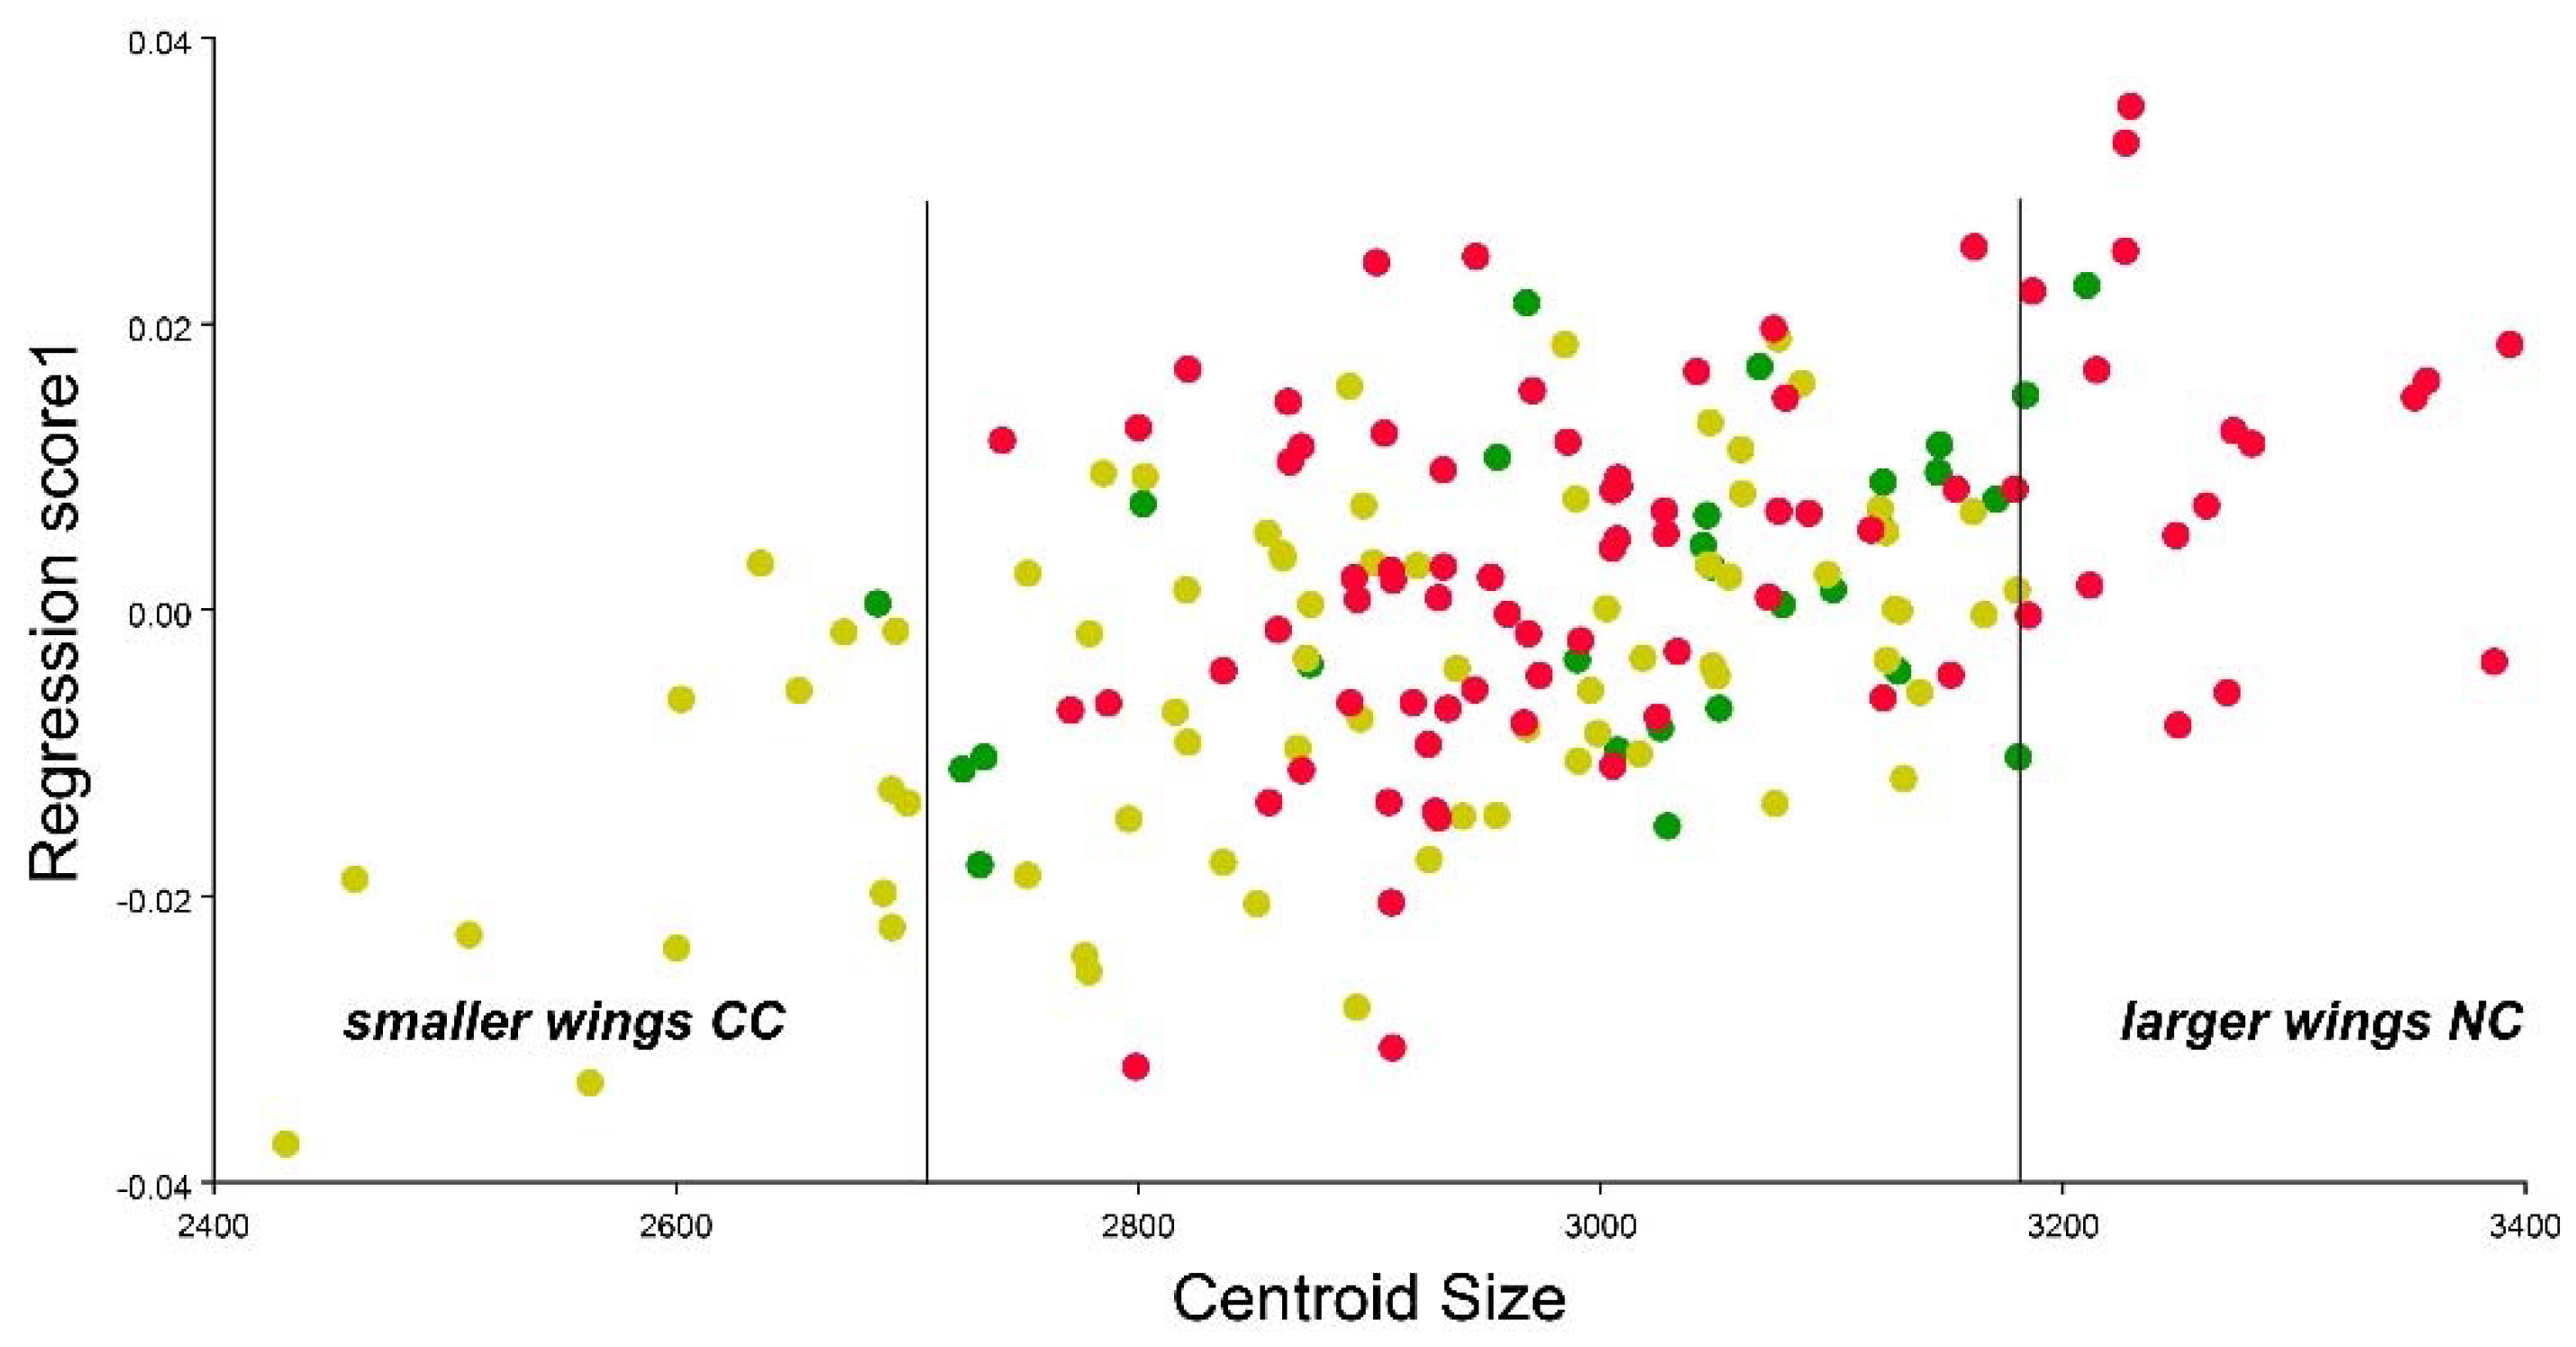
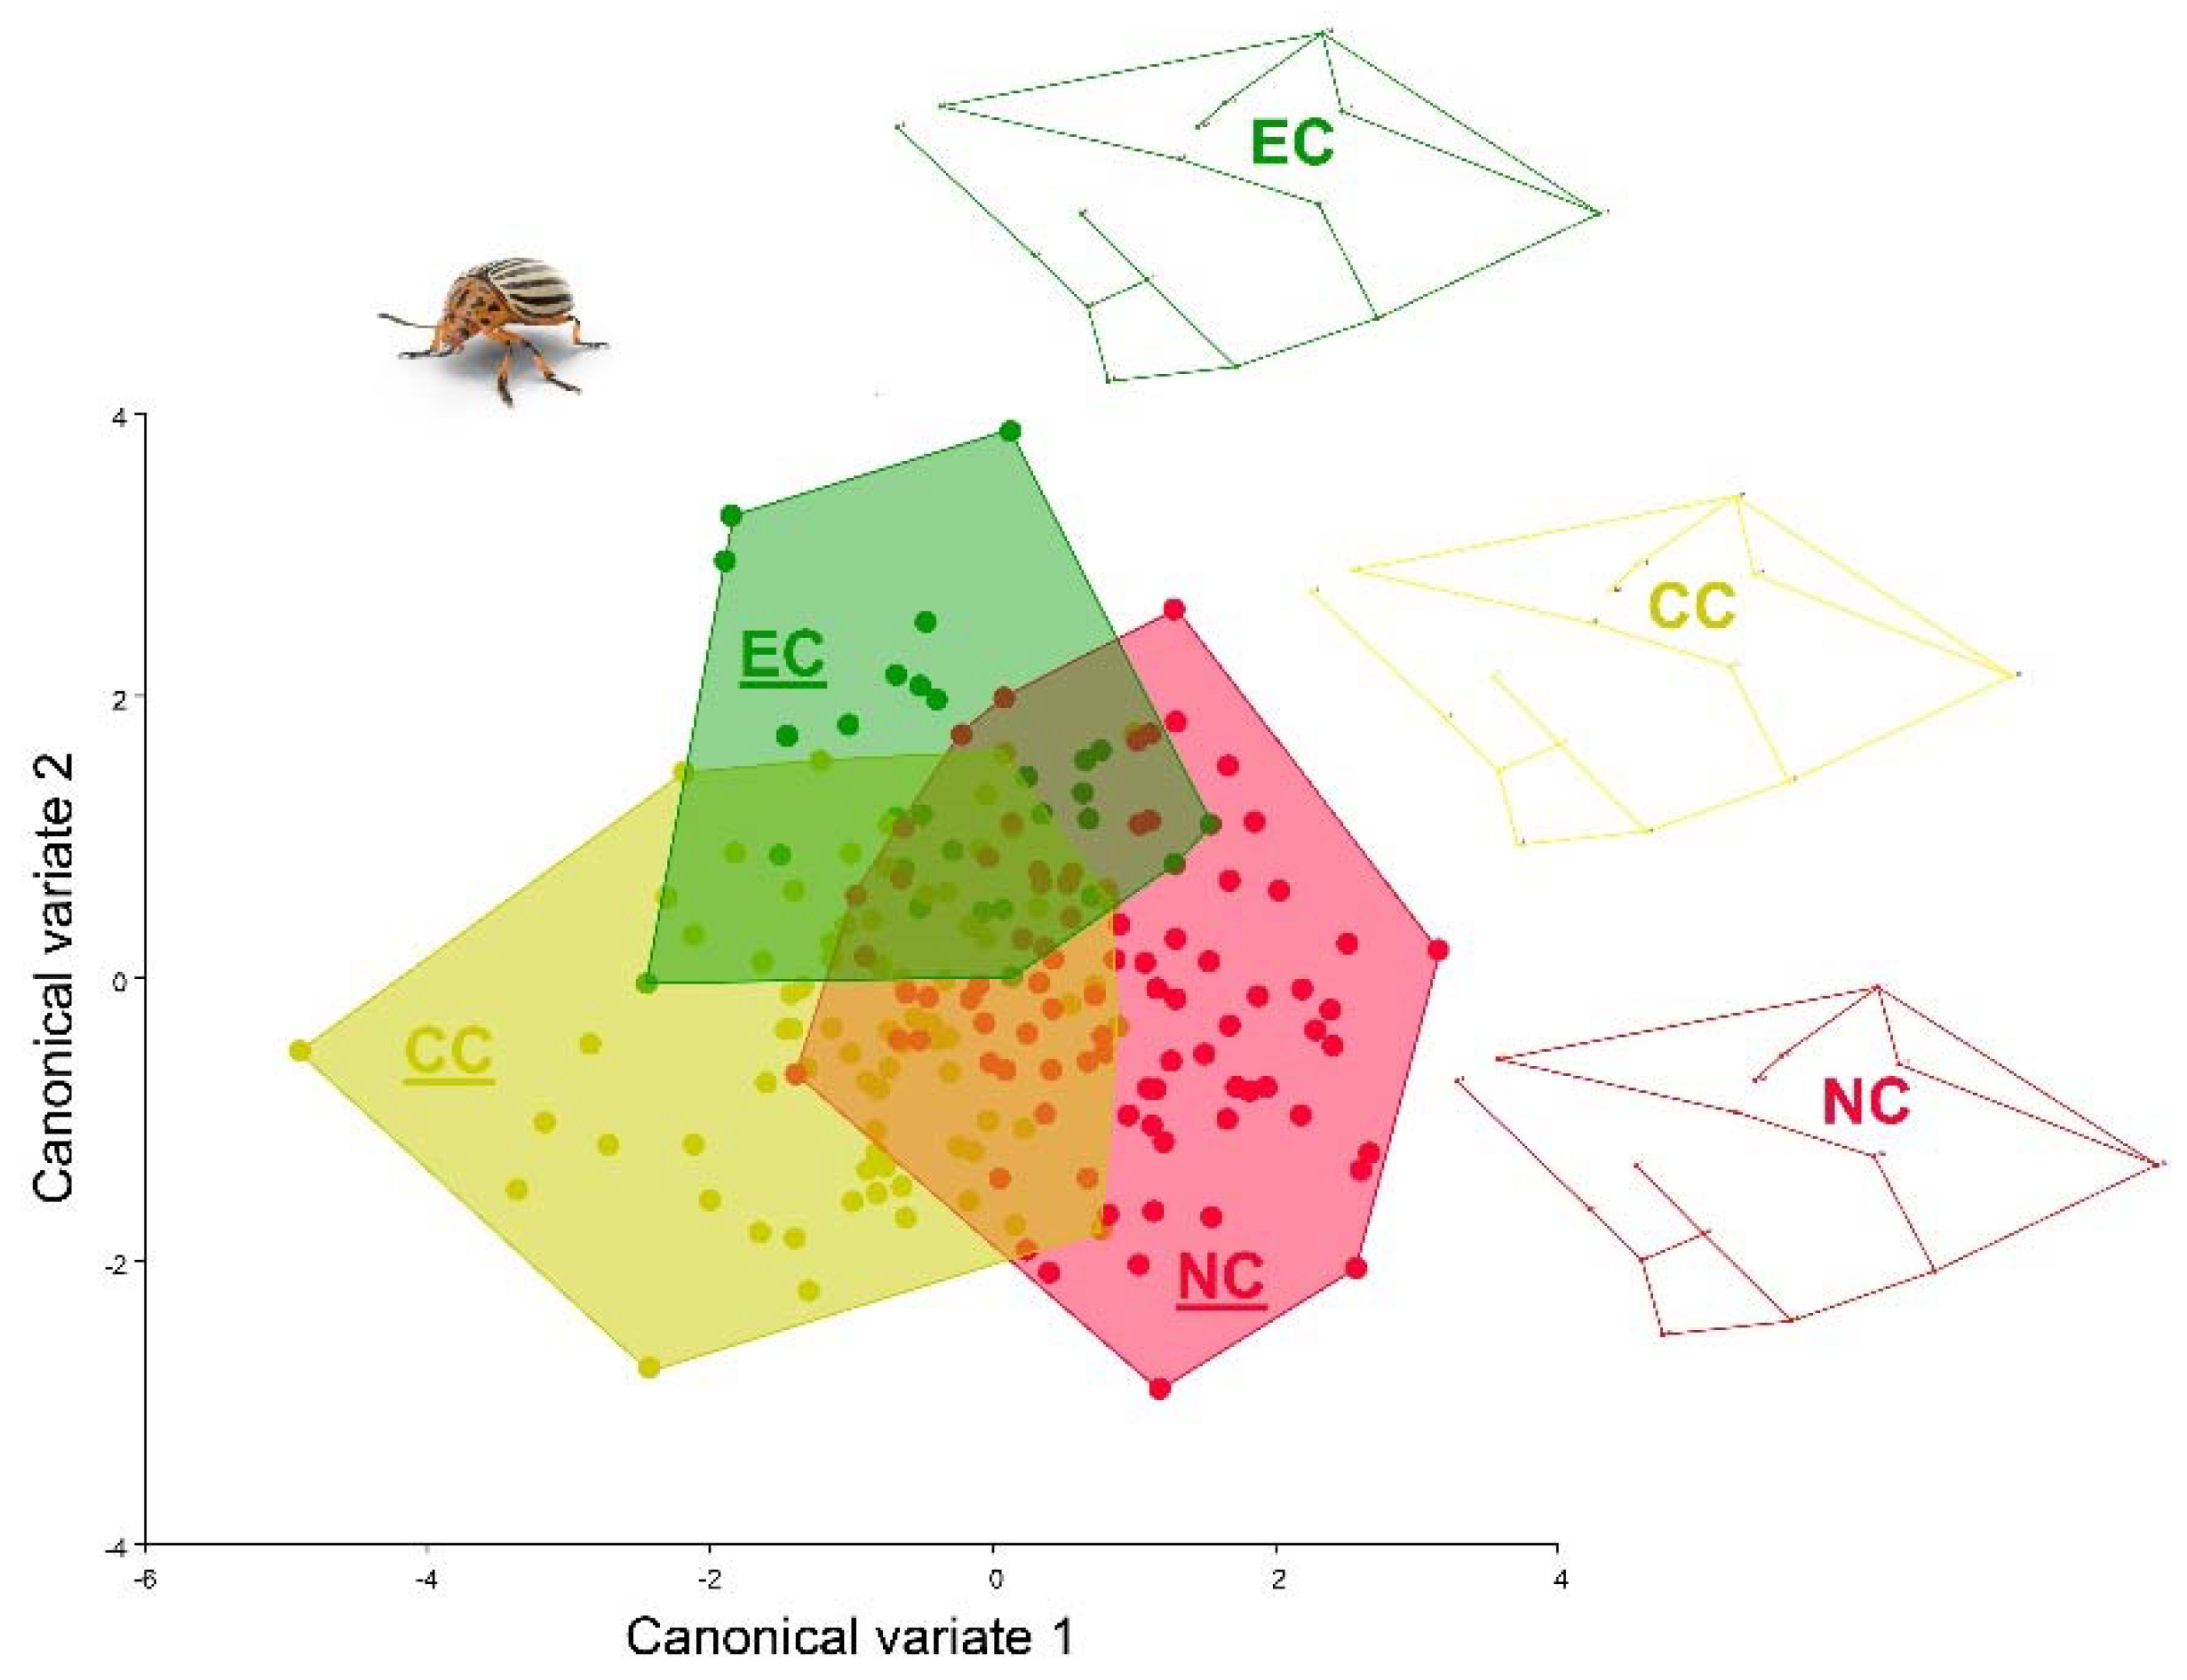
3.3. Geometric Morphometrics Results

PCA showed a shape space where the first three dimensions accounted for 41.2% of the shape variation (PC1: 16.1%, PC2: 13.01%, PC3: 12.3%). The average shape found that the individuals from north Croatia (NC) had a more elongated wing shape than those from east (EC) and central Croatia (CC), where the displacement to the extreme left and right of landmarks 4 and 16 is noted. On the other hand, the CPBs from central Croatia had slight movements of landmarks 2, 13, and 14 and showed a broader phenotype. CPBs from east Croatia also showed wider wings but with a contraction of landmarks 1 and 8. Multivariate regression showed a low but significant relationship between shape and centroid size (CS) (r2: 0.033; p < 0.001, after 10,000 iterations). This was most noted in the differences in CS between central and northern Croatian populations, where the CS in the CC population was found to be smaller than in the NC population (Figure 7). The CVA between groups showed three principal clusters where the maximum variation of geographical zones was grouped. CV1 explains the hindwing variation between CC and NC populations; the hindwing shape for the EC population is explained by CV2 (Figure 8).

4. Discussion

The CPB is considered an invasive species, and it has been present in Croatia for more than sixty years [2]. During this time, the CPB has adapted to a wide range of solanaceous plants, agroecological climatic conditions, and control measures [2].
In this study, we investigate the CPB populations using SNP and GM techniques. SNP and GM techniques have provided us with data about the population structure of the CPB population in Croatia. We detected the low genetic variability of CPB populations in Croatia and the presence of a single panmictic population in the study area. The GM method allowed us to find morphological changes associated with the geographical areas of Croatia; GM also confirmed a low difference while demonstrating phenotypic plasticity in this species. Results showed that we have one single CPB population in continental Croatia that is well established and well adapted.
The low genetic and morphological variability detected among the CPBs can be explained, according to Bouyer et al. [44], by genotype stability, which is reflected in a stable phenotype. The different approaches we used in this study (SRUCTURE, PCA, and DAPC) gave the same results.
Data on potato production in Croatia date back to 1991, and, according to FAO [67], the area under potato production has decreased from year to year (1992—60,758 ha; 2019—9390 ha). The structure of potato cultivation has also changed because, in the 1990s, potatoes were grown on a large scale on homesteads near settlements, and during that time, the availability of food for CPBs was much better. This information is very important because it can be assumed that CPBs were forced to search for new potato fields and move to new cropping areas. Today, potatoes are grown in fields that are often quite far apart, likely resulting in the need for longer flights to find food. Our results show the Wahlund effect, which can be defined as the excess of homozygotes or the deficit in heterozygotes observed in a sample of individuals obtained from a structured population, even when the local populations are randomly mating [68]. This can explain why once isolated subpopulations in a subdivided population have a deficiency of heterozygotes relative to that expected with random mating. Additionally, CPB populations experienced an increased gene flow resulting from their ability to fly more than 100 km when there are favorable wind and weather conditions and colonize new fields accordingly [4].
Grapputo et al. [28] examined the US and European CPB populations using AFLP markers and found a significant reduction in genetic variability in the European populations. This reduction often occurs in populations of invasive species due to bottlenecks and founder effects during the invasion that can lead to a decline in genetic variability [69]. Using mtDNA, Grapputo et al. [22] found that reduced genetic variability indicates a founder effect in Europe. These results agree with the studies of Yang et al. [32] and Özkan Koca et al. [35], where they used microsatellite markers to investigate the genetic structure, diversity, and invasion routes of CPBs. Their results showed low levels of genetic variation in CPB populations in Turkey [35] and China [32]. Conversely, Mikac et al. [70] suggested that geometric morphometric techniques can be used to detect population changes related to invasions and could, therefore, serve as a cheaper and more accessible alternative marker. Karsten et al. [71] combined the use of GM and population genetics to identify the genetic variability between populations in South Africa in a fly pest Ceratitis rosa, finding lower phenotypic diversity in contrast to higher genetic variability. Our results find the contrary result because of the lower genetic variability between populations, which were contrasted by wing shape adaptation to geographical zones in Croatia. A few studies have confirmed that the combination of genetic markers and geometric morphometrics results gives more accurate results, as morphology can show clear differentiation patterns where molecular markers cannot detect population structure [72,73,74,75,76].
Several studies have found that wing shape is very important for the migratory movement and dispersal strategy of insect species [52,70,75,76,77]. According to Voss and Ferro [78], there are three different types of flight in CPBs with different characteristics: short-distance flight, diapause flight, and long-distance flight. Long-distance or migratory flight is most important for the dispersal of the species and the colonization of new areas. For an insect to be capable of long flights, it must have aerodynamic wings, and according to Mikac et al. [75], this is an individual with an elongated wing shape. Our results showed that CPBs from central Croatia had a broader wing shape with slight movements of landmarks 2, 13, and 14, while CPBs from eastern Croatia had a broader wing shape with contraction of landmarks 1 and 8. Individuals from northern Croatia had a more elongated wing shape, with landmarks 4 and 16 extending to the left and right. Therefore, we can assume that CPB individuals from the north, with elongated wings, are capable of long-distance flight and could easily migrate to other parts of continental Croatia.
In a large panmictic population, such as the one found in Croatia, there is a high probability of genetic variants that provide high fitness under new conditions as well as the occurrence of new adaptive random mutations. Since CPBs can have multiple generations per year, there is a possibility that these genetic variants will quickly succumb to natural selection and lead to the expansion of adapted populations [17].
Similar findings for other Chrysomelidae pests have been described by Lemic et al. [79]. Their research revealed one large population of western corn rootworm (WCR). Knowledge of the genetic structure of WCR in Croatia has had important implications for the integrated pest management (IPM) of this invasive pest. This research showed that genetic variability increased and minimal genetic structure was maintained when the invasive pest was not controlled.
Therefore, information on the presence of a panmictic CPB population is very important for future IPM strategies and resistance control in the potato-growing areas in Croatia. An area-wide approach (AW) has been shown to be very helpful in reducing insecticide use [80]; in combination with other control measures, it also offers great potential for reducing damage levels [81]. Area-wide crop rotation has been shown to be very useful in keeping pest damage below the threshold [82]. Under AW treatments, populations are unable to exchange genetic material and spread resistance genes [83]. The AW approach could be used for successful CPB control and to keep the resistant population under control.
Our study confirms that CPB can adapt exceptionally to different conditions, indicating high phenotypic plasticity. The high phenotypic plasticity of CPB populations is a response to the high adaptability of this organism to different factors, which is characteristic of their invasiveness and their ability to rapidly adapt their genotype to environmental changes. Considering the high adaptability to different agro-ecological conditions (phenotypic plasticity) and the invasiveness of CPBs, it is expected that CPB populations will also adapt to new insecticides and control measures in the future. Thus, this type of combined CPB monitoring (SNPs and GM) increases our knowledge of this very important pest and represents valuable knowledge needed for the implementation of different management practices.

Author Contributions

Conceptualization, M.K.B., D.L. and K.M.M.; methodology, M.K.B., D.L., K.M.M. and H.A.B.; software, M.K.B. and M.C.; validation, M.K.B., D.L., R.B. and K.M.M.; formal analysis, M.K.B. and H.A.B.; investigation, M.K.B., R.B. and M.C.; resources, R.B.; data curation, M.K.B. and H.A.B.; writing—original draft preparation, M.K.B.; writing—review and editing, D.L., K.M.M., H.A.B. and R.B.; visualization, M.K.B., H.A.B. and M.C.; supervision, R.B., K.M.M. and D.L.; project administration, R.B.; funding acquisition, R.B. All authors have read and agreed to the published version of the manuscript.

Funding

This study was supported by the Croatian Science Foundation through the project Monitoring of Insect Pest Resistance: Novel Approach for Detection and Effective Resistance Management Strategies (MONPERES) (IP-2016-06-7458) and the Young Researchers’ Career Development Project for the training of new doctoral students (DOK-01-2018).

Data Availability Statement

Not applicable.

Acknowledgments

The authors are very grateful to João Paulo Gomes Viana for his help and advice in the data analysis. The authors also thank Zrinka Drmić and all their colleagues and students for their help in collecting the beetles and preparing the wings for geometric morphometrics. Finally, the authors thank Gush Art Studio for helping in the production of good-quality illustrations.

Conflicts of Interest

The authors declare no conflict of interest.

References

  1. Alyokhin, A.; Baker, M.; Mota-Sanchez, D.; Dively, G.; Grafius, E. Colorado potato beetle resistance to insecticides. Am. J. Potato Res. 2008, 85, 395–413. [Google Scholar] [CrossRef]
  2. Maceljski, M. Krumpirova zlatica (Leptinotarsa decemlineata Say). In Poljoprivredna Entomologija, 2nd ed.; Zrinski: Čakovec, Croatia, 2002; pp. 216–222. [Google Scholar]
  3. Ferro, D.N.; Logan, J.A.; Voss, R.H.; Elkinton, J.S. Colorado potato beetle (Coleoptera: Chrysomelidae) temperature-dependent growth and feeding rates. Environ. Entomol. 1985, 14, 343–348. [Google Scholar] [CrossRef]
  4. Alyokhin, A. Colorado potato beetle management on potatoes: Current challenges and future prospects. Fruit Veg. Cereal Sci. Biotechnol. 2009, 3, 10–19. [Google Scholar]
  5. Casagrande, R.A. The Colorado potato beetle: 125 years of mismanagement. Bull. Entomol. Soc. Am. 1987, 33, 142–150. [Google Scholar] [CrossRef]
  6. Gauthier, N.L.; Hofmaster, R.N.; Semel, M. History of Colorado potato beetle control. Adv. Potato Pest Manag. 1981, 23, 13–33. [Google Scholar]
  7. Arthropod Pesticide Resistance Database (APRD). Leptinotarsa decemlineata-Shown Resistance to Active Ingredient(s). Available online: https://www.pesticideresistance.org/display.php?page=species&arId=141 (accessed on 26 March 2022).
  8. Weber, D. Colorado beetle: Pest on the move. Pestic. Outlook 2003, 14, 256–259. [Google Scholar] [CrossRef]
  9. Cong, W.A.N.G.; Han, X.U.; Pan, X.B. Management of Colorado potato beetle in invasive frontier areas. J. Integr. Agric. 2020, 19, 360–366. [Google Scholar]
  10. Bradshaw, A.D. Evolutionary significance of phenotypic plasticity in plants. Adv. Genet. 1965, 13, 115–155. [Google Scholar]
  11. Schlichting, C.D. The evolution of phenotypic plasticity. Ann. Rev. Ecol. Syst. 1986, 17, 667–693. [Google Scholar] [CrossRef]
  12. Berrigan, D.M.; Scheiner, S.M. Modelling the evolution of phenotypic plasticity. In Phenotypic Plasticity: Functional and Conceptual Approaches, 1st ed.; De Witt, T.J., Scheiner, S.M., Eds.; Oxford University Press: Oxford, UK, 2004; pp. 82–97. [Google Scholar]
  13. Van Kleunen, M.; Fisher, M. Constraints on the evolution of adaptive phenotypic plasticity in plants. New Phytol. 2005, 166, 49–60. [Google Scholar] [CrossRef]
  14. Helmuth, B.; Kingsolver, J.G.; Carrington, E. Biophysics, physiological ecology, and climate change: Does mechanism matter? Annu. Rev. Physiol. 2005, 67, 177–201. [Google Scholar] [CrossRef] [PubMed]
  15. Schlichting, C.D. The role of phenotypic plasticity in diversification. In Phenotypic Plasticity: Functional and Conceptual Approaches, 1st ed.; de Witt, T.J., Scheiner, S.M., Eds.; Oxford University Press: Oxford, UK, 2004; pp. 191–200. [Google Scholar]
  16. Murren, C.J.; Denning, W.; Pigliucci, M. Relationships between vegetative and life history traits and fitness in a novel field environment: Impacts of herbivores. Evol. Ecol. 2005, 19, 583–601. [Google Scholar] [CrossRef]
  17. Cingel, A.; Savić, J.; Lazarević, J.; Ćosić, T.; Raspor, M.; Smigocki, A.; Ninković, S. Extraordinary adaptive plasticity of Colorado potato beetle: “Ten-Striped Spearman” in the era of biotechnological warfare. Int. J. Mol. Sci. 2016, 17, 1538. [Google Scholar] [CrossRef] [PubMed]
  18. Sakai, A.K.; Allendorf, F.W.; Holt, J.S.; Lodge, D.M.; Molofsky, J.; With, K.A. The population biology of invasive species. Annu. Rev. Ecol. Syst. 2001, 32, 305–332. [Google Scholar] [CrossRef] [Green Version]
  19. Boiteau, G.; Alyokhin, A.; Ferro, D.N. The Colorado potato beetle in movement. Can. Entomol. 2003, 135, 1–22. [Google Scholar] [CrossRef]
  20. Estoup, A.; Guillemaud, T. Reconstructing routes of invasion using genetic data: Why, how and so what? Mol. Ecol. 2010, 19, 4113–4130. [Google Scholar] [CrossRef]
  21. Cristescu, M.E. Genetic reconstructions of invasion history. Mol. Ecol. 2015, 24, 2212–2225. [Google Scholar] [CrossRef]
  22. Grapputo, A.; Boman, S.; Lindstroem, L.; Lyytinen, A.; Mappes, J. The voyage of an invasive species across continents: Genetic variability of North American and European Colorado potato beetle populations. Mol. Ecol. 2005, 14, 4207–4219. [Google Scholar] [CrossRef]
  23. Jacobson, J.W.; Hsiao, T.H. Isozyme variation between geographic populations of the Colorado potato beetle, Leptinotarsa decemlineata (Coleoptera: Chrysomelidae). Ann. Entomol. Soc. Am. 1983, 76, 162–166. [Google Scholar] [CrossRef]
  24. Azeredo-Espin, A.M.L.; Schroder, R.F.W.; Huettel, M.D.; Sheppard, W.S. Mitochondrial DNA variation in geographic populations of Colorado potato beetle, Leptinotarsa decemlineata (Coleoptera; Chrysomelidae). Experientia 1991, 47, 483–485. [Google Scholar] [CrossRef]
  25. Zehnder, G.W.; Sandall, L.; Tisler, A.M.; Powers, T.O. Mitochondrial DNA diversity among 17 geographic populations of Leptinotarsa decemlineata (Coleoptera: Chrysomelidae). Ann. Entomol. Soc. Am. 1992, 85, 234–240. [Google Scholar] [CrossRef]
  26. Azeredo-Espin, A.M.L.; Schroder, R.F.W.; Roderick, G.K.; Sheppard, W.S. Intraspecific mitochondrial DNA variation in the Colorado potato beetle, Leptinotarsa decemlineata (Coleoptera: Chrysomelidae). Biochem. Genet. 1996, 34, 253–268. [Google Scholar] [CrossRef] [PubMed]
  27. Sidorenko, A.P.; Berezovska, O.P. Genetic structure of populations of the Colorado potato beetle Leptinotarsa decemlineata (Coleoptera: Chrysomelidae). Russ. J. Genet. 2002, 38, 1256–1261. [Google Scholar] [CrossRef]
  28. Grapputo, A. Development and characterization of microsatellite markers in the Colorado potato beetle, Leptinotarsa decemlineata. Mol. Ecol. Notes 2006, 6, 1177–1179. [Google Scholar] [CrossRef]
  29. Zhang, J.J.; Yang, J.; Li, Y.C.; Liu, N.; Zhang, R.Z. Genetic relationships of introduced Colorado potato beetle Leptinotarsa decemlineata populations in Xinjiang, China. Insect Sci. 2013, 20, 643–654. [Google Scholar] [CrossRef] [PubMed]
  30. Przybylska, A.; Budziszewska, M.; Klejdysz, T.; Nawrot, J.; Obrępalska-Stęplowska, A. High stability of a mitochondrial genetic marker mtCOII in Polish Colorado potato beetle populations. Am. J. Potato Res. 2014, 91, 720–725. [Google Scholar] [CrossRef]
  31. Izzo, V.M.; Chen, Y.H.; Schoville, S.D.; Wang, C.; Hawthorne, D.J. Origin of pest lineages of the Colorado potato beetle (Coleoptera: Chrysomelidae). J. Econ. Entomol. 2018, 111, 868–878. [Google Scholar] [CrossRef]
  32. Yang, F.Y.; Guo, J.J.; Liu, N.; Zhang, R.Z. Genetic structure of the invasive Colorado potato beetle Leptinotarsa decemlineata populations in China. J. Integr. Agric. 2020, 19, 350–359. [Google Scholar] [CrossRef]
  33. Jarne, P.; Lagoda, P.J. Microsatellites, from molecules to populations and back. Trends Ecol. Evol. 1996, 11, 424–429. [Google Scholar] [CrossRef]
  34. Barker, G.C. Microsatellite DNA: A tool for population genetic analysis. Trans. R. Soc. Trop. Med. Hyg. 2002, 96, S21–S24. [Google Scholar] [CrossRef]
  35. Özkan Koca, A.; Berkcan, S.B.; Laçın Alas, B.; Kandemir, İ. Population structure and pattern of geographic differentiation of Colorado potato beetle, Leptinotarsa decemlineata (Coleoptera: Chrysomelidae) in Turkey. Pest Manag. Sci. 2022, 78, 3804–3814. [Google Scholar] [CrossRef] [PubMed]
  36. Crossley, M.S.; Chen, Y.H.; Groves, R.L.; Schoville, S.D. Landscape genomics of Colorado potato beetle provides evidence of polygenic adaptation to insecticides. Mol. Ecol. 2017, 26, 6284–6300. [Google Scholar] [CrossRef] [PubMed]
  37. Schoville, S.D.; Chen, Y.H.; Andersson, M.N.; Benoit, J.B.; Bhandari, A.; Bowsher, J.H.; Brevik, K.; Cappelle, K.; Chen, M.-J.M.; Childers, A.K.; et al. A model species for agricultural pest genomics: The genome of the Colorado potato beetle, Leptinotarsa decemlineata (Coleoptera: Chrysomelidae). Sci. Rep. 2018, 8, 1931. [Google Scholar] [CrossRef]
  38. Jaccoud, D.; Peng, K.; Feinstein, D.; Kilian, A. Diversity arrays: A solid state technology for sequence information independent genotyping. Nucleic Acids Res. 2001, 29, e25. [Google Scholar] [CrossRef] [PubMed] [Green Version]
  39. Nantoume, A.D.; Andersen, S.B.; Jensen, B.D. Genetic differentiation of watermelon landrace types in Mali revealed by microsatellite (SSR) markers. Genet. Resour. Crop Evol. 2013, 60, 2129–2141. [Google Scholar] [CrossRef]
  40. Adams, D.; Rohlf, F.J.; Slice, D. A field comes of age: Geometric morphometrics in the 21st century. Hystrix Ital. J. Mammal. 2013, 24, 7–14. [Google Scholar]
  41. Klingenberg, C.P. Visualizations in geometric morphometrics: How to read and how to make graphs showing shape changes. Hystrix Ital. J. Mammal. 2013, 24, 15–24. [Google Scholar]
  42. Benítez, H.A.; Püschel, T.A. Modelando la varianza de la forma: Morfometría geométrica aplicaciones en biología evolutiva. Int. J. Morphol. 2014, 32, 998–1008. [Google Scholar] [CrossRef]
  43. Levine, E.; Oloumi-Sadeghi, H. Western corn rootworm (Coleoptera, Chrysomelidae) larval injury to corn grown for seed production following soybeans grown for seed production. J. Econ. Entomol. 1996, 89, 1010–1016. [Google Scholar] [CrossRef]
  44. Bouyer, J.; Ravel, S.; Dujardin, J.P.; De Meeüs, T.; Vial, L.; Thévenon, S.; Guerrini, L.; Sidibé, I.; Solano, P. Population structuring of Glossina palpalis gambiensis (Diptera: Glossinidae) according to landscape fragmentation in the Mouhoun river, Burkina Faso. J. Med. Entomol. 2007, 44, 788–795. [Google Scholar] [CrossRef]
  45. Benítez, H.A.; Lemic, D.; Bažok, R.; Gallardo-Araya, C.M.; Mikac, K.M. Evolutionary directional asymmetry and shape variation in Diabrotica virgifera virgifera (Coleoptera: Chrysomelidae): An example using hind wings. Biol. J. Linn. Soc. 2014, 111, 110–118. [Google Scholar] [CrossRef]
  46. Lemic, D.; Benítez, H.A.; Püschel, T.A.; Gašparić, H.V.; Šatvar, M.; Bažok, R. Ecological morphology of the sugar beet weevil Croatian populations: Evaluating the role of environmental conditions on body shape. Zool. Anz. A. J. Comp. Zool. 2016, 260, 25–32. [Google Scholar] [CrossRef]
  47. Benítez, H.A.; Lemic, D.; Püschel, T.A.; Gašparić, H.V.; Kos, T.; Barić, B.; Bažok, R.; Živković, I.P. Fluctuating asymmetry indicates levels of disturbance between agricultural productions: An example in Croatian population of Pterostichus melas melas (Coleptera: Carabidae). Zool. Anz. 2018, 276, 42–49. [Google Scholar] [CrossRef]
  48. Lemic, D.; Benítez, H.A.; Bjeliš, M.; Órdenes-Claveria, R.; Ninčević, P.; Mikac, K.M.; Živković, I.P. Agroecological effect and sexual shape dimorphism in medfly Ceratitis capitata (Diptera: Tephritidae) an example in Croatian populations. Zool. Anz. 2020, 288, 118–124. [Google Scholar] [CrossRef]
  49. Pajač Živković, I.; Lemic, D.; Mešić, A.; Barić, B.; Órdenes, R.; Benítez, H.A. Effect of fruit host on wing morphology in Drosophila suzukii (Diptera: Drosophilidae): A first view using geometric morphometrics. Entomol. Res. 2018, 48, 262–268. [Google Scholar] [CrossRef]
  50. Lemic, D.; Bjeliš, M.; Ninčević, P.; Živković, I.P.; Popović, L.; Gašparić, H.V.; Benítez, H.A. Medfly phenotypic plasticity as a prerequisite for invasiveness and adaptation. Sustainability 2021, 13, 12510. [Google Scholar] [CrossRef]
  51. Lemic, D.; Mikac, K.M.; Kozina, A.; Benítez, H.A.; McLean, C.M.; Bažok, R. Monitoring techniques of the western corn rootworm are the precursor to effective IPM strategies. Pest Manag. Sci. 2016, 72, 405–417. [Google Scholar] [CrossRef]
  52. Živković, I.P.; Benitez, H.A.; Barić, B.; Drmić, Z.; Balaško, M.K.; Lemic, D.; Davila, J.H.D.; Mikac, K.M.; Bažok, R. Codling moth wing morphology changes due to insecticide resistance. Insects 2019, 10, 310. [Google Scholar] [CrossRef]
  53. Mikac, K.M.; Lemic, D.; Benítez, H.A.; Bažok, R. Changes in corn rootworm wing morphology are related to resistance development. J. Pest Sci. 2019, 92, 443–451. [Google Scholar] [CrossRef]
  54. Hood, C.S. Geometric morphometric approaches to the study of sexual size dimorphism in mammals. Hystrix 2000, 11, 77–90. [Google Scholar]
  55. Kilian, A.; Wenzl, P.; Huttner, E.; Carling, J.; Xia, L.; Blois, H.; Caig, V.; Heller-Uszynska, K.; Jaccoud, D.; Hopper, C.; et al. Diversity arrays technology: A generic genome profiling technology on open platforms. In Data Production and Analysis in Population Genomics, 1st ed.; Pompanon, F., Bonin, A., Eds.; Humana Press: Totowa, NJ, USA, 2012; pp. 67–89. [Google Scholar]
  56. Gruber, B.; Unmack, P.J.; Berry, O.F.; Georges, A. dartr: An r package to facilitate analysis of SNP data generated from reduced representation genome sequencing. Mol. Ecol. Resour. 2018, 18, 691–699. [Google Scholar] [CrossRef] [PubMed]
  57. R Core Team. R: A Language and Environment for Statistical Computing; R Foundation for Statistical Computing: Vienna, Austria, 2021. [Google Scholar]
  58. Zheng, X.; Levine, D.; Shen, J.; Gogarten, S.M.; Laurie, C.; Weir, B.S. A high–performance computing toolset for relatedness and principal component analysis of SNP data. Bioinformatics 2012, 28, 3326–3328. [Google Scholar] [CrossRef] [PubMed]
  59. Peakall, R.O.D.; Smouse, P.E. GENALEX 6: Genetic analysis in Excel. Population genetic software for teaching and research. Mol. Ecol. Notes 2006, 6, 288–295. [Google Scholar] [CrossRef]
  60. Jombart, T.; Ahmed, I. Adegenet 1.3–1.new tools for the analysis of genome–wide SNP data. Bioinformatics 2011, 27, 3070–3071. [Google Scholar] [CrossRef] [PubMed]
  61. Evanno, G.; Regnaut, S.; Goudet, J. Detecting the number of clusters of individuals using the software STRUCTURE: A simulation study. Mol. Ecol. 2005, 14, 2611–2620. [Google Scholar] [CrossRef]
  62. Earl, D.A.; Vonholdt, B.M. STRUCTURE harvester. A website and program for visualizing STRUCTURE output and implementing the Evanno method. Conserv. Genet. Resour. 2012, 4, 359–361. [Google Scholar] [CrossRef]
  63. Oksanen, J.; Kindt, R.; Legendre, P.; O’Hara, B.; Stevens, M.H.H.; Oksanen, M.J.; Suggests, M.A.S.S. The vegan package. Community Ecol. Package 2007, 10, 631–637. [Google Scholar]
  64. Rohlf, F.J. The tps series of software. Hystrix 2015, 26, 9. [Google Scholar]
  65. Rohlf, F.J.; Slice, D. Extensions of the Procrustes method for the optimal superimposition of landmarks. Syst. Biol. 1990, 39, 40–59. [Google Scholar] [CrossRef] [Green Version]
  66. Jombart, T.; Devillard, S.; Balloux, F. Discriminant analysis of principal components: A new method for the analysis of genetically structured populations. BMC Genet. 2010, 11, 94. [Google Scholar] [CrossRef]
  67. Food and Agriculture Organization of the United Nations FAO STAT. Available online: http://www.fao.org/faostat/en/#data/QC/visualize (accessed on 31 May 2022).
  68. Garnier-Géré, P.; Chikhi, L. Population subdivision, Hardy–Weinberg equilibrium and the Wahlund effect. In eLS; John Wiley & Sons: Hoboken, NJ, USA, 2013. [Google Scholar]
  69. Puillandre, N.; Dupas, S.; Dangles, O.; Zeddam, J.L.; Capdevielle-Dulac, C.; Barbin, K.; Torres-Leguizamon, M.; Silvain, J.F. Genetic bottleneck in invasive species: The potato tuber moth adds to the list. Biol. Invasions 2008, 10, 319–333. [Google Scholar] [CrossRef]
  70. Mikac, K.M.; Lemic, D.; Bažok, R.; Benítez, H.A. Wing shape changes: A morphological view of the Diabrotica virgifera virgifera European invasion. Biol. Invasions 2016, 18, 3401–3407. [Google Scholar] [CrossRef]
  71. Karsten, M.; Addison, P.; Jansen van Vuuren, B.; Terblanche, J. Investigating population differentiation in a major African agricultural pest: Evidence from geometric morphometrics and connectivity suggests high invasion potential. Mol. Ecol. 2016, 25, 3019–3032. [Google Scholar] [CrossRef] [PubMed]
  72. Garnier, S.; Magniez-Jannin, F.; Rasplus, J.Y.; Alibert, P. When morphometry meets genetics: Inferring the phylogeography of Carabus solieri using Fourier analyses of pronotum and male genitalia. J. Evol. Biol. 2005, 18, 269–280. [Google Scholar] [CrossRef]
  73. Camara, M.; Caro-Riano, H.; Ravel, S.; Dujardin, J.P.; Hervouet, J.P.; De MeEüs, T.; Bouyer, J.; Solano, P. Genetic and morphometric evidence for population isolation of Glossina palpalis gambiensis (Diptera: Glossinidae) on the Loos islands, Guinea. J. Med. Entomol. 2006, 43, 853–860. [Google Scholar] [CrossRef]
  74. Henriques, D.; Chávez-Galarza, J.; Teixeira, J.S.G.; Ferreira, H.; Neves, C.J.; Francoy, T.M.; Pinto, M.A. Wing geometric morphometrics of workers and drones and single nucleotide polymorphisms provide similar genetic structure in the Iberian honey bee (Apis mellifera iberiensis). Insects 2020, 11, 89. [Google Scholar] [CrossRef]
  75. Mikac, K.M.; Douglas, J.; Spencer, J.L. Wing shape and size of the western corn rootworm (Coleoptera: Chrysomelidae) is related to sex and resistance to soybean-maize crop rotation. J. Econ. Entomol. 2013, 106, 1517–1524. [Google Scholar] [CrossRef]
  76. Lemic, D.; Benítez, H.A.; Bažok, R. Intercontinental effect on sexual shape dimorphism and allometric relationships in the beetle pest Diabrotica virgifera virgifera LeConte (Coleoptera: Chrysomelidae). Zool. Anz. A J. Comp. Zool. 2014, 253, 203–206. [Google Scholar] [CrossRef]
  77. Kadoić Balaško, M.; Mikac, K.M.; Benítez, H.A.; Bažok, R.; Lemic, D. Genetic and morphological approach for western corn rootworm resistance management. Agriculture 2021, 11, 585. [Google Scholar] [CrossRef]
  78. Voss, R.H.; Ferro, D.N. Phenology of flight and walking by Colorado potato beetle (Coleoptera: Chrysomelidae) adults in western Massachusetts. Environ. Entomol. 1990, 19, 117–122. [Google Scholar] [CrossRef]
  79. Lemic, D.; Mikac, K.M.; Ivkosic, S.A.; Bažok, R. The temporal and spatial invasion genetics of the western corn rootworm (Coleoptera: Chrysomelidae) in southern Europe. PLoS ONE 2015, 10, e0138796. [Google Scholar] [CrossRef] [PubMed]
  80. Drmić, Z.; Tóth, M.; Lemić, D.; Grubišić, D.; Pospišil, M.; Bažok, R. Area-wide mass trapping by pheromone-based attractants for the control of sugar beet weevil (Bothynoderes punctiventris Germar, Coleoptera: Curculionidae). Pest Manag. Sci. 2017, 73, 2174–2183. [Google Scholar] [CrossRef]
  81. Vreysen, M.J.B.; Robinson, A.S.; Hendrichs, J. Areawide control of insect pests. From research to field implementation. In Principles and Practice in Area-Wide Integrated Pest Management, Sterile Insect Technique, 1st ed.; Dyck, V.A., Hendrichs, J., Robinson, A.S., Eds.; Springer: Dordrecht, The Netherlands, 2005; pp. 351–353. [Google Scholar]
  82. Furlan, L.; Chiarini, F.; Contiero, B.; Benvegnù, I.; Horgan, F.G.; Kos, T.; Lemic, D.; Bažok, R. Risk Assessment and Area-Wide Crop Rotation to Keep Western Corn Rootworm below Damage Thresholds and Avoid Insecticide Use in European Maize Production. Insects 2022, 13, 415. [Google Scholar] [CrossRef] [PubMed]
  83. Cheng, J.; Kao, H.; Dong, S. Population genetic structure and gene flow of rare and endangered Tetraena mongolica Maxim. revealed by reduced representation sequencing. BMC Plant Biol. 2020, 20, 391. [Google Scholar]
Figure 1. Sampling sites of the Colorado potato beetle in continental Croatia.
Agronomy 12 02361 g001
Figure 2. Colorado potato beetle hindwing schematic with sixteen type-one digitized landmarks.
Agronomy 12 02361 g002
Figure 3. The range of the fixation index (FST) between Colorado potato beetle populations in Croatia.
Agronomy 12 02361 g003
Figure 4. (a). Results from the STRUCTURE Harvester analysis, revealing the most likely value of K based on STRUCTURE results; (b). determination of the optimal value of K and population structure of CPB genotypes using DArTseq SNP markers.
Agronomy 12 02361 g004
Figure 5. Principal component analysis (PCA) based on 7681 SNPs. CC: central Croatia, NC: north Croatia, and EC: east Croatia.
Agronomy 12 02361 g005
Figure 6. Discriminant analysis of principal components (DAPC) based on 7681 SNPs. CC: central Croatia, NC: north Croatia, and EC: east Croatia.
Agronomy 12 02361 g006
Figure 7. Multivariate regression of shape as a dependent variable vs. centroid size as an independent variable of Colorado potato beetle hindwing. CC: yellow, central Croatia; NC: red, north Croatia; EC: green, east Croatia.
Agronomy 12 02361 g007
Figure 8. Canonical variate analysis of the Colorado potato beetle hindwing shape between populations from different regions of Croatia. CC: yellow, central Croatia; NC: red, north Croatia; EC: green, east Croatia.
Agronomy 12 02361 g008
Table 1. The sample information of Colorado potato beetle populations in Croatia.
RegionPopulationLocationLat.Long.nCT
North CroatiaSVAMSv. Martin na Muri46°31′16°21′62018
CEHOČehovec46°21′16°37′52019
VIDOVidovec46°17′16°14′52017
LUDBLudbreg46°15′16°36′52018
BEDNBednjs46°13′15°58′52018
Central CroatiaMLADMladine46°02′16°32′62017
STARStarigrad46°08′16°49′52017
DURDĐurđevac46°02′17°04′62017
NVIRNovo Virje46°05′17°09′62018
DRAGDragičevci45°47′16°34′52019
East CroatiaPASIPašijan45°38′16°56′62017
GAREGarešnica45°34′16°56′42017
HERCHercegovac45°39′17°00′62017
ZDENZdenci45°34′17°57′52018
DMELDonji Meljani45°43′17°37′52017
lat. = sampling latitude; long. = sampling longitude; n = sample size; CT = collecting time.
Table 2. Genetic variability of Colorado potato beetles from different geographical regions in Croatia.
RegionnAPHoHeFIS
North Croatia2712,4781200.2510.3200.216
Central Croatia2812,5391930.2580.3230.201
East Croatia2712,5031500.2550.3260.218
n = Number of samples; A = number of different alleles; P = number of private alleles; Ho = observed heterozygosity; He = expected heterozygosity; FIS = inbreeding coefficient.
Table 3. Analysis of molecular variance (AMOVA) using 7681 SNPs of the genetic variation among and within CPB populations.
Source of VariationSSdfMSFp-ValueF crit
Between Groups0.008679583150.0005792.3118030.0044611.711235
Within Groups0.0560666672240.00025
Total0.06474625239
Publisher’s Note: MDPI stays neutral with regard to jurisdictional claims in published maps and institutional affiliations.

