Article

Changes in Wheat Rhizosphere Carbon Pools in Response to Nitrogen and Straw Incorporation

1
Department of Soil Science, Punjab Agricultural University, Ludhiana 141004, Punjab, India
2
Department of Farm Machinery and Power Engineering, Punjab Agricultural University, Ludhiana 141004, Punjab, India
3
Department of Botany and Microbiology, College of Science, King Saud University, Riyadh 11451, Saudi Arabia
4
Department of Agronomy, Horticulture, and Plant Science, South Dakota State University, Brookings, SD 57007, USA
*
Author to whom correspondence should be addressed.
Agronomy 2022, 12(11), 2774; https://doi.org/10.3390/agronomy12112774
Submission received: 17 September 2022 / Revised: 23 October 2022 / Accepted: 27 October 2022 / Published: 7 November 2022

Abstract

:
Large-scale burning of rice straw causes air pollution and deterioration of soil health, which challenges the sustainability of the rice–wheat system (RWS) in north-western India. In a field experiment on sandy loam (Typic Ustochrept) soil at Punjab Agricultural University, India, with split plot design, effects of four nitrogen (N) levels (0, 90, 120, and 150 kg N ha−1) in main plots and four levels of rice straw (RS) incorporation (0, 5, 7.5, and 10 Mg ha−1) in wheat in sub-plots were studied after 7 years on carbon (C) pools at maximum tillering (MT) and flowering (FL) stages of wheat and crop yields. Rice straw (RS) incorporation at 10 Mg ha−1 with N application at 120 kg N ha−1 in wheat not only increased labile C pools significantly especially at MT but also increased the wheat yield compared with no straw incorporation. Principal component analysis suggests that total polysaccharide carbon, basal soil respiration, and pH can be used as sensitive parameters for assessing soil quality in RWS.

1. Introduction

The rice–wheat system (RWS) is a major cropping system for millions of people in the Indo-Gangetic Plains (IGP) of South Asia for food, employment, income, and livelihood [1]. In India, the area under the RWS in the IGP is about 10 million ha, which produces approximately 50% of the total food grains consumed in the country [2]. To meet the huge food demand, farmers practice an extensive crop management system that has high potential to cause several production issues in the short and long run. Out of several production issues in the northwest region of the IGP, soil degradation due to extensive soil puddling, low nutrient efficiency of applied chemical fertilizers, and burning of rice straw in the RWS are the prominent issues [3,4,5,6,7]. As an easy management practice after combined harvest, farmers burn remaining rice straw in the field to clear the fields for timely sowing of wheat [8]. Burning of rice straw and surface residues not only causes losses of nutrients, but also fatality of favourable microbes and decline in crop productivity and human health [8,9,10].
Rice straw is a source of soil organic carbon (SOC) that plays an important role, adding soil cover that can result in improving soil structure, water use efficiency, nutrient use efficiency, and soil microbial diversity [11]. It provides energy as well as substrates for microbial activity and biological diversity and enhances soil biological activities [12,13]. Moreover, changes in SOC are highly associated with the active soil labile carbon (C), which is primarily based on soil biological activities. Thus, the soil microbial community structure and its activities can be considered as an important soil quality index [14,15]. The labile C pools are considered important for crop production as they fuel the soil food web, influencing nutrient cycling [16,17].
Although many studies [8,18,19,20,21,22] indicated that soil tillage incorporated with residues had a positive effect on labile fractions of C, the results varied based on management practices. For example, zero tillage (ZT) with residue mulch had significantly higher C content than conventional tillage (CT) without residue mulch in the Loess Plateau in China [23].
Most of the commonly found studies are based on non-rice cropping systems in relation to changes in C pools and biochemical properties in bulk (non-rhizosphere) soil under different environmental conditions. Limited information is available on the effect of residue recycling in different pools of C and rhizosphere microbial changes in the RWS [24,25,26,27]. The present study was conducted to examine how C pools play a crucial role in regulating soil biology and biochemical changes between the rhizosphere and bulk soil in long-term rice straw (RS) incorporation under the RWS. One of the objectives of the present study was to evaluate the effect of N application and RS incorporation on labile C pools in bulk and rhizosphere soil at maximum tillering (MT) and flowering (FL) stages of wheat in the RWS of the northwest region of the IGP of India. Secondly, this study sought to identify the responsive growth stage of wheat for evaluating the most potential C pool indicators as a quick tool to frame a strategy to enhance C storage for mitigating the accelerated environmental degradation in the RWS.

2. Materials and Methods

2.1. Description of the Experimental Site and Experimental Detail

A 7-year field experiment on an irrigated RWS was started in 2010 on a Typic Ustochrept sandy loam soil (12.8% clay, 15.5% silt, and 71.7% sand) at the experimental farm of Punjab Agricultural University, Ludhiana, Punjab, located in Indian Punjab at an elevation of 247 m above mean sea level and lying at 30°54′ latitude and 75°40′ longitude. The average annual rainfall is 733 mm, and 78–80 percent of that is received between July and September months. Mean monthly lowest is 13.7 °C in January, while the maximum is 42.2 °C in May. The surface soil (0–15 cm) layer at the initiation of experiment was non-saline (electrical conductivity 0.34 dS m−1) with pH of 6.56 (1:2 soil: water) and had 3.9 g kg−1 organic C [28], 29.4 mg 0.5 M NaHCO3-extractable P kg−1 [29], and 78.4 mg N NH4OAc-extractable K kg−1 [30]. Full site details and associated information can be found in our previously published paper [31].
The experiment was laid out in a split plot design with four replications and consisted of four N application rates (0, 90, 120, and 150 kg N ha−1) as urea in main plots and four rates of RS incorporation (0, 5, 7.5 and 10 Mg ha−1) in sub-plots. The treatments were assigned to the same experimental plots in all the years of the study.

2.2. Collection, Preparation, and Analysis of Soil and Plants

Soil sub samples were collected from 0–15 cm depth at MT (40–45 days after sowing) and FL (80–95 days after sowing) stages of wheat growth. Soil samples were collected between rows of wheat representing bulk soil, i.e., away from root zone and rhizosphere soil, i.e., soil in the root zone [32]. Composite samples were collected randomly from four selected places in each plot with the help of auger and core sampler in bulk and rhizosphere soil, respectively. Moist soil samples were sieved through a 0.5 mm sieve to remove plant roots and immediately stored in deep freezer at 4 °C for analysis of labile C pools. The methods used for different C pools analyses are listed in Table 1.
The wheat grain and straw sub samples collected at maturity were oven-dried at 65 °C for 48 h to a constant weight and ground to pass through a 0.5 mm screen. Total N, P, and K contents were determined by Micro-Kjeldahl method [39], using ammonium molybdate method [40] and flame photometry method [39].

2.3. Statistical Analysis

The data were analysed using analysis of variance (ANOVA) with N application rates and RS incorporation in wheat as sub-plot in the split plot design by using IRRISTAT software (developed by IRRI) [41]. The dimensionality reduction technique “Principal component analysis” (PCA) and relative variable importance in terms of mean increase error were performed on the set of data [42]. Soil quality index (SQI) was computed by integrating score and weight factor of each indicator using Equation (1).
Soil   quality   index = i = 1 n Wi   x   Si
where S = indicator score and W = principal component weightage factor.

3. Results

3.1. Labile C Pools

All the labile C pools were significantly increased by N application and RS incorporation compared to control at both growth stages (MT and FL) of wheat (Figure 1, Figure 2, Figure 3, Figure 4, Figure 5, Figure 6, Figure 7 and Figure 8). Regardless of bulk and rhizosphere soils and treatments, the maximum content of labile C was observed at the MT compared with FL stage of wheat. All the labile C pools, WSOC, DOC, DOCX, POXC, TCC, TPC, BSR, and MBC, were significantly increased by 71, 29, 17, 5, 5, 27, 32, and 7%, respectively, at the MT stage compared to FL.

3.1.1. Water-Soluble Organic Carbon (WSOC)

Application of N fertilizers significantly increased the amount of WSOC in bulk soil at both the wheat growth stages; however, the response of N fertilizers was not observed in rhizosphere soil (Figure 1a). Incorporation of rice straw significantly increased the WSOC in both soils at both growing stages (Figure 1b). Although soil during the FL stage did not seem to increase WSOC with increase in the treatment level, a significantly higher amount of WSOC was obtained at MT when rice straw was incorporated at 7.5 Mg ha−1 or a higher rate between both soils. The WSOC was 71% greater at the MT compared to FL stage.

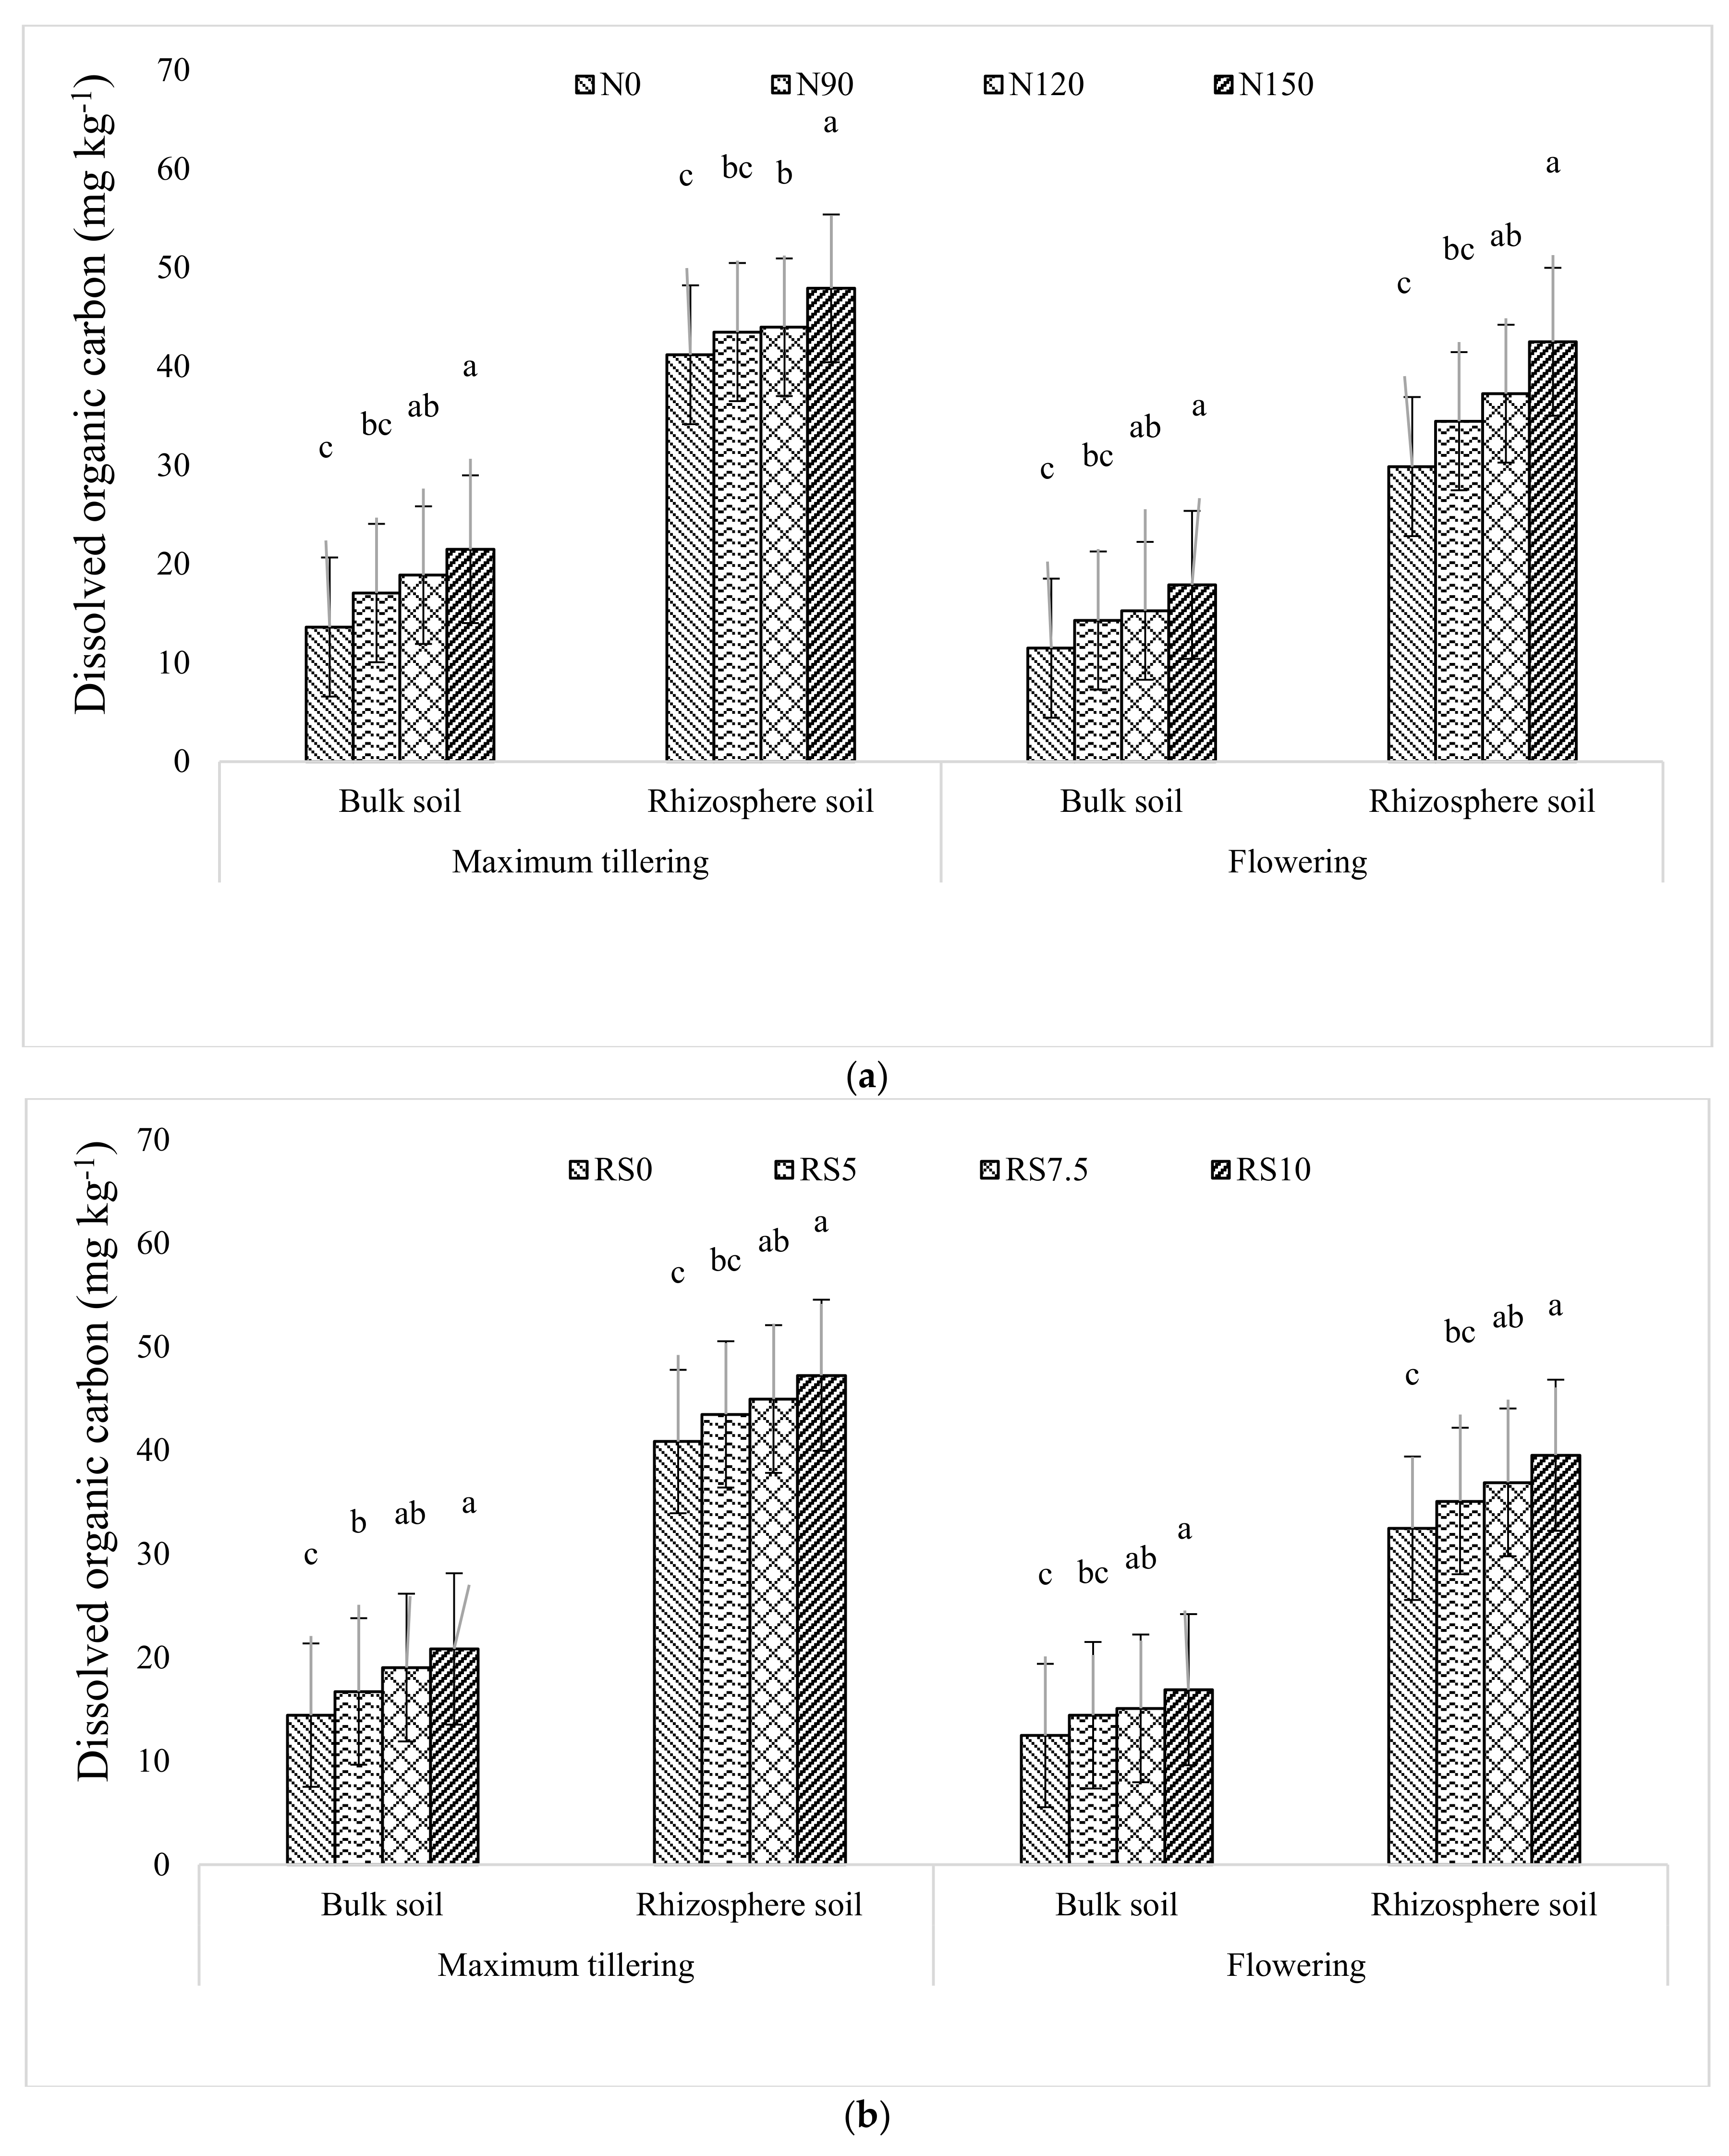
3.1.2. Dissolved Organic Carbon (DOC)

At both growth stages, the application of N fertilizers at 120 kg N ha−1 or more significantly increased the DOC concentration compared to control in both soils; however, the increase in DOC at lower N rates was negligible (Figure 2a). Similar results were shown by the application of rice straw (Figure 2b), except for bulk soil at the MT stage. At the MT stage, the bulk soil DOC significantly increased with the incorporation of rice straw. The DOC was 29% greater at the MT compared to FL stage.

3.1.3. Dichromate Oxidized Carbon (DOXC)

Dichromate oxidized carbon content increased significantly under N120 and N150 compared with N0 at MT by 25 and 30%. At the FL stage, the DOXC content in N120 and N150 was statistically non-significant with N90, and significantly higher than N0 in both bulk and rhizosphere soils (Figure 3a). The maximum DOXC content was 22.4% and 27.6% higher in bulk and rhizosphere soils under RS10 as compared to RS0 (Figure 3b). The corresponding increase at FL was 11.7 in bulk and 25.9% in rhizosphere soil. The DOXC was 17.4% greater in rhizosphere compared to bulk soil at MT.

3.1.4. Permanganate Oxidized Carbon (POXC)

Permanganate oxidized carbon content at the MT stage increased significantly by 2 and 3% under N120 and N150 compared with N0 in bulk soil; however, in rhizosphere soil the change was non-significant (Figure 4a). At the FL stage, the change in POXC content was non-significant in both bulk and rhizosphere soils. The highest increase was observed under RS10, which was higher by 3.8% than RS0 at MT (Figure 4b). POXC content was statistically at par within RS7.5 and RS10 and significantly higher than the Rs0 for both bulk and rhizosphere soils at the FL stage.

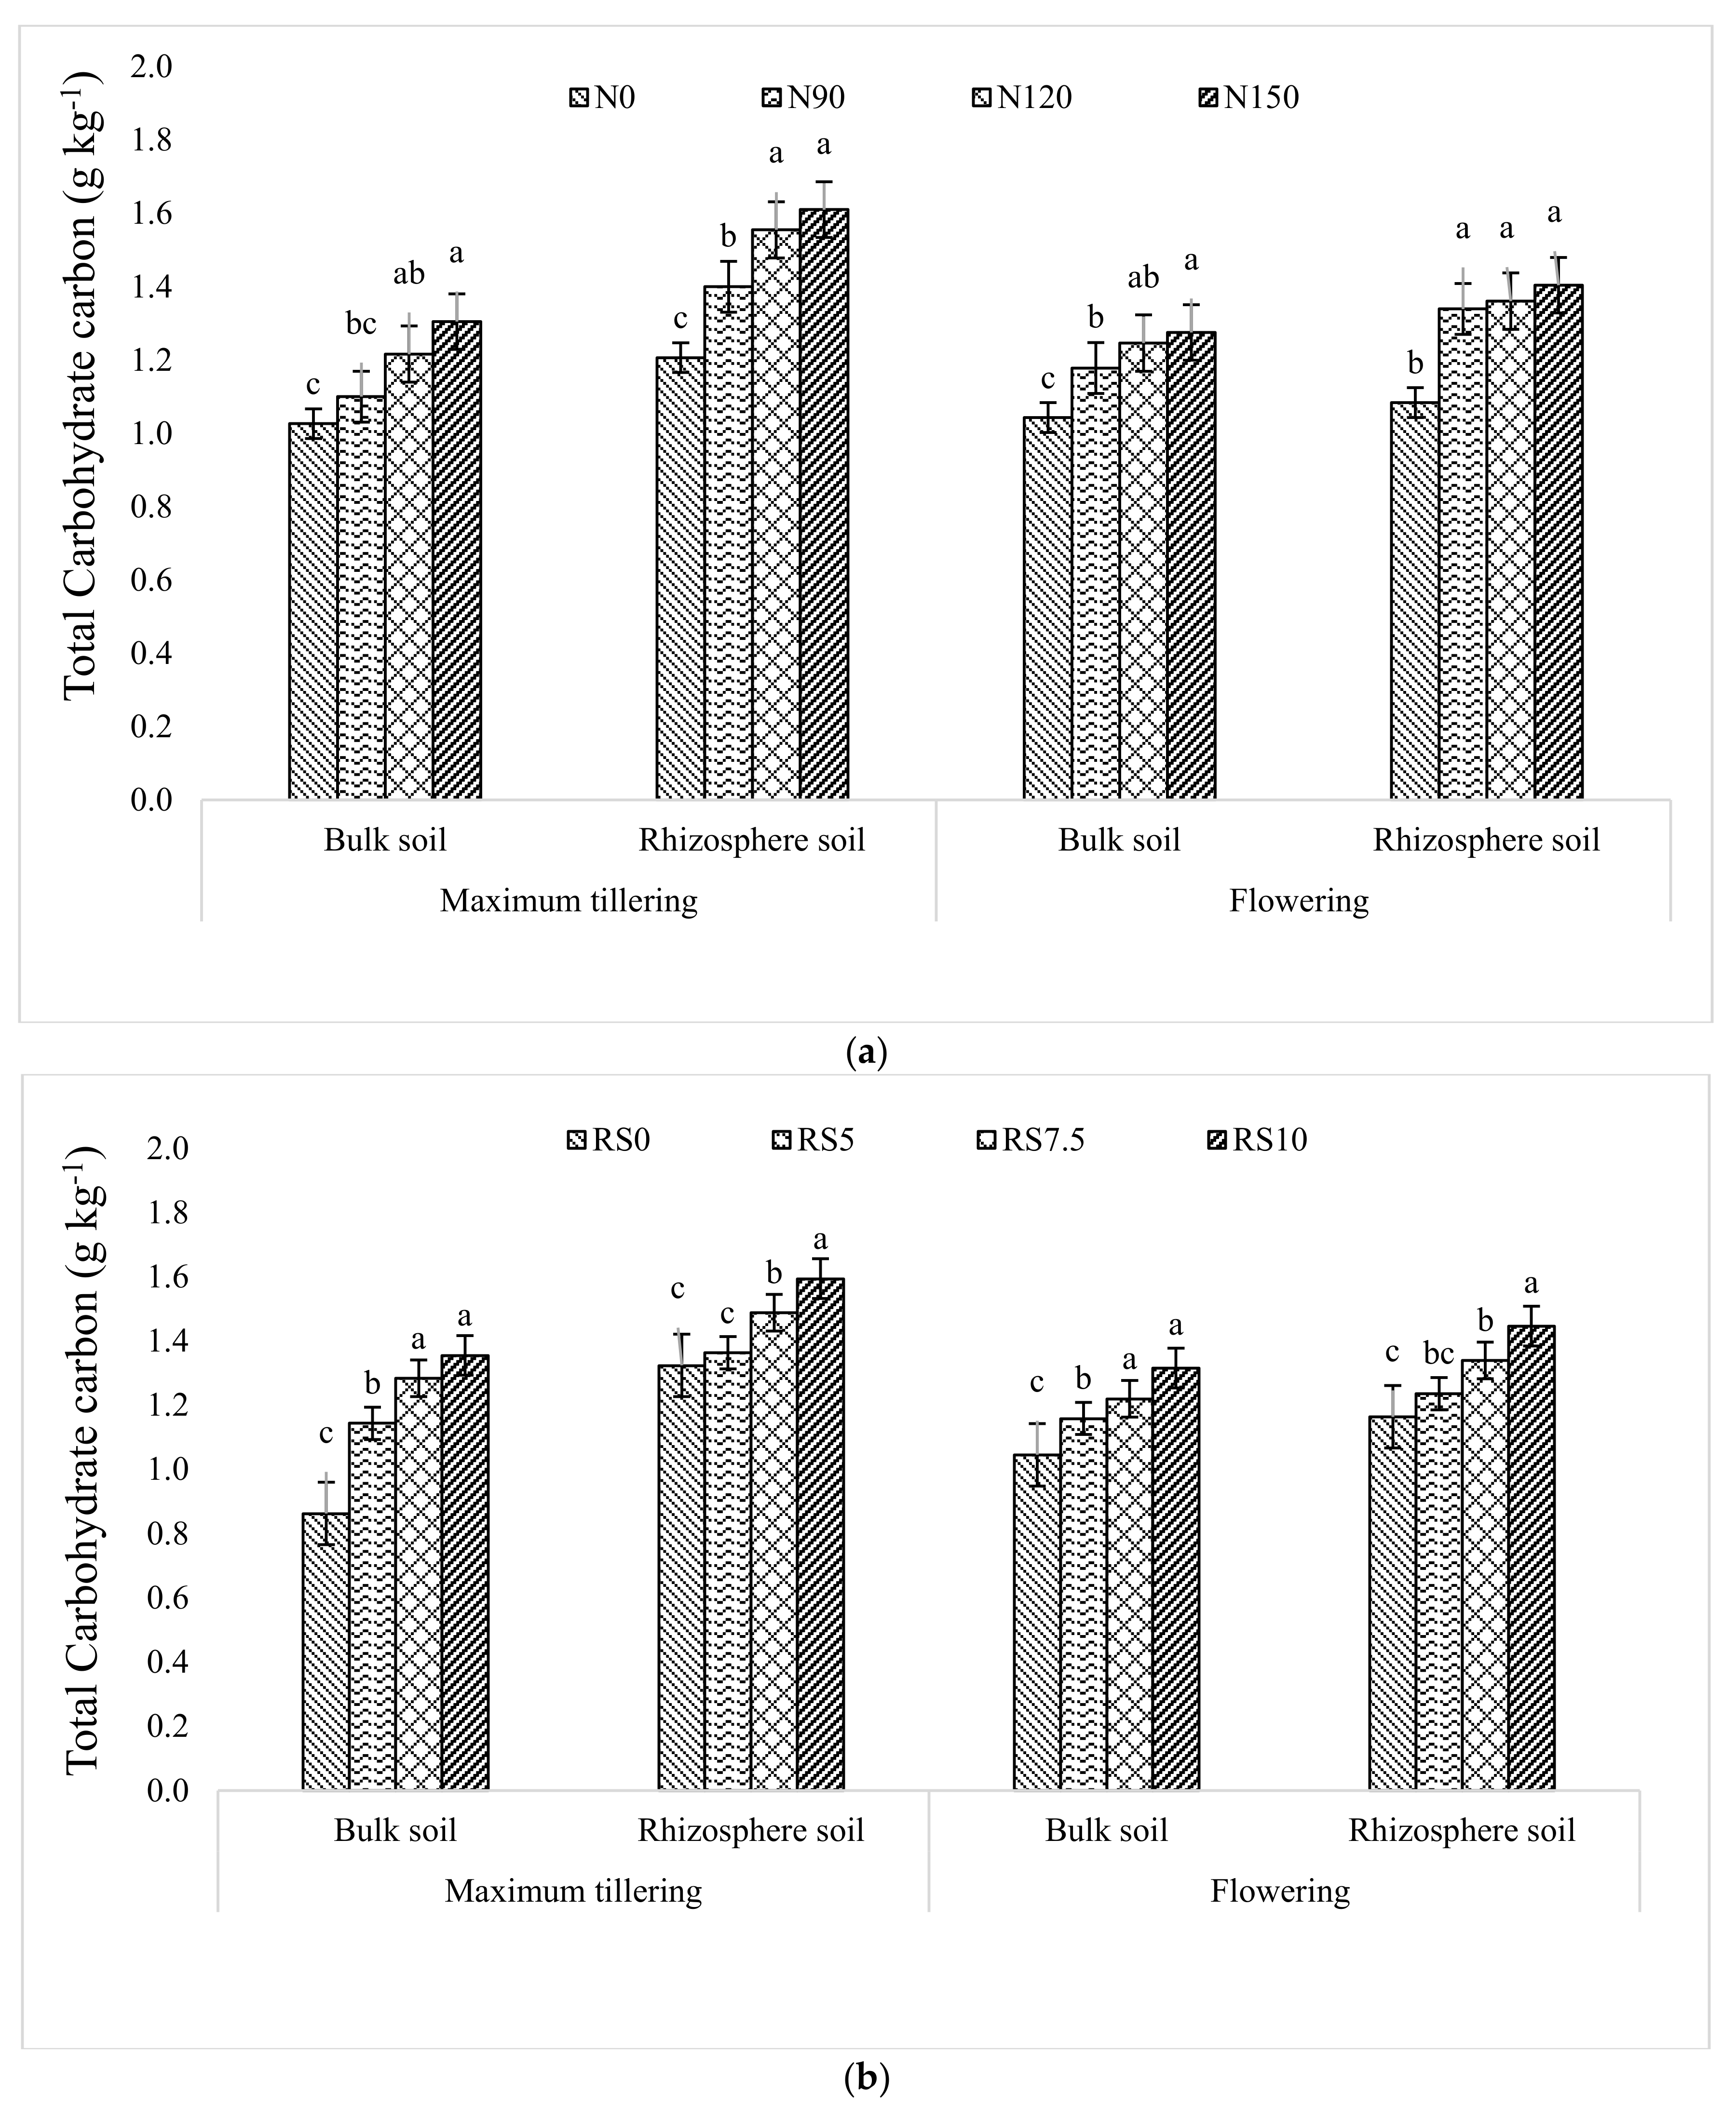
3.1.5. Total Carbohydrate Carbon (TCC)

Total carbohydrate carbon content increased significantly with N application up to the N150 level at MT and FL in both rhizosphere and bulk soils (Figure 5a). In treatments of N120 and N150 compared with N0, the total TCC was higher by 18 and 26% in bulk and 28 and 33% in rhizosphere soils at the MT stage. At FL stage, the increase was statistically non-significant within N120 and N150 and increased significantly by 20 and 22% compared to N0 in bulk soil. RS10 increased by 58.1% and 20.4% TCC content as compared to RS0 in bulk and rhizosphere soils, respectively, at MT (Figure 5b). At the FL stage, bulk soil had TCC content that was statistically at par within RS7.5 and RS10 and significantly higher by 16.2% and 28.6% as compared to RS0. Rhizosphere soil had TCC content higher by 24.2% at MT and 9.4% at FL as compared to bulk soil.

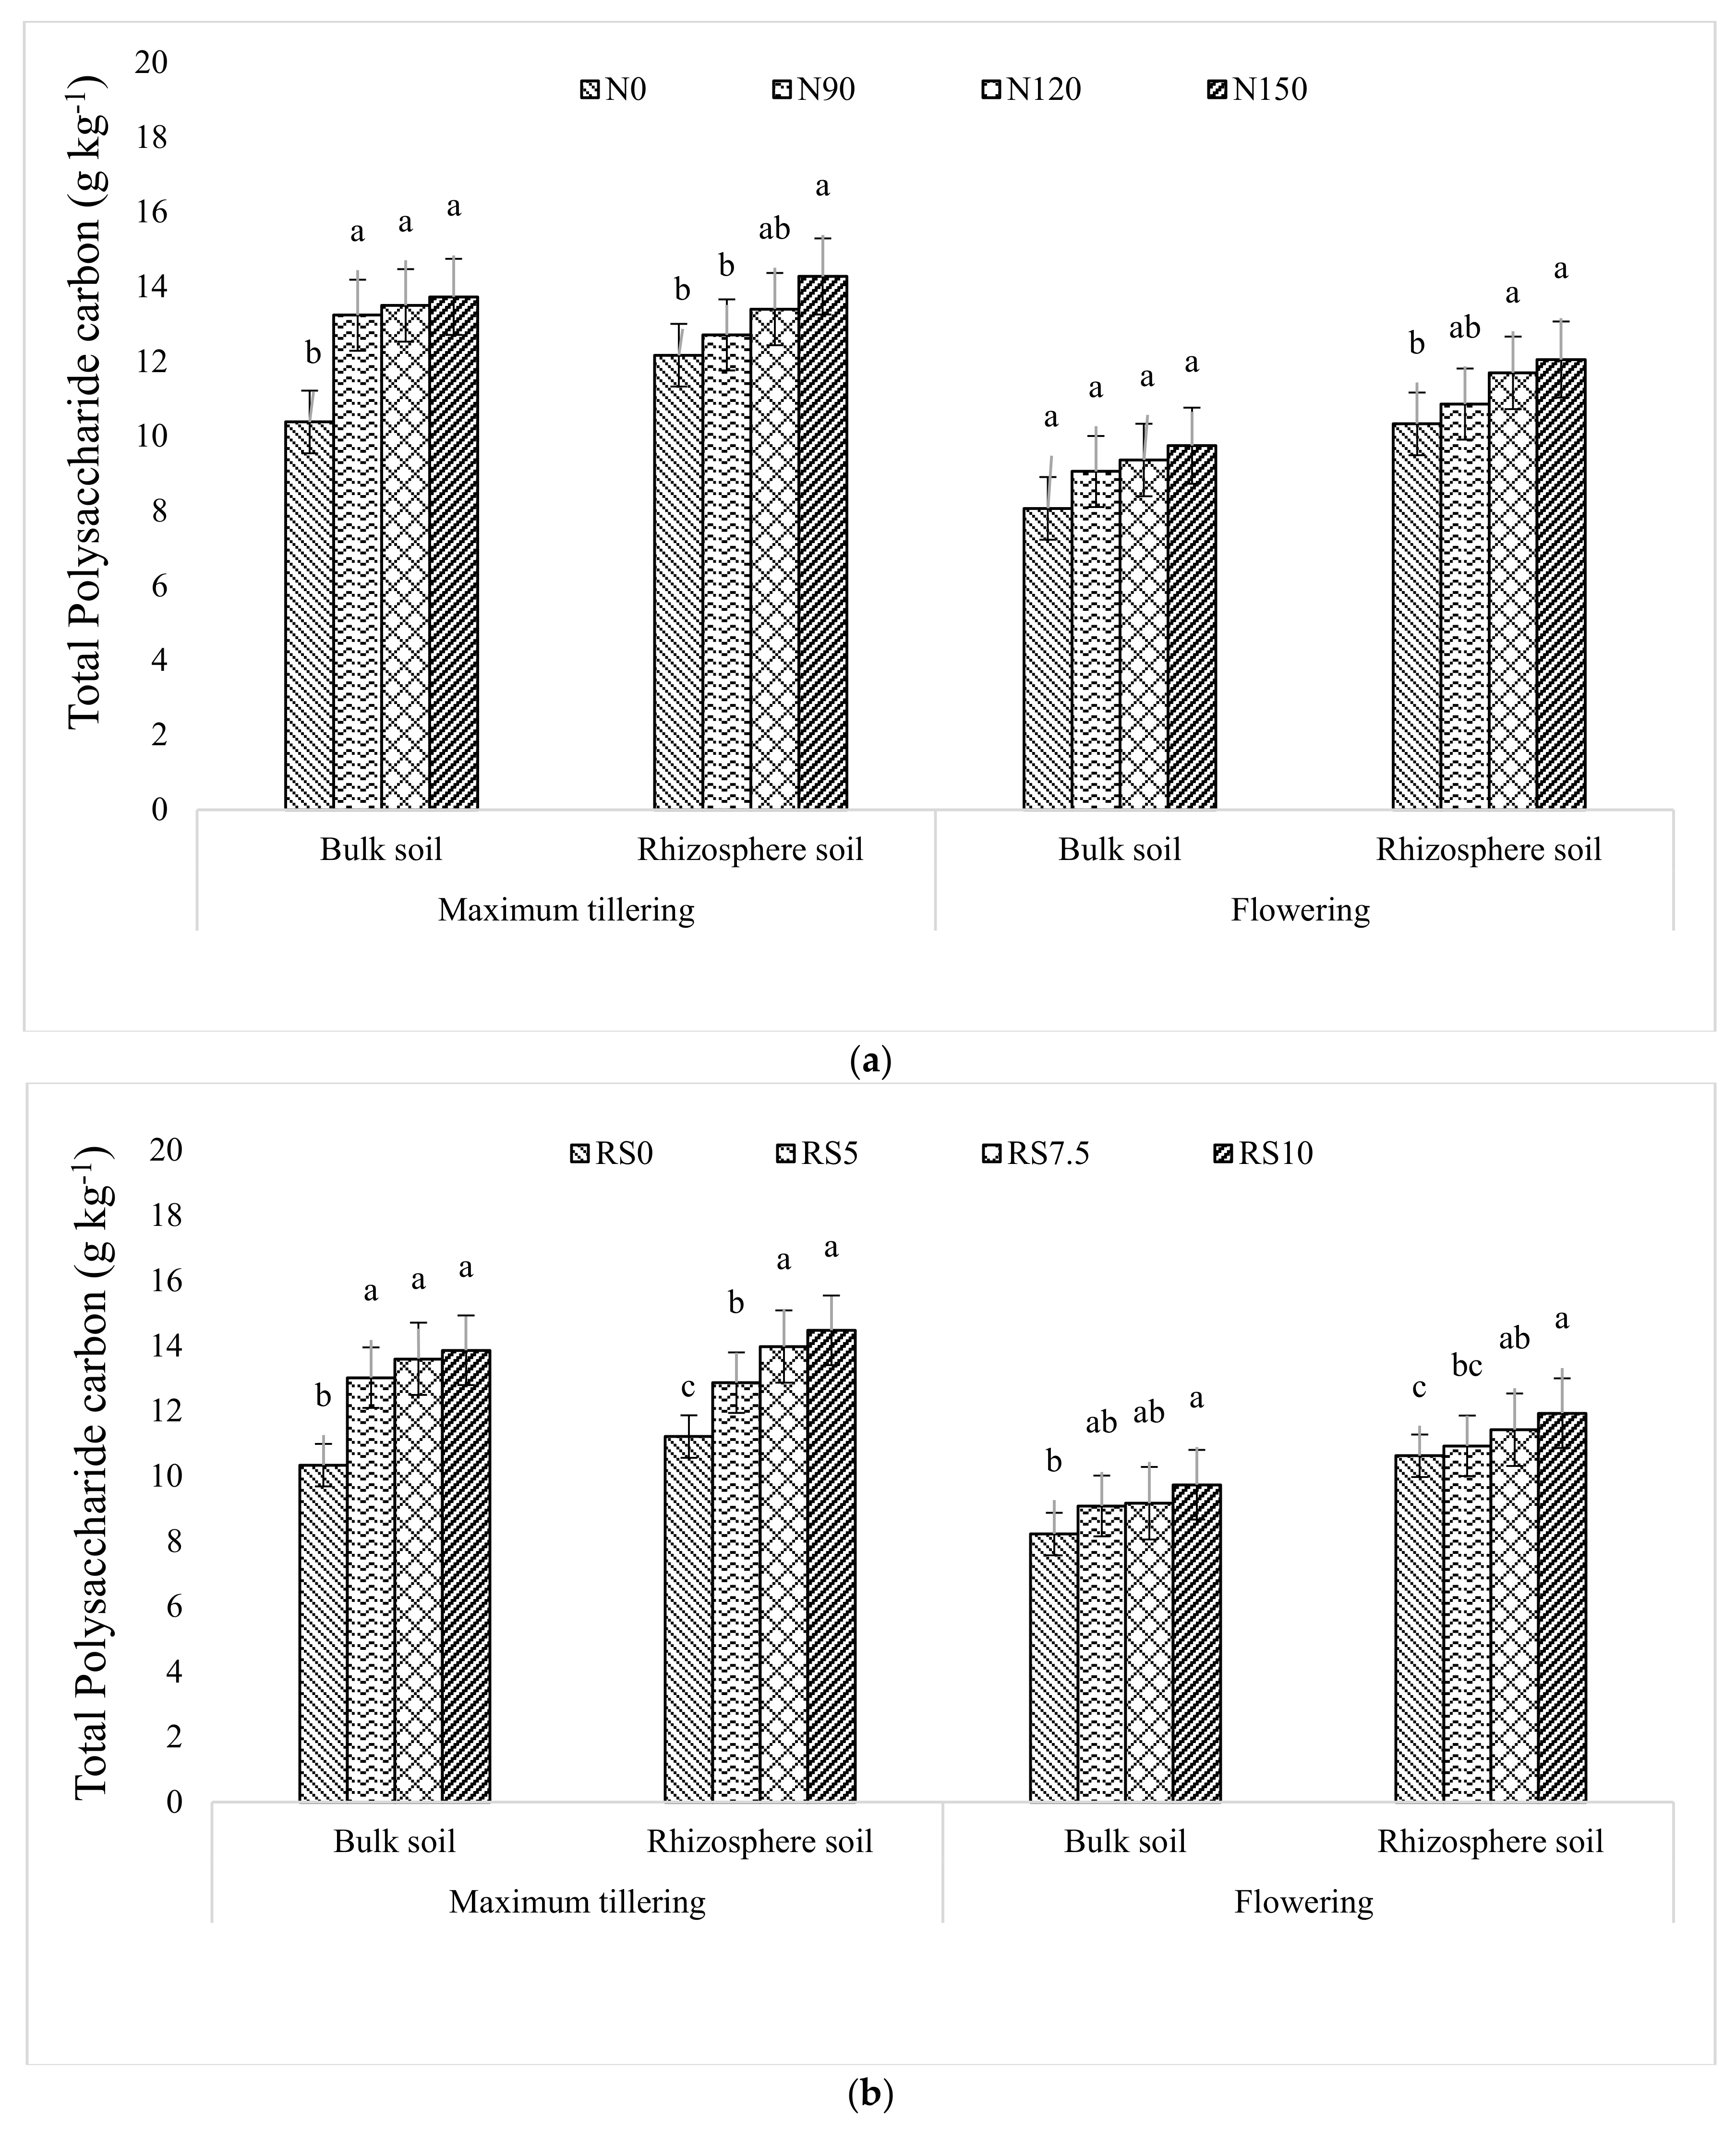
3.1.6. Total Polysaccharide Carbon (TPC)

The TPC content increased significantly with N application at N120 and N150 levels compared to N0 in bulk and rhizosphere soils at both (MT and FL) stages, excluding in the bulk soil at FL (Figure 6a). The increase in TPC content under RS10 compared with RS0 was 1.34-fold in bulk soil at MT (Figure 6b), and at FL the corresponding content was 1.18-fold. At MT and FL stages, 3.3% and 24% higher TPC, respectively, was observed in rhizosphere compared to bulk soil.

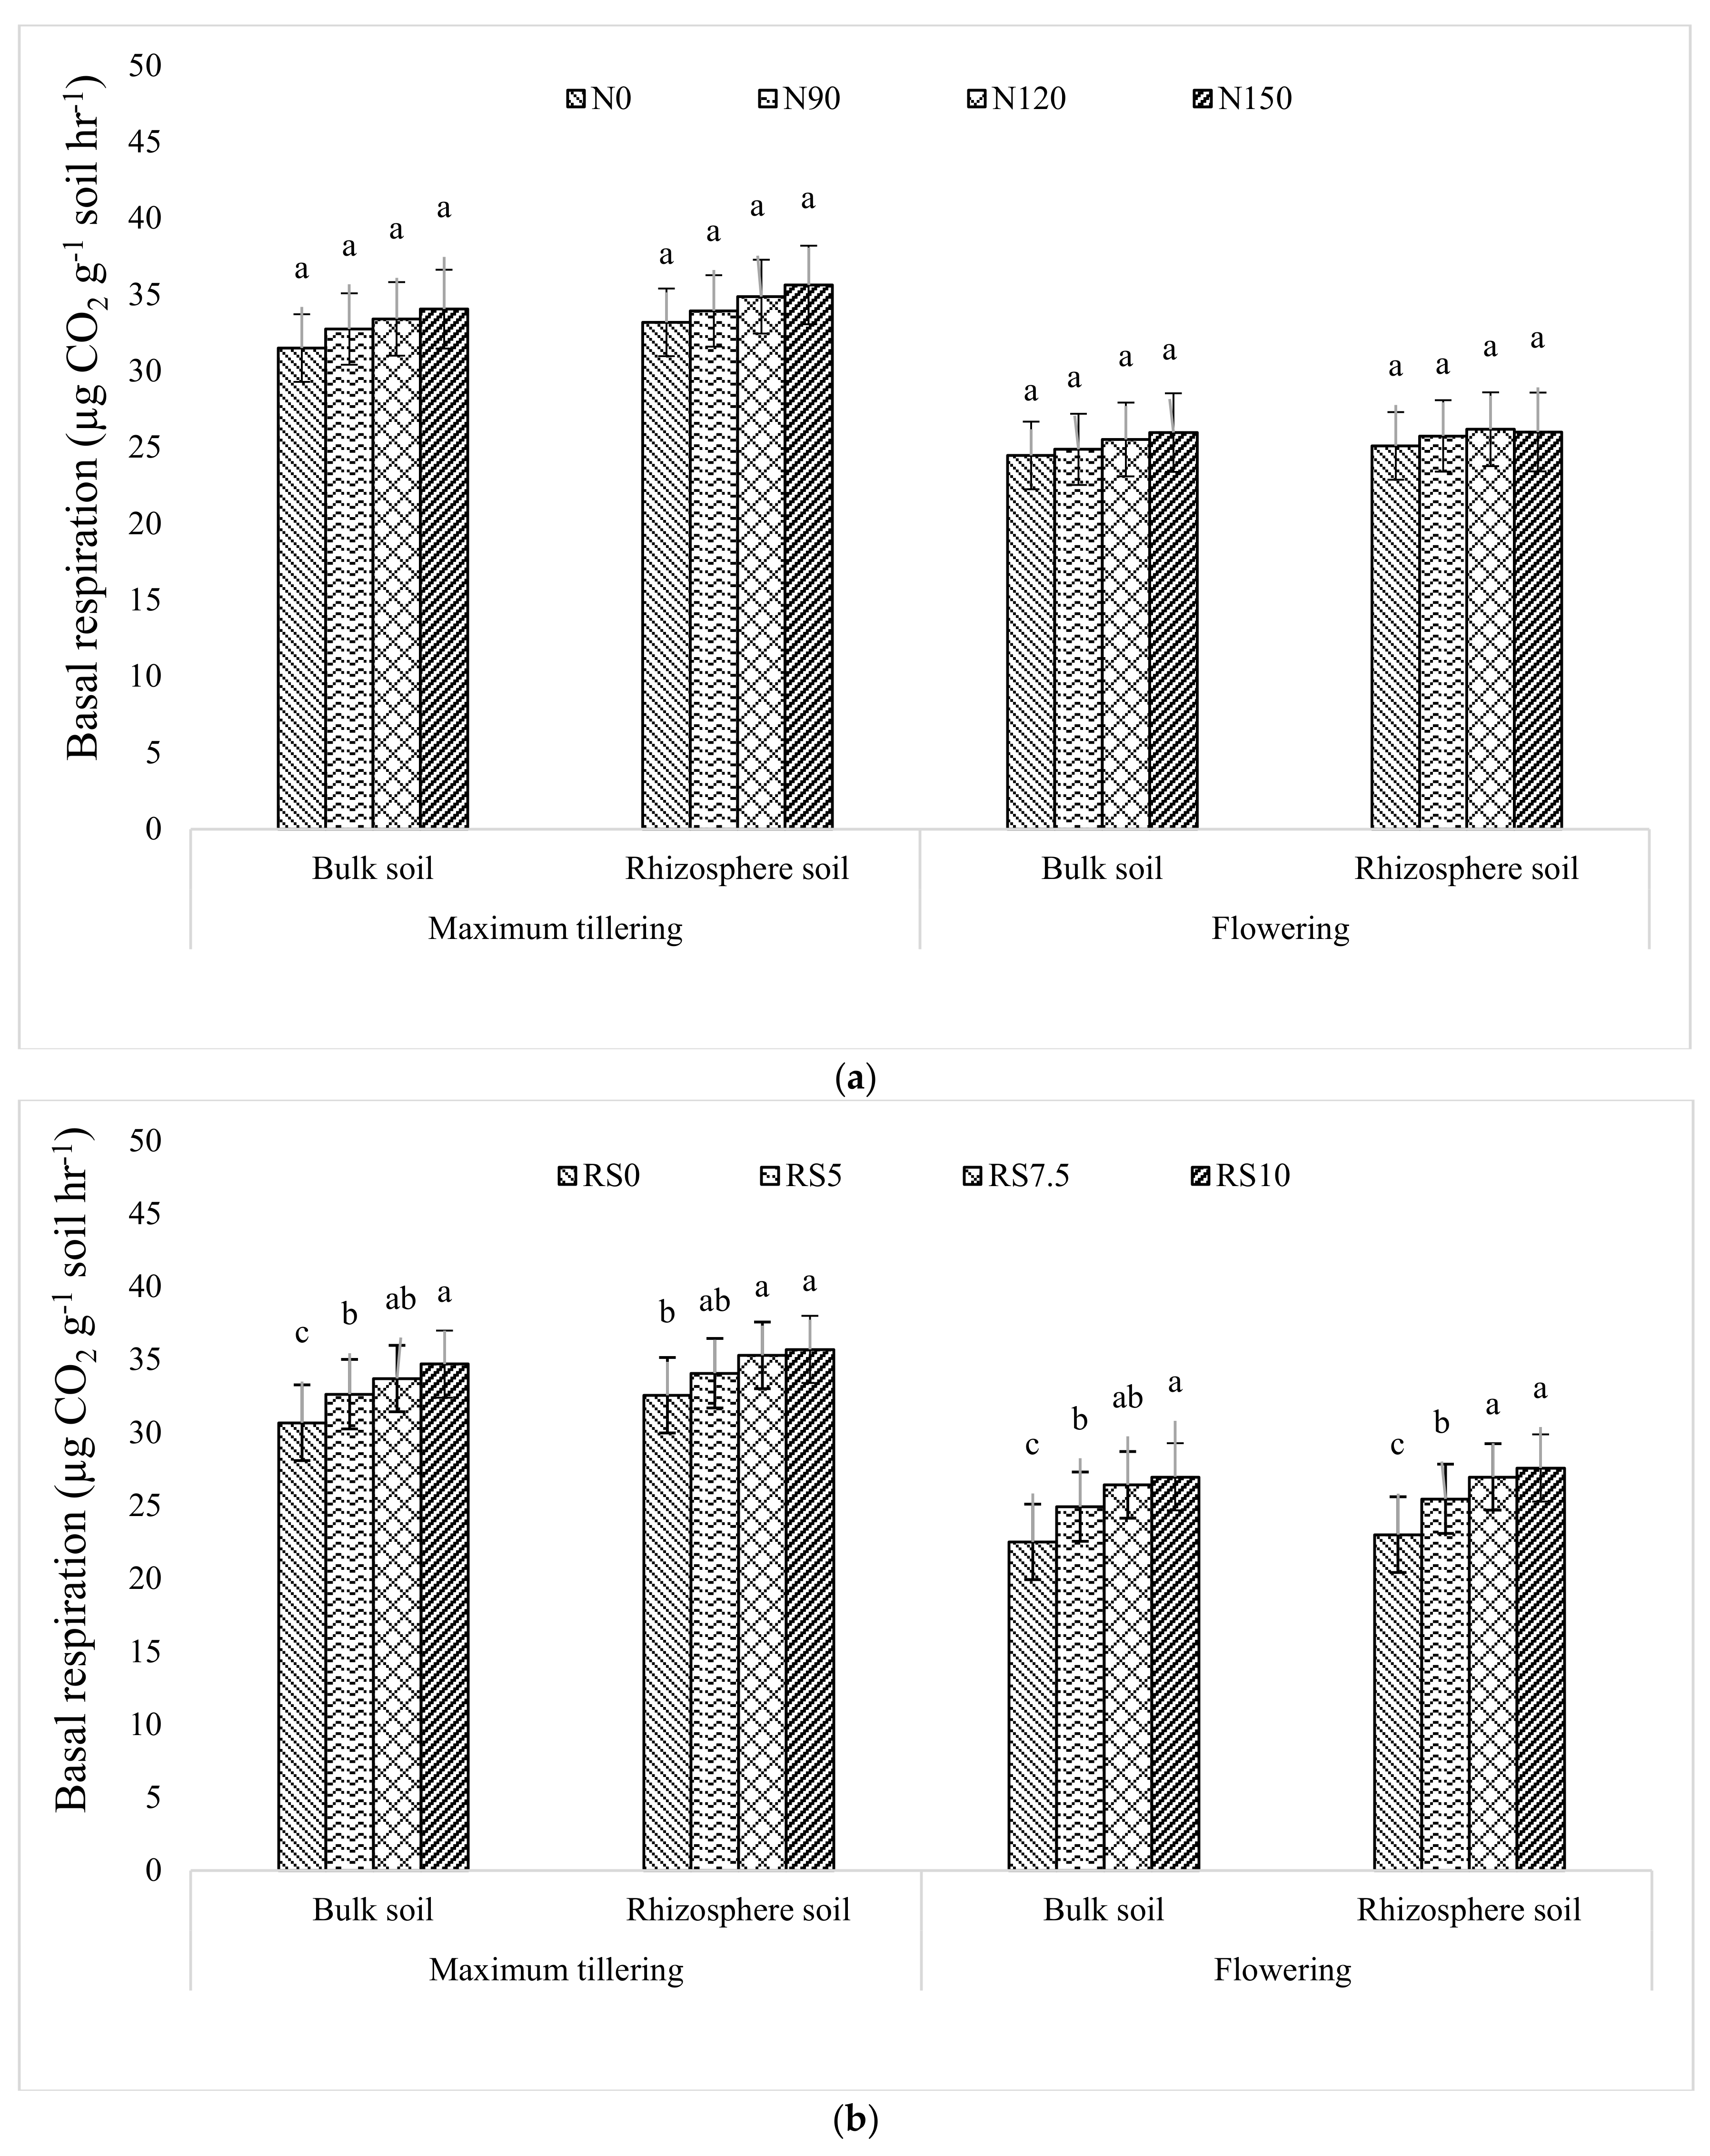
3.1.7. Basal Respiration Rate (BSR)

Effect of N application on BSR was non-significant in bulk and rhizosphere soils at both growth stages of wheat (Figure 7a). Regardless of treatments, BSR was 32.1% higher at MT as compared to FL. The BSR content was significantly increased with RS incorporation, irrespective of N application (Figure 7b). The increase in BSR contents under RS10 compared with RS0 were 35% and 36% in rhizosphere and bulk soils, respectively, at MT. At FL, BSR was 20% higher under RS10 compared with RS0.

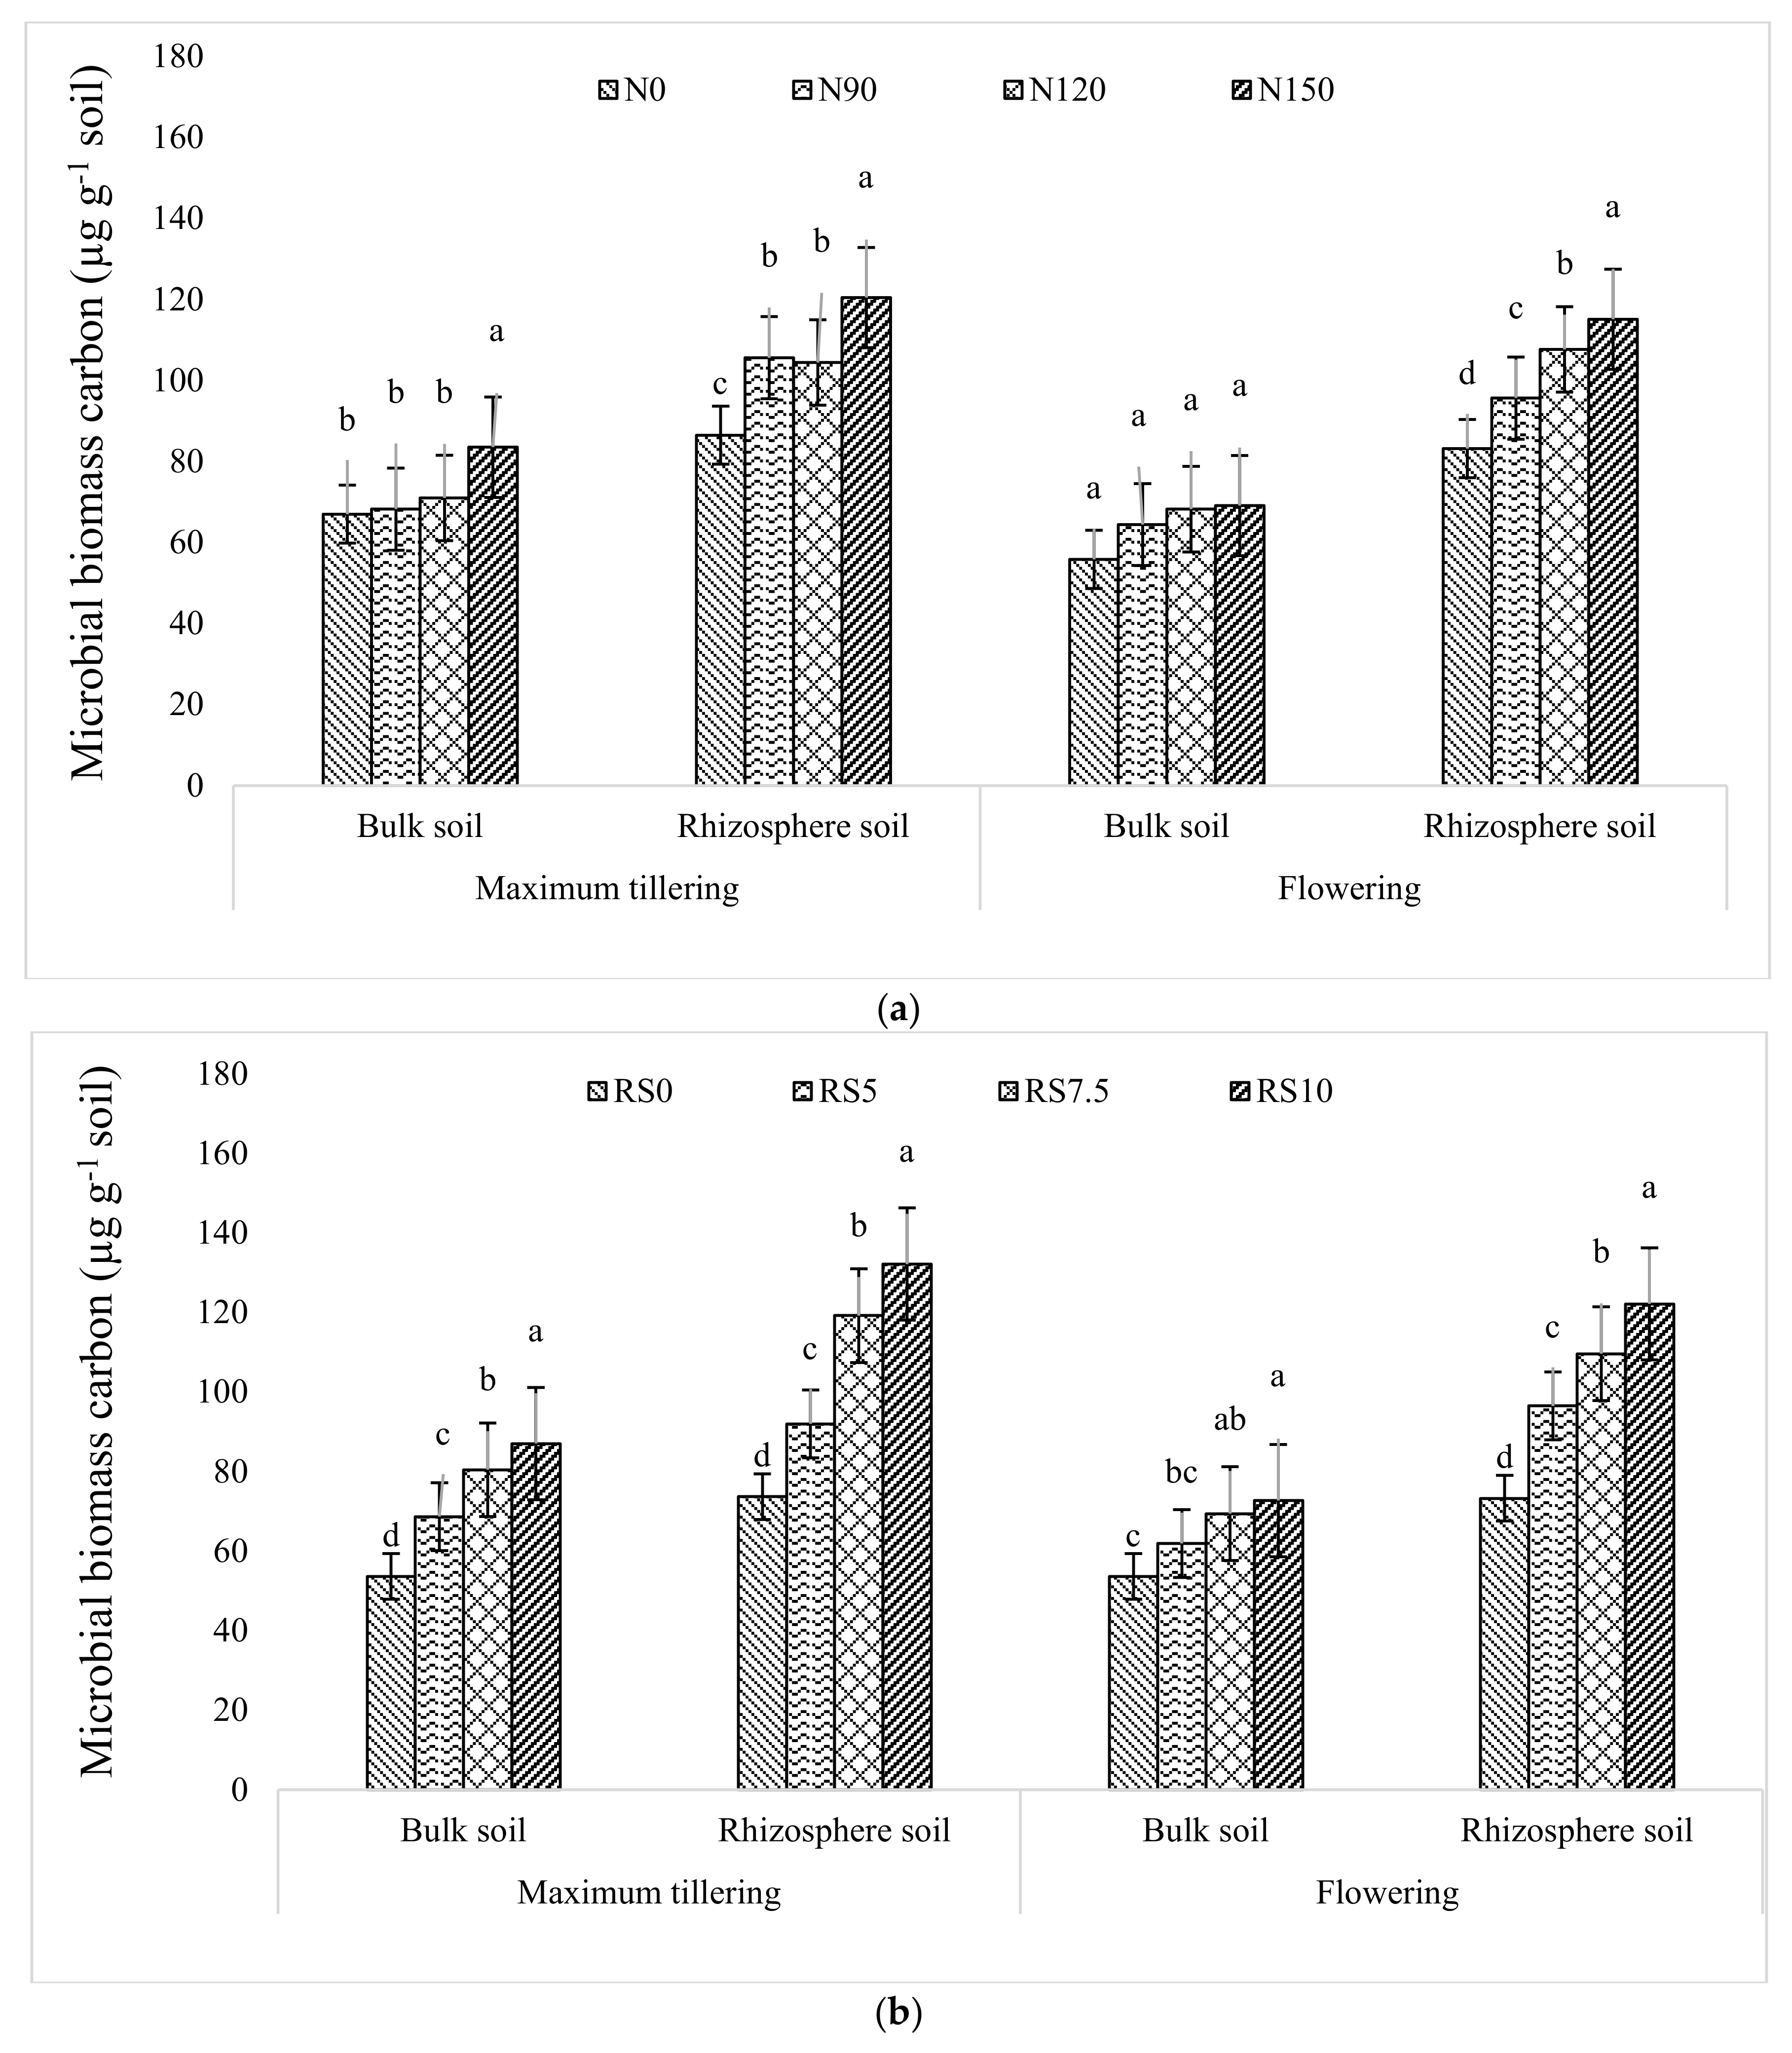
3.1.8. Microbial Biomass Carbon (MBC)

Microbial biomass carbon increased significantly by 25 and 39% for bulk and rhizosphere soils at MT, and 24% and 29% in bulk soil at the FL stage with N150 compared to N0 (Figure 8a). The content of MBC increased significantly with RS10 compared with RS0 by 132% and 87% in rhizosphere and bulk soils, respectively, at MT (Figure 8b). At the FL stage, MBC content in RS10 was significantly higher by 66% and 36% than under RS0 in rhizosphere and bulk soils, respectively.

3.2. Wheat Yield and Nutrient Uptake

Application of N more than 90 kg ha−1 and RS incorporation greater than 5 Mg ha−1 increased grain and straw yields significantly compared to their controls (Table 2). Total N, P, and K uptake by wheat significantly increased up to 120 kg N ha−1 and further increase in N rate did not impact the nutrient uptake. Rice straw incorporation did not influence plant N uptake; however, higher P and K uptake was observed with the straw incorporation compared to control (Table 2). The maximum K uptake was observed at 7.5 Mg RS ha−1, which did not increase with the higher level of RS incorporation.

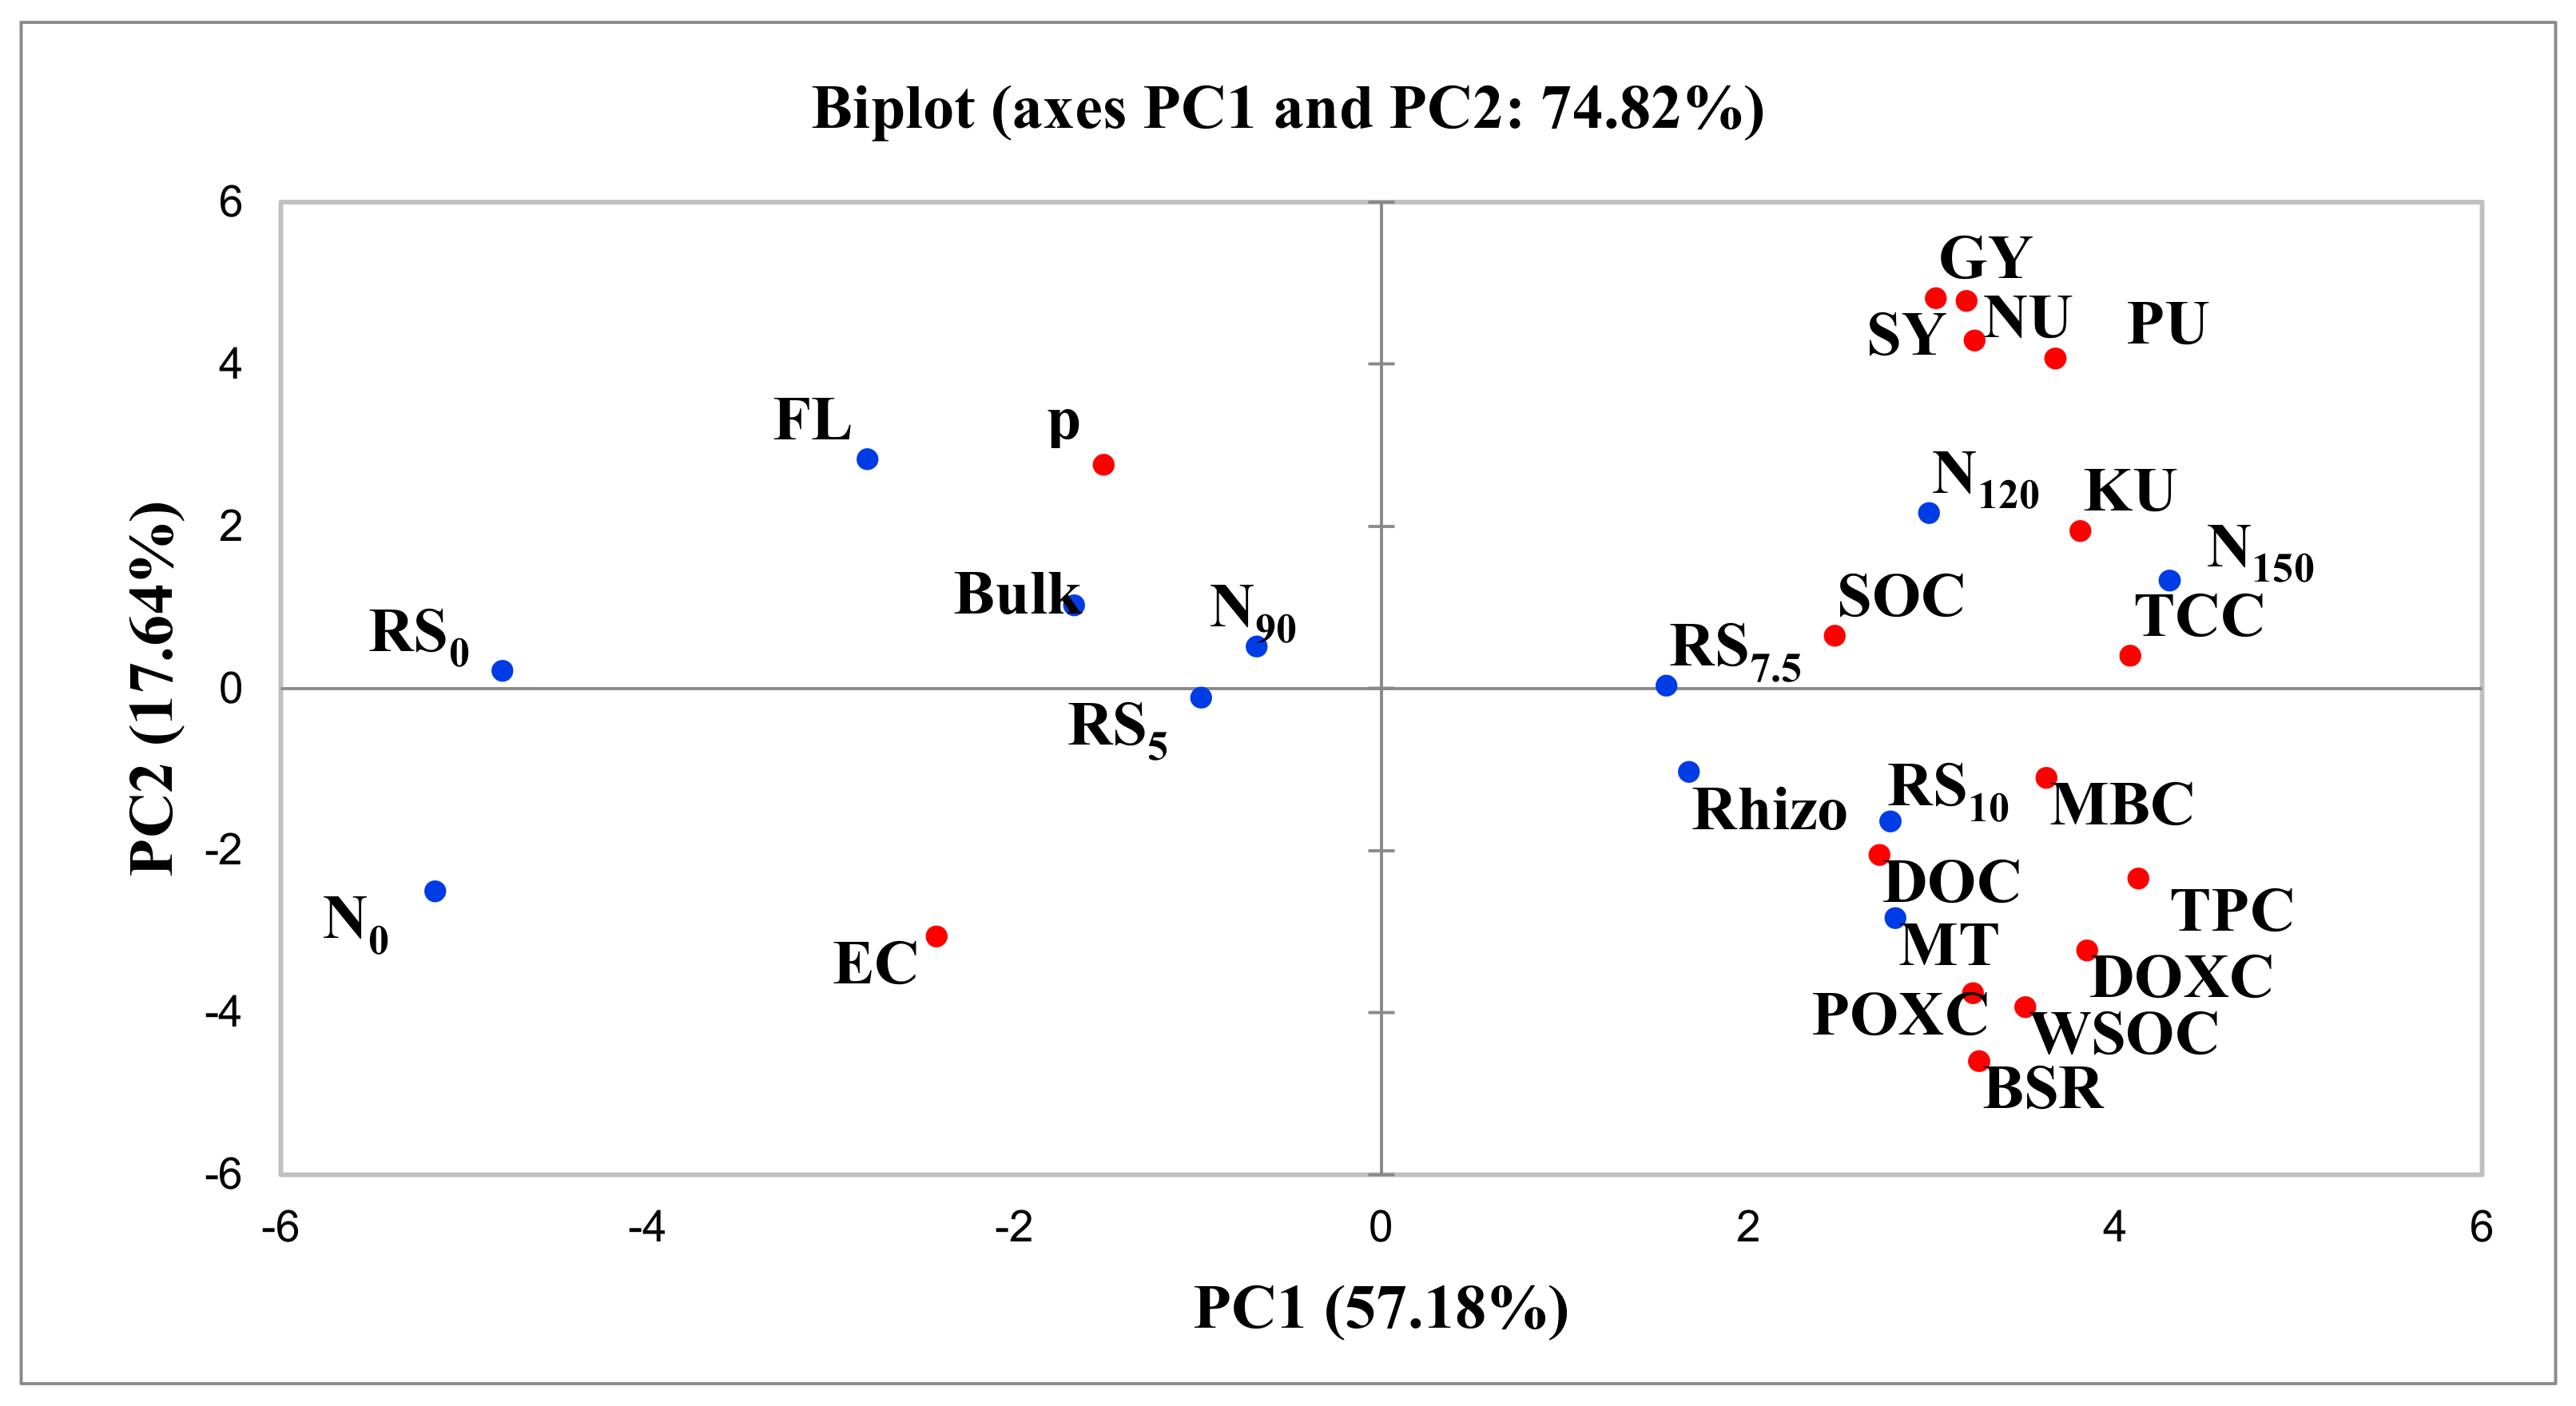
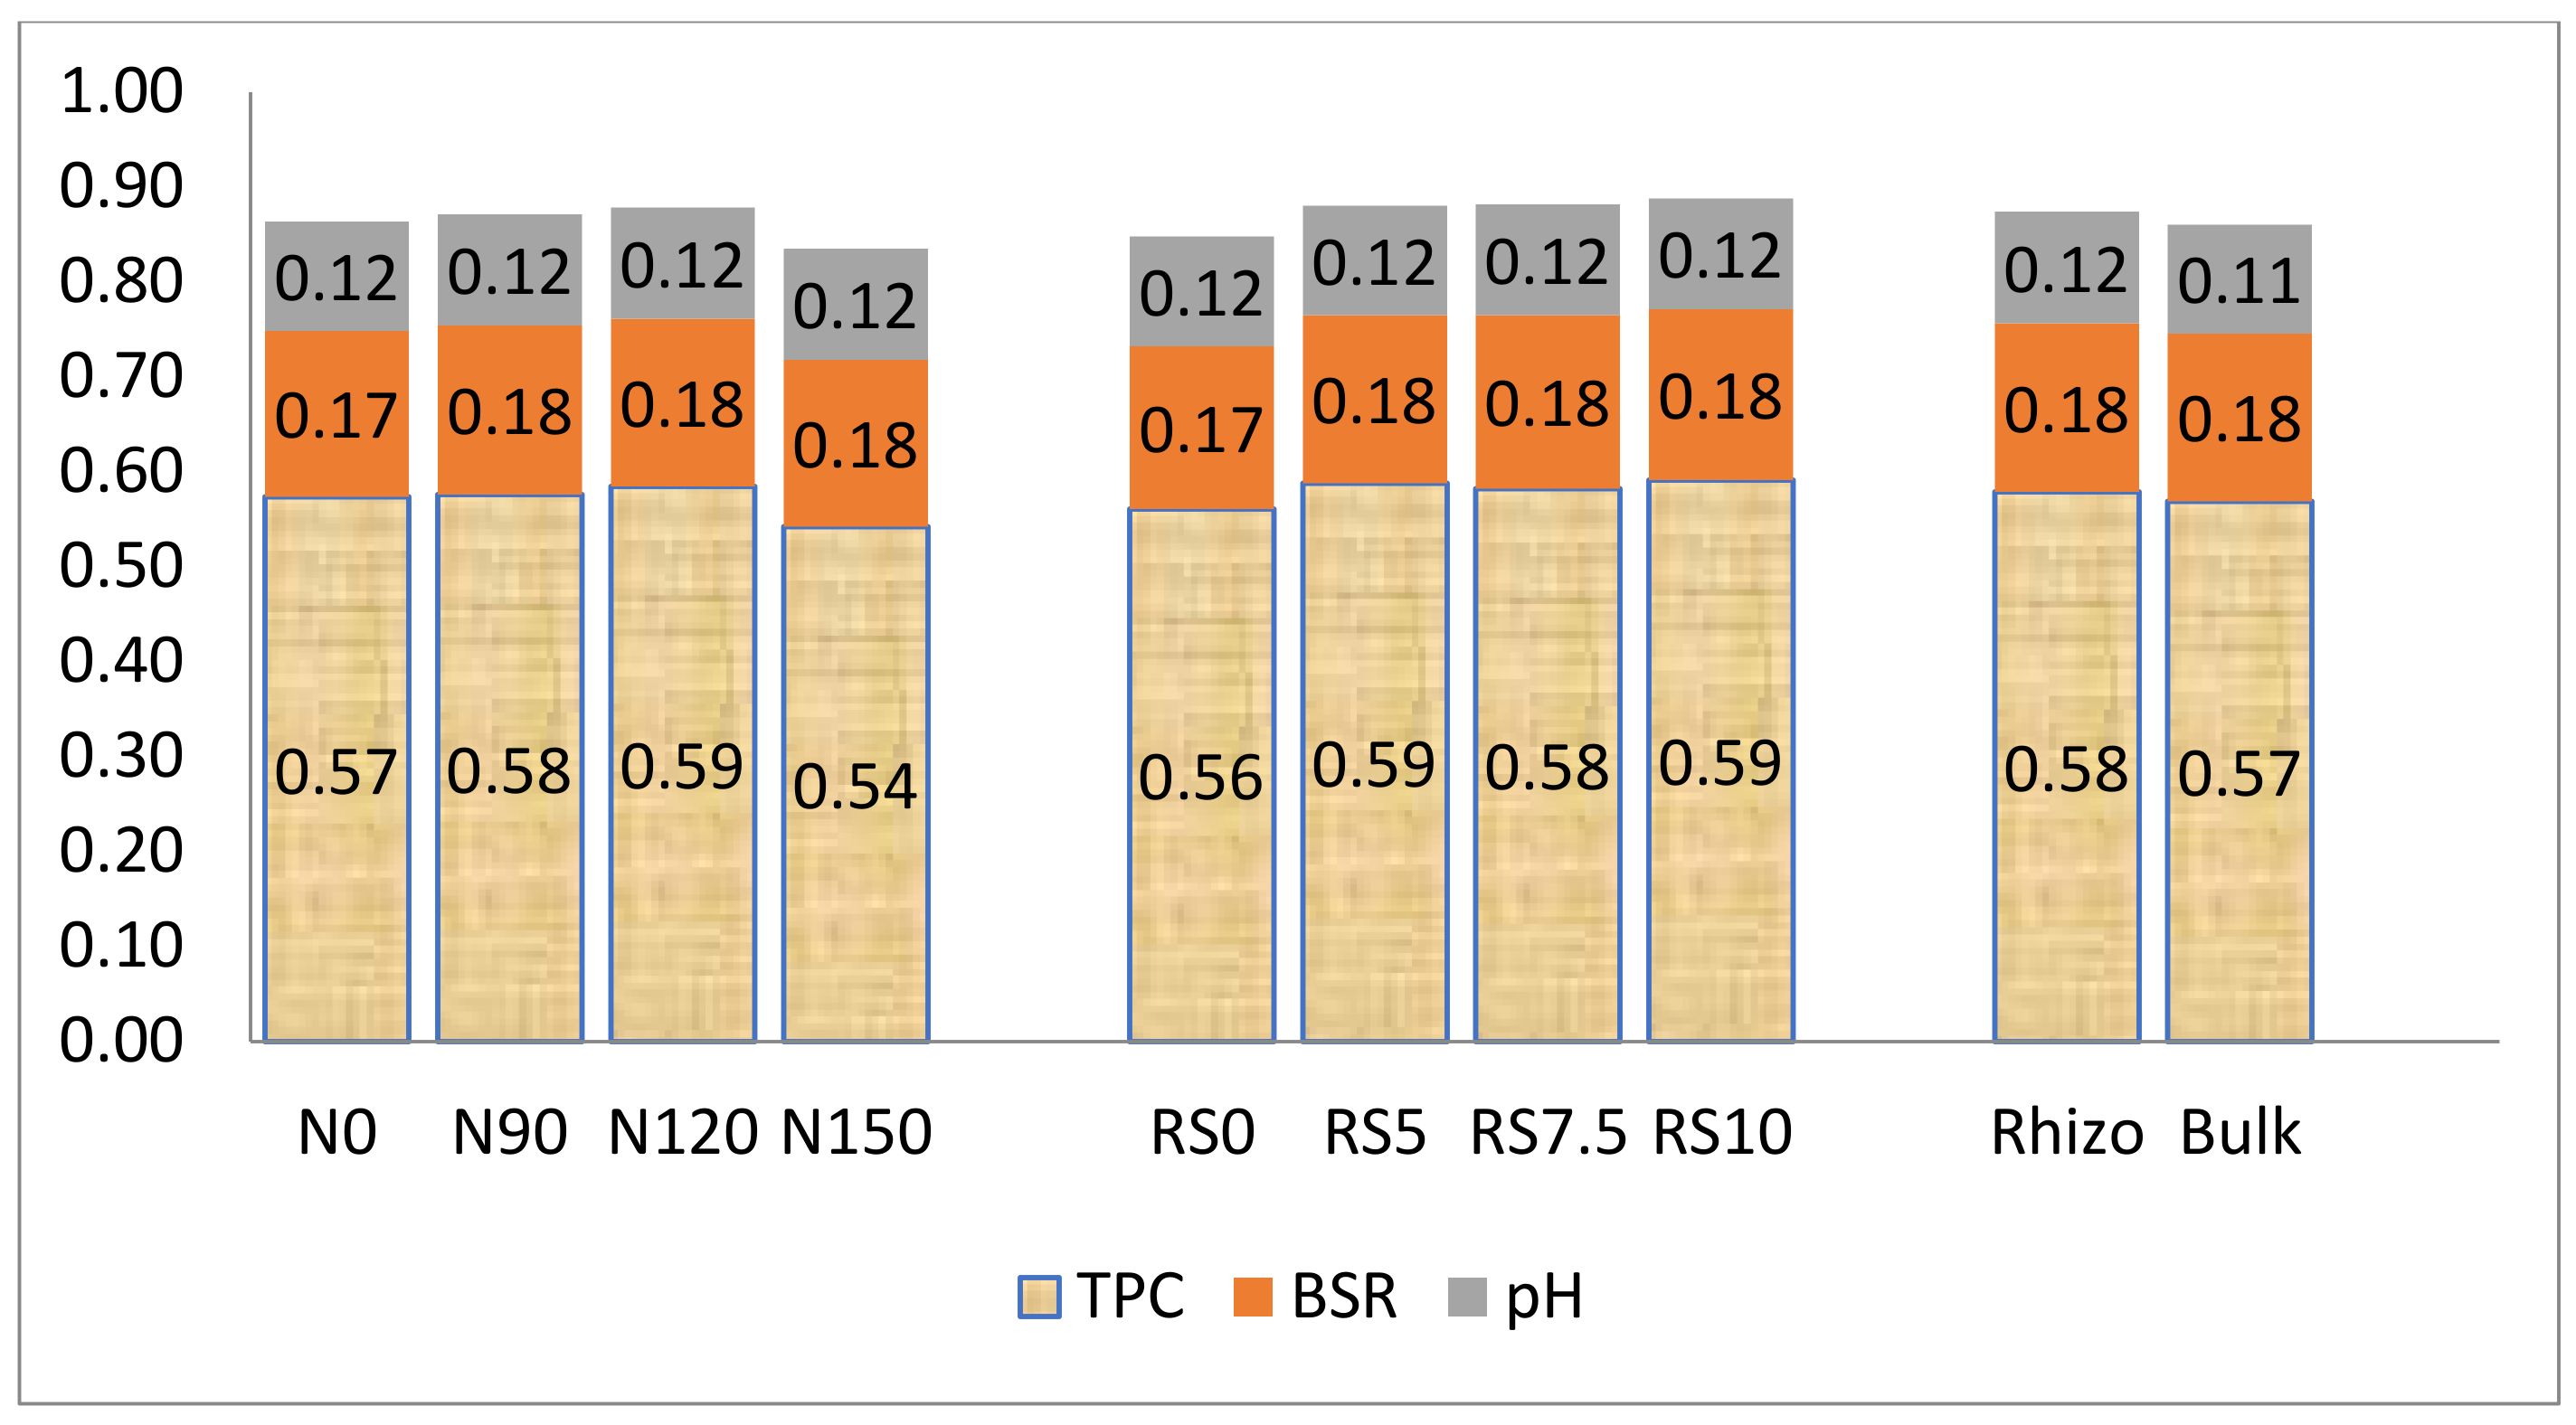
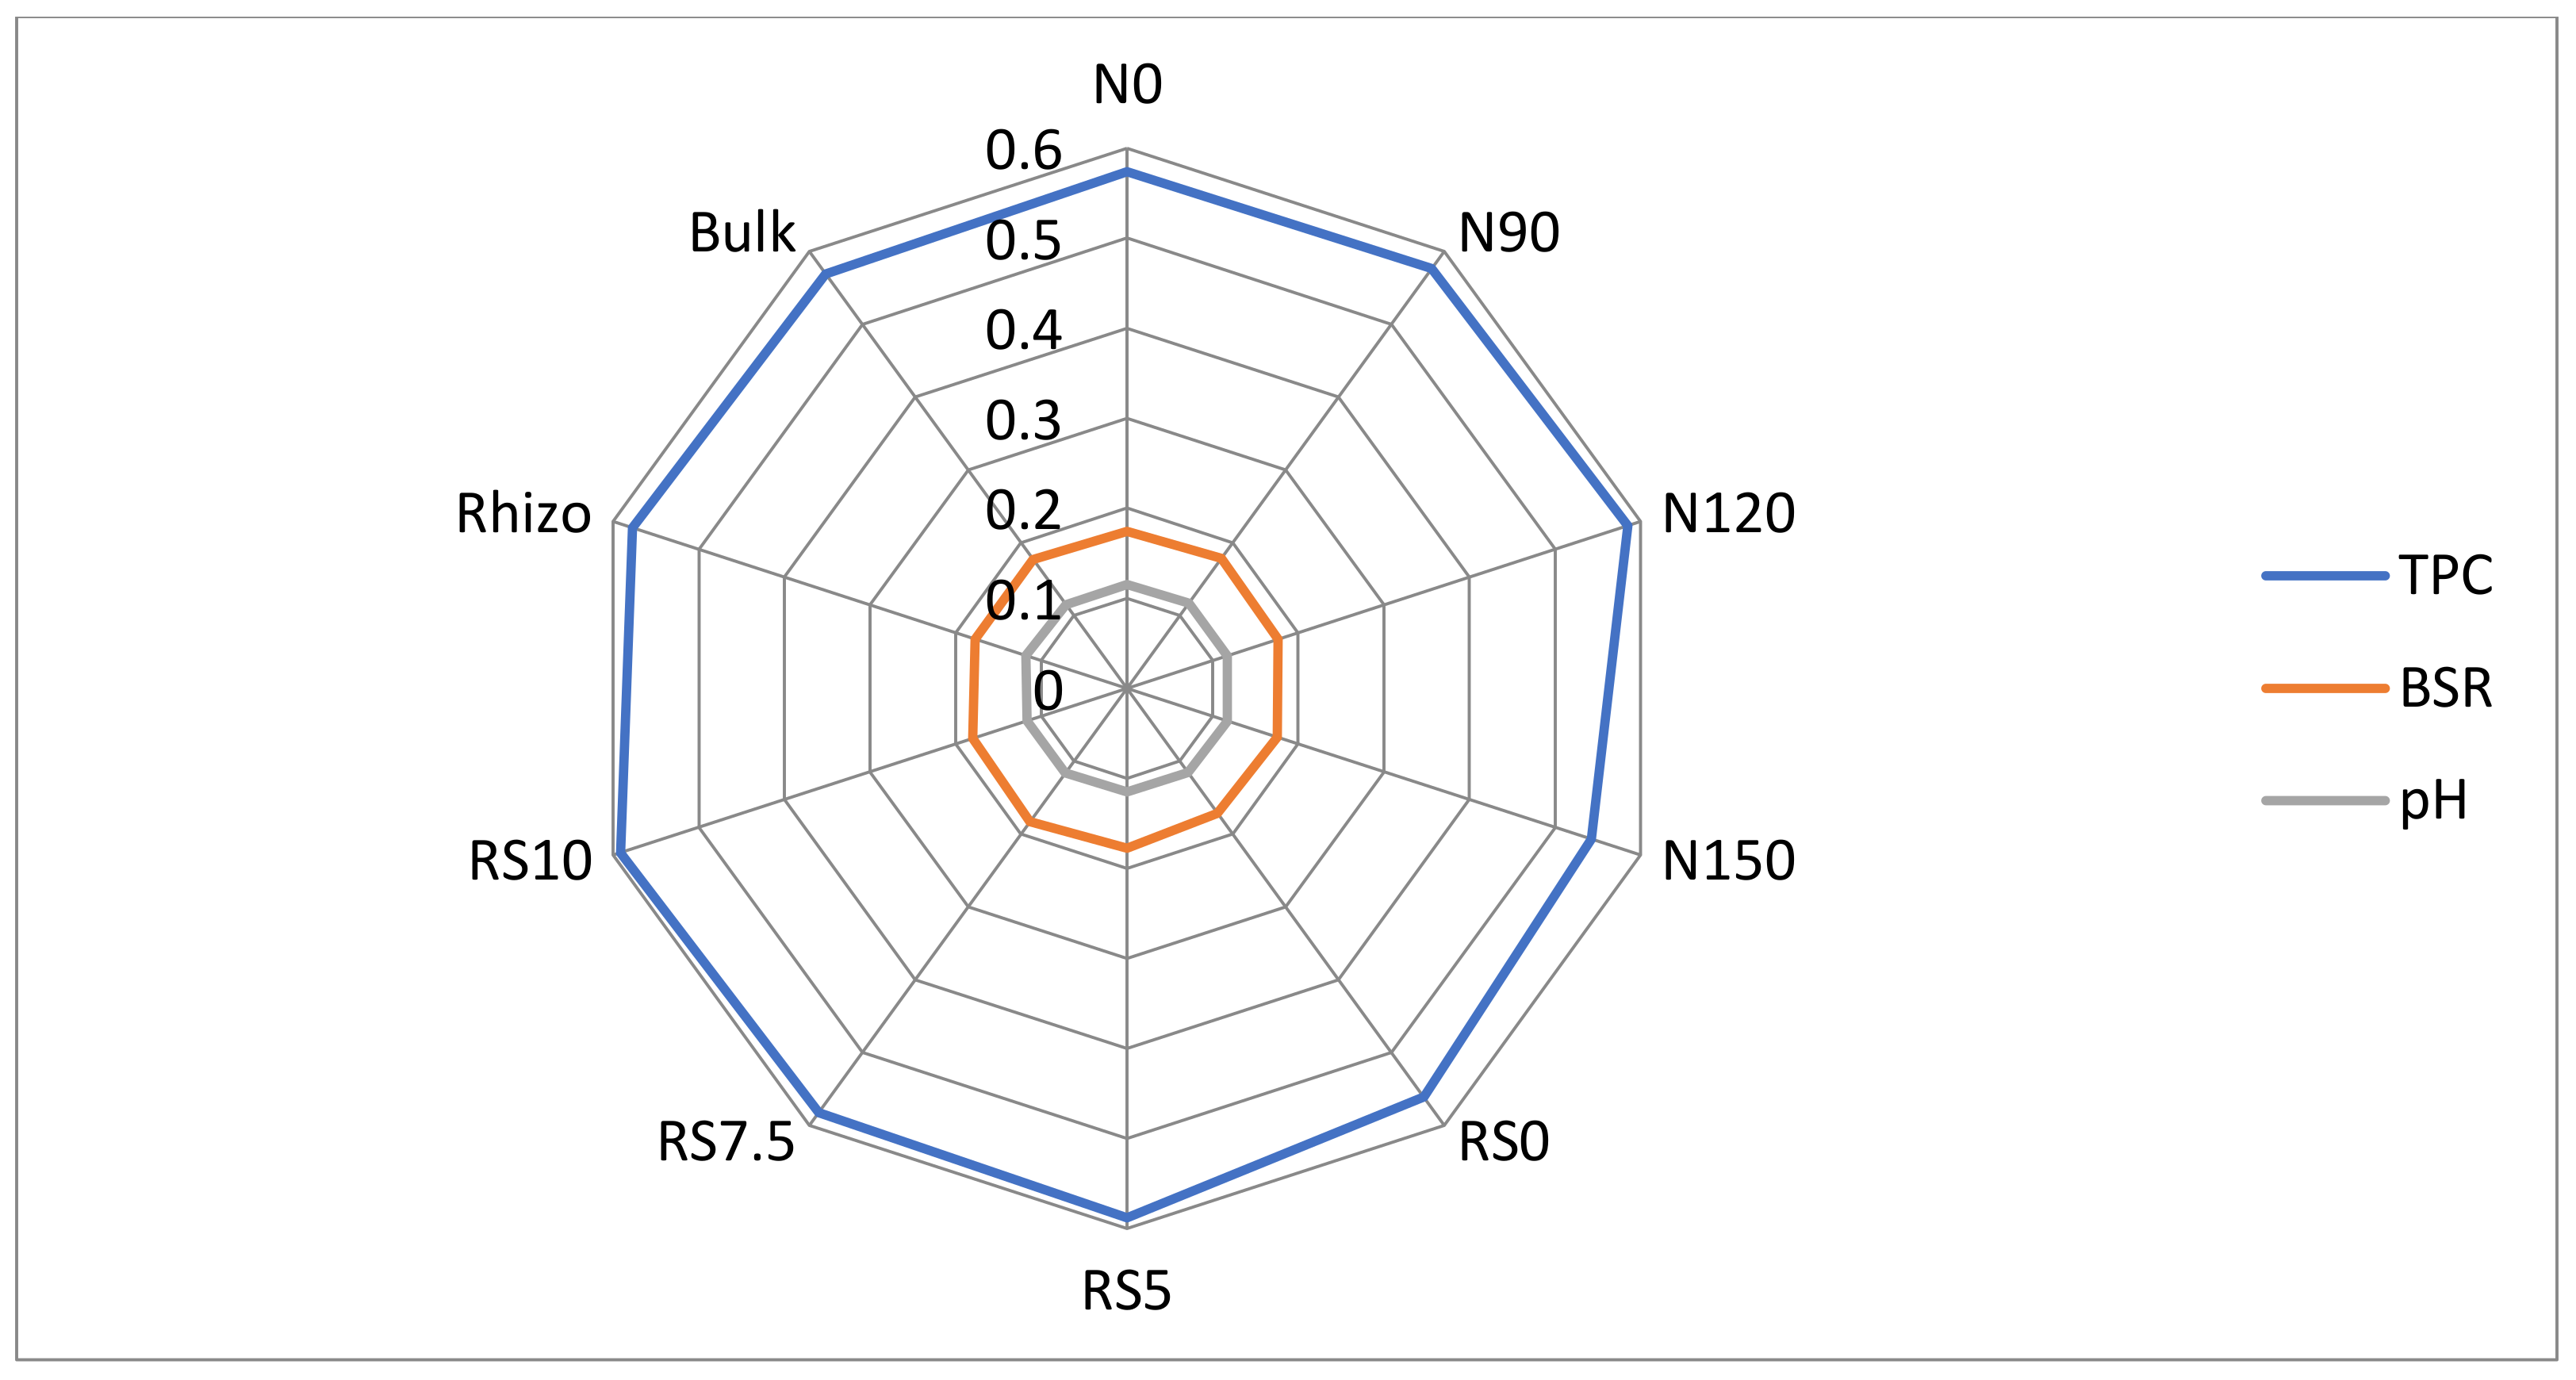
3.3. Principal Component Analysis

In the PCA of 16 variables, 3 principal components had Eigenvalues >1 and explained 84.9% of the total variance in the data (Table 3). Under PC1 there were four highly weighted loading variables, i.e., TPC, total CHO, DOXC, and MBC, with loading values of 0.945, 0.935, 0.881, and 0.830. The variability explained by all the soil variables was 57.2% with an Eigenvalue of 9.15. The second component (PC2) explained about 17.6% of variance and had an Eigenvalue of 2.82. The highest positive loading value was −0.585 (BSR) followed by −0.500 (WSOC) and −0.478 (POXC). Under PC3, highly weighted variables were pH and SOC with loading values of 0.799 and 0.619, respectively. The inter-correlations between highly weighted variables under different principal component analysis (Table 4) revealed that among the four variables, TPC in PC1, BSR in PC2, and pH in PC3 can be chosen for the minimum data set (MDS) because of their highest correlation. The weight of each PC on the basis of percent variance to total variance ranged from 0.12 to 0.67. The weighted factor for the MDS had the following trend: PC1 (0.67) > PC2 (0.31) > PC3 (0.12).
The positions of different variables and treatments in the orthogonal space were defined by the PCs (Figure 9). The first principal component clearly separated the MT stage from FL, rhizosphere soil from bulk, N120 from N0, and RS10 from RS0 treatments in the factorial space. The variables TPC, BSR, and pH were related to the MT stage of wheat crop and were located towards the right end of the scoring plot, indicating a positive score for PC. All the labile C pools were positively correlated to each other and with wheat grain yield Among the treatment combinations, the soil quality index (SQI) ranged from 0.835 to 8.89. The highest SQI was obtained in RS10 (8.89) followed by N120 (8.79). The lowest SQI value was obtained under N150 (0.835) followed by N0 (0.865), suggesting relatively less aggregative effect of these treatments. The SQI value among bulk and rhizosphere soil varied between 0.86 and 0.87 (Figure 10). The high weight of TPC indicated its highest variability in the data set. The specific contribution of MDS toward SQI is presented through radar plot (Figure 11).

4. Discussion

The results of the present study revealed that variable rates of N fertilizers and rice straw incorporation increased labile C pools (WSOC, DOC, DOXC, POXC) significantly (p < 0.05). The magnitude of increase varied with labile C content, stage of the crop, and the neighbourhood of soil to rhizosphere. The increase was maximum (71%) and significant in WSOC in rhizosphere soil at the MT stage of wheat with incorporation of RS at 10 Mg ha−1. Most likely, the continuous addition of medicated cumulative C input year after year for 7 years, large root biomass, microbial biomass, and root exudates [43] enhanced the fungal growth [44,45], as well as that the stimulation of microbial activity produced more WSOC and other labile C contents such as DOC and MBC [46]. A synthesized meta-analysis of 257 published studies revealed that despite increased soil respiration, N fertilizer application caused an increase of ~3.5% in organic C storage in croplands, possibly due to increased below-ground biomass C input [45]. The increase in DOC was 64% in RS incorporation compared with no straw incorporation in the surface soil layer (0–20 cm) under the RWS [47]. Irrespective of RS incorporation, higher N rates released DOC directly by proliferating the root system and microbial decomposition of complex C compounds in the rhizosphere [48]. The growth of some microbial groups such as oligotrophs may facilitate the use of nutrients from native soil organic matter, leading to microbial nutrient mining following incorporation of low-quality crop residues with high C-nutrient ratios [49]. Though DOC is a small fraction of total soil organic C, it plays a key role in nutrient mobility and availability to crops by making complexes with micronutrients, such as the DOC-Zn complex [50]. With the application of crop residues and N fertilizer application, DOXC and POXC contents in soil were also increased, because (i) the DOXC comprises readily decomposable humic material and polysaccharides [51] having readily hydrolysable C, (ii) rice straw provides carbonaceous material which acts as food for microbes resulting in an increase in labile C fractions [47,52], and (iii) of the increase in microbial activity nucleation centres for enzyme activities, organic C and soil structure [53,54]. With RS incorporation and N fertilizer application, the increase in TCC content in the present results is in agreement with those of [55], who reported significant increases in water-soluble carbohydrates with the application of organic manure alone or along with inorganic fertilizer (NPK) compared with control. TPC in rhizosphere soil was also increased, which may be due to the excretion of polysaccharides (such as mannose and galactose) by plant roots in the addition of microorganisms [56,57,58]. The findings on the increase in BSR with RS incorporation and N fertilization are in line with those of [59,60] under field conditions and Ali et al.’s [61] in vitro incubation study. They reported higher CO2 emission due to the additional contribution of microbial decomposition of root exudates in straw followed by surface application compared to in the no-residue treatment. Straw return promotes the metabolic activity of micro-organisms, the relevant enzyme activity, and microbial population, which enhanced the nutrient availability in the soil [13,22]. The results in the present study are consistent with those of Samuelson et al. [62], which indicate that N fertilization increased the BSR and MBC, but the effect on soil respiration was non-significant. Yang et al. [63] have also observed significantly increased MBC under fertilizer (NPK) compared with control, because of higher plant growth, root biomass, and microbial activity. The increase in labile C content, especially 9.2% in MBC, was higher in rhizosphere soil than bulk soil [64]. It may be due to the fact that crop root exudates in the rhizosphere increase the microbial growth and activity [65,66] and translocation or migration of microbes toward the root vicinity by mass flow due to the moisture gradient caused by transpiration [67]. POXC is a key indicator of soil quality, as it contains simple low-molecular-weight organic compounds having high turnover rates and is used to monitor rapid changes in SOC [68]. Basal soil respiration (BSR) is a bio-indicator of soil quality and closely associated with C availability. MBC acts as both a sink and source of nutrients in soil [69].
The increase in grain yield of by 10% with RS incorporation at 7.5 Mg ha−1 and 300% with application of N at 120 kg ha−1 compared to no-residue incorporation and no N may be ascribed to better soil physical, chemical, and biological properties, which increased soil moisture supply, nutrient availability, and root growth [70,71]. Kumari et al. [72] reported 21.7% higher grain yield under 100% crop residue incorporation in the RWS. It makes the edaphic conditions favourable not only for yield but also for nutrient uptake by increasing root growth, plant canopy, and yield [73,74].
Principal components (PCs) with high Eigenvalues are considered to represent the highest weighted variables within a specific PC with absolute highest factor loading values in soil properties [75,76]. The highly weighted variables were defined as the highest weighted variable within a specific PC with absolute highest factor loading value. In this study, high Eigenvalues or loading factors of TPC in PC1, BSR for PC2, and pH for PC3 (Table 3) are the influential variables and are ranked as potential indicators of soil quality under N fertilizer and RS incorporation application in the RWS. The TPC in PC1 improves the soil quality, as it acts as a source of energy for microorganisms and promotes biological activity in the soil, which binds soil particles and stabilizes the soil aggregates [77,78]. BSR in PC2 is influenced by management practices and provides an indication of recycling nutrients and energy and serves as a responsive indicator of change in organic matter levels and equilibrium [79,80,81]. The pH in PC3 regulates the availability of essential nutrients and microbial activity, which plays a significant role in the rhizosphere soil [82,83]. The right-side positioning of the data point pertaining to these variables in Figure 9 suggested that the management practices such as N120 and RS10 are sustainable in the RWS. These results corroborate the findings of Herrera [84] for soil labile C pools such as WSOC and MBC under volcanic soils, and [26] to separate ZT + R from CT-R in wheat under the RWS in the north-western region of India.

5. Conclusions

After 7 years of the RWS, the increasing rate of RS incorporation (5 to 10 Mg ha−1) had significant positive effects on labile C pools compared with no straw incorporation in the rhizosphere soil at both wheat growth stages. Irrespective of bulk and rhizosphere soils, and treatments, labile C pools were 15% higher at the MT than FL stage of wheat. Among the labile C pools, TPC, BSR, and pH were the most sensitive parameters to differentiate treatments for evaluating soil quality under an intensive RWS. Rice straw incorporation will be helpful to minimize the ill effects of residue burning, which has significant impacts on the soil and environment.

Author Contributions

Conceptualization, S.S. (Sandeep Sharma); methodology, S.S. (Sandeep Sharma) and S.S. (Swarnjeet Singh); formal analysis, S.S. (Sandeep Sharma), S.S. (Swarnjeet Singh) and M.S.; investigation, S.S. (Sandeep Sharma), S.S. (Swarnjeet Singh), A.S. and M.H.S.; writing—original draft preparation, S.S. (Swarnjeet Singh), M.S. and M.H.S.; writing—review and editing, S.S. (Sandeep Sharma), M.S., H.M.A. and D.B.; funding acquisition, H.M.A. and M.H.S. All authors have read and agreed to the published version of the manuscript.

Funding

The research was supported by the Researchers Supporting Project number (RSP-2021/123), King Saud University, Riyadh, Saudi Arabia.

Institutional Review Board Statement

Not applicable.

Informed Consent Statement

Not applicable.

Data Availability Statement

Not applicable.

Acknowledgments

The authors would like to extend their sincere appreciation to the Researchers Supporting Project number (RSP-2021/123), King Saud University, Riyadh, Saudi Arabia. Thanks are due to the Head of the Department of Soil Science, Punjab Agricultural University, for providing necessary laboratory and field facilities.

Conflicts of Interest

The authors declare no competing interests.

References

  1. Singh, S.S.; Singh, A.K.; Sundaram, P.K. Agro-technological options for upscaling agricultural productivity in eastern Indo-Gangetic plains under impending climate change situations: A Review. J. Agrisearch 2014, 1, 55–65. [Google Scholar]
  2. Dhillon, B.S.; Kataria, P.; Dhillon, P.K. National food security vis-a-vis sustainability of agriculture in high crop productivity regions. Curr. Sci. 2010, 98, 33–36. [Google Scholar]
  3. Ladha, J.K.; Fisher, K.S.; Hossain, M.; Hobbs, P.R.; Hardy, B. Improving the Productivity of Rice-Wheat Systems of the Indo-Gangetic Plains: A Synthesis of NARS-IRRI Partnership Research; IRRI Discussion, Paper No. 40; IRRI: Los Banos, Philippines, 2000. [Google Scholar]
  4. Humphreys, E.; Kukal, S.S.; Christen, E.W.; Hira, G.S.; Singh, B.; Yadav, S.; Sharma, R.K. Halt in the groundwater decline in north-west India: Which crop technologies will be winner. Adv. Agron. 2010, 109, 155–217. [Google Scholar]
  5. Dwivedi, B.S.; Singh, V.K.; Shukla, A.K.; Meena, M.C. Optimizing dry and wet tillage for rice on a Gangetic alluvial soil: Effect on soil characteristics, water use efficiency and productivity of the rice-wheat system. Eur. J. Agron. 2012, 43, 155–165. [Google Scholar] [CrossRef]
  6. Singh, Y.; Sidhu, M.; Humphreys, H.S.; Thind, E.; Jat, H.S.; Blackwell, M.L.; Singh, J.V. Nitrogen management for zero till wheat with surface retention of rice residues in north-west India. Field Crops Res. 2015, 184, 183–191. [Google Scholar] [CrossRef]
  7. Parihar, C.M.; Yadav, M.R.; Jat, S.L.; Singh, A.K.; Kumar, B.; Pradhan, S. Long term effect of conservation agriculture in maize rotations on total organic carbon, physical and biological properties of a sandy loam soil in north-western Indo-Gangetic Plains. Soil Till. Res. 2016, 16, 116–128. [Google Scholar] [CrossRef]
  8. NAAS. Innovative Viable Solution to Rice Straw Burning in Rice-Wheat Cropping System through Concurrent Use of Super Straw Management System-Fitted Combines and Turbo Happy Seeder; Policy Brief No. 2; National Academy of Agricultural Sciences: New Delhi, India, 2017; p. 16. [Google Scholar]
  9. Singh, Y.; Sidhu, H.S. Management of cereal crop residues for sustainable rice-wheat production system in the Indo-Gangetic plains of India. Proc. Indian Natl. Sci. Acad. 2014, 80, 95–114. [Google Scholar] [CrossRef]
  10. Zhang, Y.; Zhang, G.Q.; Tang, Z.H.; Chen, X.H.; Yu, Y.S. Burning straw, air pollution and respiratory infections in China. Am. J. Infect. Control 2014, 7, 816–817. [Google Scholar] [CrossRef]
  11. Sharma, S.; Vashisht, B.B.; Singh, P.; Singh, Y. Changes in soil aggregate-associated carbon, enzymatic activity and biological pools under conservation agriculture based practice in rice-wheat system. Biomass Convers. Biorefin. 2022. [Google Scholar] [CrossRef]
  12. Loveland, P.; Webb, J. Is there a critical level of organic matter in the agricultural soils of temperate regions: A review. Soil Till. Res. 2003, 70, 1–18. [Google Scholar] [CrossRef]
  13. Sharma, S.; Kaur, S.; Choudhary, O.P.; Singh, M. Tillage, green manure and residue retention improves aggregate-associated phosphorus fractions under rice-wheat cropping. Sci. Rep. 2022, 12, 7167. [Google Scholar] [CrossRef] [PubMed]
  14. Haynes, R.J. Labile organic matter fractions as central components of the quality of agricultural soils: An overview. Adv. Agron. 2005, 85, 221–268. [Google Scholar]
  15. Jin, K.; Sleutel, S.; Buchan, D.; De, N.S.; Cai, D.X.; Gabriels, D.; Jin, J.Y. Changes of soil enzyme activities under different tillage practices in the Chinese Loess Plateau. Soil Till. Res. 2009, 104, 115–120. [Google Scholar] [CrossRef]
  16. Chan, K.Y.; Bowman, A.; Oates, A. Oxidizable organic carbon fractions and soil quality in an oxicpaleustalf under different pasture leys. Soil Sci. 2001, 166, 61–67. [Google Scholar] [CrossRef]
  17. Mazumdar, S.P.; Kundu, D.K.; Saha, A.R.; Majumdar, B.; Saha, R.; Singh, A.K.; Barman, D.; Ghosh, D.; Dey, R.; Behera, M.S.; et al. Carbon and nutrient dynamics under long-term nutrient management in tropical rice-wheat-jute system. Arch. Agron. Soil Sci. 2018, 64, 1595–1607. [Google Scholar] [CrossRef]
  18. Singh, Y.; Singh, B.; Ladha, J.K.; Khind, C.S.; Khera, T.S.; Bueno, C.S. Effects of residue decomposition on productivity and soil fertility in rice–wheat rotation. Soil Sci. Soc. Am. J. 2004, 68, 854–864. [Google Scholar] [CrossRef]
  19. Singh, V.K.; Dwivedi, B.S.; Singh, S.K.; Majumdar, K.; Jat, M.L.; Mishra, R.P.; Rani, M. Soil physical properties, yield trends and economics after five years of conservation agriculture based rice-maize system in north-western India. Soil Till. Res. 2016, 155, 133–148. [Google Scholar] [CrossRef]
  20. Jat, H.S.; Datta, A.; Sharma, P.C.; Kumar, V.; Yadav, A.K.; Choudhary, M.; Choudhary, V.; Gathala, M.K.; Sharma, D.K.; Jat, M.L.; et al. Assessing soil properties and nutrient availability under conservation agriculture practices in a reclaimed sodic soil in cereal-based systems of North-West India. Arc. Agron. Soil Sci. 2017, 64, 531–545. [Google Scholar] [CrossRef] [Green Version]
  21. Parihar, C.M.; Jat, S.L.; Singh, A.K.; Datta, A.; Parihar, M.D.; Varghese, E.; Bandyopadhyoy, K.K.; Nayak, H.S.; Kurif, B.R.; Jat, M.L. Changes in carbon pools and biological activities of a sandy loam soil under medium-term conservation agriculture and diversified cropping systems. Eur. J. Soil Sci. 2018, 69, 902–912. [Google Scholar] [CrossRef]
  22. Sharma, S.; Thind, H.S.; Singh, Y.; Sidhu, H.S.; Jat, M.L.; Parihar, C.M. Effects of crop residue retention on soil carbon pools after 6 years of rice–wheat cropping system. Environ. Earth Sci. 2019, 78, 296–310. [Google Scholar] [CrossRef]
  23. Chen, H.Q.; Hou, R.X.; Gong, Y.S.; Li, H.W.; Fan, M.S.; Kuzyakov, Y. Effects of 11 years of conservation tillage on soil organic matter fractions in wheat monoculture in Loess Plateau of China. Soil Till. Res. 2009, 106, 85–94. [Google Scholar] [CrossRef]
  24. Luo, G.; Ling, N.; Nannipieri, P.; Chen, H.; Raza, W.; Wang, M.; Guo, S.; Shen, Q. Long-term fertilization regimes affect the composition of the alkaline phosphomonoesterase encoding microbial community of a vertisol and its derivative soil fractions. Biol. Fertil. Soils 2017, 53, 375–388. [Google Scholar] [CrossRef]
  25. Wei, T.; Zhang, P.; Wang, K.; Ding, R.; Yang, B.; Nie, J.; Jia, Z.; Han, Q. Effects of wheat straw incorporation on the availability of soil nutrients and enzyme activities in semiarid areas. PLoS ONE 2015, 10, e0120994. [Google Scholar] [CrossRef] [Green Version]
  26. Bera, T.; Sharma, S.; Thind, H.S.; Sidhu, H.S.; Jat, M.L. Soil biochemical changes at different wheat growth stages in response to conservation agriculture practices in a rice-wheat system of north-western India. Soil Res. 2017, 56, 91–104. [Google Scholar] [CrossRef]
  27. Saikia, R.; Sharma, S.; Thind, H.S.; Sidhu, H.S.; Singh, Y. Temporal changes in biochemical indicators of soil quality in response to tillage, crop residue and green manure management in a rice-wheat system. Ecol. Ind. 2019, 103, 383–394. [Google Scholar] [CrossRef]
  28. Saggar, S.; Hedley, C.B.; Salt, G.J. Soil microbial biomass, metabolic quotient, and carbon and nitrogen mineralisation in 25-year-old Pinusradiata agroforestry regimes. Aust. J. Soil Res. 2019, 9, 491–504. [Google Scholar]
  29. Walkley, A.; Black, I.A. An examination of Degtjareff method for determining soil organic matter and a proposed modification of the chromic acid titration method. Soil Sci. 1934, 37, 29–37. [Google Scholar] [CrossRef]
  30. Olsen, S.R.; Cole, C.V.; Watanabe, F.S.; Dean, A.L. Estimation of Available Phosphorus in Soils by Extraction on with Sodium Bicarbonate; US Department of Agriculture: Washington, DC, USA, 1954; Volume 939, p. 19. [Google Scholar]
  31. Knudsen, D.; Peterson, G.A.; Pratt, P.F. Lithium, sodium and potassium. In Methods of Soil Analysis Part 2. Chemical and Microbiological Properties; Page, A.L., Miller, R.H., Keeney, D.R., Eds.; American Society of Agronomy; Soil Science Society of America: Madison, WI, USA, 1982; pp. 225–246. [Google Scholar]
  32. Singh, S.; Sharma, S. Temporal changes in rhizosphere biological soil quality indicators of wheat in response to nitrogen and straw incorporation. Trop. Ecol. 2020, 61, 328–344. [Google Scholar] [CrossRef]
  33. Zhang, S.R.; Wen, J.; Li, T.; Xu, X.X.; Deng, L.J.; Gong, G.S.; Hu, C. Soil carbon fractions of restored lands in Liusha River Valley Sichuan. Ecol. Eng. 2012, 40, 27–36. [Google Scholar] [CrossRef]
  34. Blair, G.J.; Lefroy, R.D.B.; Lise, L. 1995. Soil carbon fractions based on their degree of oxidation and the development of a carbon management index for agricultural systems. Aust. J. Agric. Res. 1995, 46, 1459–1466. [Google Scholar] [CrossRef]
  35. Safarik, I.; Santruckova, H. Direct determination of total soil carbohydrate content. Plant Soil. 1992, 143, 109–114. [Google Scholar] [CrossRef]
  36. Lowe, L.E. Total and labile polysaccharide analysis of soils. In Soil Sampling and Methods of Analysis; Carter, M.R., Ed.; Canadian Society of Soil Science: Boca Raton, FL, USA, 1993; pp. 373–376. [Google Scholar]
  37. Anderson, J.P.E. Soil respiration. In Methods of Soil Analysis, Chemical and Microbiological Properties, Agronomy Monograph No. 9; Miller, R.H., Keeney, D.R., Eds.; ASA-SSSA Publisher: Madison, WI, USA, 1982; pp. 831–871. [Google Scholar]
  38. Vance, E.D.; Brookes, P.C.; Jenkinson, D.S. An extraction method for measuring soil microbial biomass carbon. Soil Biol. Biochem. 1987, 19, 703–707. [Google Scholar] [CrossRef]
  39. Westerman, R.L. Soil Testing and Plant Analysis, 3rd ed.; American Society of Agronomy; Soil Science Society of America: Madison, WI, USA, 1990; p. 20. [Google Scholar]
  40. Nelson, D.W.; Sommers, L.E. Total carbon, organic carbon, and organic matter: Laboratory methods. In Methods of Soil Analysis, Part 3 Chemical Methods; Barteles, J.M., Bigham, J.M., Eds.; American Society of Agronomy; Soil Science Society of America: Madison, WI, USA, 1996; pp. 961–1010. [Google Scholar]
  41. International Rice Research Institute (IRRI). IRRISTAT for Window (CD-ROM), version 4.02b; IRRI: Los Banos, Philippines, 2000.
  42. Wold, S.; Esbensen, K.; Geladi, P. Principal component analysis. Chemometr. Intell. Lab. Syst. 1987, 2, 37–52. [Google Scholar] [CrossRef]
  43. Zhu, B.; Gutknecht, J.L.M.; Herman, D.J.; Keck, D.C.; Firestone, M.K.; Cheng, W. Rhizosphere priming effects on soil carbon and nitrogen mineralization. Soil Biol. Biochem. 2014, 76, 183–192. [Google Scholar] [CrossRef] [Green Version]
  44. Lu, G.; Sakagami, K.; Tanaka, H.; Hamada, R. Role of soil organic matter in stabilization of water-stable aggregates in soils under different types of land use. Soil Sci. Plant Nutr. 1998, 44, 147–155. [Google Scholar] [CrossRef]
  45. Liu, C.; Wang, K.; Meng, S.; Zheng, X.; Zhou, Z.; Han, S.; Chen, D.; Yang, Z. Effects of irrigation, fertilization and crop straw management on nitrous oxide and nitric oxide emissions from a wheat–maize rotation field in northern China. Agric. Ecosys. Environ. 2011, 140, 226–233. [Google Scholar] [CrossRef]
  46. Soon, Y.K.; Lupwayi, N.Z. Straw management in a cold semi-arid region: Impact on soil quality and crop productivity. Field Crops Res. 2012, 139, 39–46. [Google Scholar] [CrossRef]
  47. Li, S.; Zhang, S.; Pu, Y.; Li, T.; Xu, X.; Jia, Y.; Deng, O.; Gong, G. Dynamics of soil labile organic carbon fractions and C-cycle enzyme activities under straw mulch in Chengdu Plain. Soil Till. Res. 2016, 155, 289–297. [Google Scholar] [CrossRef]
  48. Soltani, S.; Khoshgoftarmanesh, A.H.; Afyuni, M.; Shrivani, M.; Schulin, R. The effect of preceding crop on wheat grain zinc concentration and its relationship to total amino acids and dissolved organic carbon in rhizosphere soil solution. Biol. Fertil. Soils 2014, 50, 239–247. [Google Scholar] [CrossRef]
  49. Madejon, E.; Moreno, F.; Murillo, J.M.; Pelegrin, F. Soil biochemical response to long term conservation tillage under semi arid Mediterranean conditions. Soil Till. Res. 2007, 94, 346–352. [Google Scholar] [CrossRef]
  50. Chantigny, M.H. Dissolved and water-extractable organic matter in soils: A review on the influence of land use and management practices. Geoderma 2003, 113, 357–380. [Google Scholar] [CrossRef]
  51. Conteh, A.; Blair, G.T.; Lefroy, R.D.B.; Whitbread, A.M. Labile organic carbon determined by permanganate oxidation and its relationships to other measurements of soil organic carbon. Hum. Subst. Environ. J. 1999, 1, 3–15. [Google Scholar]
  52. Kaur, T.; Brar, B.S. Organic matter, microbial biomass and enzyme activity of soils under maize-wheat cropping system. J. Soils Crops 2008, 18, 24–30. [Google Scholar]
  53. Rudrappa, L.; Purakayastha, T.J.; Singh, D.B.S. Long-term manuring and fertilization effects on soil organic carbon pools in a Typic Haplustept of semi-arid sub-tropical India. Soil Till. Res. 2006, 88, 180–192. [Google Scholar] [CrossRef]
  54. Gong, W.; Yan, X.; Wang, J.; Hu, T.; Gong, Y. Long-term manure and fertilizer effects on soil organic matter fractions and microbes under a wheat-maize cropping system in northern China. Geoderma 2009, 149, 318–324. [Google Scholar] [CrossRef]
  55. Kumar, K.; Shukla, U.N.; Kumar, D.; Pant, A.K.; Prasad, S.K. Bio-Fertilizers for Organic Agriculture. Pop. Kheti 2013, 1, 91–96. [Google Scholar]
  56. Cheshire, M.V. Origin and stability of soil polysaccharides. J. Soil Sci. 1977, 28, 1–10. [Google Scholar] [CrossRef]
  57. Oades, J.M. Soil organic matter and structural stability: Mechanisms and implications for management. Plant Soil 1984, 76, 319–337. [Google Scholar] [CrossRef]
  58. Baldock, J.A.; Kay, B.D.; Schnitzer, M. Influence of cropping treatments on the monosaccharide content of the hydrolysates of a soil and its aggregate fractions. Can. J. Soil Sci. 1987, 67, 489–499. [Google Scholar] [CrossRef]
  59. Nannipieri, P.; Ascher, J.; Ceccherini, M.T.; Landi, L.; Pietramellara, G.; Renella, G.; Valori, F. Microbial diversity and microbial activity in the rhizosphere. Cienc. Suelo 2007, 25, 89–97. [Google Scholar]
  60. Liu, C.; Lu, M.; Cui, J.; Li, B.; Fang, C. Effects of straw carbon input on carbon dynamics in agricultural soils: A meta-analysis. Glob. Change Biol. 2014, 20, 1366–1381. [Google Scholar] [CrossRef] [PubMed]
  61. Ali, I.; Nabi, G. Soil carbon and nitrogen mineralization dynamics following incorporation and surface application of rice and wheat residues. Soil Environ. 2016, 35, 207–215. [Google Scholar]
  62. Samuelson, L.; Mathew, R.; Stokes, T.; Feng, Y.; Aubrey, D.; Coleman, M. Soil and microbial respiration in a loblolly pine plantation in response to seven years of irrigation and fertilization. For. Ecol. Manag. 2009, 258, 2431–2438. [Google Scholar] [CrossRef]
  63. Bhattacharyya, R.; Kundu, S.; Srivastva, A.K.; Gupta, H.S.; Prakash, V.; Bhatt, J.C. Long term fertilization effects on soil organic carbon pools in a sandy loam soil of the Indian Himalayas. Plant Soil 2011, 341, 109–124. [Google Scholar] [CrossRef]
  64. Yang, Q.; Wang, X.; Shen, Y. Comparison of soil microbial community catabolic diversity between rhizosphere and bulk soil induced by tillage or residue retention. J. Soil Sci. Plant Nutr. 2013, 13, 187–199. [Google Scholar] [CrossRef] [Green Version]
  65. Lavelle, P. Faunal Activities and Soil Processes: Adaptive Strategies That Determine Ecosystem Function. In Advances in Ecological Research; Begon, M., Fitter, A.H., Eds.; Academic Press: Cambridge, MA, USA, 1997; pp. 93–132. [Google Scholar]
  66. Walker, T.S.; Bais, H.P.; Grotewold, E.; Vivanco, J.M. Root exudation and rhizosphere biology. Plant Physiol. 2003, 132, 44–51. [Google Scholar] [CrossRef] [PubMed] [Green Version]
  67. Bashan, Y.; Holguin, G. Azospirillum-plant relationships: Environmental and physiological advances. Can. J. Microbiol. 1997, 43, 103–121. [Google Scholar] [CrossRef] [Green Version]
  68. Saggar, S.; Yeates, G.W.; Shephard, T.G. Cultivation effects on soil biological properties, microfauna and organic matter dynamics in Eutric Gleysol and Gleyic Luvisol soils in New Zealand. Soil Till. Res. 2001, 58, 55–68. [Google Scholar] [CrossRef]
  69. Gregorich, E.G.; Liang, B.C.; Drury, C.F.; Mackenzie, A.F.; McGill, W.B. Elucidation of the source and turnover of water soluble and microbial biomass carbon in agricultural soils. Soil Biol. Biochem. 2000, 32, 581–587. [Google Scholar] [CrossRef]
  70. Witt, C.; Cassman, K.G.; Olk, D.C. Crop rotation and residue management effects on carbon sequestration, nitrogen cycling and productivity of irrigated rice systems. Plant Soil 2000, 225, 263–278. [Google Scholar] [CrossRef]
  71. Wang, G.H.; Dobermann, A.; Witt, C.; Sun, Q.Z.; Fu, R.X. Performance of site-specific nutrient management for irrigated rice in southeast China. Agron. J. 2001, 93, 869–878. [Google Scholar] [CrossRef]
  72. Kumari, K.; Prasad, J.; Solanki, I.S.; Chaudhary, R. Long-term effect of crop residues incorporation on yield and soil physical properties under rice-wheat cropping system in calcareous soil. J. Soil Sci. Plant Nutr. 2018, 18, 27–40. [Google Scholar] [CrossRef] [Green Version]
  73. Singh, B.; Eberbach, P.L.; Humphreys, E.; Kukal, S.S. The effect of rice straw mulch on evapo-transpiration, transpiration and soil evaporation of irrigated wheat in Punjab, India. Agric. Water Manag. 2011, 98, 1847–1855. [Google Scholar] [CrossRef]
  74. Ram, A. Management of Sulphur Deficiency for Improving Productivity and Soil Health in Aerobic Rice (Oryza sativa L.)–Wheat (Triticum aestivum L.) Cropping System. Ph.D. Dissertation, Indian Council of Agricultural Research, New Delhi, India, 2013. [Google Scholar]
  75. Zhang, G.; Bai, J.; Xi, M.; Zhao, Q.; Lu, Q.; Jia, J. Soil quality assessment of coastal wetlands in the yellow river delta of China based on the minimum data set. Ecol. Ind. 2016, 66, 458–466. [Google Scholar] [CrossRef] [Green Version]
  76. Biswas, S.; Hazra, G.C.; Purakayastha, T.J.; Saha, N.; Mitran, T.; Roy, S.S.; Basak, N.; Mandal, B. Establishment of critical limits of indicators and indices of soil quality in rice-rice cropping systems under different soil orders. Geoderma 2017, 292, 34–48. [Google Scholar] [CrossRef]
  77. Amezketa, E. Soil aggregate stability: A review. J. Sustain. Agric. 1999, 14, 83–151. [Google Scholar] [CrossRef]
  78. Baldrian, P.; Trogl, J.; Frouz, J.; Snajdr, J.; Valaskova, V.; Erhautova, V. Enzyme activities and microbial biomass in topsoil layer during spontaneous succession in spoil heaps after brown coal mining. Soil Biol. Biochem. 2008, 40, 2107–2115. [Google Scholar] [CrossRef]
  79. Gregorich, E.G.; Carter, M.R.; Angers, D.A.; Monreal, C.M.; Ellert, B.H. Towards a minimum data set to assess soil organic matter quality in agricultural soils. Can. J. Soil Sci. 1994, 74, 4. [Google Scholar] [CrossRef] [Green Version]
  80. Dalal, R.C.; Meyer, R.J. Long-term trends in fertility of soils under continuous cultivation and cereal cropping in Southern Queensland. VII. Dynamics of nitrogen mineralization potentials and microbial biomass. Aust. J. Soil Res. 1987, 25, 461–472. [Google Scholar] [CrossRef]
  81. Smith, J.L.; Paul, E.A. The significance of soil microbial biomass estimations. In Soil Biochemistry; Bollag, G.M., Stotzky, G., Eds.; Marcel Dekker: New York, NY, USA, 1990; Volume 6, pp. 357–396. [Google Scholar]
  82. Ghoshal, S.K. Studies on Biological Attributes of Soil Quality for a Few Long-Term Fertility Experiments with Rice Base Cropping Systems. Ph.D. Thesis, Bidhan Cahndra Krishi Viswavidyalaya, Mohanpur, India, 2014. [Google Scholar]
  83. Shahid, M.; Nayak, A.K.; Shukla, A.K.; Tripathi, R.; Kumar, A.; Mohanty, S.; Bhattacharyya, P.; Raja, R.; Panda, B.B. Long-term effects of fertilizer and manure applications on soil quality and yields in a sub-humid tropical rice-rice system. Soil Use Manag. 2013, 29, 322–332. [Google Scholar] [CrossRef]
  84. Herrera, C.M.A.; Mora, J.L.; Arbelo, C.D.; Rodríguez-Rodríguez, A. Interannual variations of soil organic carbon fractions in unmanaged volcanic soils (Canary Islands, Spain). Ecol. Evol. 2012, 2, 2374–2386. [Google Scholar] [CrossRef] [PubMed]
Figure 1. Water-soluble carbon (mg kg−1) in bulk and rhizosphere soils as influenced by nitrogen application and rice straw incorporation at maximum tillering and flowering stages of wheat. Vertical bars are the standard errors of the mean (p < 0.05). Columns with same letter are statistically at par (p < 0.05). (a) Effect of nitrogen application. (b) Effect of rice straw incorporation.
Agronomy 12 02774 g001
Figure 2. Dissolved organic carbon (mg kg−1) in bulk and rhizosphere soils as influenced by nitrogen application and rice straw incorporation at maximum tillering and flowering stages of wheat. Vertical bars are the standard errors of the mean (p < 0.05). Columns with same letter are statistically at par (p < 0.05). (a) Effect of nitrogen application. (b) Effect of rice straw incorporation.
Agronomy 12 02774 g002
Figure 3. Dichromate oxidized carbon (%) in bulk and rhizosphere soils as influenced by nitrogen application and rice straw incorporation at maximum tillering and flowering stages of wheat. Vertical bars are the standard errors of the mean (p < 0.05). Columns with same letter are statistically at par (p < 0.05). (a) Effect of nitrogen application. (b) Effect of rice straw incorporation.
Agronomy 12 02774 g003
Figure 4. Permanganate oxidized carbon (mg kg−1 soil) in bulk and rhizosphere soils as influenced by nitrogen application and rice straw incorporation at maximum tillering and flowering stages of wheat. Vertical bars are the standard errors of the mean (p < 0.05). Columns with same letter are statistically at par (p < 0.05). (a) Effect of nitrogen application. (b) Effect of rice straw incorporation.
Agronomy 12 02774 g004
Figure 5. Total carbohydrate carbon (g kg−1) in bulk and rhizosphere soils as influenced by nitrogen application and rice straw incorporation at maximum tillering and flowering stages of wheat. Vertical bars are the standard errors of the mean (p < 0.05). Columns with same letter are statistically at par (p < 0.05). (a) Effect of nitrogen application. (b) Effect of rice straw incorporation.
Agronomy 12 02774 g005
Figure 6. Total polysaccharide carbon (g kg−1) in bulk and rhizosphere soils as influenced by nitrogen application and rice straw incorporation at maximum tillering and flowering stages of wheat. Vertical bars are the standard errors of the mean (p < 0.05). Columns with same letter are statistically at par (p < 0.05). (a) Effect of nitrogen application. (b) Effect of rice straw incorporation.
Agronomy 12 02774 g006
Figure 7. Basal respiration (µg CO2 g−1 soil hr−1) in bulk and rhizosphere soils as influenced by nitrogen application and rice straw incorporation at maximum tillering and flowering stages of wheat. Vertical bars are the standard errors of the mean (p < 0.05). Columns with same letter are statistically at par (p < 0.05). (a) Effect of nitrogen application. (b) Effect of rice straw incorporation.
Agronomy 12 02774 g007
Figure 8. Microbial biomass carbon (µg g−1 soil) in bulk and rhizosphere soils as influenced by nitrogen application and rice straw incorporation at maximum tillering and flowering stages of wheat. Columns with same letter are statistically at par (p < 0.05). (a) Effect of nitrogen application. (b) Effect of rice straw incorporation.
Agronomy 12 02774 g008
Figure 9. Principal component analysis of assayed variables in bulk and rhizosphere soils at both growth stages of wheat. WSOC—water soluble carbon, DOC—dissolved organic carbon, DOXC—dichromate oxidized carbon, POXC—permanganate oxidized carbon, total CHO—total carbohydrate carbon, TPC—total polysaccharide carbon, BSR—basal soil respiration, MBC—microbial biomass carbon, GY—grain yield, SY—straw yield, NU—nitrogen uptake, PU—phosphorus uptake, KU—potassium uptake, bulk—Bulk soil, rhizo—rhizosphere soil, MT—maximum tillering, FL—flowering, N—N application, RS—rice straw.
Agronomy 12 02774 g009
Figure 10. Average effect of rice and wheat treatments on soil quality index and the individual contribution of each of the key indicators. TPC—total polysaccharide carbon, BSR—basal soil respiration, pH—soil pH, bulk—bulk soil, rhizo—rhizosphere soil.
Agronomy 12 02774 g010
Figure 11. Contribution (%) of selected indicators to soil quality under N and rice straw incorporation treatments. TPC—total polysaccharide carbon, BSR—basal soil respiration, pH—soil pH, bulk—bulk soil, rhizo—rhizosphere soil.
Agronomy 12 02774 g011
Table 1. Methods used for analysis of carbon fractions.
Soil Biochemical PropertiesMethod UsedReference
Water-soluble carbon (WSOC)1:5 soil–water suspensions[33]
Dissolved organic carbon (DOC)1:5 soil–KCl suspensions[33]
Dichromate oxidized carbon (DOXC)Oxidized with 0.07 N K2Cr2O7 under 6 N sulphuric acid[16]
Permanganate oxidized carbon (POXC)33 mM KMnO4[34]
Total carbohydrate carbon (TCC)By phenol method without acid hydrolysis[35]
Total polysaccharide carbon (TPC)Polysaccharide carbon digested with 12 M H2SO4 and estimated by phenol sulphuric acid method[36]
Basal soil respiration (BSR)Alkali trap method[37]
Microbial biomass carbon (MBC)CHCl3 fumigation-extraction method[38]
Table 2. Effect of rice straw incorporation and N application on grain yield, straw yield, and nutrient (N, P, and K) uptake by wheat grown after 7th year of a rice–wheat system.
TreatmentGrain Yield (t ha−1)Straw Yield (t ha−1)Total Nutrient Uptake (kg ha−1)
NPK
Nitrogen levels (kg ha−1)
N01.64 c3.68 c23.1 c5.44 c51.4 c
N905.67 b6.03 b71.1 b17.91 b99.3 b
N1206.57 a7.99 a97.1 a22.35 a136.4 a
N1506.46 a8.00 a104.3 a22.55 a136.8 a
LSD (p = 0.05)0.540.5910.12.1210.4
Rice residue levels (Mg ha−1)
RS04.42 b5.71 b69.0 a15.35 c94.9 c
RS54.62 ab5.89 ab74.7 a16.99 a106.4 b
RS7.54.84 a6.07 a77.2 a17.96 a113.4 a
RS104.63 ab5.91 ab74.6 a17.95 a109.3 ab
LSD (p = 0.05)0.300.35NS1.416.8
The a, b, and c show the significance.
Table 3. Loading values and percent contribution of assayed variables in bulk and rhizosphere soils at two growth stages of wheat identified by the principal component analysis.
Soil VariablesPC1PC2 PC3
Loading VariablesContribution of Variables (%)Loading VariablesContribution of Variables (%)Loading VariablesContribution of Variables (%)
WSOC0.8047.07−0.5008.860.1441.27
DOC0.6224.23−0.2612.42−0.54218.08
DOXC0.8818.48−0.4115.97−0.0110.01
POXC0.7395.96−0.4788.100.2694.45
Total CHO0.9359.560.0520.09−0.0090.00
TPC0.9459.77−0.2983.150.0030.00
BSR0.7466.09−0.58512.10.1230.92
MBC0.8307.53−0.1400.70−0.0400.10
PH−0.3471.310.3514.370.79939.21
EC−0.5563.38−0.3895.37−0.1220.92
SOC0.5663.500.0830.240.61923.57
GY0.6925.240.61213.2−0.1321.07
SY0.7305.830.60813.1−0.1942.31
NU0.7416.000.54610.5−0.2223.03
PU0.8427.740.5189.50−0.0170.02
KU0.8738.320.2472.160.2865.03
Eigenvalue 9.15 2.82 1.63
Variability (%) 57.2 17.6 10.2
Cumulative (%) 57.2 74.8 84.9
WSOC—water-soluble carbon, DOC—dissolved organic carbon, DOXC—dichromate oxidized carbon, POXC—permanganate oxidized carbon, total CHO—total carbohydrate carbon, TPC—total polysaccharide carbon, BSR—basal soil respiration, MBC—microbial biomass carbon, GY—grain yield, SY—straw yield, NU—nitrogen uptake, PU—phosphorus uptake, KU—potassium uptake, bulk—bulk soil, rhizo—rhizosphere soil, MT—maximum tillering, FL—flowering, N—N application, RS—rice straw.
Table 4. Inter-correlations between highly weighted variables under different principal component analysis.
PC1 VariableTPCTCCDOXCMBC
TPC1
TCC0.854 **1
DOXC0.940 **0.815 **1
MBC0.805 **0.9490.775 **1
PC 2 variableBSRWSOCPOXC
BSR1
WSOC0.983 **1
POXC0.951 **0.975 **1
PC 3 variablepHSOC
pH1
SOC0.2711
** Indicates significance at the 0.01 level. Total CHO—total carbohydrate carbon, total PC—total polysaccharide carbon, DOXC—dichromate oxidized carbon, MBC—microbial biomass carbon, BSR—basal soil respiration, WSOC—water-soluble carbon, POXC—permanganate oxidized carbon, SOC—soil organic carbon.
Publisher’s Note: MDPI stays neutral with regard to jurisdictional claims in published maps and institutional affiliations.

