
Effects of Freezing–Thawing Processes on Net Nitrogen Mineralization in Salinized Farmland Soil
by
 , ,
, ,
Qiang Zhao
, 
Jingwei Wu
*,
Chenyao Guo
*,
Jifeng Zhang
,
Xin Wang
,
Yawen Liu
,
Hang Zhao
and
Rui Zhang
State Key Laboratory of Water Resources and Hydropower Engineering Science, Wuhan University, Wuhan 430072, China
*
Authors to whom correspondence should be addressed.
Agronomy 2022, 12(12), 2986; https://doi.org/10.3390/agronomy12122986
Submission received: 22 October 2022
/
Revised: 23 November 2022
/
Accepted: 24 November 2022
/
Published: 28 November 2022
(This article belongs to the Special Issue A Circular Economy: Chemical, Microbiological and Environmental Implications of Mineral and Organic Fertilizers Use in Soils)
Abstract
:Nitrogen is an indispensable and limiting element for plant and microbial growth. To investigate the combined effects of salinity and freezing–thawing (FT) processes on soil inorganic nitrogen (SIN) transformation in seasonally freezing salinized farmland, laboratory incubation experiments were conducted under five soil salt content (SSC) treatments (0.08%, 0.25%, 0.35%, 0.50%, and 0.70%), four FT temperature treatments (C (5 °C), FT (−5 + 5 °C), FT (−10 + 5 °C), and FT (−15 + 5 °C)), and two soil water content (SWC) treatments (40% and 80% of maximum water holding capacity (WHC)). Ammonium (NH4+-N) and nitrate (NO3−-N) nitrogen were monitored at the first, second, fifth, and eighth incubation days. The FT processes increased relative NH4+-N content by 13%, 39%, and 77% with the decreasing of freezing temperature from −5 °C to −15 °C compared with C (5 °C) treatments, respectively. FT (−5 + 5 °C) and FT (−15 + 5 °C) treatments decreased the relative NO3--N contents by 4% and 6% compared with C (5 °C) treatments, respectively. Under FT treatments, the increment of relative NH4+-N content was higher in low-SSC treatments and lower in high-SSC treatments. The relationship between relative NO3–-N content and SSC gradually changed from a decrease in C (5 °C) to an increase in FT (−15+5 °C) treatments. SWC decreased NH4+-N content in high-SSC and low-freezing temperature treatments (SSC × freezing temperature < −2.5%· °C), while NH4+-N increased in low-SSC and unfrozen treatments. The variations of SIN/Rmin (nitrogen mineralization rate) were mostly affected by NO3–-N/Rnit (net nitrification rate) and NH4+-N/Ra (net ammonification rate) in C (5 °C) and FT treatments, respectively. Overall, the results suggested that enhanced salinity inhibited the effects of freezing temperature on NH4+-N and NO3−-N formation, respectively. The increase in SWC weakened the NH4+-N formation induced by the decrease in freezing temperature, and this function increased with the increase in salinity.
1. Introduction
Nitrogen is an indispensable and limiting element for plant and microbial growth [1]. In total, 107.74 million tonnes of nitrogen were applied for global agricultural use in 2019 [2], of which only 47% was converted into harvested products [3]. Unabsorbed nitrogen will be lost to the atmosphere and water in the form of nitrous oxide, ammonium nitrogen, or nitrate nitrogen, which may contribute to the greenhouse effect and water eutrophication [4,5,6]. In the inland areas of northern China, the climate is dry and rainfall is low, and there is a large area of salinized farmland due to poor irrigation management, insufficient drainage, improper cropping patterns and rotations, and chemical contamination [4,7,8]. These farmlands are affected by a continental monsoon climate, where winter and spring last for up to half a year, and the soil experiences an obvious seasonal freezing–thawing (FT) phenomenon [9,10]. Soil salinity and FT cycles (FTCs) are the main factors affecting soil nitrogen transformation in this region [11,12].
To date, a large number of studies have investigated the effect of soil salinity on nitrogen transformation [11,13,14]. Salinity mostly impacts N mineralization via osmotic potential and specific iron effects on microorganisms [4,15]. Higher salinity results in high osmotic potential, which may induce the drying and lysis of microbial cells [4,16]. The sensitivity of different nitrogen conversion processes to soil salinity varies significantly [17]. Salinity can increase N mineralization by enhancing the relative abundance and activity of the specific microbial functional groups responsible for N mineralization, or by inhibiting microbial N immobilization [1,14,15,18]. Nitrification will be promoted when the soil salinity is lower than 1.13 dS/m and will be inhibited when soil salinity is higher [19]. In addition, SO42− exhibits a stronger inhibitory effect on nitrification than Cl− [15]. Denitrification is easily inhibited by increased salinity because elevated salinity can induce sulfide toxicity to denitrifying bacteria, shift soil redox conditions, change the availability of C and N substrates, and reduce soil oxygen consumption [18,19,20,21,22]. Salinity is a dominant factor affecting the growth of ammonia-oxidizing microorganisms and community structure [23]. It increases the intensity and prolongs the duration of ammonia volatilization, inducing a higher amount of ammonium nitrogen loss [24,25,26].
The FT process is a key driver of soil nitrogen transformation in cold regions that affects soil mineral nitrogen content by changing soil physical structure, chemical properties, and biological properties [27,28,29]. Soil water freezes and forms ice crystals during the freezing process, which induces soil expansion and destroys the structure of soil aggregates [30]. The organic carbon and inorganic nitrogen that were originally wrapped and adsorbed are released to provide substrates, thereby increasing the subsequent mineralization [17,31]. In addition, the newly exposed mineral surfaces of organic–mineral complexes during this process can significantly affect the adsorption and desorption of nitrogen [29]. The freezing and thawing of soil water can also affect nitrification and denitrification by blocking soil porosity and changing the soil structure to create an alternating anaerobic and aerobic environment [32,33,34]. Extreme alternating changes in soil temperature and liquid water content in a short period of time (24 h) will greatly affect soil nitrogen transformation by changing the structure, quantity, diversity, and activity of soil microbial communities [33,35,36,37].
In seasonally freezing saline farmland, the soil FT process is accompanied by complex changes in moisture, salinity, and temperature [12,32,38]. For example, the temperature gradient in the freezing process and evaporation in the early thawing process will induce considerable salt accumulation in the surface layer, altering the salt distribution in the soil profile [39,40]. The presence of salt will influence the liquid water and ice crystal content in the soil during the freezing process, thus altering the soil structure and air permeability [41,42,43]. These changes will directly or indirectly affect the soil microbial community, quantity, diversity, and activity, thereby affecting the nitrogen transformation [37,44,45]. However, most of the existing studies only consider the effect of a single factor (salinity or FT) on soil nitrogen transformation, and few investigations of their interactive effects on nitrogen transformation have been performed.
Under ongoing global warming and given the increasing scarcity of water resources [46,47,48,49], salinized farmlands are facing more challenges, including the decreasing frequency of FTCs during winter and spring [49], water shortages for irrigation and leaching [5,50], and an increased risk of soil salinization [51,52]. The nitrogen cycle in these areas will become more complex, and the management of water and fertilizer will become more challenging. Therefore, in this study, a laboratory experiment was conducted to investigate the combined effects of salinity and FT processes on soil inorganic nitrogen transformation in seasonal freezing salinized farmland, and explore the influence mechanisms. The findings of this study have important theoretical and practical significance for accurately describing the nitrogen cycle in seasonal FT saline farmland systems, and provide a basis for improving water and fertilizer management in this region.
2. Materials and Methods
2.1. Study Site and Soil Sampling
The sampling site was located at the Yonglian experimental station in the Hetao Irrigation District of the Inner Mongolia Autonomous Region, China (108°37′ E, 40°15′ N). This area has a mid-temperate continental desert monsoon climate and has an annual average precipitation of 170.0 mm, an annual average temperature of 6.1 °C, and a frost-free period of 117–136 days.
Topsoil (0−10 cm depth) samples were randomly collected using a 10 cm auger in a corn field with low soil salinity (soil salt content (SSC) = 0.08%) in July 2021. After removing stones, plant debris, and large roots, each soil sample was air-dried and well-mixed in preparation for the determination of the soil properties and incubation experiments. The soil physicochemical properties are listed in Table 1.
2.2. Experimental Design
The experimental flow chart is shown in Figure 1. A completely random block design was conducted in the current study, with three factors: four FT temperature treatments (freezing for 12 h and thawing for 12 h: +5 °C + 5 °C, −5 + 5 °C, −10 + 5 °C, and −15 + 5 °C), five levels of SSC (0.08%, 0.25%, 0.35%, 0.50%, and 0.70%), and two soil water content (SWC) treatments (40% and 80% of water holding capacity (WHC)).
Soil samples were prepared by mixing air-dried soil, mixed salt solution, CaCl2 solution, and deionized water in a certain proportion. The mixed salt solution was compounded by adding Na2SO4, MgCl2, NaHCO3, NaCl, and KCl to deionized water. The mass ratio of ions added to soil was determined by the local salinity of the soil, which was K+: Na+: Ca+: Mg+: Cl−: HCO3−: SO42− = 2.49%: 22.12%: 4.67%: 3.37%: 21.37%: 5.31%: 40.67%. After reaching the preset water and salinity contents, all soil samples were packed into a quartz glass column (inner diameter: 23 mm; height: 20 mm) with a soil bulk density of 1.4 g/cm3 and a dry soil mass of 10 g. These glass columns were sealed with plastic film, and six holes were pinned at the top side for ventilation, and then transferred into the dark incubator for pre-incubation for 20 days at 20 °C and 60% relative humidity (RH). After pre-incubation, soil samples were divided into two portions. One portion was incubated in a temperature-controlled refrigerator at 5 °C as a control treatment (C (5 °C)). The remaining soils were incubated in a temperature-controlled FTC device at a freezing temperature of either −5 °C, −10 °C, or −15 °C for 12 h and then a thawing temperature of 5 °C for another 12 h; this was considered as one FTC. The incubation lasted for 8 days, and 120 soil samples were randomly collected before FTC incubation and after the first, second, fifth, and eighth FTC. In total, 600 samples (three replicates for each treatment in each of the five sampling periods) were incubated.
2.3. Sample Analysis
Soil total carbon (TC), total nitrogen (TN), particle gradation, electrical conductivity (EC), and pH were measured before FT incubation, and soil NH4+-N and NO3–-N were measured for each treatment. Soil TC and TN were measured on an elemental analyzer (Vario Ei, Elementar Co., Hamburg, Germany). Soil particle gradation was measured by a particle size analyzer (S3500, Microtrac Inc., Montgomeryville, Pa., USA). The EC and pH of soil extracts with a soil water ratio of 1:5 were determined by an EC probe and pH probe, respectively (DZS-706 Multi-parameter Analyzer, Hunan Lichen Instrument Technology, Changsha, China). Soil NH4+-N and NO3–-N were analyzed using a CleverChem 200 automatic continuous analyzer (DeChem-Tech. GmbH, Hamburg, Germany) after extraction with 2 mol/L KCl solution in a soil-to-KCl solution ratio of 1:5.
2.4. Net Mineralization Rates
The net soil nitrogen mineralization rate (Rmin) was calculated as the difference between the soil inorganic nitrogen (SIN) contents of two sampling periods divided by the incubation time. A similar formula was used to calculate the net N ammonification rate (Ra) and net nitrification rate (Rnit), as follows.
To evaluate the effects of salinity and moisture on inorganic nitrogen transformation during FT processes, the ratios of the time-weighted mean soil NH4+-N, NO3–-N, and SIN content of each salinity and moisture treatment to their initial values before FT incubation were calculated using
where N represented NH4+-N, NO3–-N, and SIN, and 0, 1, 2, 5, and 8 designated the sampling days.
2.5. Statistical Analysis
Multi-way analysis of variance (ANOVA) was used to identify the effects of the salinity, freezing temperature, moisture, and incubation period and their interactions on the inorganic nitrogen (SIN, NH4+-N, and NO3–-N) content and net transformation rate (Rmin, Ra, and Rnit). All statistical analyses were performed using SPSS 13.0 software (SPSS, Chicago, IL, USA).
3. Results
3.1. Soil Inorganic N Variation under Different SSC, FT Temperatures/Cycles, and SWC
As shown in Table 2, after 20 days of pre-incubation, NH4+-N, SIN, and the value of NH4+-N/SIN decreased from 8.30 mg/kg, 16.10 mg/kg, and 51.55, respectively, to 1.09–1.57 mg/kg, 9.70–13.84 mg/kg, and 9.70–13.84, respectively, while NO3−-N increased from 7.80 mg/kg to 8.51–12.61 mg/kg. The contents of TN, TC, and C/N remained essentially unchanged. The decrease in NH4+-N, the value of NH4+-N/SIN, and the increase in NO3−-N was higher in the treatments with higher soil moisture (80% WHC).
During FT incubation, the variation trends of NH4+-N, NO3−-N, and SIN were similar under both salinity and moisture treatments but changed significantly under FT temperature and cycling treatments (Figure 2 and Figure A1).
Soil NH4+-N contents during the first 2 days of incubation decreased in the C (5 °C) treatment, increased and then decreased under the FT (−5 + 5 °C) and FT (−10 + 5 °C) treatments, and increased under the FT (−15 + 5 °C) treatment. During the following incubation days, soil NH4+-N contents mostly increased in the C (5 °C) treatment, while they decreased during incubation days 3–5 under the FT treatments, and decreased, remained almost unchanged, and mostly increased during incubation days 6–8 under the FT (−5 + 5 °C), FT (−10 + 5 °C), and FT (−15 + 5 °C) treatments, respectively. Freezing temperature, salinity, the interactions between salinity and water, and the interactions between salinity and the FTCs had significant effects on the variation of soil NH4+-N content (Table 3).
Soil NO3−-N contents mostly increased during the first two incubation days under both the control and FT treatments, except for the FT (−15 + 5 °C) treatment, in which the soil NO3−-N contents mostly decreased during the first day. During the following incubation days, soil NO3−-N contents mostly decreased in the control treatment, decreased during days 3–5, and increased during days 6–8 under FT (−5 + 5 °C), while they increased under the FT (−10 + 5 °C) and FT (−15 + 5 °C) treatments. Salinity, as well as the interactions between salinity and moisture, salinity and FTCs, and among salinity, moisture, and FTCs, have significant effects on the variation of soil NO3−-N content.
There was no clear variation trend of SIN in C (5 °C), but it showed an obvious rise followed by a falling trend during the first 2 days under the FT (−5 + 5 °C) and FT (−10 + 5 °C) treatments, and a fall followed by a rise or a stable rise trend under the FT (−15 + 5 °C) treatment. During the following days, the SIN content increased stably under the FT (−10 + 5 °C) treatment, while it mostly decreased during incubation days 3–5 and increased during incubation days 6–8 under the FT (−5 + 5 °C) and FT (−15 + 5 °C) treatments. Soil salinity, moisture, FTCs, the interactions between salinity and moisture, salinity and FTCs, moisture and freezing cycles, and the interactions among salinity, moisture, and FTCs significantly affected the variation of SIN content.
3.2. Soil Inorganic N Content Affected by SCC, FT Temperature, and SWC
The ratios of the time-weighted mean soil NH4+-N, NO3−-N, and SIN content of each treatment to its initial value are shown in Figure 3. During the FT incubation, the increase in NH4+-N occurred when the freezing temperatures were −10 and −15 °C (Figure 3a,d). The relative contents of NH4+-N under FT (−5 + 5 °C), FT (−10 + 5 °C), and FT (−15 + 5 °C) treatments were 1.13, 1.39, and 1.77 times higher compared with that under C (5 °C) treatments. The relative contents of NH4+-N increased (Figure 3d) or increased and then decreased (Figure 3a) with the increase in salinity under the C (5 °C) treatments. In contrast, in the FT treatments, with the decrease in freezing temperature, the relative contents of NH4+-N gradually changed into a single downward trend with the increase in salinity. FT increased the NH4+-N increment under low salinity.
NO3−-N content increased under most of the control and FT soil treatments (Figure 3b,e). The relative NO3--N contents under FT (−5 + 5 °C) and FT (−15 + 5 °C) treatments were 0.96 and 0.94 times lower compared with under C (5 °C) treatments but were 1.01 times higher under FT (−10 + 5 °C) treatments. The relative contents of NO3--N decreased with the increase in salinity in the C (5 °C), FT (−5 + 5 °C), and FT (−10 + 5 °C) treatments and the decreasing trend weakened with the reduction of freezing temperature. Finally, the trend shifted to an increasing trend with increasing salinity under the FT (−15 + 5 °C) treatment. The FT (−5 + 5 °C) and FT (−10 + 5 °C) treatments reduced the NO3−-N content and the reduction was higher under the low salinity treatment.
The SIN content increased under the FT (−10 + 5 °C) and FT (−15 + 5 °C) treatments and mostly decreased under the C (5 °C) and FT (−5 + 5 °C) treatments (Figure 3c,f). The relative contents of SIN were significantly increased under the FT (−10 + 5 °C) × SWC (40% WHC), FT (−15 + 5 °C) × SWC (40% WHC), and FT (−10 + 5 °C) × SWC (80% WHC) treatments. Under the SWC (40% WHC) treatments, the relative contents of SIN increased and then decreased with the increase in salinity, except for in the FT (−10 + 5 °C) treatment, in which the relative content of SIN decreased with the increase in salinity. Under SWC (80% WHC) treatments, the relative contents of SIN decreased with the increase in salinity, except for in the C (5 °C) treatment, in which the relative content of SIN increased and then decreased with the increase in salinity.
The variation ranges and coefficients of variation of relative NH4+-N, NO3−-N, and SIN contents induced by freezing temperature, salinity, and moisture are shown in Figure 4. Variations in relative NH4+-N, NO3−-N, and SIN contents induced by freezing temperature reduced with the increase in salinity (Figure 4a,b,c), and the variation in relative NO3−-N and SIN induced by salinity were greatly reduced with decreased freezing temperature (Figure 4d,e,f). Moreover, an increase in soil moisture reduced the variations in NH4+-N induced by freezing temperature (Figure 4a) as well as the variations in NO3−-N and SIN induced by salinity (Figure 4e,f).
The differences in relative N content compared to its initial values between SWC (80% WHC) treatments and SWC (40% WHC) treatments are shown in Figure 4. The relative NH4+-N contents in SWC (80% WHC) treatments were lower than in SWC (40% WHC) treatments when they were exposed to a combination of low temperature and high salt (SSC × freezing temperature < −2.5% °C) (Figure 5). The relative NO3−-N and SIN contents were higher in SWC (80% WHC) treatments when SSC was lower than 0.35%.
3.3. Soil Ra, Rnit, and Rmin under Different SSC, FT Temperatures/Cycles, and SWC
The effects of temperature, salinity, moisture, FTCs, and their interactions on Ra were significant (p < 0.05) (Table 4), while Rnit was significantly affected by temperature and salinity, and Rmin was significantly affected by temperature (p < 0.05). The changing trends of Ra, Rnit, and Rmin were similar between moisture treatments but were obviously different between different FT temperatures and salinity treatments (Figure 6). Ra exhibited greater change during the first 2 days, but the variation differed in different treatments. The Ra decreased on both day 1 and 2 in C (5 °C), peaked (positive values) on day 1, and decreased to the minimum values (negative values) on day 2 in the FT (−5 + 5 °C) and FT (−10 + 5 °C) treatments, and increased on both days and peaked on day 2 in the FT (−15 + 5 °C) treatments. In addition, the Ra during days 5–8 gradually changed from negative values to positive values with the decrease in the freezing temperature. Rnit exhibited a similar increasing trend at both day 1 and day 2, except for that in the FT (−15 + 5 °C) treatment, which decreased on day 1 and increased on day 2. However, Rnit varied greatly during the later incubation days. Rnit decreased under the C (5 °C) treatment, increased under the FT (−10 + 5 °C) treatments, decreased and then increased under the FT (−5 + 5 °C) treatments, and exhibited the opposite trend under FT (−10 + 5 °C) treatments. The differences in Rnit between different incubation periods were less marked than the differences in Ra, and the absolute values of Rnit were obviously lower in high salinity and lower freezing temperature treatments. Rmin in the C (5 °C) treatments exhibited a similar changing trend to Rnit, while in the FT treatments, Rmin showed a similar changing trend to Ra.
4. Discussion
4.1. Effects of FT Temperatures/Cycles on N Mineralization in Salinized Soil
Soil NH4+-N variation and Ra were significantly affected by temperature (p < 0.05 and p < 0.001, respectively) (Table 3 and Table 4), and changed from decreasing trends and negative values in C (5 °C) to increasing trends and positive values in FT treatments during the first 1 or 2 incubation days, respectively. These findings were consistent with those of previous studies. NH4+-N was mostly transformed into NO3−-N in C (5 °C) during the first two incubation days. However, in FT treatments, ice crystal formation in the interstices of the soil and cytosol of microorganisms after immediate freezing could destroy soil aggregates and microbes, enhancing the release of previously unavailable NH4+-N from soil inorganic and organic colloids and cell lysis [31,34]. These increases are mostly reported to occur during the first FTC [53] because the residual microbes adapt gradually to the low-temperature conditions with increasing FTCs [54]. Lower freezing temperatures have a greater effect on soil aggregates and microbes, providing more mineralizable organic matter [27,55]. Therefore, the relative NH4+-N contents increased with the decreasing of freezing temperature (Figure 4).
The effects of FT temperature on NO3−-N transformation were significant but nonlinear. The average NO3−-N content increased by 11.47% after 2 days of incubation in the C (5 °C) treatment, while the increments were 5.06%, 4.20%, and −0.96% in the FT (−5 + 5 °C), FT (−10 + 5 °C), and FT (−15 + 5 °C) treatments, respectively (Figure 2 and Figure A1). This finding indicated that the formation of NO3−-N was lower than that of C (5 °C) at the beginning of incubation, and decreased with decreasing freezing temperature. The reason was that the formation of NO3−-N was mostly the combined result of nitrification and denitrification. It has been reported that denitrifying bacteria are more resistant to freezing temperatures than nitrifying bacteria, and the denitrifying function can recover quickly during soil thawing [56,57]. The freezing of soil creates an oxygen-deficient environment more easily because of the formation of ice crystals, which may last longer when freezing temperatures decrease due to the early freezing and slow melting of ice. Therefore, in this study the soil exhibited weaker nitrification and stronger denitrification processes when the freezing temperature decreased, leading to the consumption of NO3−-N during the FT events with colder freezing temperatures [27,55,58].
The variation trend of NO3−-N during the following incubation time changed from a decreasing trend in C (5 °C) to a decreasing and then increasing trend in FT (−5 + 5 °C) and a stable increasing trend in FT (−10 + 5 °C) and FT (−15 + 5 °C). However, the increasing trend was weakened in FT (−15 + 5 °C). The reason could be that after 2 days of incubation, the oxygen in the soil was consumed during the nitrification process in the C (5 °C) treatments, and the soil gradually became an anaerobic environment that was favored by denitrifying bacteria [59]. When the soil experienced a mild freezing temperature (−5 °C), although the nitrification bacteria were somewhat inhibited during the freezing process, they recovered quickly and exhibited even stronger activity during the thawing process because more available mineralizable organic matter was released by the destruction of soil aggregates and microbes as discussed above [60]. Therefore, the NO3−-N still increased during the first 2 days in FT (−5 + 5 °C). During days 2–5, the FT-induced nutrient supply was exhausted, the enhanced function vanished, and denitrification processes regained dominance. During later incubation time (days 6–8), nitrification bacteria gradually adapted to low temperatures, and the NO3−-N content showed a small increase during this time in FT (−5 + 5 °C). Rnit remained high throughout the incubation period when the soil experienced a moderate freezing temperature (−10 °C). This may have occurred because some bacteria that promote nitrification processes at subzero temperatures only display activity at certain temperatures [61]. For example, Juan et al. found that when soil was frozen at −9 °C, the bacterial community could recover rapidly using the labile nutrients produced from an increase in protein depolymerization during soil thawing; in addition, functional change after an FT with a moderate freezing temperature (−9 °C) exactly coincided with the adaptations necessary for the growth of psychrophilic bacteria at low temperatures [35]. Denitrification was significantly related to the bacterial community, which was affected by a severe freezing temperature (−15 °C) more greatly than a moderate freezing temperature, leading to higher denitrification with the freezing temperature of −15 °C [35]. Denitrification consumed NO3−-N, thereby resulting in a slightly increasing trend of NO3−-N in FT (−15 + 5 °C) during days 3–8. As a result, the FT process decreased NO3−-N content compared with C (5 °C) when the freezing temperatures were −5 °C and −15 °C and increased when the freezing temperature was −10 °C (Figure 4).
The variations of SIN and Rmin in C (5 °C) were similar to those of NO3−-N and Rnit, while they were more consistent with those of NH4+-N and Ra in the FT treatments. This finding indicated that Rmin was more affected by the change of NH4+-N during the FT process. Therefore, the SIN contents increased under FT (−10 + 5 °C) and FT (−15 + 5 °C) treatments because their NH4+-N contents were significantly enhanced by lower freezing temperatures, as discussed above (Figure 3a).
4.2. Effects of SSC and SWC on Nitrogen Mineralization during the FT Process
The relative NH4+-N content increased with the increase in SSC (Figure 3a,d) in the C (5 °C) treatments. This was because increasing salinity completely inhibited nitrification, but did not completely inhibit ammonification [62], and increased pore water salinity due to salt addition can desorb exchangeable ammonium [63,64]. In addition, dissimilatory nitrate reduction to ammonium (DNRS) increased with rising salinity [65], which may have also increased the NH4+-N content at high SSC. Under the FT treatments, NH4+-N increased with the decrease in freezing temperature, and the increment was higher in low-SSC treatments (Figure 3a,d and Figure 4). The relationship between the relative NH4+-N content and SSC changed from an increasing trend to a decreasing trend (Figure 3), and the variation of relative NH4+-N content induced by freezing temperature decreased with enhanced salt addition (Figure 4a). These findings indicated that enhanced salinity inhibited the positive effect of freezing temperature on NH4+-N formation. The reason was that enhanced SSC decreased the freezing temperature of soil water, decreasing the formation of ice crystals and resulting in more remaining liquid water [41,42,43]. These functions reduced the destruction of soil aggregates and the death of microbes [29,30,34], decreased the release of nutrients such as active organic carbon and inorganic nitrogen [66], which thereby weakened their stimulation of enzyme activity [29], and finally decreased the NH4+-N formation. Another reason for the inhibition was that the liquid water increment induced by the addition of salt to frozen soil allowed more nitrifying bacteria to survive, and the decreased ice crystal formation reduced the obstruction of soil voids, thus reducing the inhibition of freezing temperature on NO3−-N formation and the consumption of NO3−-N by denitrification [67,68]. As a result, the relative NO3−-N content gradually changed from decreasing with SSC to increasing with increased SSC (Figure 4b,e). The stronger nitrification in the high-SSC treatments consumed more NH4+-N, and further reduced the NH4+-N content.
The relative NH4+-N content of different salinity treatments increased linearly with the decrease in freezing temperature (Figure 7). The fitting formulas are depicted in Table 5. The slopes of these fitting lines were good indicators to evaluate the combined effect of SSC and freezing temperature on the relative NH4+-N content. Higher absolute values of the slope indicated a greater increase in NH4+-N with decreased freezing temperatures. As shown in Figure 7c, the absolute value of the slope decreased with increasing SSC, further demonstrating that enhanced salinity inhibited the effect of freezing temperature on NH4+-N formation, as discussed above. Moreover, the increase in SWC significantly decreased the absolute values of the slope, especially in the high-salinity treatments, indicating that the increase in SWC could weaken the NH4+-N formation induced by the decrease in freezing temperature, and this function increased with the increase in salinity (Figure 7c). These findings corresponded to the phenomenon observed in Figure 5, in which the increase in SWC enhanced the production of NH4+-N in the unfrozen and low-SSC FT treatments, and reduced the production of NH4+-N in the high-SSC combined with low-freezing temperature treatments (Figure 5a). The reason could be that the increase in soil moisture from 40% WHC (the maximum water holding capacity) to 80% WHC could relieve the water-limited activity and substrate transport of microbes [1,69] and enhance NH4+-N and NO3−-N contents in low-SSC treatments of C (5 °C). The increase in soil moisture also reduced the salt concentration of soil water but created a more severe anaerobic environment, which enhanced the activity of urease and denitrifying bacteria [4]. As a result, the NH4+-N content increased, while the NO3−-N contents remained unchanged or decreased in high-SSC treatments of C (5 °C) (Figure 5a,b). In the FT treatments, enhanced SWC could increase soil temperature by increasing the heat capacity of soil during the freezing period [70]. Higher initial SWC and SSC induced higher liquid water content in frozen soil [39]. Therefore, the harm caused by FT to soil aggregates and microbes was weakened, and the FT-induced NH4+-N was greatly reduced in treatments with high SSC and SWC at low freezing temperatures. In addition, soils with a higher SWC had higher freezing points and would be prone to freezing but resistant to thawing, thereby increasing the frost duration [70,71]. Longer frost duration provided more time for facultative bacteria to switch from aerobic to anaerobic activities, which was also enhanced by the lower salinity induced by higher liquid water content [33,72]. Consequently, the relative NO3−-N contents were mostly reduced in treatments with high SSC and low freezing temperatures when SWC increased (Figure 5b).
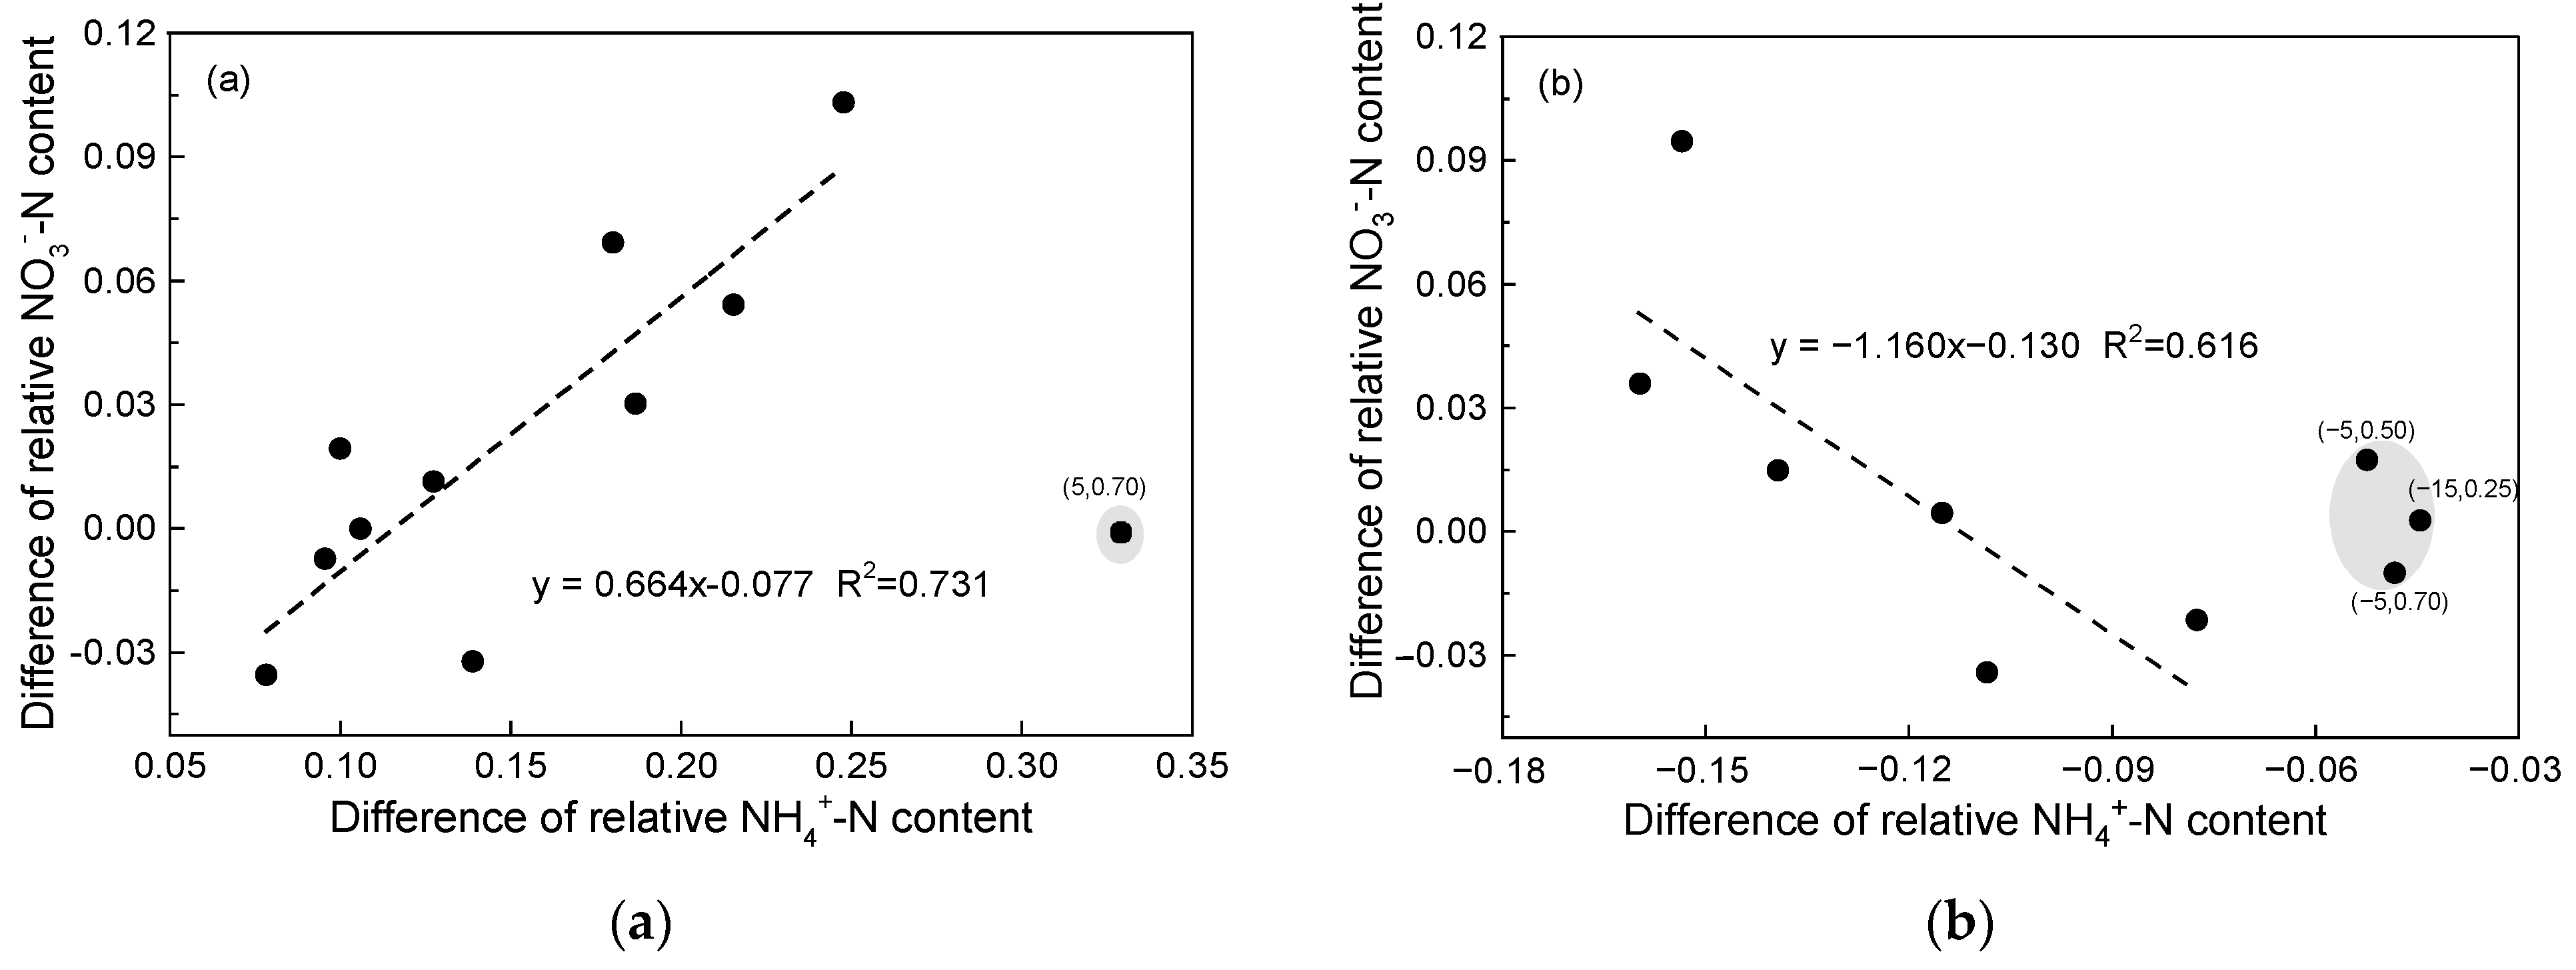
The relationships between the differences in relative NH4+-N and NO3−-N content caused by increased SWC in treatments with low SSC (L-SSC) × high freezing temperature (H-FTem) and high SSC (H-SSC) × low freezing temperature (L-FTem) are shown in Figure 8a,b, respectively. The difference in the relative NH4+-N content was positively correlated with that of NO3−-N, indicating that the increases in NH4+-N and NO3−-N in L-SSC × H-FTem treatments induced by SWC addition mostly occurred during the thawing period, as discussed above. The negative relationship between the changes of NH4+-N and NO3−-N in H-SSC×L-FTem may indicate that the dissimilatory nitrate reduction to ammonium (DNRA) occurred, as it has been reported to increase with the increase in SWC [73] and salinity [65].
The inconsistent effects of FT, SSC, and SWC on NH4+-N and NO3−-N led to different variations of SIN. For example, NH4+-N and NO3−-N contents were increased and decreased with SSC in C (5 °C), respectively, resulting in an increasing and then decreasing trend of SIN in C (5 °C). The SIN content was higher in FT (−15 + 5 °C) than in C (5 °C) when the SWC was 40% WHC, while the SIN content was lower in high-SSC treatments when SWC increased to 80% WHC because the combined effect of enhanced SWC and SSC reduced both NH4+-N and NO3−-N contents as shown in Figure 5 and discussed above.
5. Conclusions
Soil water content, temperature, and salinity have complex interactions on soil inorganic nitrogen transformation during FT processes, and these interactions have inconsistent effects on NH4+-N, NO3−-N, and SIN. The FT processes increased relative NH4+-N content by 13%, 39%, and 77% with the decreasing of freezing temperature from −5 °C to −15 °C compared with C (5 °C) treatments, respectively. FT (−5 + 5 °C) and FT (−15 + 5 °C) treatments decreased the relative NO3--N contents by 4% and 6% compared with C (5 °C) treatments, respectively. Under FT treatments, the increment of relative NH4+-N content was higher in low-SSC treatments and lower in high-SSC treatments, indicating that enhanced salinity inhibited the positive effects of freezing temperature on NH4+-N formation. The relationship between relative NO3−-N content and SSC gradually changed from a decrease in the C (5 °C) treatments to an increase in the FT (−15 + 5 °C) treatments, indicating that enhanced salinity inhibited the negative effects of freezing temperature on NO3−-N formation. In addition, the increase in SWC could weaken the trend of NH4+-N formation induced by the decrease in freezing temperature, and this function increased with the increase in salinity. The variations of SIN and Rmin in the C (5 °C) treatments were similar to those of NO3−-N and Rnit, while they were more consistent with those of NH4+-N and Ra in the FT treatments. These findings are valuable to guide the management of fertilizer and water in seasonal FT saline farmland. Further studies combining laboratory and field experiments that include more multi-gradient controlling factors are needed to improve the understanding of nitrogen transformation in seasonally freezing salinized farmland ecosystems.
Author Contributions
Conceptualization, Q.Z. and J.W.; methodology, Q.Z. and C.G.; investigation, Q.Z., X.W., H.Z., Y.L., R.Z. and J.Z.; resources, J.W.; data curation, Q.Z. and C.G.; writing—original draft preparation, Q.Z.; writing—review and editing, Q.Z. and C.G.; funding acquisition, J.W., Q.Z. All authors have read and agreed to the published version of the manuscript.
Funding
This research was jointly supported by the National Natural Science Foundation of China (Nos. 51790532 and 52109063), the Fundamental Research Funds for the Central Universities (No. 2042021kf0052), and the National Key Research and Development Program of China (No. 2021YFD1900804).
Data Availability Statement
The datasets generated during and/or analysed during the current study are not publicly available due to the confidential nature of the data but are available from the corresponding author upon reasonable request.
Conflicts of Interest
The authors declare no conflict of interest.
Appendix A
Figure A1.
Ratio of soil NH4+-N, NO3−-N, and soil inorganic nitrogen (SIN) contents to their initial values during the incubation period under different salinity, freezing–thawing temperatures/cycles, and soil moisture content.
Figure A1.
Ratio of soil NH4+-N, NO3−-N, and soil inorganic nitrogen (SIN) contents to their initial values during the incubation period under different salinity, freezing–thawing temperatures/cycles, and soil moisture content.

References
- Jia, J.; Bai, J.; Gao, H.; Wang, W.; Yin, S.; Wang, D.; Han, L. Effects of salinity and moisture on sediment net nitrogen mineralization in salt marshes of a Chinese estuary. Chemosphere 2019, 228, 174–182. [Google Scholar] [CrossRef] [PubMed]
- FAO. Available online: https://www.fao.org/faostat/en/#data/RFN (accessed on 15 July 2022).
- Lassaletta, L.; Billen, G.; Grizzetti, B.; Anglade, J.; Garnier, J. 50 year trends in nitrogen use efficiency of world cropping systems: The relationship between yield and nitrogen input to cropland. Environ. Res. Lett. 2014, 9, 105011. [Google Scholar] [CrossRef]
- Yan, N.; Marschner, P.; Cao, W.; Zuo, C.; Qin, W. Influence of salinity and water content on soil microorganisms. Int. Soil Water Conserv. Res. 2015, 3, 316–323. [Google Scholar] [CrossRef]
- Liu, J.; Bi, X.; Ma, M.; Jiang, L.; Du, L.; Li, S.; Sun, Q.; Zou, G.; Liu, H. Precipitation and irrigation dominate soil water leaching in cropland in Northern China. Agric. Water Manag. 2019, 211, 165–171. [Google Scholar] [CrossRef]
- Mark, D.L.; Andrew, C.V.; Edward, G.G.; Claudia, W. An improved laboratory method shows that freezing intensity increases N2O emissions. Can. J. Soil Sci. 2020, 100, 136–149. [Google Scholar]
- Yang, H.; Chen, Y.; Zhang, F. Evaluation of comprehensive improvement for mild and moderate soil salinization in arid zone. PLoS ONE 2019, 14, e224790. [Google Scholar] [CrossRef]
- Zhao, L.; Yang, Q.; Zhao, Q.; Wu, J. Assessing the Long-Term Evolution of Abandoned Salinized Farmland via Temporal Remote Sensing Data. Remote Sens. 2021, 13, 4057. [Google Scholar] [CrossRef]
- Geng, Q.; Wu, P.; Zhao, X.; Wang, Y. Comparison of classification methods for the divisions of wet/dry climate regions in Northwest China. Int. J. Climatol. 2014, 34, 2163–2174. [Google Scholar] [CrossRef]
- Li, N.; Li, Y.; Yao, N. Bias correction of the observed daily precipitation and re-division of climatic zones in China. Int. J. Climatol. 2018, 38, 3369–3387. [Google Scholar] [CrossRef]
- Liu, J.; Baulch, H.M.; Macrae, M.L.; Wilson, H.F.; Elliott, J.A.; Bergström, L.; Glenn, A.J.; Vadas, P.A. Agricultural Water Quality in Cold Climates: Processes, Drivers, Management Options, and Research Needs. J. Environ. Qual. 2019, 48, 792–802. [Google Scholar] [CrossRef]
- Wu, M.; Huang, J.; Tan, X.; Wu, J. Water, Salt and Heat Influences on Carbon and Nitrogen Dynamics in Seasonally Frozen Soils in Hetao Irrigation District, Inner Mongolia, China. Pedosphere 2019, 29, 632–641. [Google Scholar] [CrossRef]
- Bai, J.; Gao, H.; Xiao, R.; Wang, J.; Huang, C. A Review of Soil Nitrogen Mineralization as Affected by Water and Salt in Coastal Wetlands: Issues and Methods. CLEAN Soil Air Water 2012, 40, 1099–1105. [Google Scholar] [CrossRef]
- Zhou, M.; Butterbach-Bahl, K.; Vereecken, H.; Brüggemann, N. A meta-analysis of soil salinization effects on nitrogen pools, cycles and fluxes in coastal ecosystems. Glob. Change Biol. 2017, 23, 1338–1352. [Google Scholar] [CrossRef] [PubMed]
- Yang, J.; Liu, Y.; Shen, Z.; Yu, M.; Yu, Y.; Wang, Z.; Lv, Z.; Yu, J. Short-term effects of NaCl and Na2SO4 on nitrogen mineralization in the soil in three marshes of the Liaohe River estuary. Catena 2021, 196, 104828. [Google Scholar] [CrossRef]
- Yuan, B.; Li, Z.; Liu, H.; Gao, M.; Zhang, Y. Microbial biomass and activity in salt affected soils under arid conditions. Appl. Soil Ecol. 2007, 35, 319–328. [Google Scholar] [CrossRef]
- Duan, M.; House, J.; Liu, Y.; Chang, S.X. Contrasting responses of gross and net nitrogen transformations to salinity in a reclaimed boreal forest soil. Biol. Fert. Soils 2018, 54, 385–395. [Google Scholar] [CrossRef]
- Wong, V.N.L.; Dalal, R.C.; Greene, R.S.B. Salinity and sodicity effects on respiration and microbial biomass of soil. Biol. Fert. Soils 2008, 44, 943–953. [Google Scholar] [CrossRef]
- Santoro, A.E. Microbial nitrogen cycling at the saltwater–freshwater interface. Hydrogeol. J. 2010, 18, 187–202. [Google Scholar] [CrossRef]
- Zeng, W.; Xu, C.; Wu, J.; Huang, J.; Ma, T. Effect of Salinity on Soil Respiration and Nitrogen Dynamics. Ecol. Chem. Eng. 2013, 20, 519–530. [Google Scholar] [CrossRef]
- Marton, J.M.; Herbert, E.R.; Craft, C.B. Effects of Salinity on Denitrification and Greenhouse Gas Production from Laboratory-incubated Tidal Forest Soils. Wetlands 2012, 32, 347–357. [Google Scholar] [CrossRef]
- Noe, G.B.; Krauss, K.W.; Lockaby, B.G.; Conner, W.H.; Hupp, C.R. The effect of increasing salinity and forest mortality on soil nitrogen and phosphorus mineralization in tidal freshwater forested wetlands. Biogeochemistry 2013, 114, 225–244. [Google Scholar] [CrossRef] [Green Version]
- Osborne, R.I.; Bernot, M.J.; Findlay, S.E.G. Changes in Nitrogen Cycling Processes Along a Salinity Gradient in Tidal Wetlands of the Hudson River, New York, USA. Wetlands 2015, 35, 323–334. [Google Scholar] [CrossRef]
- Guo, H.; Ma, L.; Liang, Y.; Hou, Z.; Min, W. Response of ammonia-oxidizing Bacteria and Archaea to long-term saline water irrigation in alluvial grey desert soils. Sci. Rep. 2020, 10, 489. [Google Scholar] [CrossRef]
- Murtaza, B.; Murtaza, G.; Sabir, M.; Owens, G.; Abbas, G.; Imran, M.; Shah, G.M. Amelioration of saline–sodic soil with gypsum can increase yield and nitrogen use efficiency in rice–wheat cropping system. Arch. Agron. Soil Sci. 2017, 63, 1267–1280. [Google Scholar] [CrossRef]
- Li, Y.; Xu, J.; Liu, S.; Qi, Z.; Wang, H.; Wei, Q.; Gu, Z.; Liu, X.; Hameed, F. Salinity-induced concomitant increases in soil ammonia volatilization and nitrous oxide emission. Geoderma 2020, 361, 114053. [Google Scholar] [CrossRef]
- Zhu, H.; Yang, J.; Yao, R.; Wang, X.; Xie, W.; Zhu, W.; Liu, X.; Cao, Y.; Tao, J. Interactive effects of soil amendments (biochar and gypsum) and salinity on ammonia volatilization in coastal saline soil. Catena 2020, 190, 104527. [Google Scholar] [CrossRef]
- Song, Y.; Zou, Y.; Wang, G.; Yu, X. Altered soil carbon and nitrogen cycles due to the freeze-thaw effect: A meta-analysis. Soil Biol. Biochem. 2017, 109, 35–49. [Google Scholar] [CrossRef]
- Patel, K.F.; Tatariw, C.; MacRae, J.D.; Ohno, T.; Nelson, S.J.; Fernandez, I.J. Repeated freeze–thaw cycles increase extractable, but not total, carbon and nitrogen in a Maine coniferous soil. Geoderma 2021, 402, 115353. [Google Scholar] [CrossRef]
- Xu, X. Effect of freeze-thaw disturbance on soil C and N dynamics and GHG fluxes of East Asia forests: Review and future perspectives. Soil Sci. Plant Nutr. (Tokyo) 2022, 68, 15–26. [Google Scholar] [CrossRef]
- Wang, X.; Wang, C.; Wang, X.; Huo, Z. Response of soil compaction to the seasonal freezing-thawing process and the key controlling factors. Catena 2020, 184, 104247. [Google Scholar] [CrossRef]
- Kværnø, S.H.; Øygarden, L. The influence of freeze–thaw cycles and soil moisture on aggregate stability of three soils in Norway. Catena 2006, 67, 175–182. [Google Scholar] [CrossRef]
- Zhao, Q.; Wu, C.; Wang, K.; Chang, D.; Huang, J. In situ experiment on change law of soil mineral nitrogen availability in seasonal freezing agricultural areas. Trans. Chin. Soc. Agric. Eng. 2019, 35, 140–146. (In Chinese) [Google Scholar]
- Jiang, N.; Juan, Y.; Tian, L.; Chen, X.; Sun, W.; Chen, L. Soil Water Contents Control the Responses of Dissolved Nitrogen Pools and Bacterial Communities to Freeze-Thaw in Temperate Soils. Biomed Res. Int. 2020, 6867081. [Google Scholar] [CrossRef]
- Juan, Y.; Tian, L.; Sun, W.; Qiu, W.; Curtin, D.; Gong, L.; Liu, Y. Simulation of soil freezing-thawing cycles under typical winter conditions: Implications for nitrogen mineralization. J. Soil Sediments 2020, 20, 143–152. [Google Scholar] [CrossRef]
- Juan, Y.; Jiang, N.; Tian, L.; Chen, X.; Sun, W.; Chen, L. Effect of Freeze-Thaw on a Midtemperate Soil Bacterial Community and the Correlation Network of Its Members. Biomed Res. Int. 2018, 2018, 8412429. [Google Scholar] [CrossRef] [PubMed]
- Liu, M.; Feng, F.; Cai, T.; Tang, S. Soil Microbial Community Response Differently to the Frequency and Strength of Freeze–Thaw Events in a Larix gmelinii Forest in the Daxing’an Mountains, China. Front. Microbiol. 2020, 11, 1164. [Google Scholar] [CrossRef]
- Sang, C.; Xia, Z.; Sun, L.; Sun, H.; Jiang, P.; Wang, C.; Bai, E. Responses of soil microbial communities to freeze–thaw cycles in a Chinese temperate forest. Ecol. Processes 2021, 10, 66. [Google Scholar] [CrossRef]
- Zhao, Q.; Tan, X.; Zeng, Q.; Zhao, H.; Wu, J.; Huang, J. Combined effects of temperature and precipitation on the spring runoff generation process in a seasonal freezing agricultural watershed. Environ. Earth Sci. 2021, 80, 490. [Google Scholar] [CrossRef]
- Wu, M.; Huang, J.; Wu, J.; Tan, X.; Jansson, P. Experimental study on evaporation from seasonally frozen soils under various water, solute and groundwater conditions in Inner Mongolia, China. J. Hydrol. 2016, 535, 46–53. [Google Scholar] [CrossRef]
- Wang, M.; Zhu, Y.; Zhao, T.; Cui, L.; Mao, W.; Ye, M.; Wu, J.; Yang, J. Chemical characteristics of salt migration in frozen soils during the freezing-thawing period. J. Hydrol. 2022, 606, 127403. [Google Scholar] [CrossRef]
- Wu, M.; Tan, X.; Huang, J.; Wu, J.; Jansson, P. Solute and water effects on soil freezing characteristics based on laboratory experiments. Cold Reg. Sci. Technol. 2015, 115, 22–29. [Google Scholar] [CrossRef]
- Hu, G.; Zhao, L.; Zhu, X.; Wu, X.; Wu, T.; Li, R.; Xie, C.; Hao, J. Review of algorithms and parameterizations to determine unfrozen water content in frozen soil. Geoderma 2020, 368, 114277. [Google Scholar] [CrossRef]
- Tan, X.; Wu, M.; Huang, J.; Wu, J.; Chen, J. Similarity of soil freezing characteristic and soil water characteristic: Application in saline frozen soil hydraulic properties prediction. Cold Reg. Sci. Technol. 2020, 173, 102876. [Google Scholar] [CrossRef]
- Gao, D.; Bai, E.; Yang, Y.; Zong, S.; Hagedorn, F. A global meta-analysis on freeze-thaw effects on soil carbon and phosphorus cycling. Soil Biol. Biochem. 2021, 159, 108283. [Google Scholar] [CrossRef]
- Rosinger, C.; Clayton, J.; Baron, K.; Bonkowski, M. Soil freezing-thawing induces immediate shifts in microbial and resource stoichiometry in Luvisol soils along a postmining agricultural chronosequence in Western Germany. Geoderma 2022, 408, 115596. [Google Scholar] [CrossRef]
- Li, T.; Chen, Y.; Han, L.; Cheng, L.; Lv, Y.; Fu, B.; Feng, X.; Wu, X. Shortened duration and reduced area of frozen soil in the Northern Hemisphere. Innovation 2021, 2, 100146. [Google Scholar] [CrossRef]
- Chen, X.; Jeong, S.; Park, C.; Park, H.; Joo, J.; Chang, D.; Yun, J. Different responses of surface freeze and thaw phenology changes to warming among Arctic permafrost types. Remote Sens. Environ. 2022, 272, 112956. [Google Scholar] [CrossRef]
- Hatami, S.; Nazemi, A. Compound changes in temperature and snow depth lead to asymmetric and nonlinear responses in landscape freeze–thaw. Sci. Rep. 2022, 12, 2196. [Google Scholar] [CrossRef]
- Xu, S.; Fu, Q.; Li, T.; Meng, F.; Liu, D.; Hou, R.; Li, M.; Li, Q. Spatiotemporal characteristics of the soil freeze-thaw state and its variation under different land use types—A case study in Northeast China. Agric. For. Meteorol. 2022, 312, 108737. [Google Scholar] [CrossRef]
- Jiang, Y. China’s water scarcity. J. Environ. Manag. 2009, 90, 3185–3196. [Google Scholar] [CrossRef]
- Li, J.; Pu, L.; Han, M.; Zhu, M.; Zhang, R.; Xiang, Y. Soil salinization research in China: Advances and prospects. J. Geogr. Sci. 2014, 24, 943–960. [Google Scholar] [CrossRef]
- Koponen, H.T.; Martikainen, P.J. Soil water content and freezing temperature affect freeze–thaw related N2O production in organic soil. Nutr. Cycl. Agroecosystems 2004, 69, 213–219. [Google Scholar] [CrossRef]
- Larsen, K.S.; Jonasson, S.; Michelsen, A. Repeated freeze–thaw cycles and their effects on biological processes in two arctic ecosystem types. Appl. Soil Ecol. 2002, 21, 187–195. [Google Scholar] [CrossRef]
- Jiang, N.; Juan, Y.; Tian, L.; Chen, X.; Sun, W.; Chen, L. Modification of the composition of dissolved nitrogen forms, nitrogen transformation processes, and diversity of bacterial communities by freeze–thaw events in temperate soils. Pedobiologia 2018, 71, 41–49. [Google Scholar] [CrossRef]
- Smith, J.; Wagner-Riddle, C.; Dunfield, K. Season and management related changes in the diversity of nitrifying and denitrifying bacteria over winter and spring. Appl. Soil Ecol. 2010, 44, 138–146. [Google Scholar] [CrossRef]
- Wertz, S.; Goyer, C.; Zebarth, B.J.; Tatti, E.; Burton, D.L.; Chantigny, M.H.; Filion, M. The amplitude of soil freeze-thaw cycles influences temporal dynamics of N2O emissions and denitrifier transcriptional activity and community composition. Biol. Fert. Soils 2016, 52, 1149–1162. [Google Scholar] [CrossRef]
- Urakawa, R.; Shibata, H.; Kuroiwa, M.; Inagaki, Y.; Tateno, R.; Hishi, T.; Fukuzawa, K.; Hirai, K.; Toda, H.; Oyanagi, N.; et al. Effects of freeze–thaw cycles resulting from winter climate change on soil nitrogen cycling in ten temperate forest ecosystems throughout the Japanese archipelago. Soil Biol. Biochem. 2014, 74, 82–94. [Google Scholar] [CrossRef]
- Li, Z.; Tang, Z.; Song, Z.; Chen, W.; Tian, D.; Tang, S.; Wang, X.; Wang, J.; Liu, W.; Wang, Y.; et al. Variations and controlling factors of soil denitrification rate. Glob. Change Biol. 2022, 28, 2133–2145. [Google Scholar] [CrossRef] [PubMed]
- Song, Y.; Zou, Y.; Wang, G.; Yu, X. Stimulation of nitrogen turnover due to nutrients release from aggregates affected by freeze-thaw in wetland soils. Phys. Chem. Earth Parts A/B/C 2017, 97, 3–11. [Google Scholar] [CrossRef]
- Tuorto, S.J.; Darias, P.; McGuinness, L.R.; Panikov, N.; Zhang, T.; Häggblom, M.M.; Kerkhof, L.J. Bacterial genome replication at subzero temperatures in permafrost. ISME J. 2014, 8, 139–149. [Google Scholar] [CrossRef]
- Laura, R.D. Salinity and nitrogen mineralization in soil. Soil Biol. Biochem. 1977, 9, 333–336. [Google Scholar] [CrossRef]
- Mikutta, R.; Mikutta, C.; Kalbitz, K.; Scheel, T.; Kaiser, K.; Jahn, R. Biodegradation of forest floor organic matter bound to minerals via different binding mechanisms. Geochim. Cosmochim. Acta 2007, 71, 2569–2590. [Google Scholar] [CrossRef]
- Weston, N.B.; Giblin, A.E.; Banta, G.T.; Hopkinson, C.S.; Tucker, J. The Effects of Varying Salinity on Ammonium Exchange in Estuarine Sediments of the Parker River, Massachusetts. Estuaries Coasts 2010, 33, 985–1003. [Google Scholar] [CrossRef]
- Gardner, W.S.; McCarthy, M.J.; An, S.; Sobolev, D.; Sell, K.S.; Brock, D. Nitrogen fixation and dissimilatory nitrate reduction to ammonium (DNRA) support nitrogen dynamics in Texas estuaries. Limnol. Oceanogr. 2006, 51, 558–568. [Google Scholar] [CrossRef]
- Cheng, Y.; Li, P.; Xu, G.; Li, Z.; Wang, T.; Cheng, S.; Zhang, H.; Ma, T. The effect of soil water content and erodibility on losses of available nitrogen and phosphorus in simulated freeze-thaw conditions. Catena 2018, 166, 21–33. [Google Scholar] [CrossRef]
- Gilmour, K.; Hoggarth, C.; Williams, C.; Baulch, H.M. Cold spots and cold moments: The potential for sediment freezing to depress denitrification in wetland sediments. J. Environ. Qual. 2022, 51, 990–1002. [Google Scholar] [CrossRef]
- Elliott, A.C.; Henry, H.A.L. Freeze–thaw cycle amplitude and freezing rate effects on extractable nitrogen in a temperate old field soil. Biol. Fert. Soils 2009, 45, 469–476. [Google Scholar] [CrossRef]
- Cheng, Y.; Wang, J.; Wang, S.; Zhang, J.; Cai, Z. Effects of soil moisture on gross N transformations and N2O emission in acid subtropical forest soils. Biol. Fert. Soils 2014, 50, 1099–1108. [Google Scholar] [CrossRef]
- Chen, S.; Ouyang, W.; Hao, F.; Zhao, X. Combined impacts of freeze–thaw processes on paddy land and dry land in Northeast China. Sci. Total Environ. 2013, 456–457, 24–33. [Google Scholar] [CrossRef]
- Nagare, R.; Schincariol, R.; Quinton, W.; Hayashi, M. Effects of freezing on soil temperature, freezing front propagation and moisture redistribution in peat: Laboratory investigations. Hydrol. Earth Syst. Sci. 2012, 16, 501–515. [Google Scholar] [CrossRef]
- Chen, Z.; Ding, W.; Xu, Y.; Müller, C.; Rütting, T.; Yu, H.; Fan, J.; Zhang, J.; Zhu, T. Importance of heterotrophic nitrification and dissimilatory nitrate reduction to ammonium in a cropland soil: Evidences from a 15N tracing study to literature synthesis. Soil Biol. Biochem. 2015, 91, 65–75. [Google Scholar] [CrossRef]
- Neil, R.; David, S.; Claudia, W. Mechanisms leading to enhanced soil nitrous oxide fluxes induced by freeze–thaw cycles. Can. J. Soil Sci. 2013, 93, 401–414. [Google Scholar]
Figure 1.
Experimental flow chart.
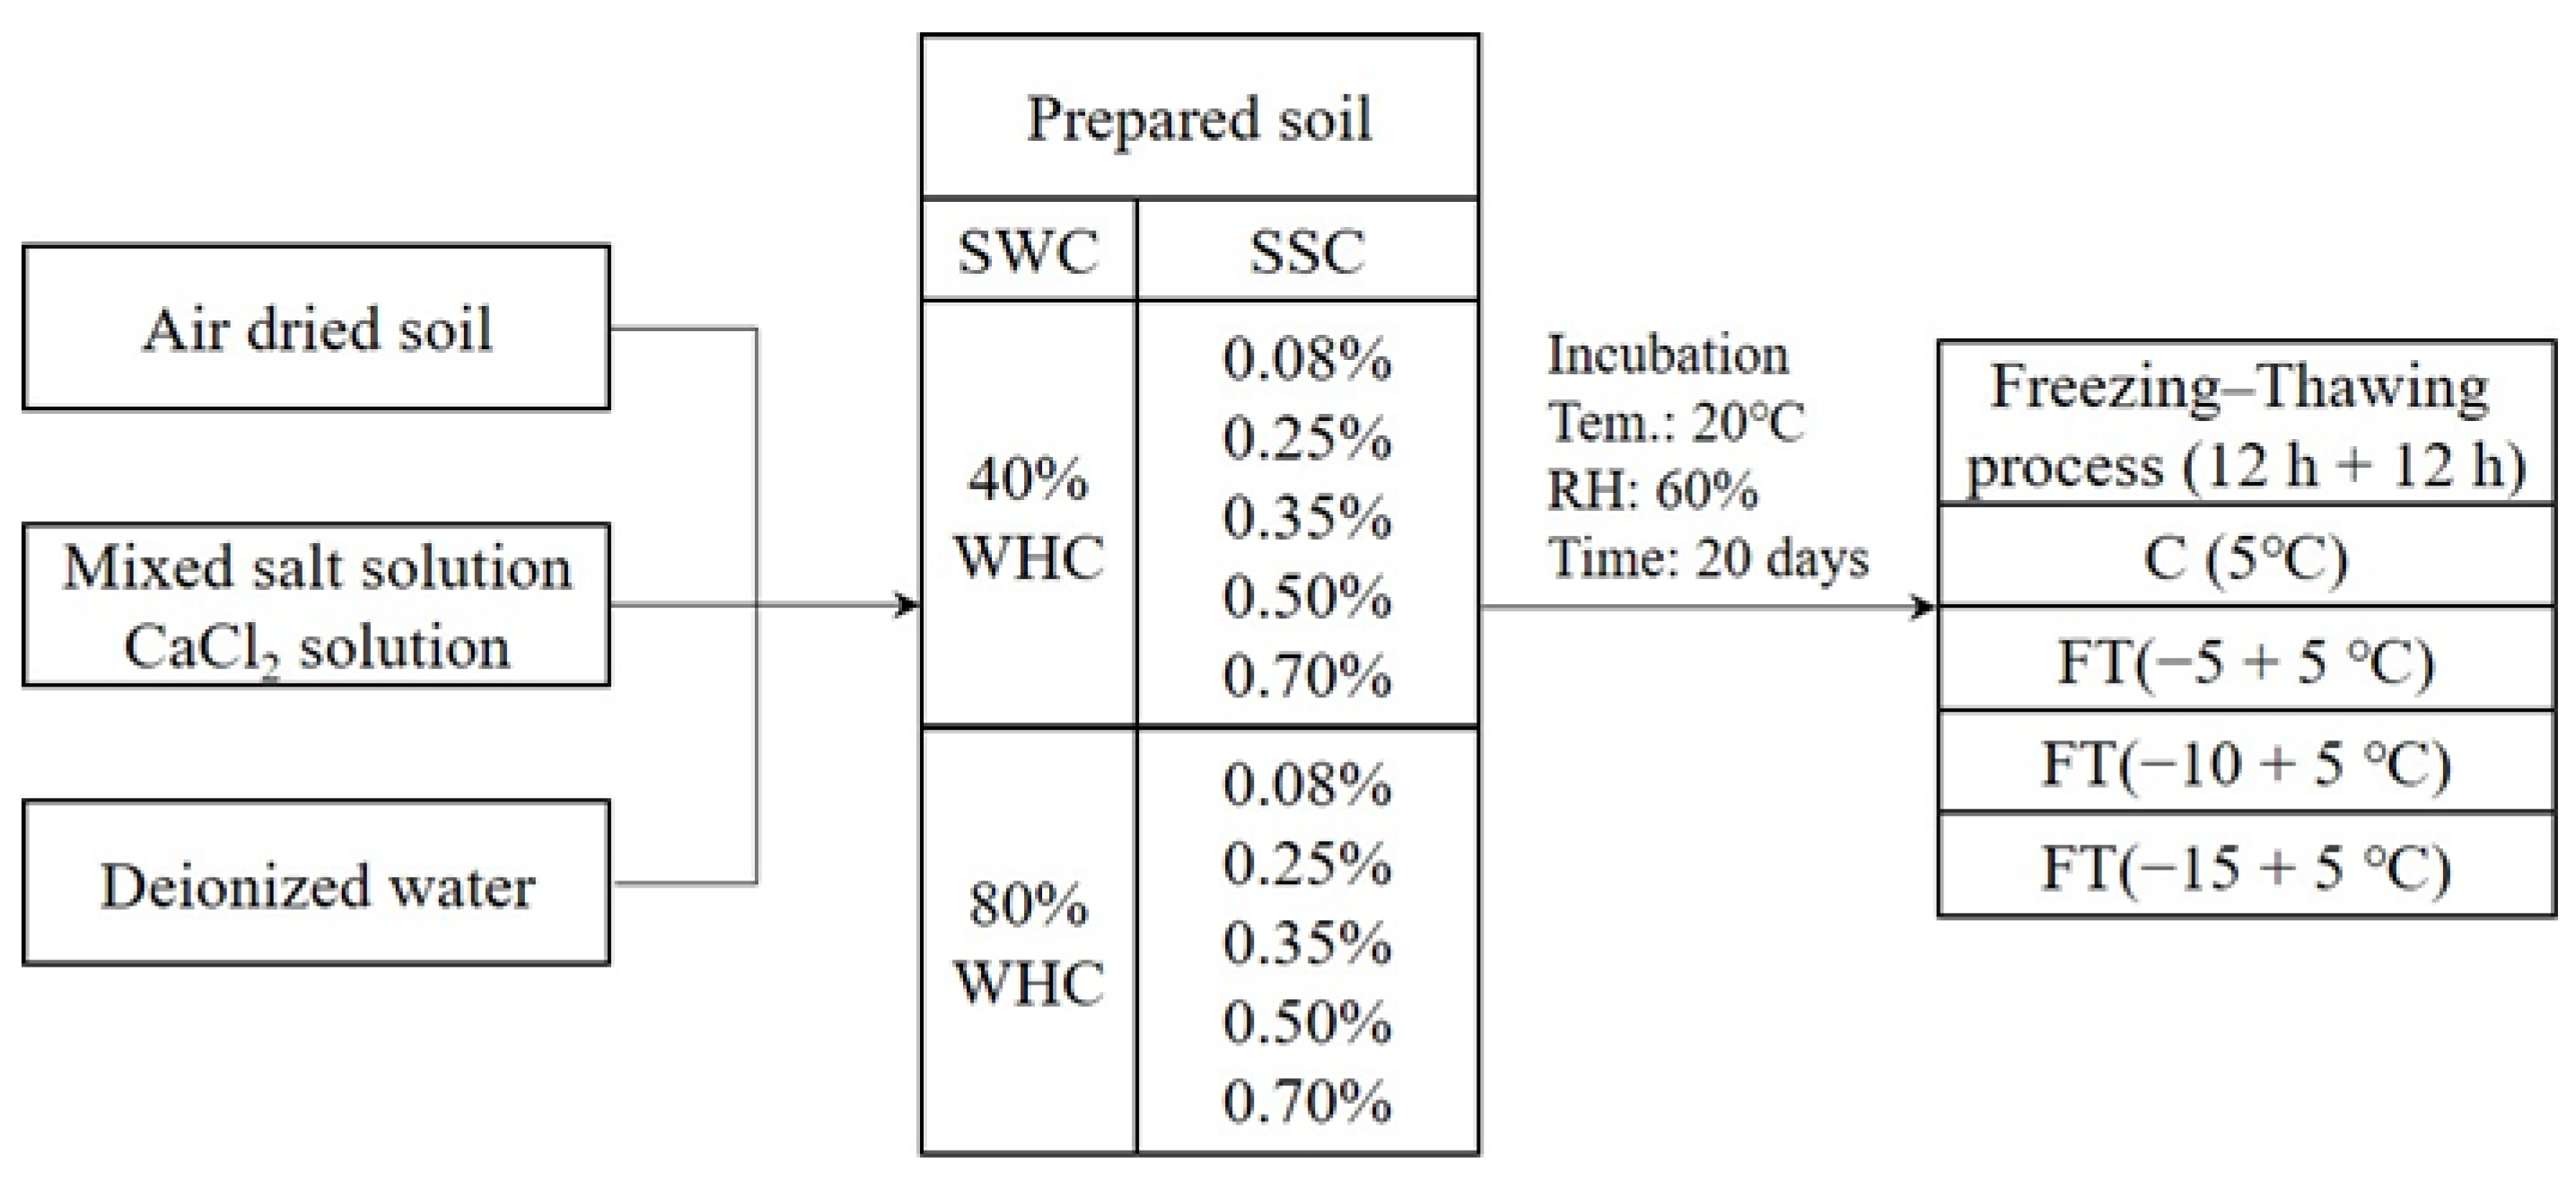
Figure 2.
Soil NH4+-N, NO3−-N, and soil inorganic nitrogen (SIN) changes during the incubation period under different salinity, freezing–thawing (FT) temperatures/cycles, and soil moisture contents.
Figure 2.
Soil NH4+-N, NO3−-N, and soil inorganic nitrogen (SIN) changes during the incubation period under different salinity, freezing–thawing (FT) temperatures/cycles, and soil moisture contents.
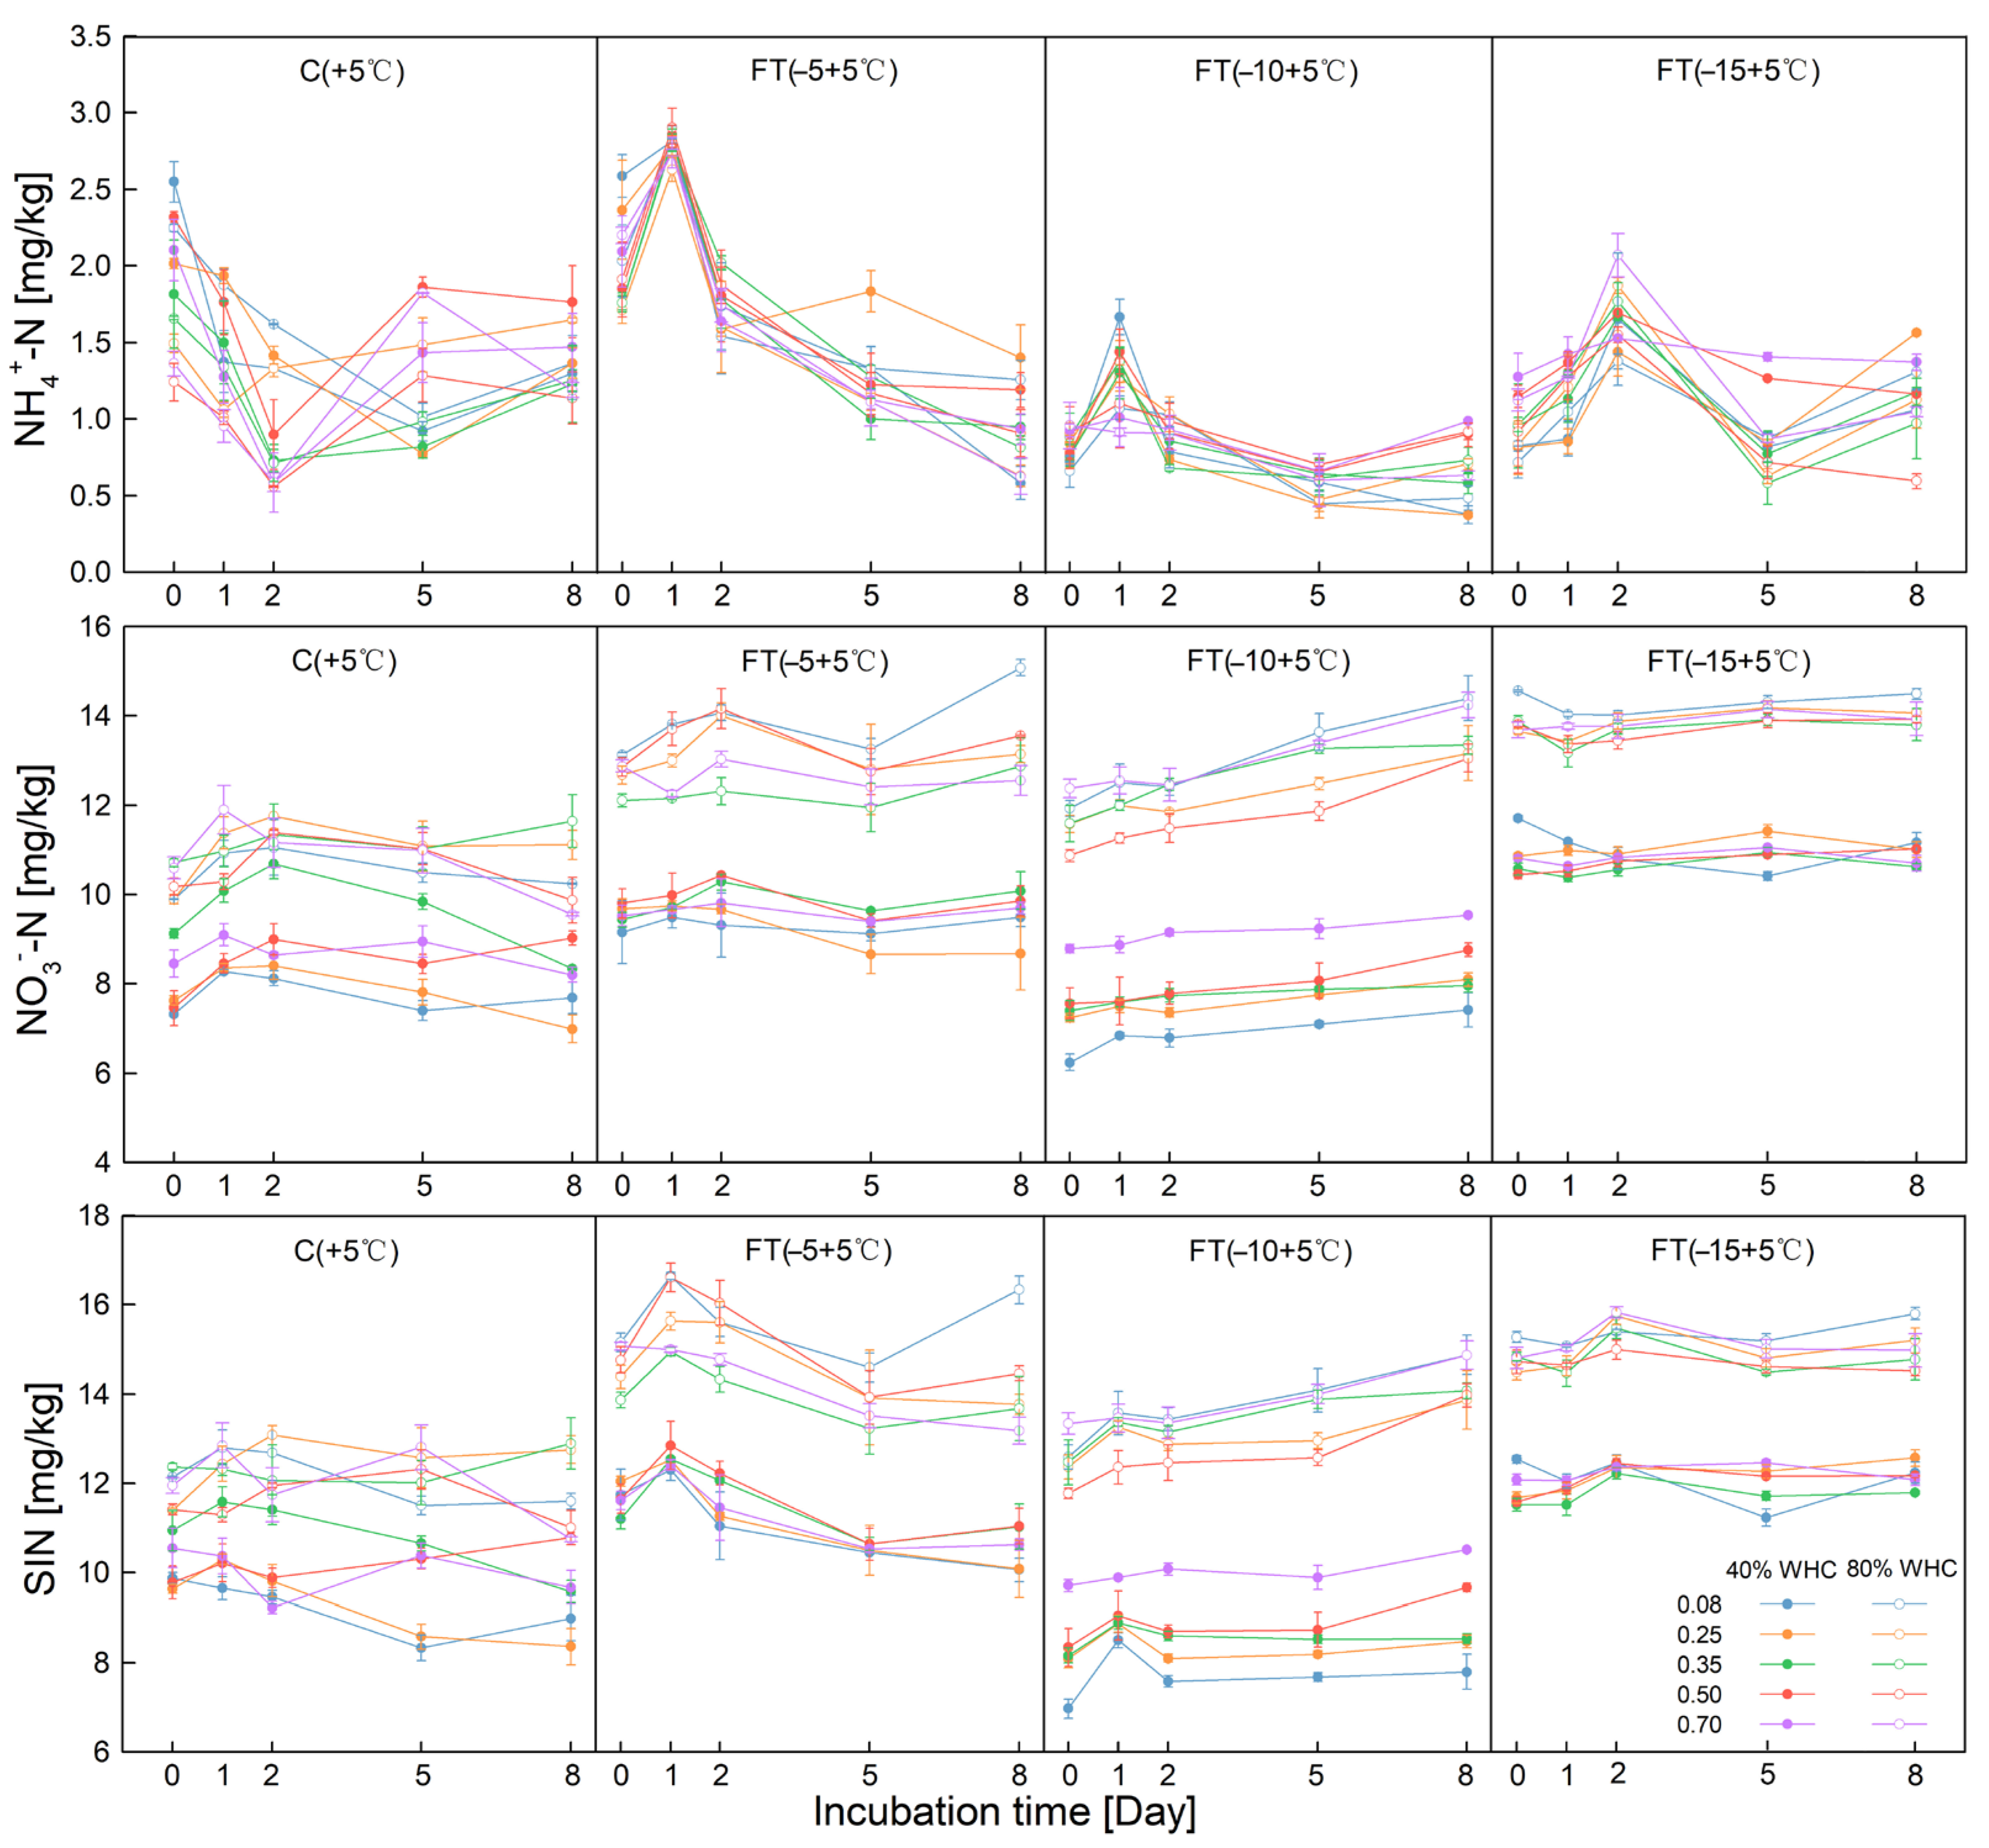
Figure 3.
Ratio of the time-weighted mean soil NH4+-N ((a): 40% water holding capacity (WHC); (d): 80% WHC), NO3−-N ((b): 40% WHC; (e): 80% WHC), and soil inorganic nitrogen (SIN) (c): 40% WHC; (f): 80% WHC) contents to their initial values before freezing–thawing incubation.
Figure 3.
Ratio of the time-weighted mean soil NH4+-N ((a): 40% water holding capacity (WHC); (d): 80% WHC), NO3−-N ((b): 40% WHC; (e): 80% WHC), and soil inorganic nitrogen (SIN) (c): 40% WHC; (f): 80% WHC) contents to their initial values before freezing–thawing incubation.
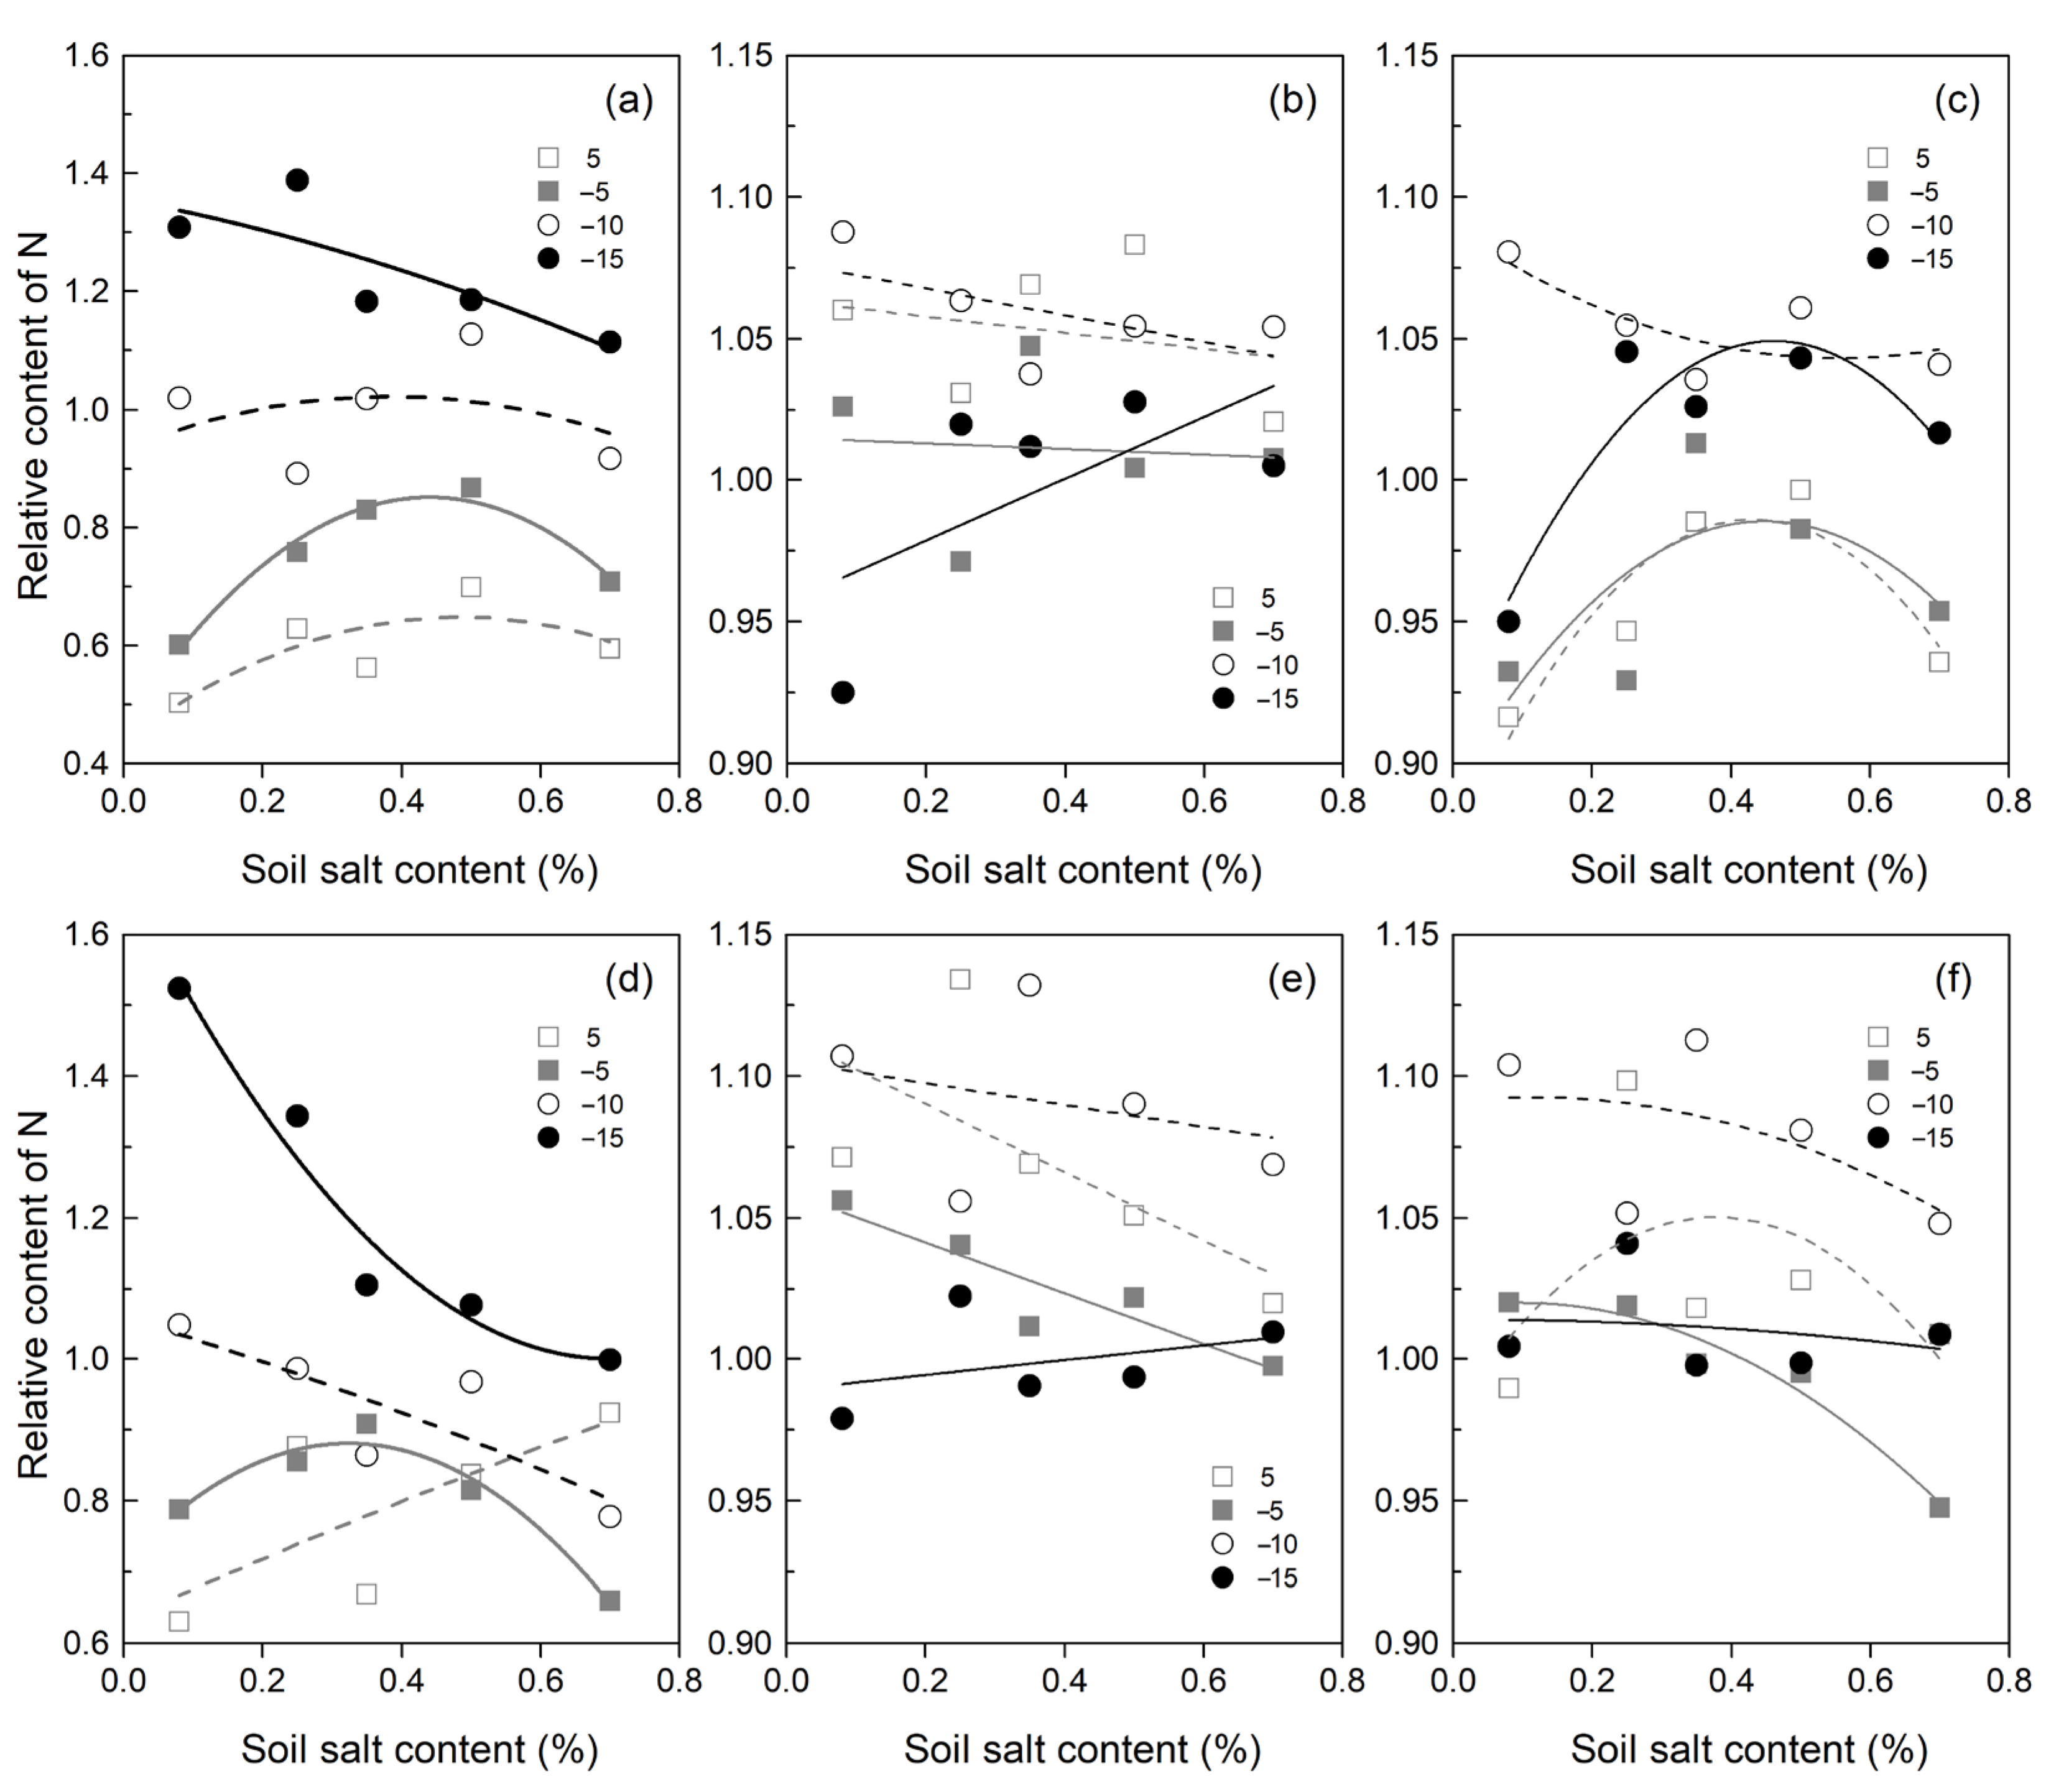
Figure 4.
Variation ranges and coefficients of variation of relative soil N (NH4+-N, NO3−-N and SIN) induced by different freezing temperatures in different soil salt content (SSC) and soil water content (SWC) treatments (a–c), and induced by SSC in different freezing–thawing (FT) and SWC treatments (d–f).
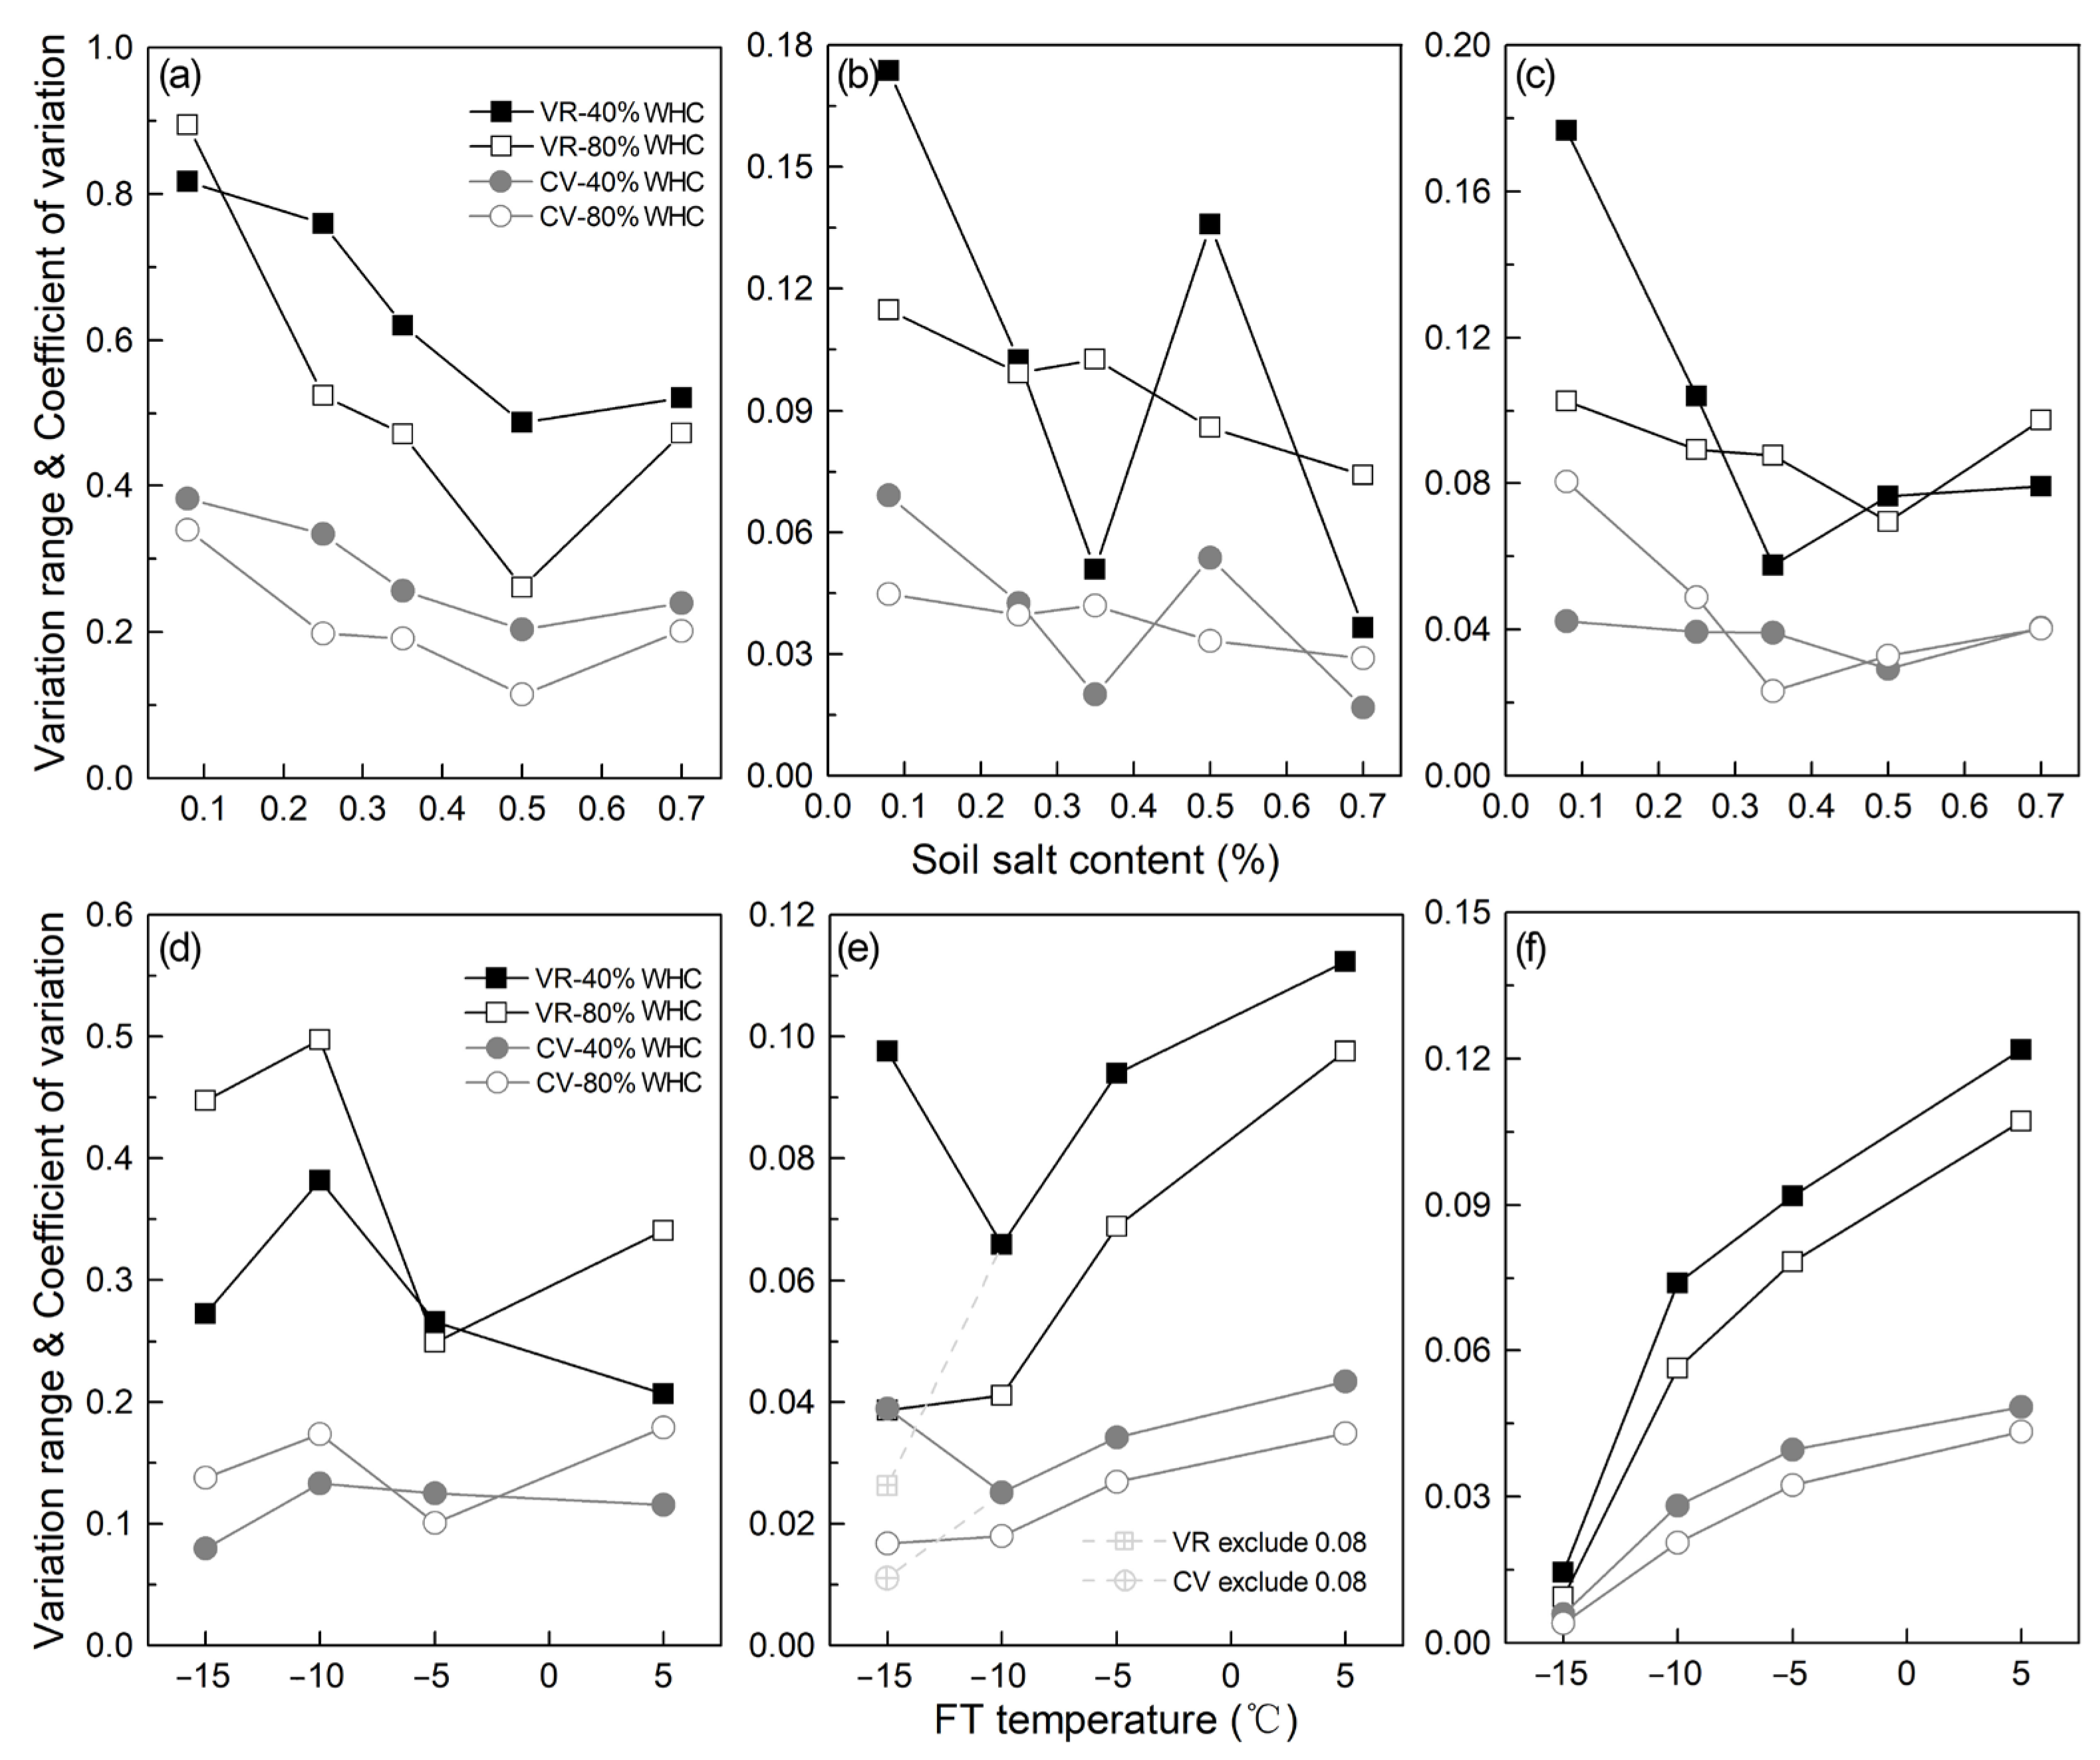
Figure 5.
Differences in relative NH4+-N (a), NO3−-N (b), and soil inorganic nitrogen (SIN) (c) contents compared to their initial values between soil water content treatments (80% water holding capacity (WHC) vs. 40% WHC).
Figure 5.
Differences in relative NH4+-N (a), NO3−-N (b), and soil inorganic nitrogen (SIN) (c) contents compared to their initial values between soil water content treatments (80% water holding capacity (WHC) vs. 40% WHC).
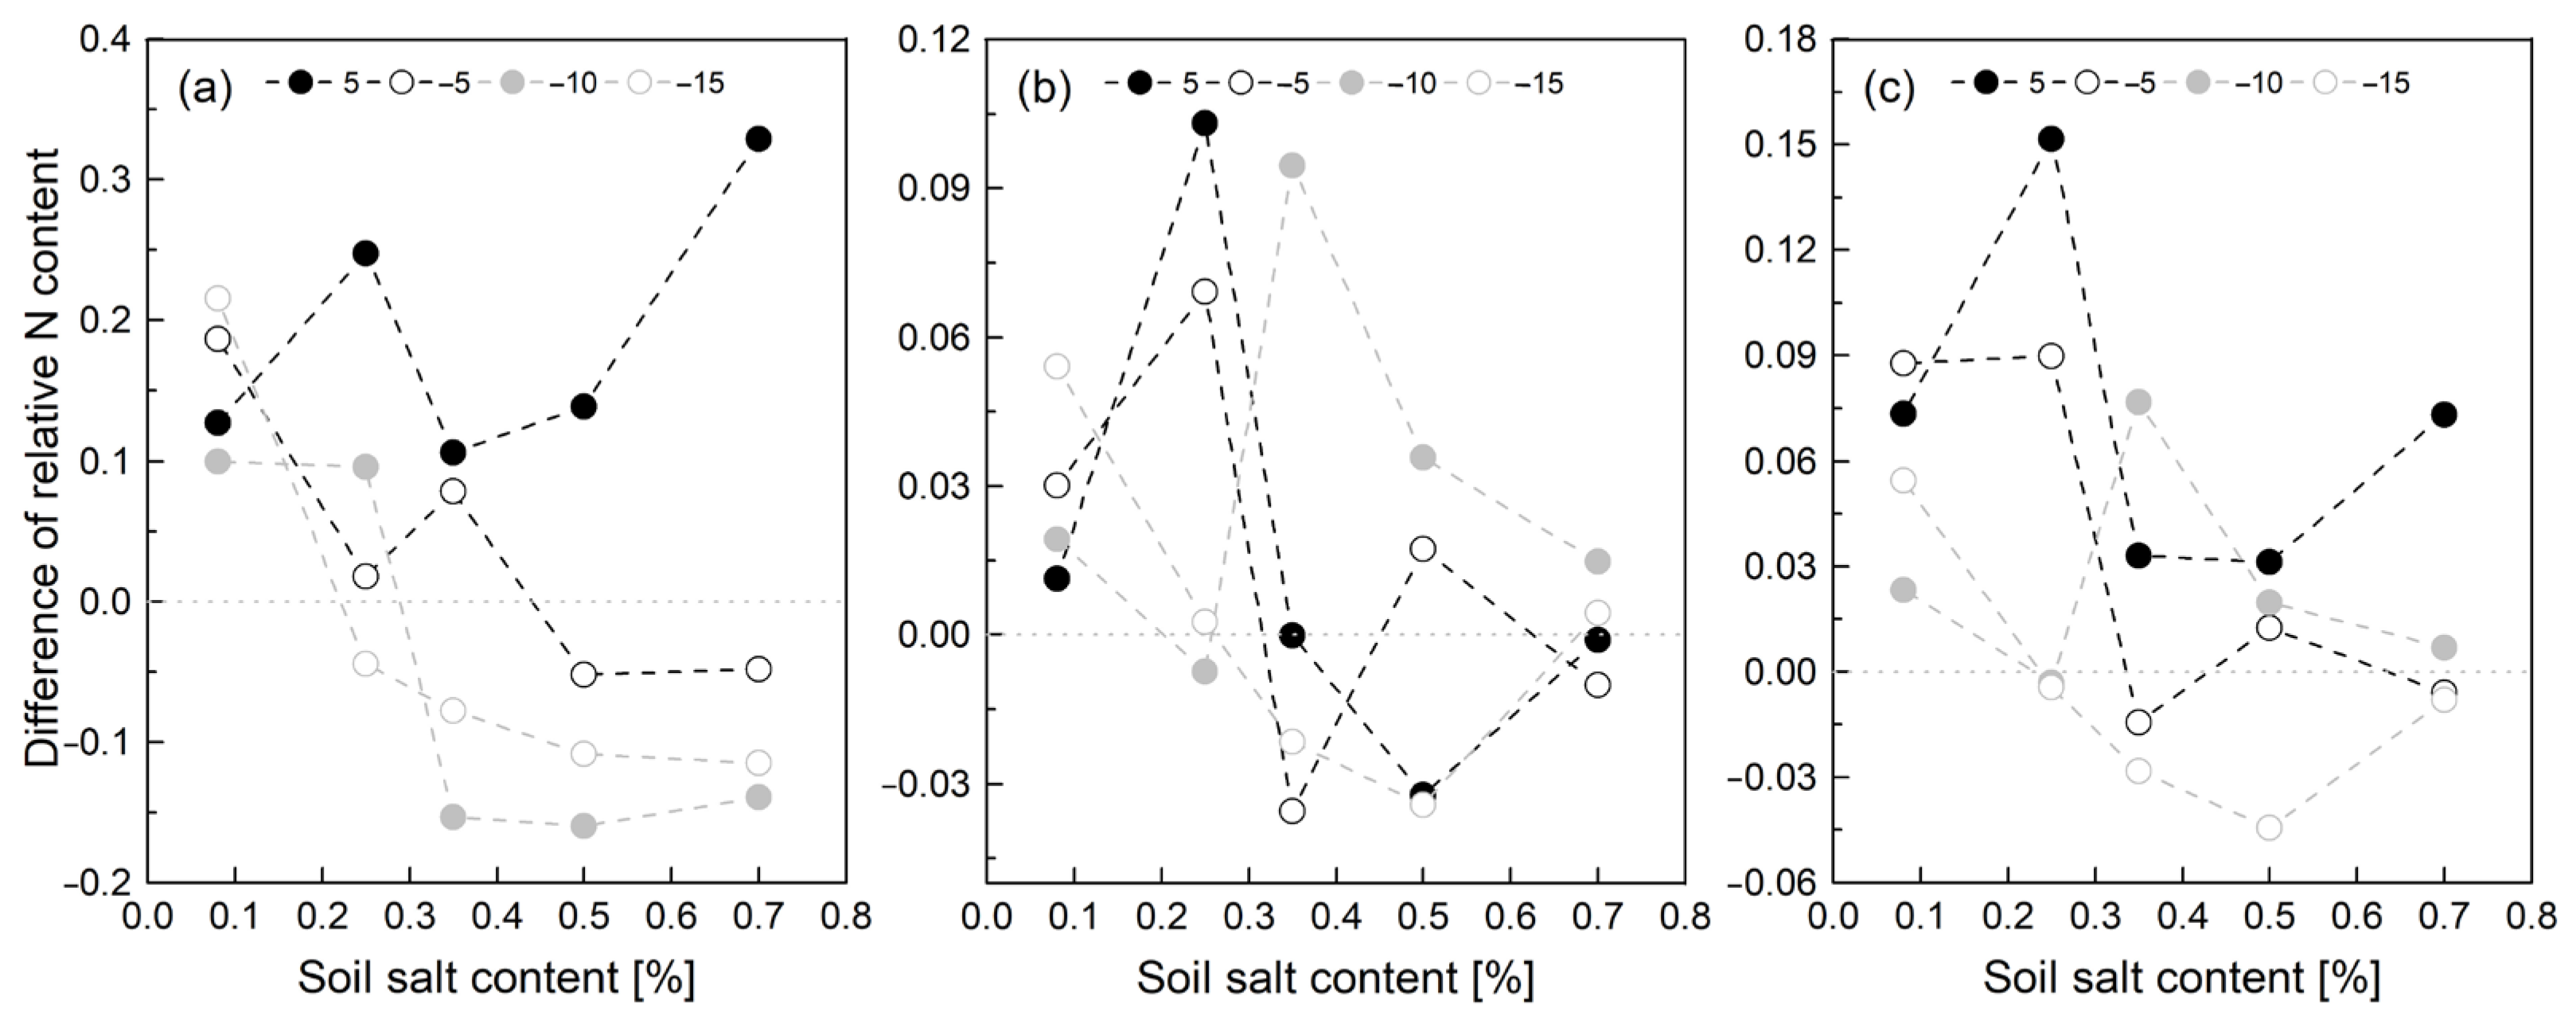
Figure 6.
Soil N mineralization and nitrification rates under different soil salt contents (SSC), freezing–thawing (FT) temperatures/cycles, and soil water contents (SWC).
Figure 6.
Soil N mineralization and nitrification rates under different soil salt contents (SSC), freezing–thawing (FT) temperatures/cycles, and soil water contents (SWC).
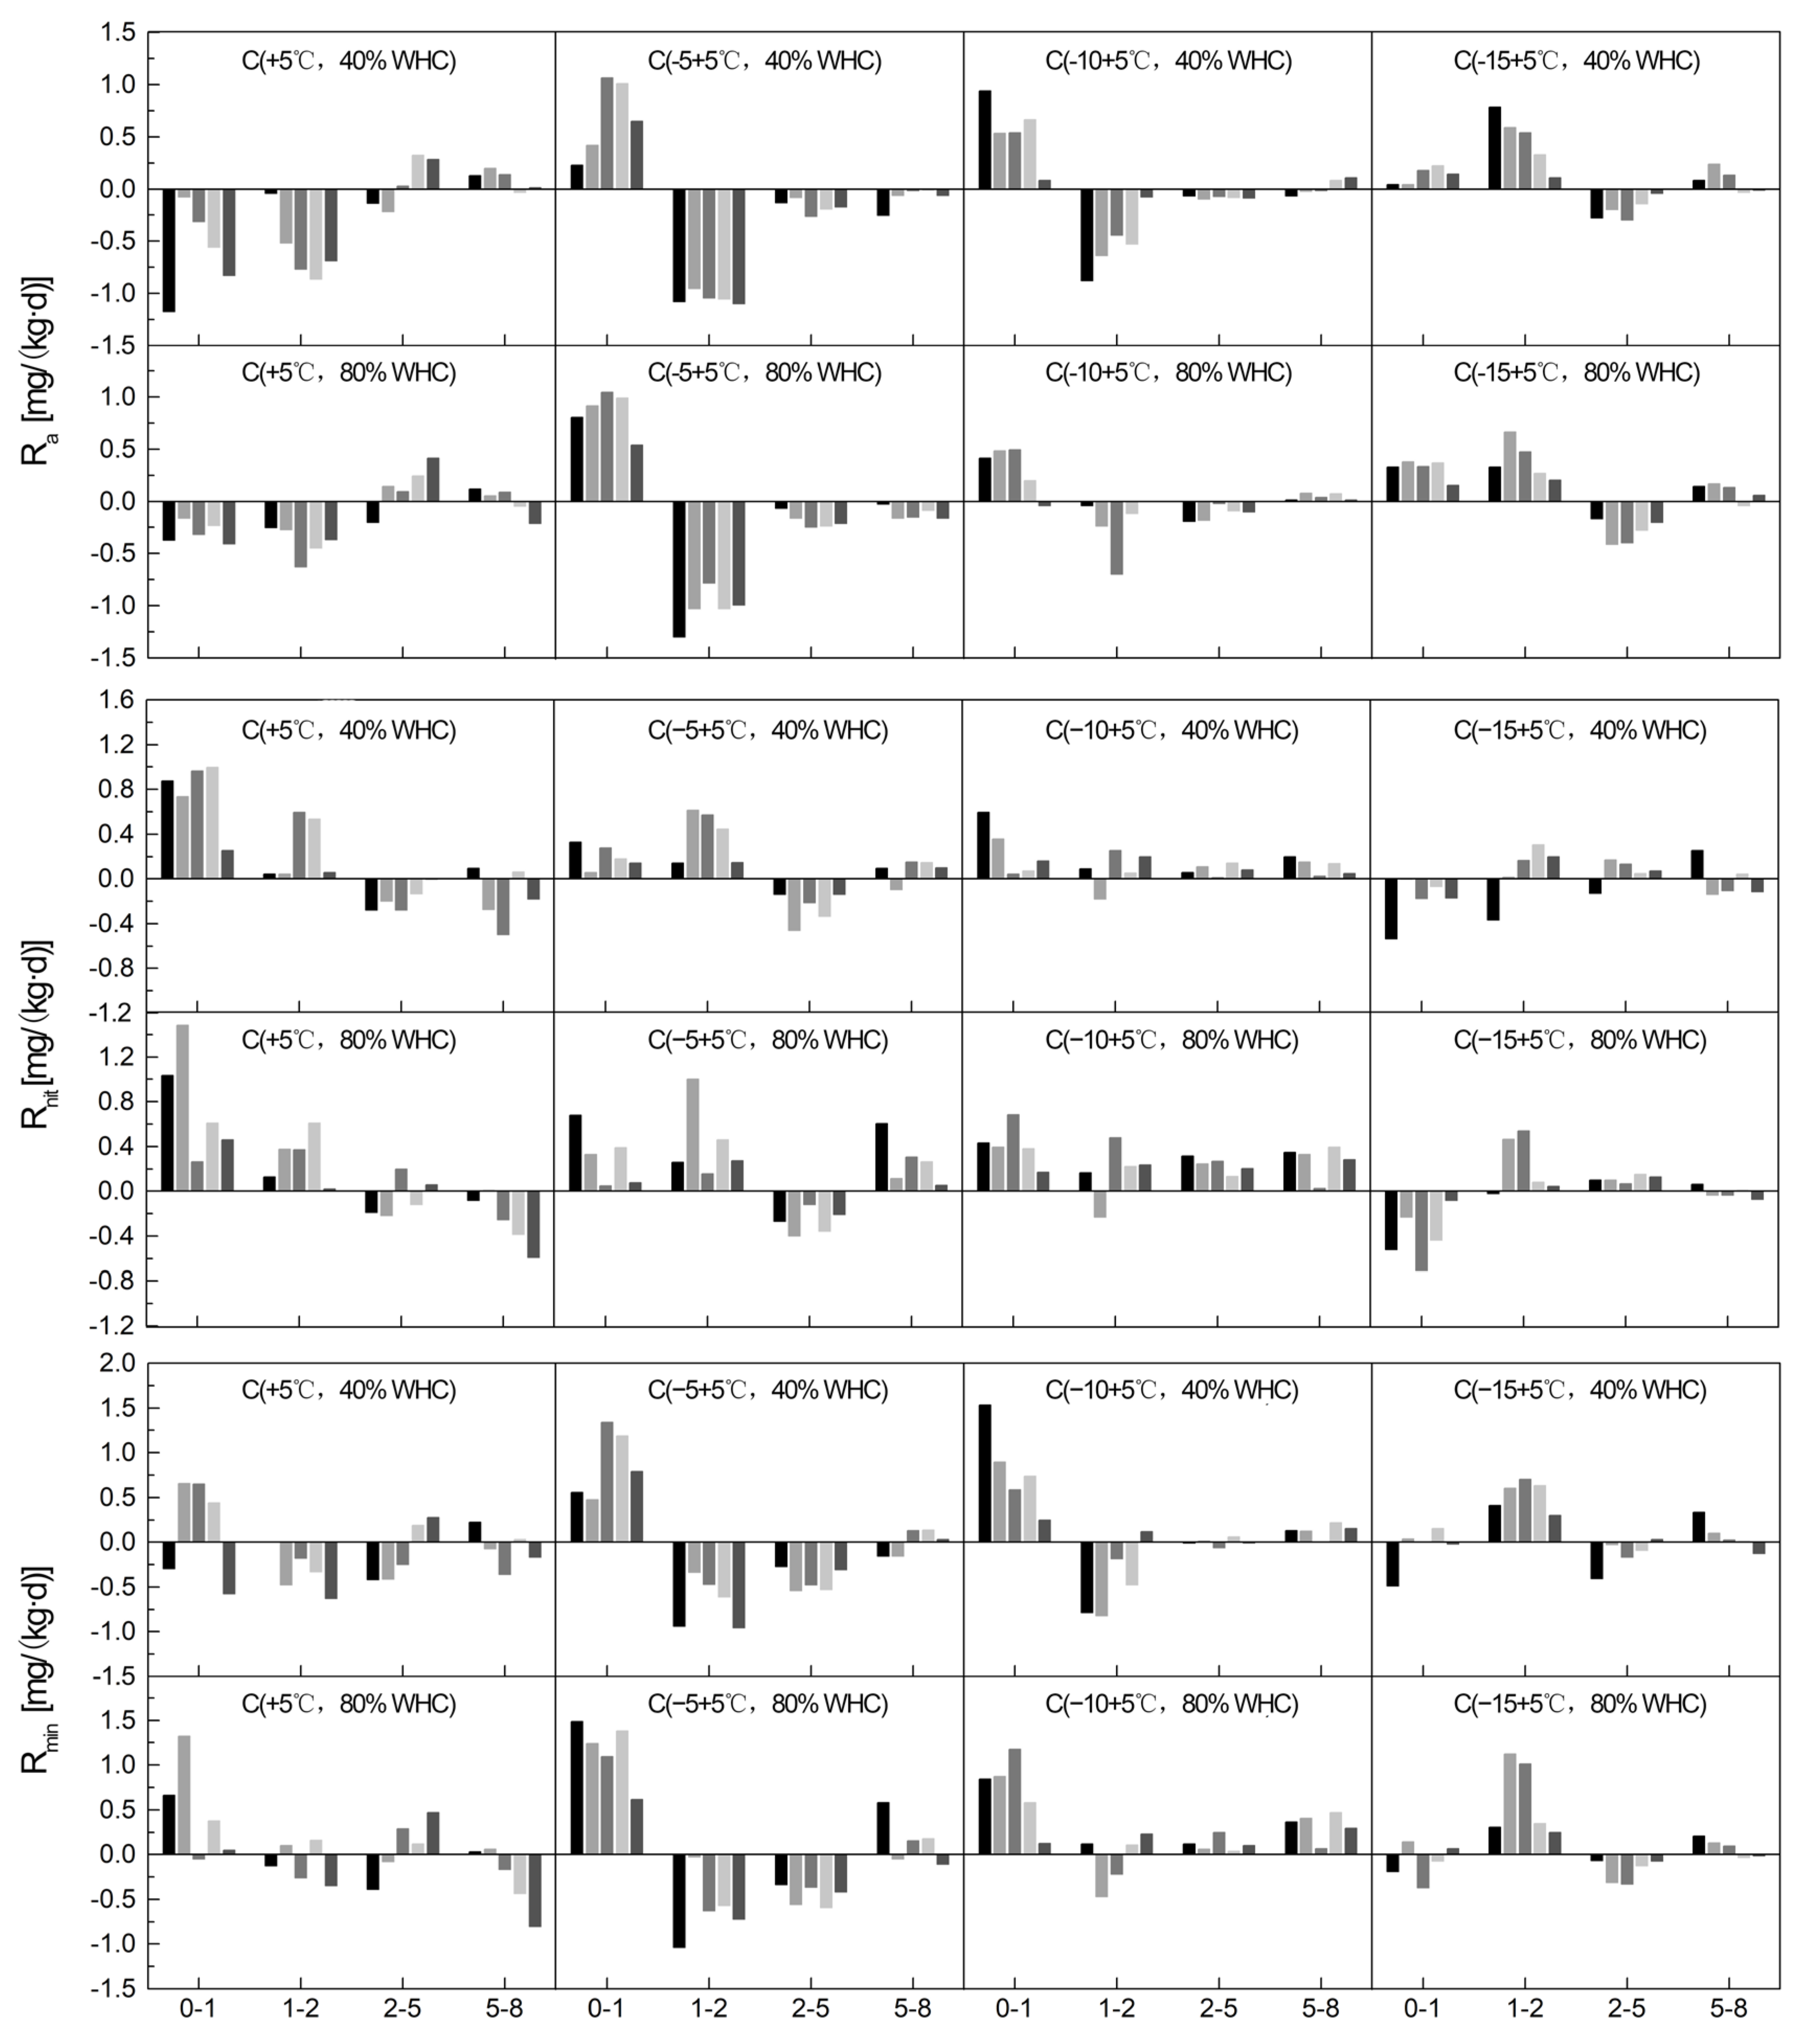
Figure 7.
Relationship between relative NH4+-N content and freezing temperature under soil water content treatments ((a) 40% water holding capacity (WHC) vs. (b) 80% WHC), and (c) the relationship between soil salt content (SSC) and the absolute values of their fitting line slopes.
Figure 7.
Relationship between relative NH4+-N content and freezing temperature under soil water content treatments ((a) 40% water holding capacity (WHC) vs. (b) 80% WHC), and (c) the relationship between soil salt content (SSC) and the absolute values of their fitting line slopes.
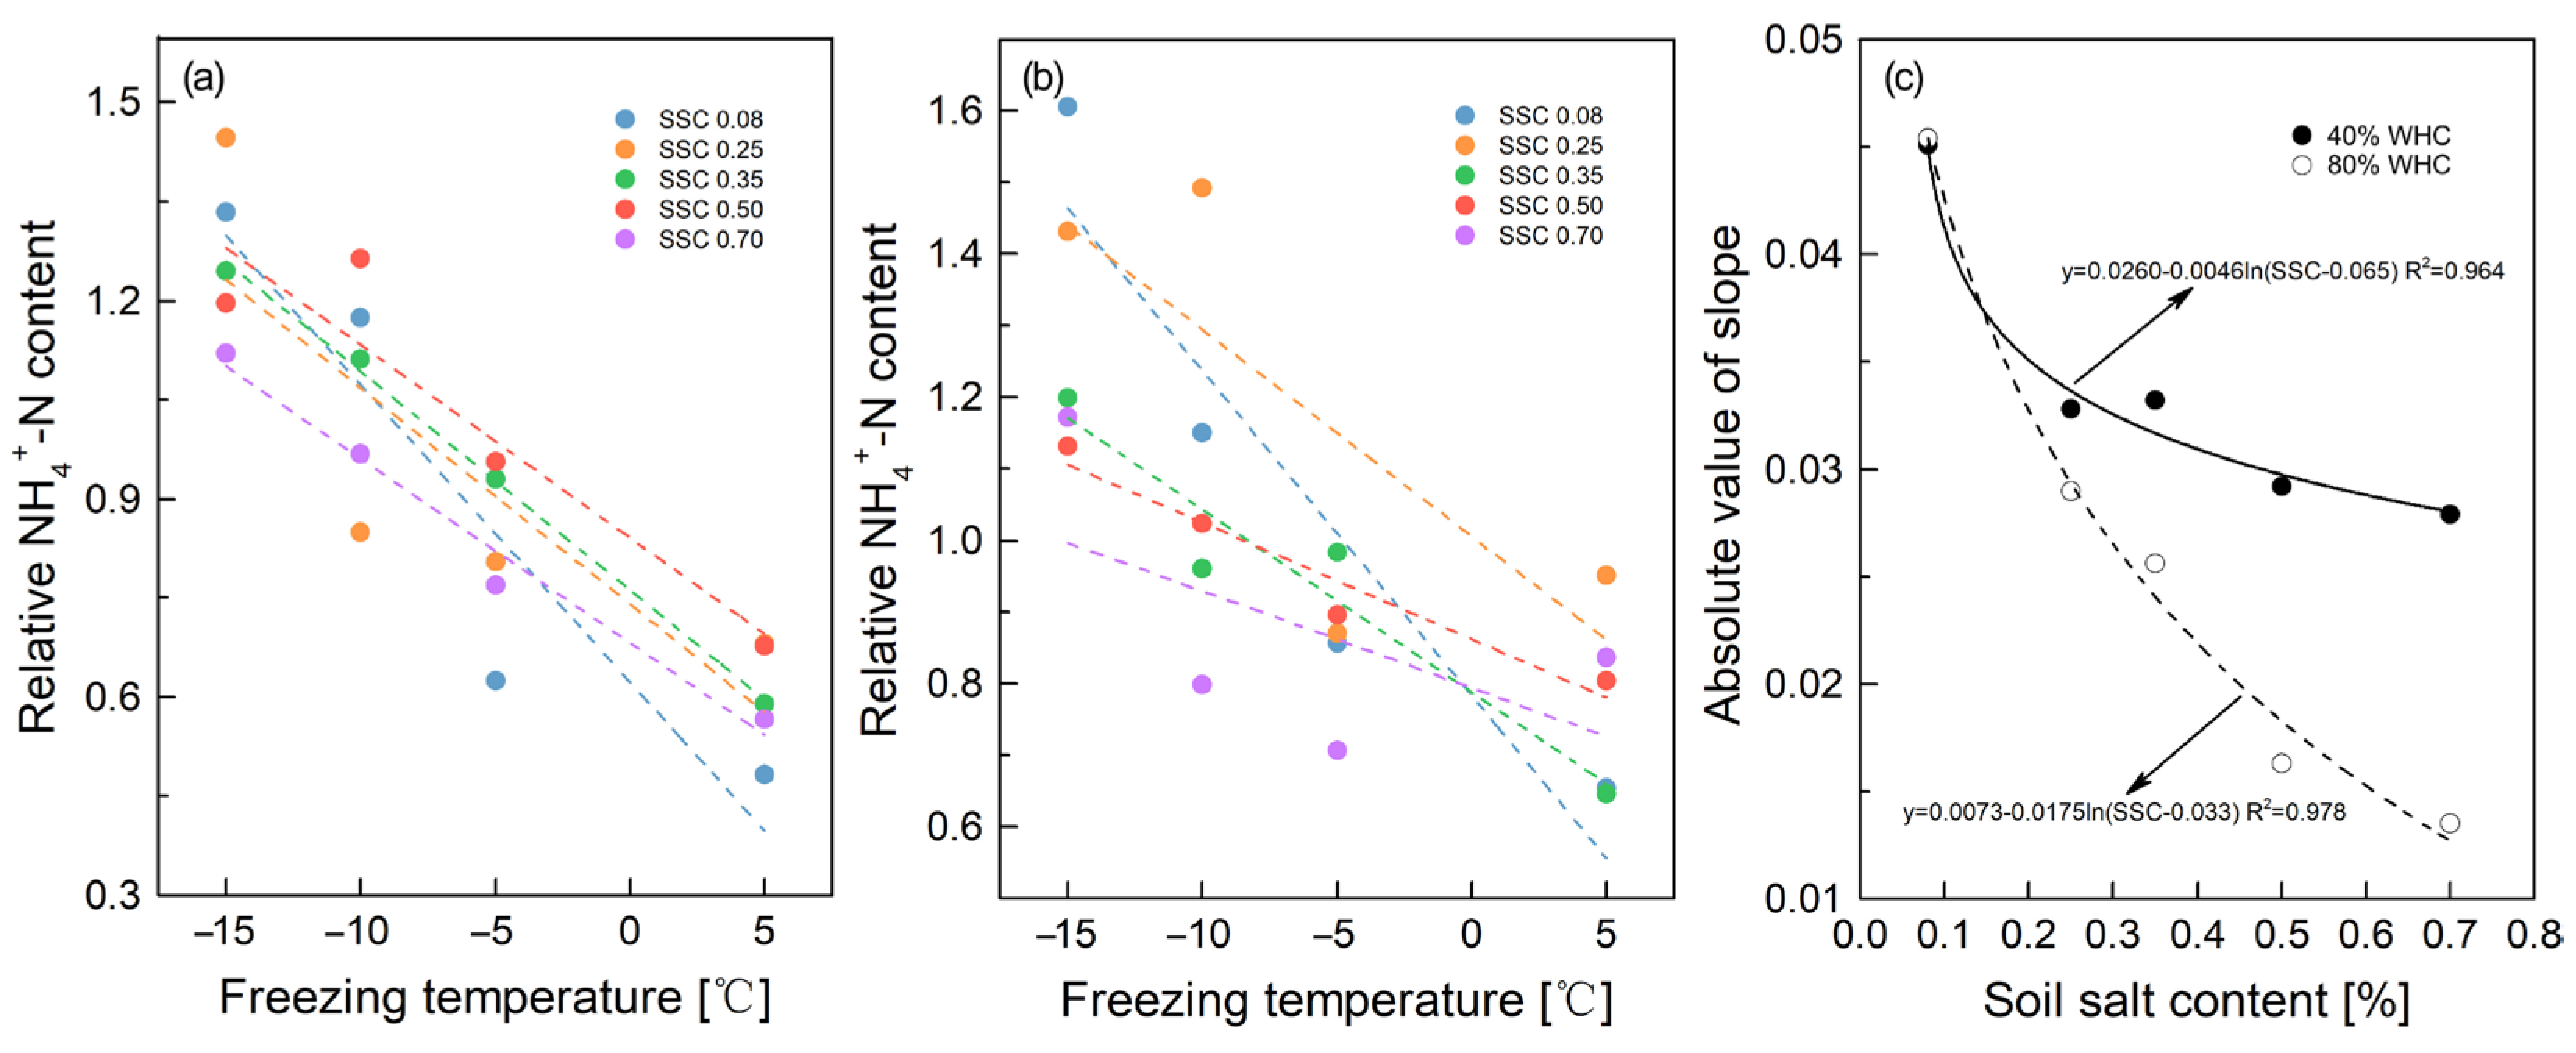
Figure 8.
Relationship between the relative NH4+-N and NO3−-N content differences caused by increased soil water content (SWC) (40–80% water holding capacity (WHC)) in treatments with low soil salt content (SSC) and high freezing temperature (a) and in treatments with high SSC and low freezing temperature (b).

Table 1.
Soil properties for incubation experiment.
| pH | EC (μS/cm) | TN (mg/kg) | TC (mg/kg) | C/N | NH4+-N (mg/kg) | NO3−-N (mg/kg) | Clay (%) | Slit (%) | Sand (%) | Soil Texture |
|---|---|---|---|---|---|---|---|---|---|---|
| 8.33 ± 0.03 | 364.84 ± 14.34 | 0.82 ± 0.02 | 23.75 ± 0.59 | 28.96 | 8.30 ± 0.85 | 7.80 ± 0.55 | 6.79 ± 0.19 | 45.04 ± 0.48 | 48.17 ± 0.67 | Silty loam |
Note: EC, TN, TC, C/N, NH4+-N, and NO3–-N denote electricity conductivity, total nitrogen, total carbon, ratio of total carbon to total nitrogen, ammonium nitrogen, and nitrate nitrogen, respectively.
Table 2.
Soil NH4+-N, NO3−-N, SIN, TN, and TC content, and NH4+-N/SIN and C/N after pre-incubation.
| SWC | SSC (%) | NH4+-N (mg/kg) | NO3−-N (mg/kg) | SIN (mg/kg) | NH4+-N /SIN (%) | TN (mg/kg) | TC (mg/kg) | C/N |
|---|---|---|---|---|---|---|---|---|
| 40 % WHC | 0.08 | 1.57 ± 0.84 a | 8.69 ± 2.10 b | 10.26 ± 2.28 b | 15.20 | 0.81 ± 0.03 a | 23.50 ± 0.21 bcd | 29.01 |
| 0.25 | 1.55 ± 0.59 a | 9.77 ± 2.86 ab | 11.33 ± 2.52 ab | 14.78 | 0.79 ± 0.03 a | 23.26 ± 0.33 cd | 29.44 | |
| 0.35 | 1.19 ± 0.42 a | 8.51 ± 1.84 b | 9.70 ± 1.83 b | 12.70 | 0.81 ± 0.02 a | 23.13 ± 0.37 d | 28.73 | |
| 0.5 | 1.37 ± 0.79 a | 9.67 ± 2.52 b | 11.03 ± 2.28 ab | 12.93 | 0.81 ± 0.01 a | 23.49 ± 0.27 bcd | 29.17 | |
| 0.7 | 1.56 ± 0.92 a | 9.40 ± 0.80 b | 10.96 ± 0.95 ab | 13.84 | 0.79 ± 0.01 a | 23.15 ± 0.09 cd | 29.48 | |
| 80% WHC | 0.08 | 1.23 ± 0.51 a | 12.61 ± 1.41 a | 13.84 ± 1.67 a | 8.74 | 0.80 ± 0.06 a | 24.27 ± 0.03 ab | 30.53 |
| 0.25 | 1.15 ± 0.41 a | 11.20 ± 1.15 ab | 12.35 ± 1.35 ab | 9.24 | 0.81 ± 0.01 a | 26.15 ± 2.22 a | 32.28 | |
| 0.35 | 1.09 ± 0.29 a | 12.19 ± 0.99 a | 13.29 ± 1.01 a | 8.25 | 0.82 ± 0.02 a | 24.39 ± 0.15 a | 29.92 | |
| 0.5 | 1.21 ± 0.45 a | 11.18 ± 1.02 ab | 12.39 ± 1.45 ab | 9.49 | 0.83 ± 0.01 a | 24.43 ± 0.22 a | 29.43 | |
| 0.7 | 1.47 ± 0.48 a | 12.23 ± 1.10 a | 13.70 ± 1.02 a | 10.79 | 0.83 ± 0.01 a | 23.97 ± 0.11 abc | 29.05 |
Note: SWC, SSC, NH4+-N, NO3–-N, SIN, TN, TC, C/N, and WHC denote soil water content, soil salt content, ammonium nitrogen, nitrate nitrogen, soil inorganic nitrogen, total nitrogen, total carbon, ratio of total carbon to total nitrogen, and water holding capacity, respectively. a, b, c, and d indicate the significant difference in each nitrogen and carbon index among the treatments (p < 0.05).
Table 3.
Results of multi-way analysis of variance (ANOVA) on soil mineral N variation under different incubation freezing–thawing temperature/cycles, SSC, and SWC (T: temperature; SSC: soil salt content; SWC: soil water content; FTC: number of freezing–thawing cycles; SIN: soil inorganic nitrogen).
| Factors | NH4+-N | NO3−-N | SIN | |||
|---|---|---|---|---|---|---|
| F | Sig. | F | Sig. | F | Sig. | |
| T | 3.830 | 0.010 * | 0.133 | 0.941 | 1.771 | 0.153 |
| SSC | 31.019 | 0.000 ** | 23.837 | 0.000 ** | 12.964 | 0.000 ** |
| SWC | 3.024 | 0.083 | 0.396 | 0.529 | 4.249 | 0.040 * |
| FTC | 1.815 | 0.144 | 2.345 | 0.073 | 6.408 | 0.000 ** |
| T × SSC | 1.097 | 0.362 | 1.433 | 0.149 | 0.920 | 0.527 |
| T × SWC | 0.078 | 0.972 | 0.676 | 0.568 | 0.907 | 0.438 |
| T × FTC | 0.156 | 0.998 | 0.374 | 0.947 | 0.472 | 0.893 |
| SSC × SWC | 4.040 | 0.003 * | 22.577 | 0.000 ** | 23.520 | 0.000 ** |
| SSC × FTC | 2.876 | 0.001 * | 5.191 | 0.000 ** | 7.843 | 0.000 ** |
| SWC × FTC | 1.723 | 0.162 | 3.391 | 0.018 * | 2.882 | 0.036 * |
| T × SSC × SWC | 0.466 | 0.933 | 0.567 | 0.868 | 0.493 | 0.918 |
| T × SSC × FTC | 0.248 | 1.000 | 0.415 | 0.999 | 0.326 | 1.000 |
| T × SWC × FTC | 0.255 | 0.986 | 0.806 | 0.611 | 0.510 | 0.867 |
| SSC × SWC × FTC | 1.178 | 0.298 | 7.681 | 0.000 ** | 4.932 | 0.000 ** |
| T × SSC × SWC × FTC | 0.173 | 1.000 | 0.578 | 0.976 | 0.39 | 0.999 |
**, p < 0.01; *, p < 0.05.
Table 4.
Results of multi-way analysis of variance (ANOVA) on Ra, Rnit, and Rmin under different incubation freezing–thawing temperatures/cycles, salinity, and soil moisture (T: temperature; SSC: soil salt content; SWC: soil water content; FTC: number of freezing–thawing cycles; Ra: net N ammonification rate; Rnit: net soil nitrification rate; Rmin: net soil nitrogen mineralization rate).
| Factors | Ra | Rnit | Rmin | |||
|---|---|---|---|---|---|---|
| F | Sig. | F | Sig. | F | Sig. | |
| T | 224.801 | 0.000 ** | 4.190 | 0.006 * | 4.299 | 0.005 * |
| SSC | 5.949 | 0.000 ** | 3.792 | 0.005 * | 1.700 | 0.150 |
| SWC | 23.045 | 0.000 ** | 0.112 | 0.738 | 0.286 | 0.593 |
| FTC | 635.058 | 0.000 ** | 1.234 | 0.297 | 1.420 | 0.237 |
| T × SSC | 5.275 | 0.000 ** | 1.435 | 0.148 | 1.468 | 0.135 |
| T × SWC | 5.948 | 0.001 * | 0.052 | 0.984 | 0.022 | 0.996 |
| T × FTC | 518.803 | 0.000 ** | 0.339 | 0.961 | 0.171 | 0.997 |
| SSC × SWC | 2.438 | 0.047 * | 2.005 | 0.094 | 1.343 | 0.254 |
| SSC × FTC | 18.891 | 0.000 ** | 1.039 | 0.412 | 0.685 | 0.766 |
| SWC × FTC | 18.450 | 0.000 ** | 1.333 | 0.264 | 0.202 | 0.895 |
| T × SSC × SWC | 1.892 | 0.035 * | 0.426 | 0.953 | 0.305 | 0.988 |
| T × SSC × FTC | 13.511 | 0.000 ** | 0.120 | 1.000 | 0.185 | 1.000 |
| T × SWC × FTC | 16.351 | 0.000 ** | 0.364 | 0.952 | 0.152 | 0.998 |
| SSC × SWC × FTC | 5.683 | 0.000 ** | 0.998 | 0.45 | 0.552 | 0.880 |
| T × SSC × SWC × FTC | 9.379 | 0.000 ** | 0.175 | 1.000 | 0.131 | 1.000 |
**, p < 0.01; *, p < 0.05.
Table 5.
Fitting lines of relative NH4+-N content and freezing temperature (SWC: soil water content; WHC: water holding capacity; SSC: soil salt content).
Table 5.
Fitting lines of relative NH4+-N content and freezing temperature (SWC: soil water content; WHC: water holding capacity; SSC: soil salt content).
| SSC | SWC = 40% WHC | SWC = 80% WHC | ||||
|---|---|---|---|---|---|---|
| Equation: Y = Relative content | R | Sig | Equation: Y = Relative Content | R | Sig | |
| 0.08 | Y = −0.0451T + 0.6226 | 0.8659 | 0.035 * | Y = −0.0454T + 0.7826 | 0.8821 | 0.030 * |
| 0.25 | Y = −0.0328T + 0.7401 | 0.6724 | 0.090 | Y = −0.029T + 1.0054 | 0.5937 | 0.115 |
| 0.35 | Y = −0.0332T + 0.7615 | 0.9975 | 0.001 ** | Y = −0.0256T + 0.7874 | 0.9206 | 0.020 * |
| 0.50 | Y = −0.0292T + 0.8411 | 0.8813 | 0.031 * | Y = −0.0163T + 0.8616 | 0.9443 | 0.014 * |
| 0.70 | Y = −0.0279T + 0.6816 | 0.9783 | 0.005 * | Y = −0.0135T + 0.7936 | 0.3240 | 0.215 |
**, p < 0.01; *, p < 0.05.
Publisher’s Note: MDPI stays neutral with regard to jurisdictional claims in published maps and institutional affiliations. |
© 2022 by the authors. Licensee MDPI, Basel, Switzerland. This article is an open access article distributed under the terms and conditions of the Creative Commons Attribution (CC BY) license (https://creativecommons.org/licenses/by/4.0/).
Share and Cite
MDPI and ACS Style
Zhao, Q.; Wu, J.; Guo, C.; Zhang, J.; Wang, X.; Liu, Y.; Zhao, H.; Zhang, R. Effects of Freezing–Thawing Processes on Net Nitrogen Mineralization in Salinized Farmland Soil. Agronomy 2022, 12, 2986. https://doi.org/10.3390/agronomy12122986
AMA Style
Zhao Q, Wu J, Guo C, Zhang J, Wang X, Liu Y, Zhao H, Zhang R. Effects of Freezing–Thawing Processes on Net Nitrogen Mineralization in Salinized Farmland Soil. Agronomy. 2022; 12(12):2986. https://doi.org/10.3390/agronomy12122986
Chicago/Turabian StyleZhao, Qiang, Jingwei Wu, Chenyao Guo, Jifeng Zhang, Xin Wang, Yawen Liu, Hang Zhao, and Rui Zhang. 2022. "Effects of Freezing–Thawing Processes on Net Nitrogen Mineralization in Salinized Farmland Soil" Agronomy 12, no. 12: 2986. https://doi.org/10.3390/agronomy12122986
Note that from the first issue of 2016, this journal uses article numbers instead of page numbers. See further details here.