
A Real-Time Adaptive Control System for Border Irrigation


1
State Key Laboratory of Hydrology–Water Resources and Hydraulic Engineering, Hohai University, Nanjing 210098, China
2
College of Agricultural Science and Engineering, Hohai University, Nanjing 210098, China
3
College of Hydrology and Water Resources, Hohai University, Nanjing 210098, China
4
Cooperative Innovation Center for Water Safety and Hydro Science, Hohai University, Nanjing 210098, China
*
Authors to whom correspondence should be addressed.
Agronomy 2022, 12(12), 2995; https://doi.org/10.3390/agronomy12122995
Submission received: 8 September 2022
/
Revised: 19 November 2022
/
Accepted: 25 November 2022
/
Published: 28 November 2022
(This article belongs to the Section Water Use and Irrigation)
Abstract
:The shortage of water resources makes it urgent to increase agricultural irrigation efficiency. In response to this need, this study develops a real-time adaptive control irrigation (RACI) system for border irrigation. Avoiding the need for traditional real-time control systems to calculate soil infiltration properties in real-time, RACI adjusts the inflow rate based on the difference between the actual and expected advance time. Simulations of the collected data are used to evaluate and analyze the sensitivity of RACI to input parameters, and field experiments were carried out to further verify the irrigation performance and efficiency. The experimental results indicate that RACI delivers an average application efficiency, distribution uniformity, requirement efficiency, and deep percolation of 0.930, 0.884, 0.954, and 0.070, respectively. A sensitivity analysis of irrigation input parameters (infiltration parameter, roughness coefficient, inflow rate, and slope) shows that the irrigation performance of RACI remains satisfactory even when the parameters are varied. Given the satisfactory irrigation performance and robustness and the more facile operation than traditional real-time control systems, RACI has the potential to become widely used.
1. Introduction
As a largely agricultural country, agricultural water accounts for about 62.14% of total water consumption in China [1]. In addition, with an annual average water resource of 2100 cubic meters per capita, which is only 28% of the world average [2], China is severely short of water. Given the rising urban and industrial demand for these limited water resources, water shortages in China are worsening [3,4]. In the North China Plain in particular, a severe water shortage has led to a large amount of groundwater being pumped for wheat irrigation, which is one of the main factors in groundwater drawdown [5,6]. Thus, the use of irrigation water must be mitigated to reduce the water-shortage problem. However, reducing irrigation water will reduce agricultural production, whereas more food will be needed to meet China’s expected demand [7]. Therefore, it is urgent and essential to increase irrigation efficiency and improve irrigation performance [8].
Economic conditions make surface irrigation the most widely used method for irrigating farmland in China, and this will not change in the near future. Due to the variability of input parameters for irrigation, such as roughness coefficient [9], soil infiltration properties [10,11], slope [12], and inflow rate [13], the actual surface irrigation performance fluctuates significantly and the irrigation efficiency is generally unsatisfactory. Significant research has been carried out to improve the performance of surface irrigation. For example, Bai et al. [14] improved irrigation performance by optimizing the cutoff time. Chen et al. [15] optimized the border dimensions on the irrigation districts along the lower Yellow River and increased the application efficiency. Santos [16] analyzed how inflow and cutoff time affect distribution uniformity and proposed the optimum combination of inflow rate and cutoff time. Some studies [17,18] advocated increasing the inflow rate to improve irrigation performance and robustness. Smith and Uddin [19] analyzed the flow rate required to achieve maximum efficiency and produced real-time estimates of the optimum irrigation duration. However, other statistical irrigation results at different inflow rates reduce the advantage of a high inflow rate [20]. Salahou et al. [21] studied distance-based cutoff border irrigation, which is the most used irrigation technique in the North China Plain, and showed that proper cutoff distance somewhat alleviates the adverse effect of variability in irrigation parameters. These optimization schemes are characterized by a constant inflow rate across the entire border, and the optimizations are based on adequate measurement of irrigation input parameters.
Given the potential of both overcoming the variations of irrigation input parameters and reducing labor requirements, a real-time control system for surface irrigation was developed. Latimer and Reddell [22] developed a real-time feedback control system that uses rate-of-advance data to obtain infiltration characteristics and calculated the appropriate inflow rate and cutoff time. Khatri and Smith [23] proposed a simple real-time control system that simulates the irrigation to determine the best cutoff time by predicting soil infiltration properties based on the infiltration-curve model and scaling during an irrigation event. Koech et al. [24] developed an automated, real-time optimization system, with components including sensors of inflow rate and advance time and programs for scaling the soil infiltration properties and simulating irrigation, which automatically adjusts the cutoff time. The current real-time control irrigation systems are developed by simulating the irrigation process to determine the optimal inflow rate or cutoff time through monitoring the surface flow advance process and estimating soil infiltration properties in real-time. These systems notably estimate the soil infiltration properties [25], which is also the main difference between such systems. Real-time control irrigation systems have improved irrigation efficiency because of the ability to adapt management strategies in real-time to suit the prevailing soil conditions. Real-time optimization of the irrigation process is under development and has shown its potential for saving water and labor [26,27,28]. However, current real-time control irrigation systems require precise inflow rate sensors and complex calculations in a short time, which limits the widespread use of systems.
This study thus develops a system for real-time adaptive control irrigation (RACI). The inflow rate adjustment of RACI is based on the difference between the actual and expected advance time. RACI was compared with the optimal distance-based cutoff irrigation (ODCI), which is the most used optimization scheme in the North China Plain. In addition, RACI is further verified by comparison with field experiments.
2. Materials and Methods
2.1. Description of Real-Time Adaptive Control Irrigation
RACI is based on traditional ODCI. Therefore, as with ODCI, the optimal combination of inflow rate and cutoff-distance ratio for a selected border is formulated to obtain the expected advance trajectory and the amount of irrigation water. The specific steps are as follows: (1) Select a border at random to measure the slope, infiltration parameters, and roughness coefficient. (2) Determine the optimal combination of inflow rate and cutoff-distance ratio based on existing studies [21] or on the operation analysis model WinSRFR, which is a widely used software package for analyzing surface-irrigation systems and simulating border irrigation [29]. (3) Enter the slope, infiltration parameters, roughness coefficient, inflow rate, and cutoff-distance ratio into the WinSRFR simulation to predict the advance trajectory and the amount of irrigation water, which are called the “expected advance trajectory” and the “expected amount of irrigation water”, respectively.
If the ODCI scheme is directly applied to other borders, the irrigation quality decreases significantly because of the variation in the irrigation parameters (roughness coefficient, soil infiltration properties, and slope). The traditional real-time control irrigation calculates the parameters of each border in real time and formulates the irrigation scheme during the irrigation process. To avoid calculating the irrigation parameters for each border in real time, RACI adjusts the inflow rate according to the expected advance trajectory. As shown in Figure 1, when the surface flow reaches the observation points, the measured advance time is compared with the expected optimal advance time. The inflow rate decreases to qmin when the measured advance time is less than the expected advance time, otherwise, the inflow rate increases to qmax, and inflow is cut off when the amount of irrigation water reaches the expected amount. Given that, in a closed-ended border irrigation system, the surface flow fluctuates near the upper boundary, stabilizes after reaching a certain distance [14], and cuts off before reaching the border [21], the observation points should be in the middle of the border. For the test border (border length of 100 m), the observation points are at 40, 50, 60, 65, and 70 m. Limited by water source, pump, and other conditions, the inflow rate ranges roughly from 3 to 7 L s−1 m−1 for closed-ended border irrigation in the North China Plain [30]. Therefore, in this study, qmax and qmin are 7 and 3 L s−1 m−1, respectively.
2.2. Field Experiment and Data Measurement
The experiments were conducted at the Nanpi Ecological Agricultural Experiment Station, Hebei Province, China (116°40′ E, 38°06′ N) in 2015 and 2019. This area has a continental monsoon climate. The mean annual precipitation at the study site is 567.4 mm and generally occurs during the summer (approximately 73% of the annual rainfall). The mean annual temperature and sunshine hours are 12.3 °C and 2938.6 hr, respectively. The soil is classified as a silt loam (67.02% silt, 25.19% sand, and 7.79% clay, on average) and the average dry bulk density is 1.45 g/cm3 at a depth of 1 m. Winter wheat is the main crop. Like the local border forms, all experimental borders were 100 m in length and close-ended.
To obtain irrigation input parameters for a RACI simulation, a first set of irrigation experiments was conducted in 2015 [21]. Winter wheat was planted on 15 October 2014 and harvested in the middle of June 2015. Pre-sowing irrigation and spring irrigation were conducted. The experiment was conducted during the spring irrigation event. As in the local area, the applied water depth was 60 mm [21]. The irrigation treatment was carried out in accordance with local customs without additional optimization. The slope of each border was measured using an optical level DSZ2 (±1 mm) before irrigation. Infiltration parameters and the roughness coefficient were obtained by the trial-and-error approach with the aid of WinSRFR [21,29]. The measured irrigation input parameters are listed in Table 1. ODCI and RACI are simulated based on the measured parameters, and the irrigation performances are compared with each other to evaluate RACI. In addition, the sensitivity of RACI was also analyzed based on the measured parameters.
To further verify the excellent performance of RACI, supplementary field experiments were conducted at the 2021 jointing stage of winter wheat. Winter wheat was planted on 18 October 2020 and harvested on 11 June 2021. Irrigation was undertaken only at the jointing stage, which is the most important irrigation period in the wheat-growing process in the North China Plain [31,32]. The required application water depth was obtained by multiplying the required increment of soil volume water content before and after irrigation (the difference between 70% field capacity and soil volume water content before irrigation) by the root zone depth [33]. The field capacity was 45.5%, soil volume water content before irrigation was 20.4%, root zone was 1 m, and the required application water depth was calculated as 114.5 mm. For convenience of implementation, the applied water depth was set as 120 mm (36 m3 for each border). A random border was selected, and longitudinal slopes were measured at 5 m intervals. The border was then irrigated and advance and recession curves were determined to obtain the roughness coefficient and infiltration parameters k = 85 mm hr−α, a = 0.44, and n = 0.28. The ODCI scheme, expected advance trajectory, expected amount of irrigation water, and the RACI scheme were then obtained in turn by using the method introduced above. The expected amount of irrigation water was 36.76 m3, and the ODCI and RACI results are listed in Table 2. Each treatment was repeated for three borders. The soil moisture content in the root zone was measured by drying weighing to assess the irrigation performance. The inflow rates of every border were measured by using an electromagnetic flow meter (accuracy of ±1.5%).
2.3. Assessment of Irrigation Performance
The performance of closed-ended border irrigation can be evaluated by application efficiency (AE), distribution uniformity (DU), requirement efficiency (RE), and deep percolation (DP) [34,35,36]. AE is defined as the ratio of the average infiltrated-water depth in the root zone to the average applied water depth. DU is a measure of the degree of uniformity of the irrigation water applied across the border. RE is defined as the ratio of the average infiltrated-water depth in the root zone to the required water depth. Finally, DP is a measure of water that is unavailable due to deep percolation in irrigation water. These indicators are expressed as percentages. The closer AE, DU, and RE approach to unity and DP approaches zero, the better the irrigation performance is. AE, DU, RE, and DP are expressed as:
where hi is the infiltrated-water depth in the root zone, zi is the infiltrated water depth, n is the number of stations along the border length, zr is the required water depth, and zd is the infiltrated-water depth beyond the root zone.
2.4. Statistical Test
In order to compare the irrigation performance of each scheme (Original irrigation, ODCI, and RACI scheme), the Duncan test (p = 0.05) was used to test the significant differences, and the independent sample t-test was used to further determine differences between ODCI and RACI [30].
3. Results and Discussion
3.1. Assessment of Real-Time Adaptive Control Irrigation by Simulation
3.1.1. Analysis of Irrigation Performance
Using WinSRFR simulation model, RACI was assessed with the experimental data (borders S1–S9). Border S5 is randomly selected, and the corresponding ODCI and RACI schemes are determined as per the method given in Section 2.1. The optimal inflow rate and cutoff-distance ratio (ODCI scheme) are 5.5 L s−1 m−1 and 0.85, respectively, and the expected amount of irrigation water was 23.45 m3. RACI schemes for other borders are simulated by WinSRFR, as given in Table 3.
Figure 2 shows the irrigation performance of each scheme. The average AE values of the original, ODCI, and RACI are 0.847, 0.868, and 0.922, respectively. The AE values for RACI significantly exceed those of the original and of the ODCI (Figure 2A). The original, ODCI, and RACI schemes produce average values of 0.877, 0.912, and 0.919 for DU and 0.962, 0.990, and 0.982 for RE, respectively. The original, ODCI, and RACI have no significant difference in their values (Figure 2B,C). The DP value of RACI is 0.078, which is significantly less than that of the original and of ODCI (Figure 2D). Compared with the original and ODCI, RACI increases irrigation water-use efficiency and reduces the deep percolation loss. In addition, the variation in all irrigation performance indexes is minimal for RACI, indicating that RACI is the most robust.
Taking border S2 as an example, we now further explain how RACI improves irrigation performance. Because the infiltration parameter k of S2 exceeds that of S5 (Table 1), the water flow is lower at border S2. If the ODCI scheme obtained based on border S5 is directly applied to border S2, the water flow will take longer than expected to reach the cutoff distance, which leads to more infiltration water than expected in the front section of the border field. For RACI, the inflow rate increases (5.5 to 7.0 L s−1 m−1) because the actual advance time is longer than expected at the observation point. Increasing the inflow rate accelerates the surface water flow, reduces the infiltration time in the front section of the border field, reduces the amount of water that infiltrates, improves the irrigation efficiency, and reduces the deep percolation of irrigation water (Figure 3). Similarly, if the infiltration parameters are smaller than expected, the water flow will advance too fast. In RACI system, the inflow rate will be reduced, then the infiltration time will be increased to improve the irrigation performance.
3.1.2. Sensitivity Analysis
To further prove the robustness of RACI, we analyze the sensitivity to the irrigation input parameters (infiltration parameter k, roughness coefficient n, inflow rate q, and slope s). The range of each parameter is determined based on the field data: k ranges from 110 to 140 mm hr−α, n ranges from 0.05 to 0.1, q ranges from −15% to 15%, and s ranges from 0.001 to 0.004. In the interest of brevity, the analysis of the sensitivity to a certain parameter is done with the remaining parameters held constant according to border S5. Figure 4 shows how the irrigation performance index is perturbed by variations in the irrigation input parameters. The variations in AE, DU, and RE caused by variations in the irrigation input parameters are generally consistent and opposite to variations in DP. The parameters q and s have a slightly greater impact on the irrigation performance than do k and n. In general, the variability in the irrigation input parameters decreases the irrigation performance. However, for RACI, AE and DU almost exceed 0.90, RE almost exceeds 0.95, and DP is almost less than 0.1. According to Salahou et al. [21], ODCI produces AE, DU, and RE values of 0.85–1.0, 0.85–0.9, and 0.85–1.0, respectively, for s in the range 0.001–0.004, and 0.75–0.95, 0.85–0.9, 0.95–1.0 for n in the range 0.06–0.1. The robustness of RACI is more satisfactory.
3.2. Experimental Verification
Table 4 shows the measured inflow rate and amount of irrigation water. The inflow rate is difficult to control in the border irrigation systems, especially in the border irrigation systems with variable discharge. The average relative error between actual inflow rate and expectation is about 12%. Although RACI is designed to cut off once the expected amount of irrigation water (36.76 m3) is reached, small deviations appear in the actual amount of irrigation water due to operational error. The irrigation water amount of ODCI is significantly greater than that of RACI (at p = 0.05 based on the in-dependent sample t-test).
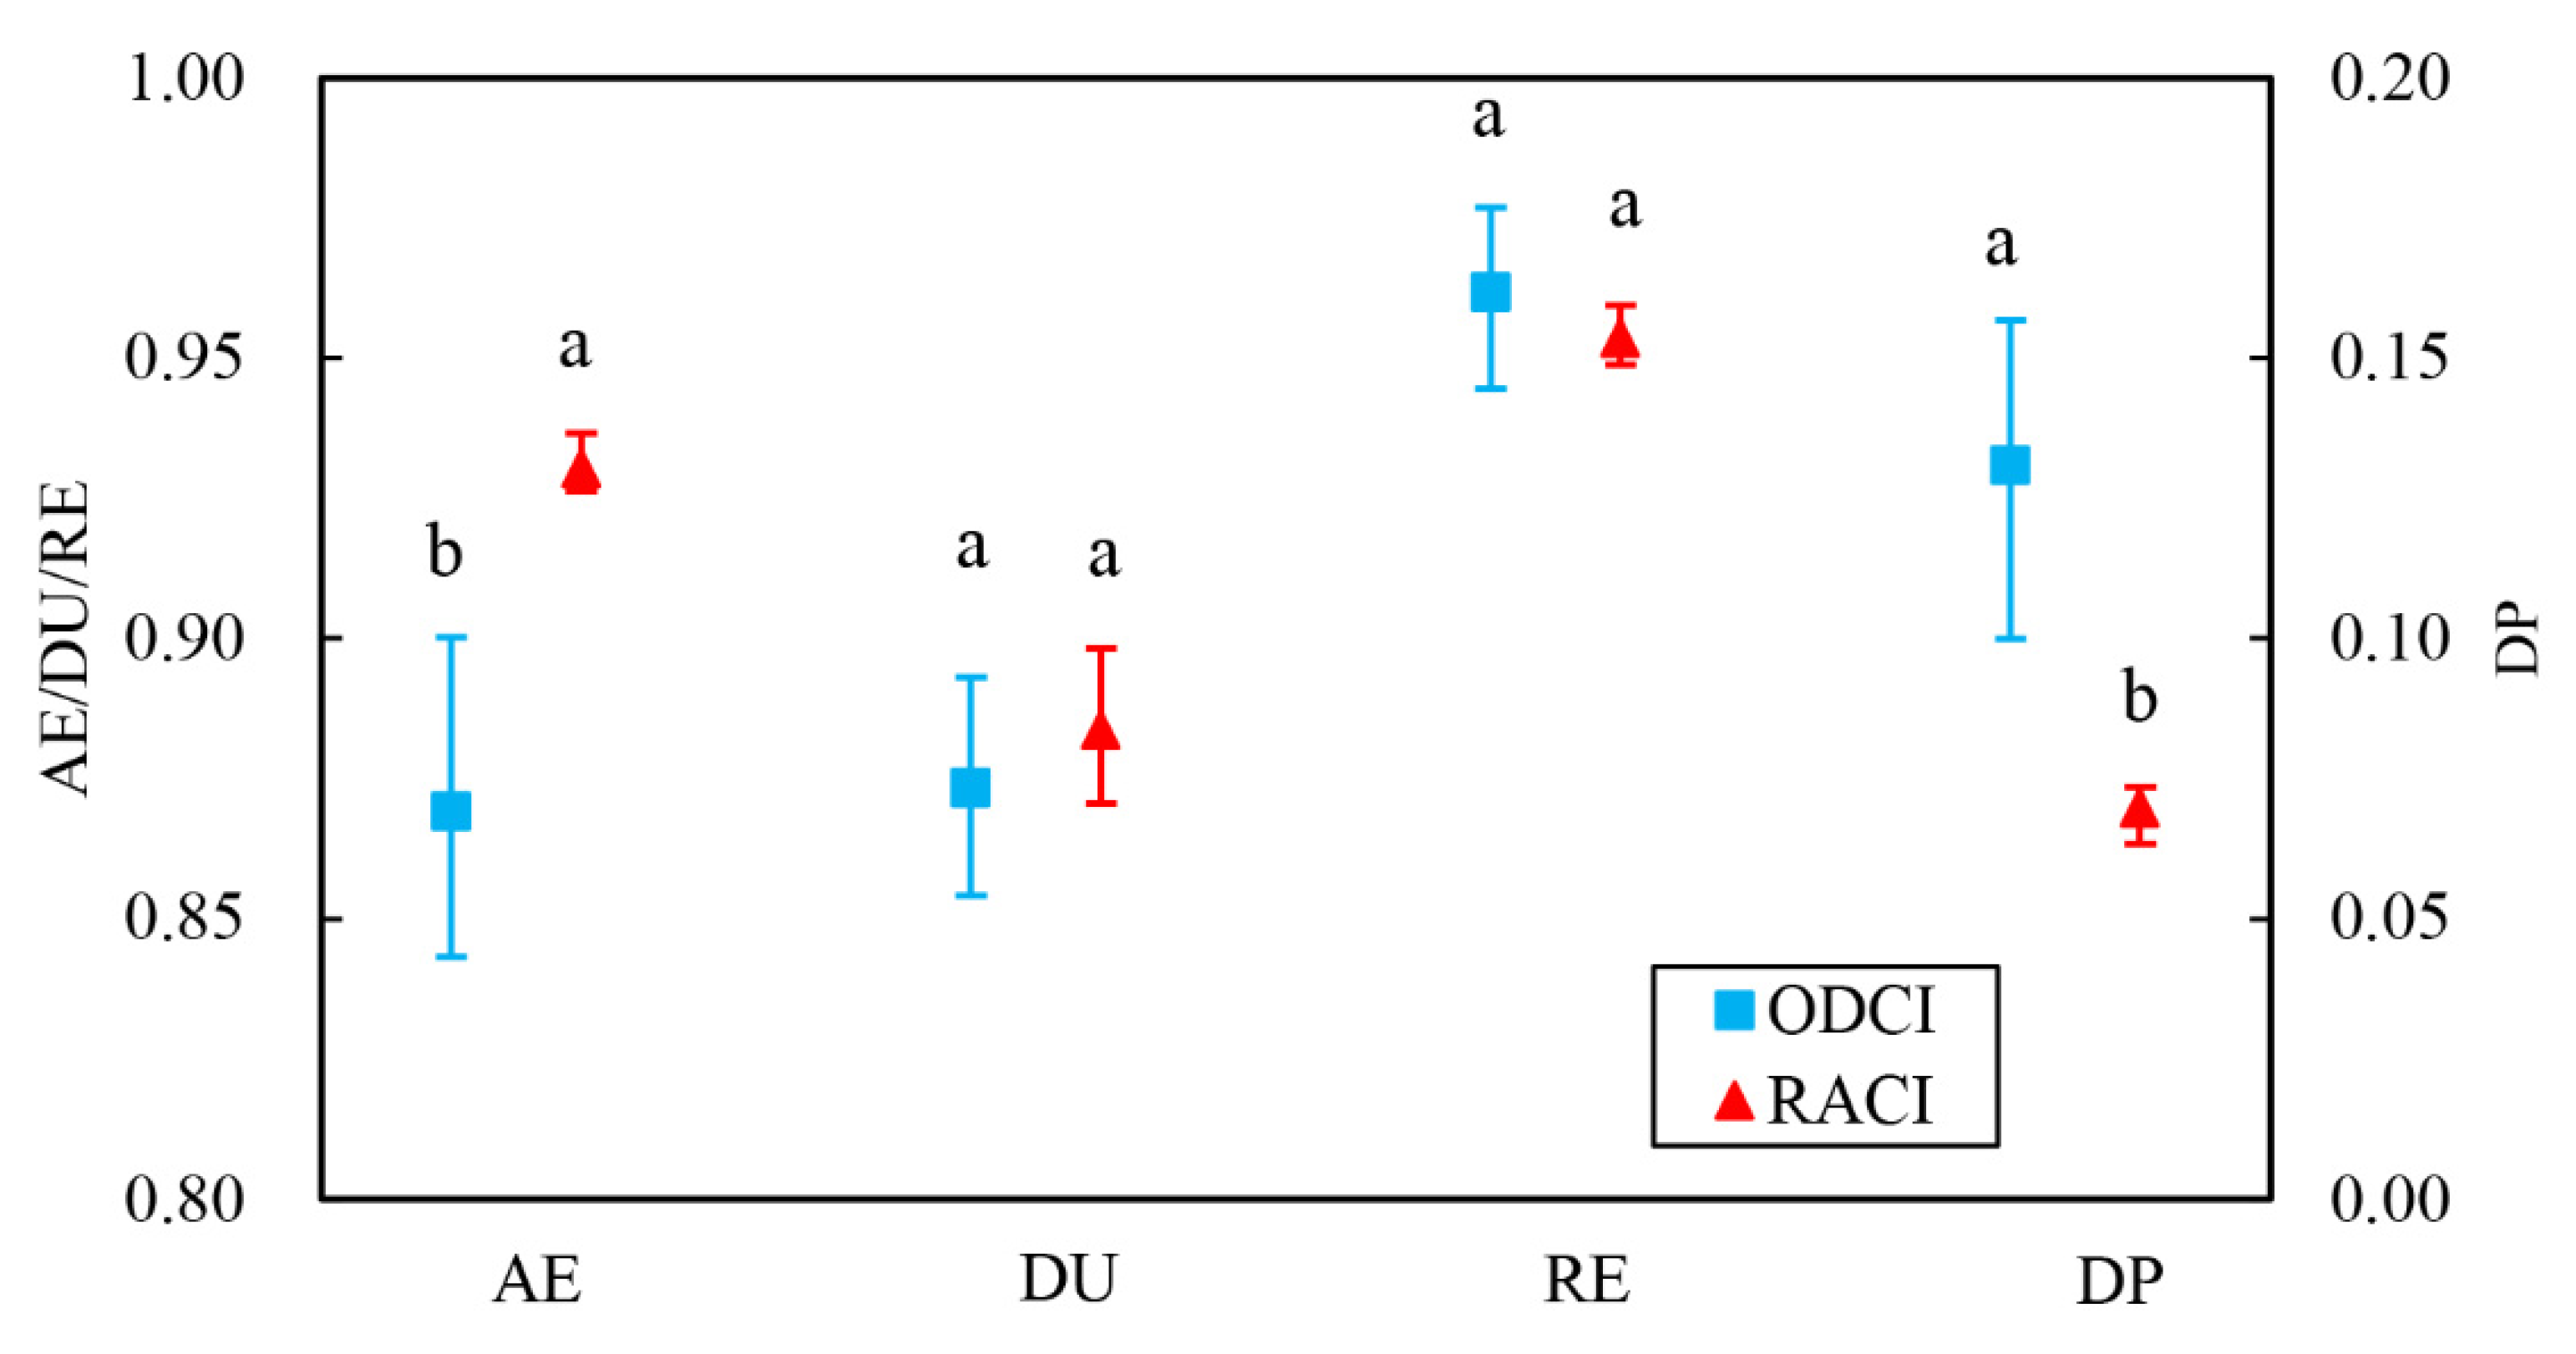
Figure 5 shows the results of border irrigation experiments. For ODCI, the average values of AE, DU, RE, and DP are 0.869, 0.873, 0.962, and 0.131, respectively. The results are generally consistent with the border irrigation tests conducted by Salahou et al. [21]. For RACI, the average values of AE, DU, RE, and DP are 0.930, 0.884, 0.954, and 0.070, respectively. For RACI, AE is significantly greater than for ODCI and DP is significantly less than for ODCI. DU and RE do not differ significantly between RACI and ODCI. The average amount of deep percolation water per border is 5.19 m3 for ODCI and 2.57 m3 for RACI. RACI thus saves about 7.3% of irrigation water when compared to ODCI. Like the simulation results, the irrigation-performance indicators of RACI vary little between borders.
3.3. Comparison of RACI with Traditional Real-Time Control Irrigation
Real-time control irrigation calculates parameters (mostly soil infiltration parameters) in real-time and adjusts irrigation strategies to adapt to current border conditions, thereby significantly improving irrigation performance. Shahidian et al. [37] evaluated their real-time feedback surface irrigation system in a field organized in contour terraces with furrows of various lengths. Test results showed that their system can greatly save water and labor, and can produce irrigation events with more than 90% application efficiency. Khatri et al. [38] used two field experiments to verify their real-time optimization and control system and obtained AE, RE, and DU of 0.925, 0.923, and 0.934, respectively, for one field and 0.885, 0.905, and 0.935, respectively, for the other field. The real-time feedback control border irrigation experiments of Wu et al. [39] in Hebei Province, China obtained irrigation performance worse than that of other studies, with average AE, DU, and RE of 0.765, 0.702, and 1.000, respectively. On the one hand, their irrigation strategy was conservative, and they tended to use more water to avoid under-irrigation (this was also the reason why RE reached 1.000). On the other hand, they had a long test border length of 370 m, which increases the risk of poor irrigation performance. For RACI, the average values of AE, DU, and RE are 0.930, 0.884, and 0.954, respectively, reflecting a high irrigation performance like traditional real-time control irrigation systems.
Finally, due to different control strategies, RACI does not need to calculate irrigation parameters in real-time. Therefore, RACI differs from traditional real-time control irrigation in operational and computational characteristics (see comparisons in Table 5).
4. Conclusions
This study develops a real-time adaptive control irrigation (RACI) system. RACI increases or decreases the inflow rate based on differences between the actual and expected advance time, thereby avoiding the calculation of soil-infiltration properties. Simulations and experiments indicated that RACI offers satisfactory irrigation performance and robustness. Compared with the optimal distance-based cutoff irrigation scheme, RACI saves about 7.3% of irrigation water due to the reduction of deep leakage.
Compared with traditional real-time control irrigation systems, RACI does not require accurate measurement and control of inflow rate (a sensitivity analysis shows that a 10% error in inflow rate does not significantly affect the irrigation performance of RACI), which allows it to avoid making complex calculations in a short timeframe. Economically and technically, RACI has the potential to be widely used in undeveloped areas.
RACI is analyzed and verified herein based on the border irrigation of winter wheat in the North China Plain. The field characteristics and irrigation conditions, especially the inflow rate range, may differ significantly for other irrigation events in other areas. Therefore, further research should be conducted in different fields to verify the universality of the proposed irrigation scheme.
Supplementary Materials
The following supporting information can be downloaded at: https://www.mdpi.com/article/10.3390/agronomy12122995/s1.
Author Contributions
Conceptualization, K.L. and X.J.; methodology, K.L.; software, K.L. and Z.G.; validation, X.J., J.L. and W.G.; formal analysis, K.L. and J.L.; investigation, K.L.; resources, X.J.; data curation, J.L. and Z.G.; writing—original draft preparation, K.L.; writing—review and editing, X.J., J.L., Z.G. and W.G.; visualization, W.G.; supervision, K.L. and X.J.; project administration, X.J.; funding acquisition, K.L. and X.J. All authors have read and agreed to the published version of the manuscript.
Funding
This research was funded by the National Natural Science Foundation of China (No. 51879073); the Fundamental Research Funds for the Central Universities (No. B220202033); the Jiangsu Key Research and Development Program (BE2022390); the National Natural Science Foundation of China (51609064).
Data Availability Statement
Data is contained within the article or supplementary material.
Conflicts of Interest
The authors declare no conflict of interest.
References
- China Statistics Press. China Statistical Yearbook; China Statistics Press: Beijing, China, 2021.
- Kang, S.; Hao, X.; Du, T.; Tong, L.; Su, X.; Lu, H.; Li, X.; Huo, Z.; Li, S.; Ding, R. Improving agricultural water productivity to ensure food security in China under changing environment: From research to practice. Agric. Water Manag. 2017, 179, 5–17. [Google Scholar] [CrossRef]
- Yin, Z.Y.; Jia, B.Y.; Wu, S.Q.; Dai, J.Y.; Tang, D.S. Comprehensive Forecast of Urban Water-Energy Demand Based on a Neural Network Model. Water 2018, 10, 385. [Google Scholar] [CrossRef] [Green Version]
- Gu, Z.; Qi, Z.M.; Burghate, R.; Yuan, S.Q.; Jiao, X.Y.; Xu, J.Z. Irrigation Scheduling Approaches and Applications: A Review. J. Irrig. Drain. Eng. 2020, 146, 04020007. [Google Scholar] [CrossRef]
- Yang, Y.; Watanabe, M.; Zhang, X.; Zhang, J.; Wang, Q.; Hayashi, S. Optimizing irrigation management for wheat to reduce groundwater depletion in the piedmont region of the Taihang Mountains in the North China Plain. Agric. Water Manag. 2006, 82, 25–44. [Google Scholar] [CrossRef]
- Lv, L.; Yao, Y.; Zhang, L.; Dong, Z.; Jia, X.; Liang, S.; Ji, J. Winter wheat grain yield and its components in the North China Plain: Irrigation management, cultivation, and climate. Chil. J. Agric. Res. 2013, 73, 233–242. [Google Scholar] [CrossRef] [Green Version]
- Zhang, F.; Chen, X.; Vitousek, P.M. Chinese agriculture: An experiment for the world. Nature 2013, 497, 33–35. [Google Scholar] [CrossRef]
- Abioye, E.A.; Abidin, M.S.Z.; Mahmud, M.S.A.; Buyamin, S.; Ishak, M.H.I.; Abd Rahman, M.K.I.; Otuoze, A.O.; Onotu, P.; Ramli, M.S.A. A review on monitoring and advanced control strategies for precision irrigation. Comput. Electron. Agric. 2020, 173, 22. [Google Scholar] [CrossRef]
- Xu, J.; Cai, H.; Saddique, Q.; Wang, X.; Li, L.; Ma, C.; Lu, Y. Evaluation and optimization of border irrigation in different irrigation seasons based on temporal variation of infiltration and roughness. Agric. Water Manag. 2019, 214, 64–77. [Google Scholar] [CrossRef]
- Nie, W.B.; Li, Y.B.; Zhang, F.; Ma, X.Y. Optimal discharge for closed-end border irrigation under soil infiltration variability. Agric. Water Manag. 2019, 221, 58–65. [Google Scholar] [CrossRef]
- Mazarei, R.; Mohammadi, A.S.; Ebrahimian, H.; Naseri, A. Temporal variability of infiltration and roughness coefficients and furrow irrigation performance under different inflow rates. Agric. Water Manag. 2021, 245, 106465. [Google Scholar] [CrossRef]
- Gonzalez, C.R.; Cervera, L.; Moretfernandez, D. Basin irrigation design with longitudinal slope. Agric. Water Manag. 2011, 98, 1516–1522. [Google Scholar] [CrossRef] [Green Version]
- Smith, R.J.; Gillies, M.H. Head ditch hydraulics and the variability of inflows to irrigation furrows. Irrig. Drain. 2010, 59, 442–452. [Google Scholar] [CrossRef] [Green Version]
- Bai, M.; Li, Y.; Tu, S.; Liu, Q. Analysis on cutoff time optimization of border irrigation to improve irrigated water quality. Trans. Chin. Soc. Agric. Eng. 2016, 32, 105–110. [Google Scholar]
- Chen, B.; Ouyang, Z.; Sun, Z.G.; Wu, L.F.; Li, F.D. Evaluation on the potential of improving border irrigation performance through border dimensions optimization: A case study on the irrigation districts along the lower Yellow River. Irrig. Sci. 2013, 31, 715–728. [Google Scholar] [CrossRef]
- Santos, F.L. Evaluation and adoption of irrigation technologies: Management-design curves for Furrow and Level Basin systems. Agric. Syst. 1996, 52, 317–329. [Google Scholar] [CrossRef]
- Gillies, M.; Smith, R.; Williamson, B.; Shanahan, M. Improving Performance of Bay Irrigation through Higher Flow Rates; Irrigation Australia Ltd.: Sydney, Australia, 2010; pp. 8–10. [Google Scholar]
- Smith, R.J.; Uddin, J.M.; Gillies, M.H.; Moller, P.; Clurey, K. Evaluating the performance of automated bay irrigation. Irrig. Sci. 2016, 34, 175–185. [Google Scholar] [CrossRef]
- Smith, R.J.; Uddin, M.J. Selection of flow rate and irrigation duration for high performance bay irrigation. Agric. Water Manag. 2020, 228, 11. [Google Scholar] [CrossRef]
- Morris, M.R.; Hussain, A.; Gillies, M.H.; O’Halloran, N.J. Inflow rate and border irrigation performance. Agric. Water Manag. 2015, 155, 76–86. [Google Scholar] [CrossRef]
- Salahou, M.K.; Jiao, X.; Lü, H. Border irrigation performance with distance-based cut-off. Agric. Water Manag. 2018, 201, 27–37. [Google Scholar] [CrossRef]
- Latimer, E.; Reddell, D. Components for an advance rate feedback irrigation system (ARHS). Trans. ASAE 1990, 33, 1162–1170. [Google Scholar] [CrossRef]
- Khatri, K.L.; Smith, R. Toward a simple real-time control system for efficient management of furrow irrigation. Irrig. Drain. J. Int. Comm. Irrig. Drain. 2007, 56, 463–475. [Google Scholar] [CrossRef]
- Koech, R.K.; Smith, R.J.; Gillies, M.H. A real-time optimisation system for automation of furrow irrigation. Irrig. Sci. 2014, 32, 319–327. [Google Scholar] [CrossRef]
- Nie, W.B.; Feng, Z.J.; Li, Y.B.; Zhang, F.; Ma, X.Y. Determining a reasonable distance of collecting irrigation data for real-time management of furrow irrigation. Irrig. Drain. 2022, 1–17. [Google Scholar] [CrossRef]
- Masseroni, D.; Ricart, S.; de Cartagena, F.R.; Monserrat, J.; Goncalves, J.M.; de Lima, I.; Facchi, A.; Sali, G.; Gandolfi, C. Prospects for Improving Gravity-Fed Surface Irrigation Systems in Mediterranean European Contexts. Water 2017, 9, 20. [Google Scholar] [CrossRef] [Green Version]
- Koech, R.; Langat, P. Improving Irrigation Water Use Efficiency: A Review of Advances, Challenges and Opportunities in the Australian Context. Water 2018, 10, 1771. [Google Scholar] [CrossRef] [Green Version]
- Uddin, J.; Smith, R.J.; Gillies, M.H.; Moller, P.; Robson, D. Smart Automated Furrow Irrigation of Cotton. J. Irrig. Drain. Eng. 2018, 144, 10. [Google Scholar] [CrossRef] [Green Version]
- Bautista, E.; Clemmens, A.J.; Strelkoff, T.S.; Schlegel, J. Modern analysis of surface irrigation systems with WinSRFR. Agric. Water Manag. 2009, 96, 1146–1154. [Google Scholar] [CrossRef]
- Liu, K.H.; Jiao, X.Y.; Guo, W.H.; An, Y.H.; Salahou, M.K. Improving border irrigation performance with predesigned varied-discharge. PLoS ONE 2020, 15, e0232751. [Google Scholar] [CrossRef]
- Li, Q.Q.; Dong, B.D.; Qiao, Y.Z.; Liu, M.Y.; Zhang, J.W. Root growth, available soil water, and water-use efficiency of winter wheat under different irrigation regimes applied at different growth stages in North China. Agric. Water Manag. 2010, 97, 1676–1682. [Google Scholar] [CrossRef]
- Zhang, D.; Li, R.Q.; Batchelor, W.D.; Ju, H.; Li, Y.M. Evaluation of limited irrigation strategies to improve water use efficiency and wheat yield in the North China Plain. PLoS ONE 2018, 13, e0189989. [Google Scholar] [CrossRef] [Green Version]
- He, X.; Lin, X.; Gu, S.; Wang, D. Effects of supplemental irrigation with micro-sprinkling hoses on soil physical properties, water consumption and grain yield of winter wheat. Acta Agron. Sin. 2019, 45, 879–892. [Google Scholar] [CrossRef]
- Burt, C.M.; Clemmens, A.J.; Strelkoff, T.S.; Solomon, K.H.; Bliesner, R.D.; Hardy, L.A.; Howell, T.A.; Eisenhauer, D.E. Irrigation performance measures: Efficiency and uniformity. J. Irrig. Drain. Eng. 1997, 123, 423–442. [Google Scholar] [CrossRef] [Green Version]
- Koech, R.K.; Smith, R.J.; Gillies, M.H. Evaluating the performance of a real-time optimisation system for furrow irrigation. Agric. Water Manag. 2014, 142, 77–87. [Google Scholar] [CrossRef]
- Gillies, M.H.; Smith, R.J.; Raine, S.R. Evaluating whole field irrigation performance using statistical inference of inter-furrow infiltration variation. Biosys. Eng. 2011, 110, 134–143. [Google Scholar] [CrossRef] [Green Version]
- Shahidian, S.; Serralheiro, R.P.; Serrano, J.M. Practical issues in developing a smart surface irrigation system with real-time simulation of furrow advance. Irrig. Drain. 2013, 62, 25–36. [Google Scholar] [CrossRef] [Green Version]
- Khatri, K.L.; Memon, A.A.; Shaikh, Y.; Pathan, A.; Shah, S.A.; Pinjani, K.K.; Soomro, R.; Smith, R.; Almani, Z. Real-Time Modelling and Optimisation for Water and Energy Efficient Surface Irrigation. J. Water Resour. Prot. 2013, 5, 681–688. [Google Scholar] [CrossRef]
- Wu, C.; Xu, D.; Bai, M.; Li, Y.; Li, F. Real-time feedback control technology for precise furrow irrigation. J. Drain. Irrig. Mach. Eng. 2020, 38, 536–540. [Google Scholar]
Figure 1.
Schematic diagram of improved real-time control irrigation scheme.
Figure 2.
Boxplots illustrating the (A) AE, (B) DU, (C) RE, and (D) DP of each scheme. Boxplots labeled with different letters indicate significant differences at p = 0.05, based on the Duncan test.
Figure 2.
Boxplots illustrating the (A) AE, (B) DU, (C) RE, and (D) DP of each scheme. Boxplots labeled with different letters indicate significant differences at p = 0.05, based on the Duncan test.
Figure 3.
(A) Advance and recession trajectories and (B) infiltrated-water depths compared between ODCI and RACI for border S2.
Figure 3.
(A) Advance and recession trajectories and (B) infiltrated-water depths compared between ODCI and RACI for border S2.
Figure 4.
Sensitivity analysis of infiltration parameter k, roughness coefficient n, inflow rate q, and slope s.
Figure 4.
Sensitivity analysis of infiltration parameter k, roughness coefficient n, inflow rate q, and slope s.
Figure 5.
Experimental results for border irrigation for AE, DU, RE, and DP. The vertical bars labeled with “a” and “b” for each irrigation performance indicator indicate significant differences at p = 0.05 based on the independent sample t-test.
Figure 5.
Experimental results for border irrigation for AE, DU, RE, and DP. The vertical bars labeled with “a” and “b” for each irrigation performance indicator indicate significant differences at p = 0.05 based on the independent sample t-test.

Table 1.
Input parameters of each border for surface irrigation.
| Border | Average Slope s | Kostiakov Infiltration Parameters | Roughness Coefficient n | |
|---|---|---|---|---|
| k (mm hr−α) | a | |||
| S1 | 0.0022 | 104.607 | 0.68 | 0.095 |
| S2 | 0.0023 | 134.966 | 0.68 | 0.060 |
| S3 | 0.0023 | 130.123 | 0.68 | 0.065 |
| S4 | 0.0024 | 130.067 | 0.68 | 0.065 |
| S5 | 0.0025 | 122.236 | 0.68 | 0.060 |
| S6 | 0.0022 | 111.160 | 0.68 | 0.060 |
| S7 | 0.0014 | 122.771 | 0.68 | 0.060 |
| S8 | 0.0024 | 119.340 | 0.68 | 0.075 |
| S9 | 0.0017 | 110.402 | 0.68 | 0.060 |
Note: Data from the research of Salahou, Jiao and Lü [21].
Table 2.
Experimental treatment design of ODCI and RACI.
| Border | Treatment | Initial Inflow Rate (L s−1 m−1) | Expected Advance Time of Observation Points (min) | Condition for Cutoff | ||||
|---|---|---|---|---|---|---|---|---|
| 40 m | 50 m | 60 m | 65 m | 70 m | ||||
| A1–A3 | ODCI | 4 | — | — | — | — | — | Inflow advances to 80 m |
| B1–B3 | RACI | 4 | 21.56 | 29.13 | 36.70 | 40.37 | 44.02 | Irrigation water amount reaches 36.76 m3 |
Note: for ODCI, the inflow rate remains constant until cutoff; for RACI, if the actual measured advance time is longer than expected, the inflow rate will be increased to 7 L s−1 m−1, and if the actual measured advance time is shorter than expected, the inflow rate will be reduced to 3 L s−1 m−1.
Table 3.
Original irrigation, ODCI, and RACI schemes for borders S1–S9.
| Border | Original Irrigation Scheme | ODCI Scheme | RACI Scheme | |||||||
|---|---|---|---|---|---|---|---|---|---|---|
| Inflow Rate (L s−1 m−1) | Cutoff-Distance Ratio | Inflow Rate (L s−1 m−1) | Cutoff-Distance Ratio | Initial Inflow Rate (L s−1 m−1) | First Adjustment | Second Adjustment | Cutoff Time (min) | |||
| Advance of Adjustment (m) | Inflow Rate after Adjustment (L s−1 m−1) | Advance of Adjustment (m) | Inflow Rate after Adjustment (L s−1 m−1) | |||||||
| S1 | 4.87 | 0.80 | 5.5 | 0.85 | 5.5 | 40 | 7 | — | — | 16.86 |
| S2 | 4.82 | 0.80 | 5.5 | 0.85 | 5.5 | 40 | 7 | — | — | 16.62 |
| S3 | 4.84 | 0.80 | 5.5 | 0.85 | 5.5 | 40 | 7 | — | — | 16.68 |
| S4 | 5.00 | 0.85 | 5.5 | 0.85 | 5.5 | 40 | 7 | — | — | 16.62 |
| S5 | 4.93 | 0.85 | 5.5 | 0.85 | 5.5 | — | — | — | — | 19.19 |
| S6 | 4.98 | 0.85 | 5.5 | 0.85 | 5.5 | 40 | 3 | 60 | 7 | 19.50 |
| S7 | 5.06 | 0.90 | 5.5 | 0.85 | 5.5 | 40 | 7 | — | — | 16.68 |
| S8 | 5.13 | 0.90 | 5.5 | 0.85 | 5.5 | 40 | 7 | — | — | 16.68 |
| S9 | 4.90 | 0.90 | 5.5 | 0.85 | 5.5 | 40 | 7 | 70 | 3 | 20.04 |
Table 4.
Measurement results of inflow rate and irrigation water amount for each border.
| Border Number | Treatment | Initial Inflow Rate (L s−1 m−1) | First Change | Second Change | Cutoff-Distance Ratio | Cutoff Time (min) | Irrigation Water Amount (m3) | ||
|---|---|---|---|---|---|---|---|---|---|
| Advance of Inflow Rate Change (m) | Inflow Rate after Change (L s−1 m−1) | Advance of Inflow Rate Change (m) | Inflow Rate after Change (L s−1 m−1) | ||||||
| A1 | ODCI | 3.94 | — | — | — | — | 0.8 | 57.96 | 41.11 |
| A2 | 4.01 | — | — | — | — | 0.8 | 54.06 | 39.02 | |
| A3 | 3.93 | — | — | — | — | 0.8 | 55.56 | 39.30 | |
| B1 | RACI | 3.18 | 40 | 5.58 | 65 | 3.05 | — | 52.20 | 36.80 |
| B2 | 3.31 | 40 | 6.07 | 60 | 3.13 | — | 52.32 | 36.87 | |
| B3 | 3.86 | 40 | 5.89 | 50 | 3.48 | — | 51.96 | 36.82 | |
Table 5.
Comparisons between RACI and traditional real-time control irrigation.
| Comparison | RACI | Traditional Real-Time Control Irrigation | |
|---|---|---|---|
| Measurement | Before irrigation | Slope, infiltration parameters, and roughness coefficient of one border | Slope and roughness coefficient of every border |
| During irrigation | Inflow rate and advance time | Inflow rate and advance time | |
| Calculation | Expected advance trajectory and expected amount of irrigation water of one border before irrigation | Soil infiltration properties of every border in real-time during irrigation | |
| Adjustment basis | Simply compare the actual and expected advance time | Real-time simulate the irrigation process of every border and determine the optimal inflow rate or cutoff time | |
| Equipment requirements | Sensors of advance time, equipment for measuring and adjusting flow (accuracy of ±10% is acceptable), simple computing equipment (such as a microcontroller) | Sensors of advance time, equipment for accurately measuring and adjusting flow (some systems do not need to adjust inflow rate), equipment capable of performing complex calculations in a short time (such as computer) | |
Publisher’s Note: MDPI stays neutral with regard to jurisdictional claims in published maps and institutional affiliations. |
© 2022 by the authors. Licensee MDPI, Basel, Switzerland. This article is an open access article distributed under the terms and conditions of the Creative Commons Attribution (CC BY) license (https://creativecommons.org/licenses/by/4.0/).
Share and Cite
MDPI and ACS Style
Liu, K.; Jiao, X.; Li, J.; Gu, Z.; Guo, W. A Real-Time Adaptive Control System for Border Irrigation. Agronomy 2022, 12, 2995. https://doi.org/10.3390/agronomy12122995
AMA Style
Liu K, Jiao X, Li J, Gu Z, Guo W. A Real-Time Adaptive Control System for Border Irrigation. Agronomy. 2022; 12(12):2995. https://doi.org/10.3390/agronomy12122995
Chicago/Turabian StyleLiu, Kaihua, Xiyun Jiao, Jiang Li, Zhe Gu, and Weihua Guo. 2022. "A Real-Time Adaptive Control System for Border Irrigation" Agronomy 12, no. 12: 2995. https://doi.org/10.3390/agronomy12122995
Note that from the first issue of 2016, this journal uses article numbers instead of page numbers. See further details here.