1. Introduction
In parallel to important crop productivity advances, the food trade has increased, diversified and made product processes complex to reduce postharvest losses, maintain products’ valued attributes and guarantee their postharvest quality [
1,
2,
3]. In this regard, the effect of storage conditions has been widely assessed for leafy vegetables to determine the preservation capacity of physico-chemical attributes [
4].
Product quality is a combination of the characteristics, attributes and properties that are valued in human nutrition [
5]. Applied to horticultural products, quality can be studied according to four intrinsic components: hygiene-sanitary, technological, organoleptic and nutritional [
6]. The last one is the object of our study.
Fresh fruits and vegetables are highly perishable products, and significant quality losses may occur from harvest to final consumers due mainly to two important physiological processes [
7]: (1) Respiration, particularly the rate at which a product breathes. It indicates the metabolic activity of a product’s tissues that acts as a useful guide about the length of its commercial life [
8,
9]; (2) Transpiration and the loss of moisture with consequent wilting. This occurs as water is the main component of vegetable products (80–95% of weight, 95% for lettuce) and its loss not only results in a lighter weight, but also in the formation of an unattractive flaccid product of notably less commercial quality [
10].
Refrigerated storage is recommended as it slows aging caused by ripening, softening or changes in texture and undesirable metabolic compounds [
3,
4,
8]. Light exposure should also be considered as it may influence products’ nutritional balance, especially in terms of nitrate concentration and photosynthetic pigments [
11,
12,
13,
14,
15,
16,
17].
The biosynthesis, composition and concentration of health-promoting compounds vary widely among leafy crops, and imply the influence of genetic and environmental factors (light and temperature), growing conditions, harvest practices and postharvest handling conditions [
18]. Of all leafy vegetables, lettuce (
Lactuca sativa L.) is a widely grown and popularly consumed vegetable worldwide, however it is not regarded as nutritional food, primarily due to its high water content (95%) [
11]. However, its high content of biologically active compounds, such as vitamins, minerals and organic substances [
19,
20] makes its nutrient composition the equivalent to other so-called “nutritious” vegetables. In addition, the nutritional and market quality of lettuce relate not only to head size and appearance [
17,
21], but also to vitamin and mineral contents [
22], and to the maintenance of nitrate and nitrite concentrations in leaves at unharmful levels [
23,
24]. Moreover, leaf color, caused by the balance of chlorophylls, anthocyanins and carotenoids, can also influence the quality of leaves as pigmentation is often associated with the presence of antioxidant compounds [
25,
26,
27,
28].
Finally, one more, but no less important quality component, appears on the trade market. It takes into account consumer perceptions and is somewhat less tangible for being defined not in terms of intrinsic characteristics, but of consumer satisfaction and behavior on the market [
29]. Deterioration in the visual appearance of lettuce leaves generally results in products being rejected by consumers [
30], which strongly impacts the commercialization chain, especially exportation [
3]. The consumer factor is so important for landrace varieties, which are particularly appealing to consumers striving to purchase organic, local and high-quality products, that farmers’ interest in growing landraces is growing [
31]. Specifically for lettuce, the most appreciated characteristics are the presence of signs of freshness, shiny damage-free leaves, color intensity without yellowing or discoloration, no burns on edges and with ribs that do not crack [
4,
30,
32]. The good aptitude to a certain variety to maintain these attributes during the storage process suggests a clear advantage. It is true that traditional vegetable varieties have been displaced by hybrid varieties from the market, mainly due to their lower yields and inferior pest and disease resistance [
31,
33]. However, they have also been described as vegetables that adapt well to different conditions [
2], besides being considered a reservoir of genetic diversity, particularly for certain attributes of interest, such as their high nutraceutical quality [
34]. All this makes landraces a valuable genetic resource to: (1) identify genes of interest for miscellaneous breeding programs; (2) be candidates to be reintroduced into the market after specific studies into nutritional quality, like postharvest conservation, among others. Although high genetic diversity exists in the landrace gene pool, this has scarcely been studied and, thus, hinders landrace utilization in agriculture [
31].
Therefore, the aim of this work was to evaluate the nutritional quality of lettuce in relation to its different morphological characters by comparing the postharvest evolution in the nutrient composition of five local Valencian lettuce landraces and four commercial varieties to determine the best health-benefit candidates that provide the highest nutritional value and the best bioactive compounds.
2. Materials and Methods
2.1. Plant Material
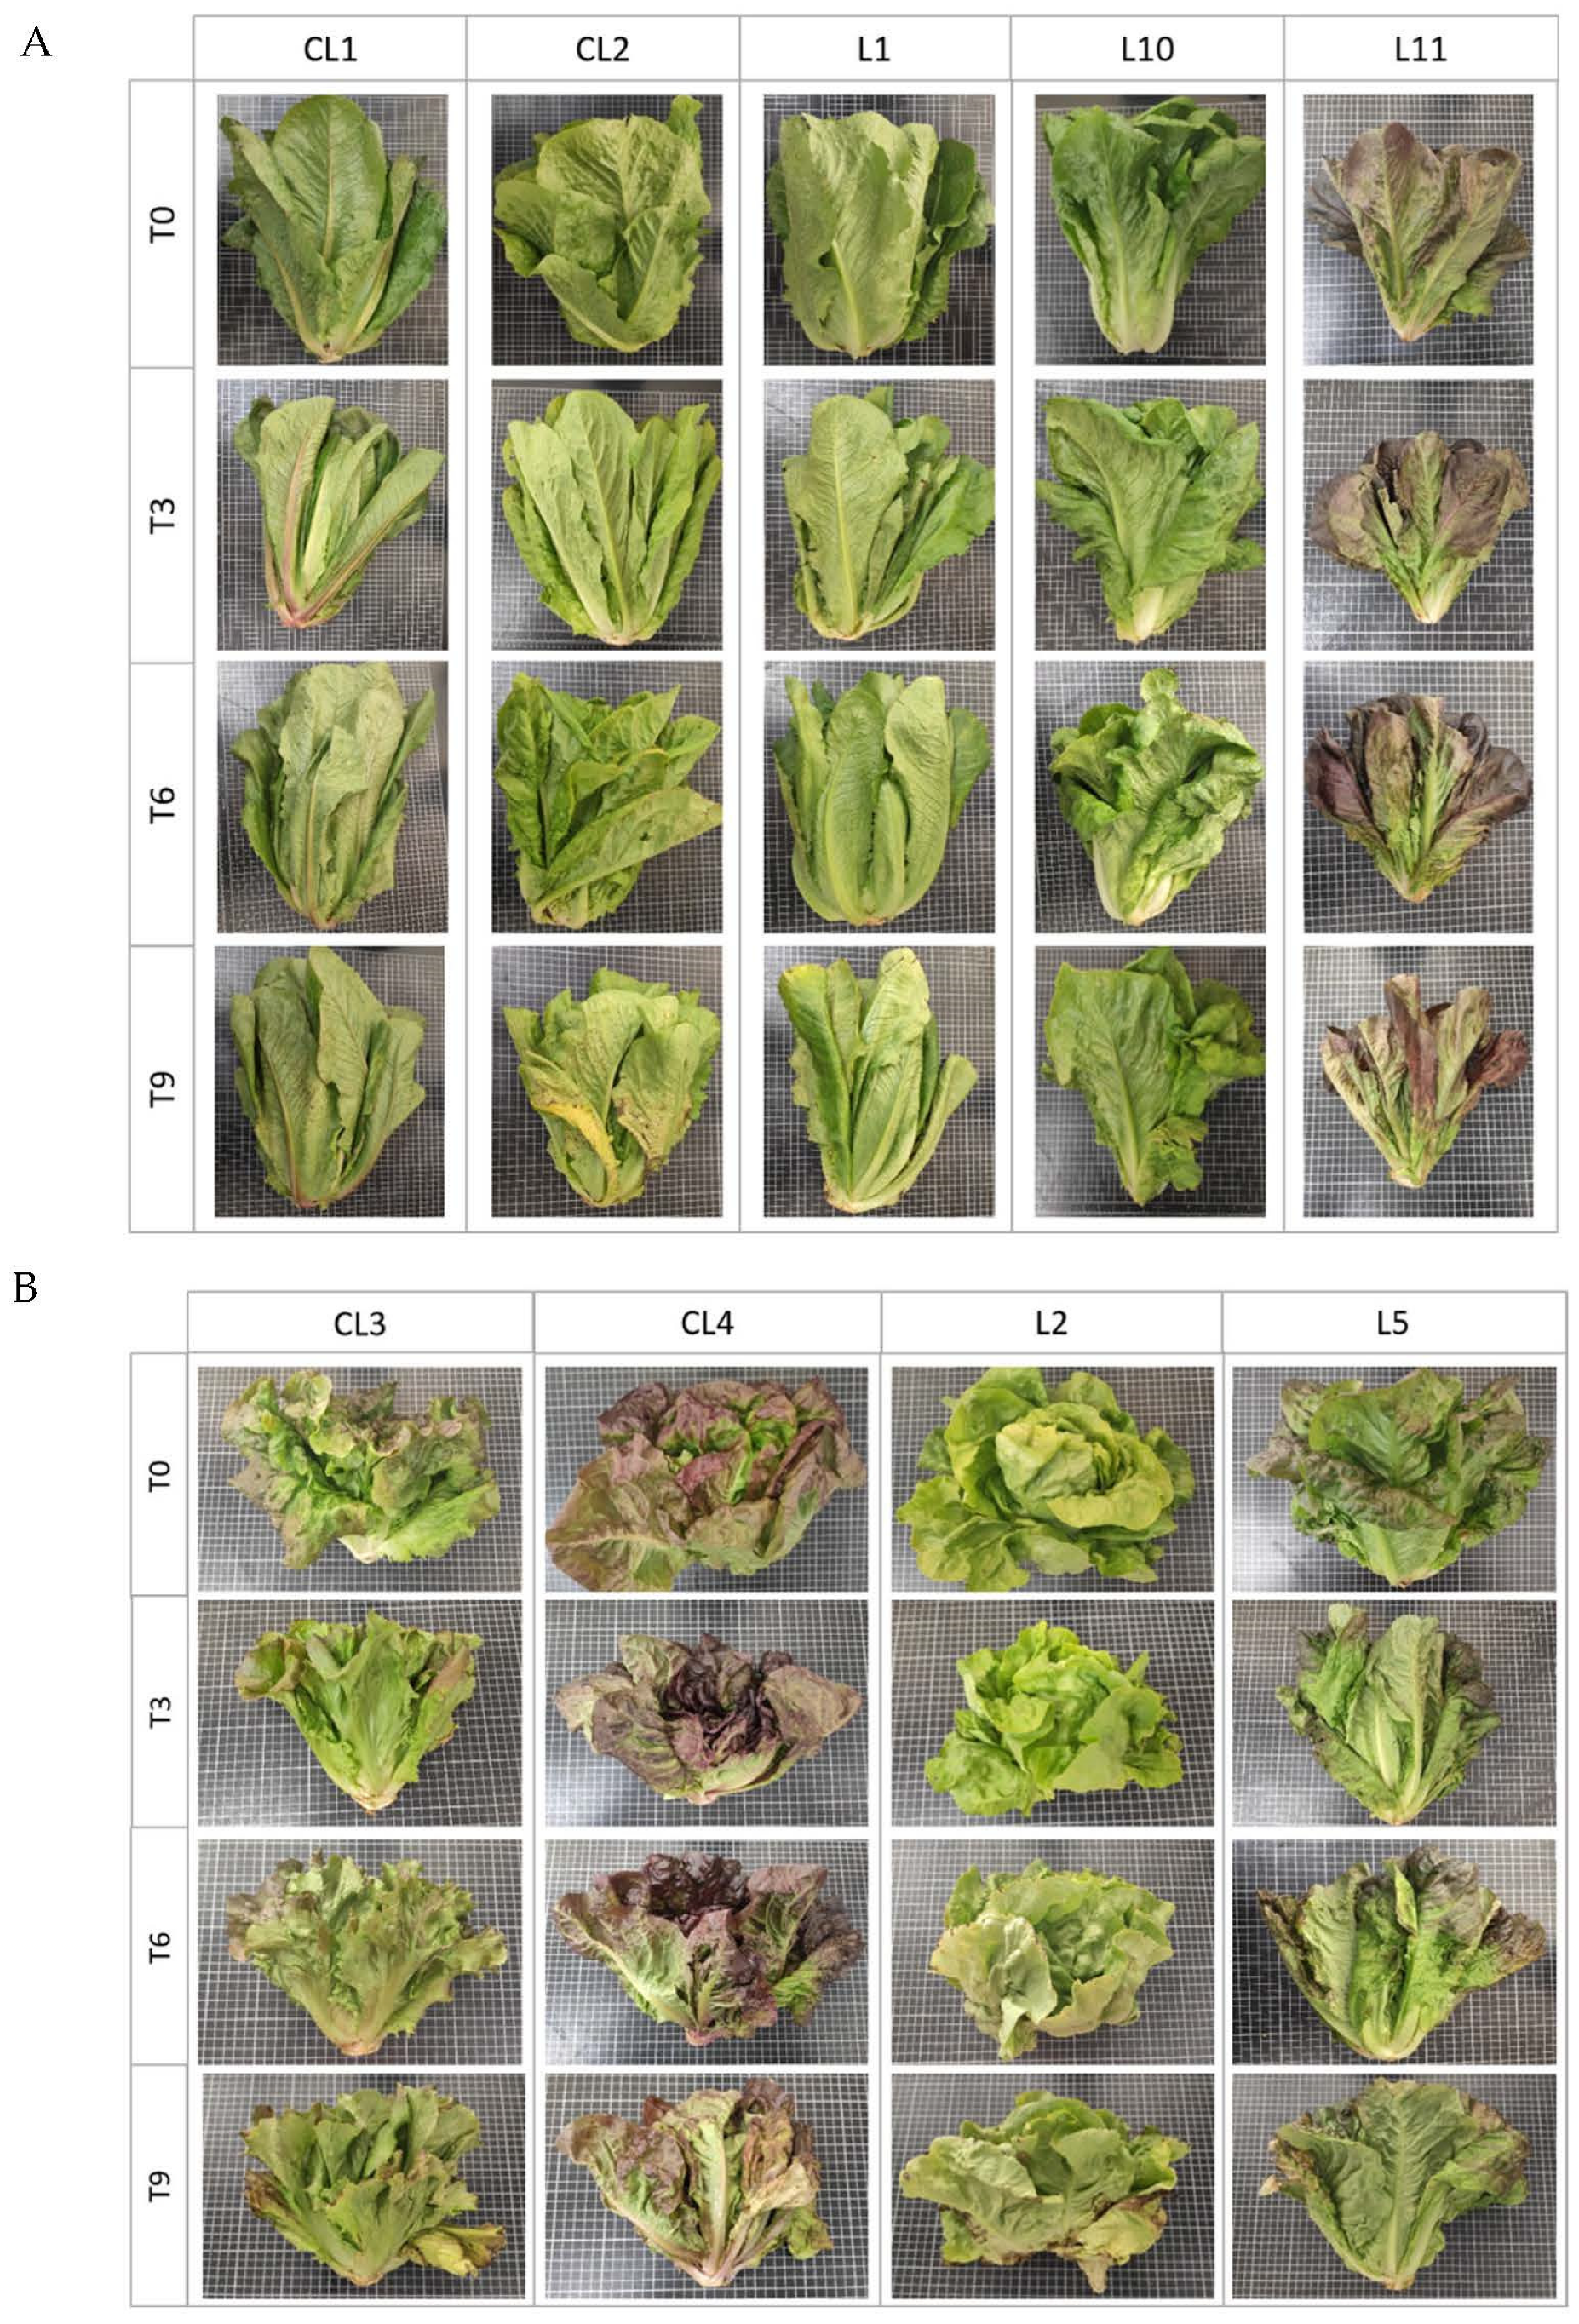
Five lettuce landraces and four commercial lettuce varieties (
Lactuca sativa L.) were selected to conduct this study. The selected landraces represent different typologies of the lettuce germplasm collection of Valencia (Spain), while the commercial varieties are among the best-selling lettuces on the market. These local varieties were supplied by the Institute for the Conservation and Improvement of Valencian Agrobiodiversity (COMAV, Valencia, Spain) and the Valencian Institute for Agrarian Research (IVIA, Moncada Spain) genebanks.
Table 1 provides the abbreviation code, type, numerical code and a brief description of each variety.
Figure 1A,B complement this table.
2.2. Field Experiment
The experiment was done in the experimental facilities of the IVIA in Moncada (Valencia, Spain; 39° 35′ 22.3″ N, 0°23′ 44.0″ W, 37 cm above sea level). Seeds were sown in November 2020 in 104-hole trays with 100% natural coconut coir fiber substrate (225 g L−1 density, Cocopeat, Projar Co., 46930 Quart de Poblet, Valencia, Spain) under greenhouse conditions (temperature 21 °C, 60% relative humidity (RH) and PAR 1000 µmol m−2 s−1).
Seedlings were transplanted under field conditions on 4 December 2020, when plants were 5 cm high, and by ensuring that at least four true leaves had appeared. Each variety consisted in 20 plants distributed into two separate replicates (10 plants each) with 30-cm spacing between each plant and 60-cm spacing between each variety. The distance between rows was 100 cm. The soil composition within 20 cm depth was 68% sand, 11% clay and 21% silt (sandy-clay loam), containing 0.61% organic matter, 0.051% total N, less than 8 mg kg
−1 of P, 301 mg kg
−1 of K and 2.87 meq·100 g
−1 of assimilable Mg. Soil electrical conductivity was 0.290 dS m
−1 and pH was 8.1. Irrigation met 100% crop evapotranspiration (ETc), as described in Penella et al., [
35] performed with a drip system. Nutrients were applied by the irrigation system at a rate (kg ha
−1) of 200 N, 50 P2O5, 250 K2O, 110 CaO, and 35 MgO, as recommended by Maroto [
36]. The average range of the minimum and maximum temperatures during the field experiment was 1–23 °C for December, −1–26 °C for January, 7–24 °C for February and 6–26 °C for March. Plants were harvested in the adult state on 23 March.
2.3. Storage Conditions
Sixteen lettuces were harvested for each variety in the experiment. They were randomly divided into four groups (four lettuces each) and each subgroup underwent the following storage treatments: samples from the first subgroup (T0) were stored immediately after harvesting without applying any storage treatment. The other subgroups underwent three storage treatments, which consisted of being left in an industrial refrigeration chamber (Yafri S.L., Alzira, Spain) for 3 days (darkness, 5 °C and 98% RH), followed for 0, 3 and 6 days (T3, T6 and T9, respectively) under storage conditions (12-h photoperiod, 8 °C and 88% RH).
2.4. Visual Characterization and Weight Loss Determination
In order to visually determine the condition of lettuce plants along the storage chain, the visual quality parameters described by Kader et al. [
37] were used with slight modifications as a reference. Firmness, appearance, decay, discoloration, wilting and the appearance of internal lettuce part were the key parameters (
Table 2). The same person always carried out this procedure. Visual characterization was performed on each whole lettuce from all the treatments (T0, T3, T6 and T9) prior to sample processing. In parallel, lettuce plants were weighed on the different experiment dates to determine fresh weight (FW) loss during storage.
2.5. Sample Preparation
After each experiment time (T0, T3, T6 and T9), lettuce plants were washed under tap water and dried with paper to remove surface dirt for the nutritional quality determinations. One half of each lettuce was set aside for drying. The other half was chopped and instantly frozen in liquid nitrogen to be stored at −80 °C. The plant material reserved for drying was used for mineral analysis and dry weight (DW) quantification purposes, while the cold-stored samples were used to determine nutraceutical properties. Fresh samples were ground by a mixer mill (MM400, Retsch, Hann, Germany) with liquid nitrogen to prevent melting when processing the samples stored at −80 °C. The same machine was used to homogenize the samples dried in a laboratory oven at 65 °C for 72 h, although without adding N2.
2.6. Nutraceutical Compounds and Antioxidant Capacity
2.6.1. Chlorophyll and Carotenoid Concentration
Total chlorophyll (Chl) and carotenoid (Car) content were determined spectrophotometrically as described by Porra et al. [
38] with slight modifications. First, 2.5 mL of 80% acetone (
v/
v) were added to 60 mg FW of the sample extract to then be centrifuged at 2000 rpm for 8 min. The supernatant was used for the analysis. Solution absorption was measured at 663.6, 646.6 and 470 nm by a spectrophotometer (Lambda 25 UV/VIS, Perkin Elmer, Waltham, MA, USA). Next 80% acetone (
v/
v) was used as the blank solution. The chlorophyll and carotenoid concentrations of the extracts were calculated by the following equations:
Chlorophylls and carotenoids were expressed as µg g
−1 FW.
2.6.2. Anthocyanin Concentration
The total anthocyanin (Ant) content was spectrophotometrically quantified as described by Szepesi et al. [
39] with slight modifications. First, 5 mL of methanol:HCl:H
2O solution (90:1:9) were added to 0.1g FW of the homogenized sample previously placed inside glass tubes. Tubes were vortexed and stored in the dark for 1 h at room temperature. Samples were mixed regularly during storage. Then they were centrifuged at 2000 rpm for 5 min and the supernatant was saved for the analysis. Solution absorption was measured at 534, 643 and 661 nm by a spectrophotometer (Lambda 25 UV/VIS, Perkin Elmer, Waltham, MA, USA). The methanol:HCl: H
2O solution was used as the blank. The anthocyanin concentration of the extracts was calculated by the following formula:
Anthocyanin concentration was expressed as µmol g
−1 FW.
2.6.3. Ascorbic Acid Concentration
The total ascorbic acid (AsA) was spectrophotometrically quantified as described by Kampfenkel et al. [
40]. By adding 1.5 mL of 6% (
w/
v) trichloroacetic acid (TCA) to 0.2 g FW of each sample. Then samples were centrifuged at 15,000 rpm for 5 min at 4 °C. The supernatant was saved for further analyses. Next 0.05 mL of the supernatant was mixed with 0.05 mL of 10 mM DTT and 0.1 mL of 0.2 M phosphate buffer (pH 7.4). Samples were incubated in a water bath for 15 min at 42 °C. Afterward, 0.05 mL of 0.5% (
w/
v) NEM (N-ethylamide) were added and incubated for 1 min at room temperature, before adding 0.25 mL of 10% (
w/
v) TCA, 0.2 mL of H3PO4 4% (
w/
v), 0.2 mL of 2-2′-dipyridyl, and 0.1 mL of 3% (
w/
v) FeCl3. Samples were incubated in a water bath for 40 min at 42 °C. Solution absorption was measured at 525 nm by a spectrophotometer (Lambda 25 UV/VIS, Perkin Elmer, Waltham, MA, USA). The blank solution with no extract was used for calibration purposes. Ascorbic acid was expressed as mg g
−1 FW.
2.6.4. Total Phenolic Analysis
The total phenolic (Phe) content was analyzed according to Dewanto et al. [
41] with modifications, where 0.1 g FW of the homogenized sample were homogenized in 0.7 mL of 80% (
v/
v) methanol, vortexed and then incubated in an ultrasonic bath (Ultrasonic cleaner, Fungilab, Barcelona, Spain) at medium intensity for 30 min. Next samples were centrifuged at 10,000 rpm for 15 min at 4 °C and the supernatant was reserved for further analyses. The phenolic concentration was determined by the Folin-Ciocalteau colorimetric method where 20 µL of the supernatant were mixed with 80 µL of methanol and 0.7 mL of Folin–Ciocalteau reagent. This solution was vortexed and incubated in the dark for 5 min at room temperature. Then 0.7 mL of NaHCO3 (6%) were added to the solution. The final mix was vortexed and incubated in the dark for 60 min at room temperature. Solution absorption was measured at 765 nm by a spectrophotometer (Lambda 25 UV/VIS, Perkin Elmer, Waltham, MA, USA). The blank solution with no extract was used for calibration purposes. Each measurement was compared to a standard curve of gallic acid (GA) and the phenolic concentration was expressed as mg of GA equivalent g
−1 FW.
2.6.5. Antioxidant Capacity Measurements
Antioxidant capacity (DPPH) was measured following the method reported by Brand-Williams et al. [
42] with slight changes. First, 0.1 g FW of the sample were homogenized in 0.7 mL of 80% (
v/
v) methanol, vortexed and then incubated in an ultrasonic bath (Ultrasonic cleaner, Fungilab, Barcelona, Spain) at medium intensity for 30 min. Next samples were centrifuged for 15 min at 10,000 rpm and 4 °C and the supernatant was reserved for further analyses. This was followed by adding 990 μL of 0.065 M of 2,2-diphenyl-1-picrylhydrazyl solution (solved in 80% methanol) to a 20 μL aliquot of the supernatant. Absorbance at 515 nm was measured against a blank solution (80% methanol with no extract) after a 30-min reaction time at room temperature in the dark by a spectrophotometer (Lambda 25 UV/VIS, Perkin Elmer, Waltham, MA, USA). The results were expressed as the percentage reduction in the initial 2,2-diphenyl-1-picrylhydrazyl absorption in extracts.
2.7. Lipid Peroxidation
Lipid peroxidation (LP) was determined by the malondialdehyde (MDA) procedure using the thiobarbituric acid (TBA) reaction according to Heath et al., 1968, with slight modifications based on Dhindsa et al. [
43]. First, 0.1 g FW of the homogenized sample were mixed with 2 mL of 0.1% (
w/
v) trichloroacetic acid (TCA) and centrifuged for 5 min at 10,000 rpm and 4 °C. The supernatant was recovered. Later 1 mL of supernatant was mixed with 2 mL of the reaction buffer (20% TCA + 0.5% TBA) and samples were incubated in a water bath for 30 min at 95 °C. The non specific background absorbance reading at 600 nm was subtracted from the specific absorbance reading at 532 nm. The results were expressed as nmol 100 g
−1 FW.
2.8. Hydrogen Peroxide Concentration
Hydrogen peroxide (H
2O
2) content was determined following the method reported by Lopez-Serrano et al. [
44], in which 0.25 g FW of were homogenized in 2 mL of 0.1% (
w/
v) TCA and centrifuged at 10,000 rpm for 8 min at 4 °C. Then 0.4 mL of the supernatant was diluted with 0.6 mL of 0.1% (
w/
v) TCA. Afterward, 0.5 mL of 100 µM phosphate buffer and 2 mL of 1 M potassium iodide were added to the solution. Absorbance at 390 nm was measured against a blank solution (1 mL of 0.1% (
w/
v) TCA with no extract) after incubating samples for 1 h at room temperature in the darkness using a spectrophotometer (Lambda 25 UV/VIS, Perkin Elmer, Waltham, MA, USA). Each measurement was compared to a standard H
2O
2 curve and the results were expressed as nmol 100 g
−1 FW.
2.9. Nitrate Quantification
Nitrate concentration was measured by a basic laboratory meter (Sension+ MM340, Hach, UK) coupled to a nitrate measurement electrode. First, 0.02 g of the DW sample were homogenized by vortexing for 1 min in 8 mL of ionic strength solution (previously prepared with 25 mL of distillated water and a nitrate ionic strength adjustor powder pillow; Hach Permachem, Loveland, CO, USA). Measurements were taken by immersing the electrode in solution while placed on the magnetic stirrer. Equipment calibration was performed with three nitrate standard solutions (Hach, Loveland, CO, USA). The results were expressed as mg g−1 FW.
2.10. Mineral Determination
First of all, 0.1 g of DW sample was burnt in a muffle furnace for 12 h at 550 °C. Macro- and micronutrients were extracted with 5 mL of 2% (v/v) nitric acid in an ultrasonic bath for 30 min at 40 °C. Later 20 mL of 2% nitric acid were added to samples. Mineral concentrations were measured by ICP emission spectrometry (iCAP 6000, Thermo Scientific, Cambridge, UK). This procedure was followed for all the nutrients equally, except nitrates. The results of the macro- and micronutrient concentrations were expressed as mg g−1 FW and µg g−1 FW, respectively.
2.11. Statistical Analysis
The results obtained from this analysis were subjected to a one-way analysis of variance (ANOVA) using Statgraphics Centurion XVII (Statistical Graphics Corporation 2014). The statistical analysis was carried out by taking two different factors into account: variety type and storage time. The results were expressed as mean ± standard deviation. Means were accepted as being significantly different at the 95% confidence interval (p ≤ 0.05). The mean, maximum and minimum values, coefficient of variation and F-ratio of all the traits were calculated.
A principal component analysis (PCA) was run for the standardized values using pairwise Euclidean distances among accession means to determinate the relations between the genotypes in each development stage. The extracted eigenvalues, and the relative and cumulative proportions of the total variance explained by the principal components (PCs), were calculated. Only those eigenvalues above one were considered to be significant. A two-dimensional (2D) scatter plot was prepared (for each storage period) based on a distance matrix for the PCs to visualize the relation that explained the traits.
Four correlation analyses (one for each storage treatment) were also completed for the nutraceutical compounds, DPPH, LP, H2O2, NO3−, Ca and K concentrations. Individual samples of each accession were subjected to linear regression and correlation coefficients (r) were obtained.
3. Results
3.1. Visual Damage
Table 3 shows quality loss related to the visual description of the harvested lettuces during the storage period. This data is complemented with what is shown in
Figure 1. Visual quality was time-dependent and the lowest values were recorded at T6 and/or T9 depending on the variety. Of all the varieties, CL2, CL3 and L10 obtained better results at the three conservation times, and visual quality was reduced by 10.0 ± 0.8%, 15.7 ± 2.7% and 20.0 ± 1.4% for treatment T3, T6 and T9, respectively. Lettuces L5 and L11 obtained the higher visual damage values from the time the experiment began, with a quality reduction of 24.0 ± 2.5%, 33.9 ± 7.5% and 48.3 ± 11.7% for treatment T3, T6 and T9, respectively.
3.2. Fresh Weight Loss
In general terms, the FW percentage (
Table 3) lowered by 6.6%, 8.3% and 10.3% for treatment T3, T6 and T9, respectively. The greatest reduction in T3 was for CL4 (8.5%), which decreased by around 10% in two varieties (L2 and L11) at T6. At the end of the experiment (T9), CL4 was once again highlighted for its low FW percentage, along with L11 (4.2% and 6.4% over the average value for T9, respectively). Two varieties (CL1 and L1) had a high FW percentage throughout the experiment (ranging between 94.8% and 93.3%), with no statistical differences between treatments.
3.3. Nutraceutical Compounds and Antioxidant Capacity
3.3.1. Total Chlorophyll Concentration
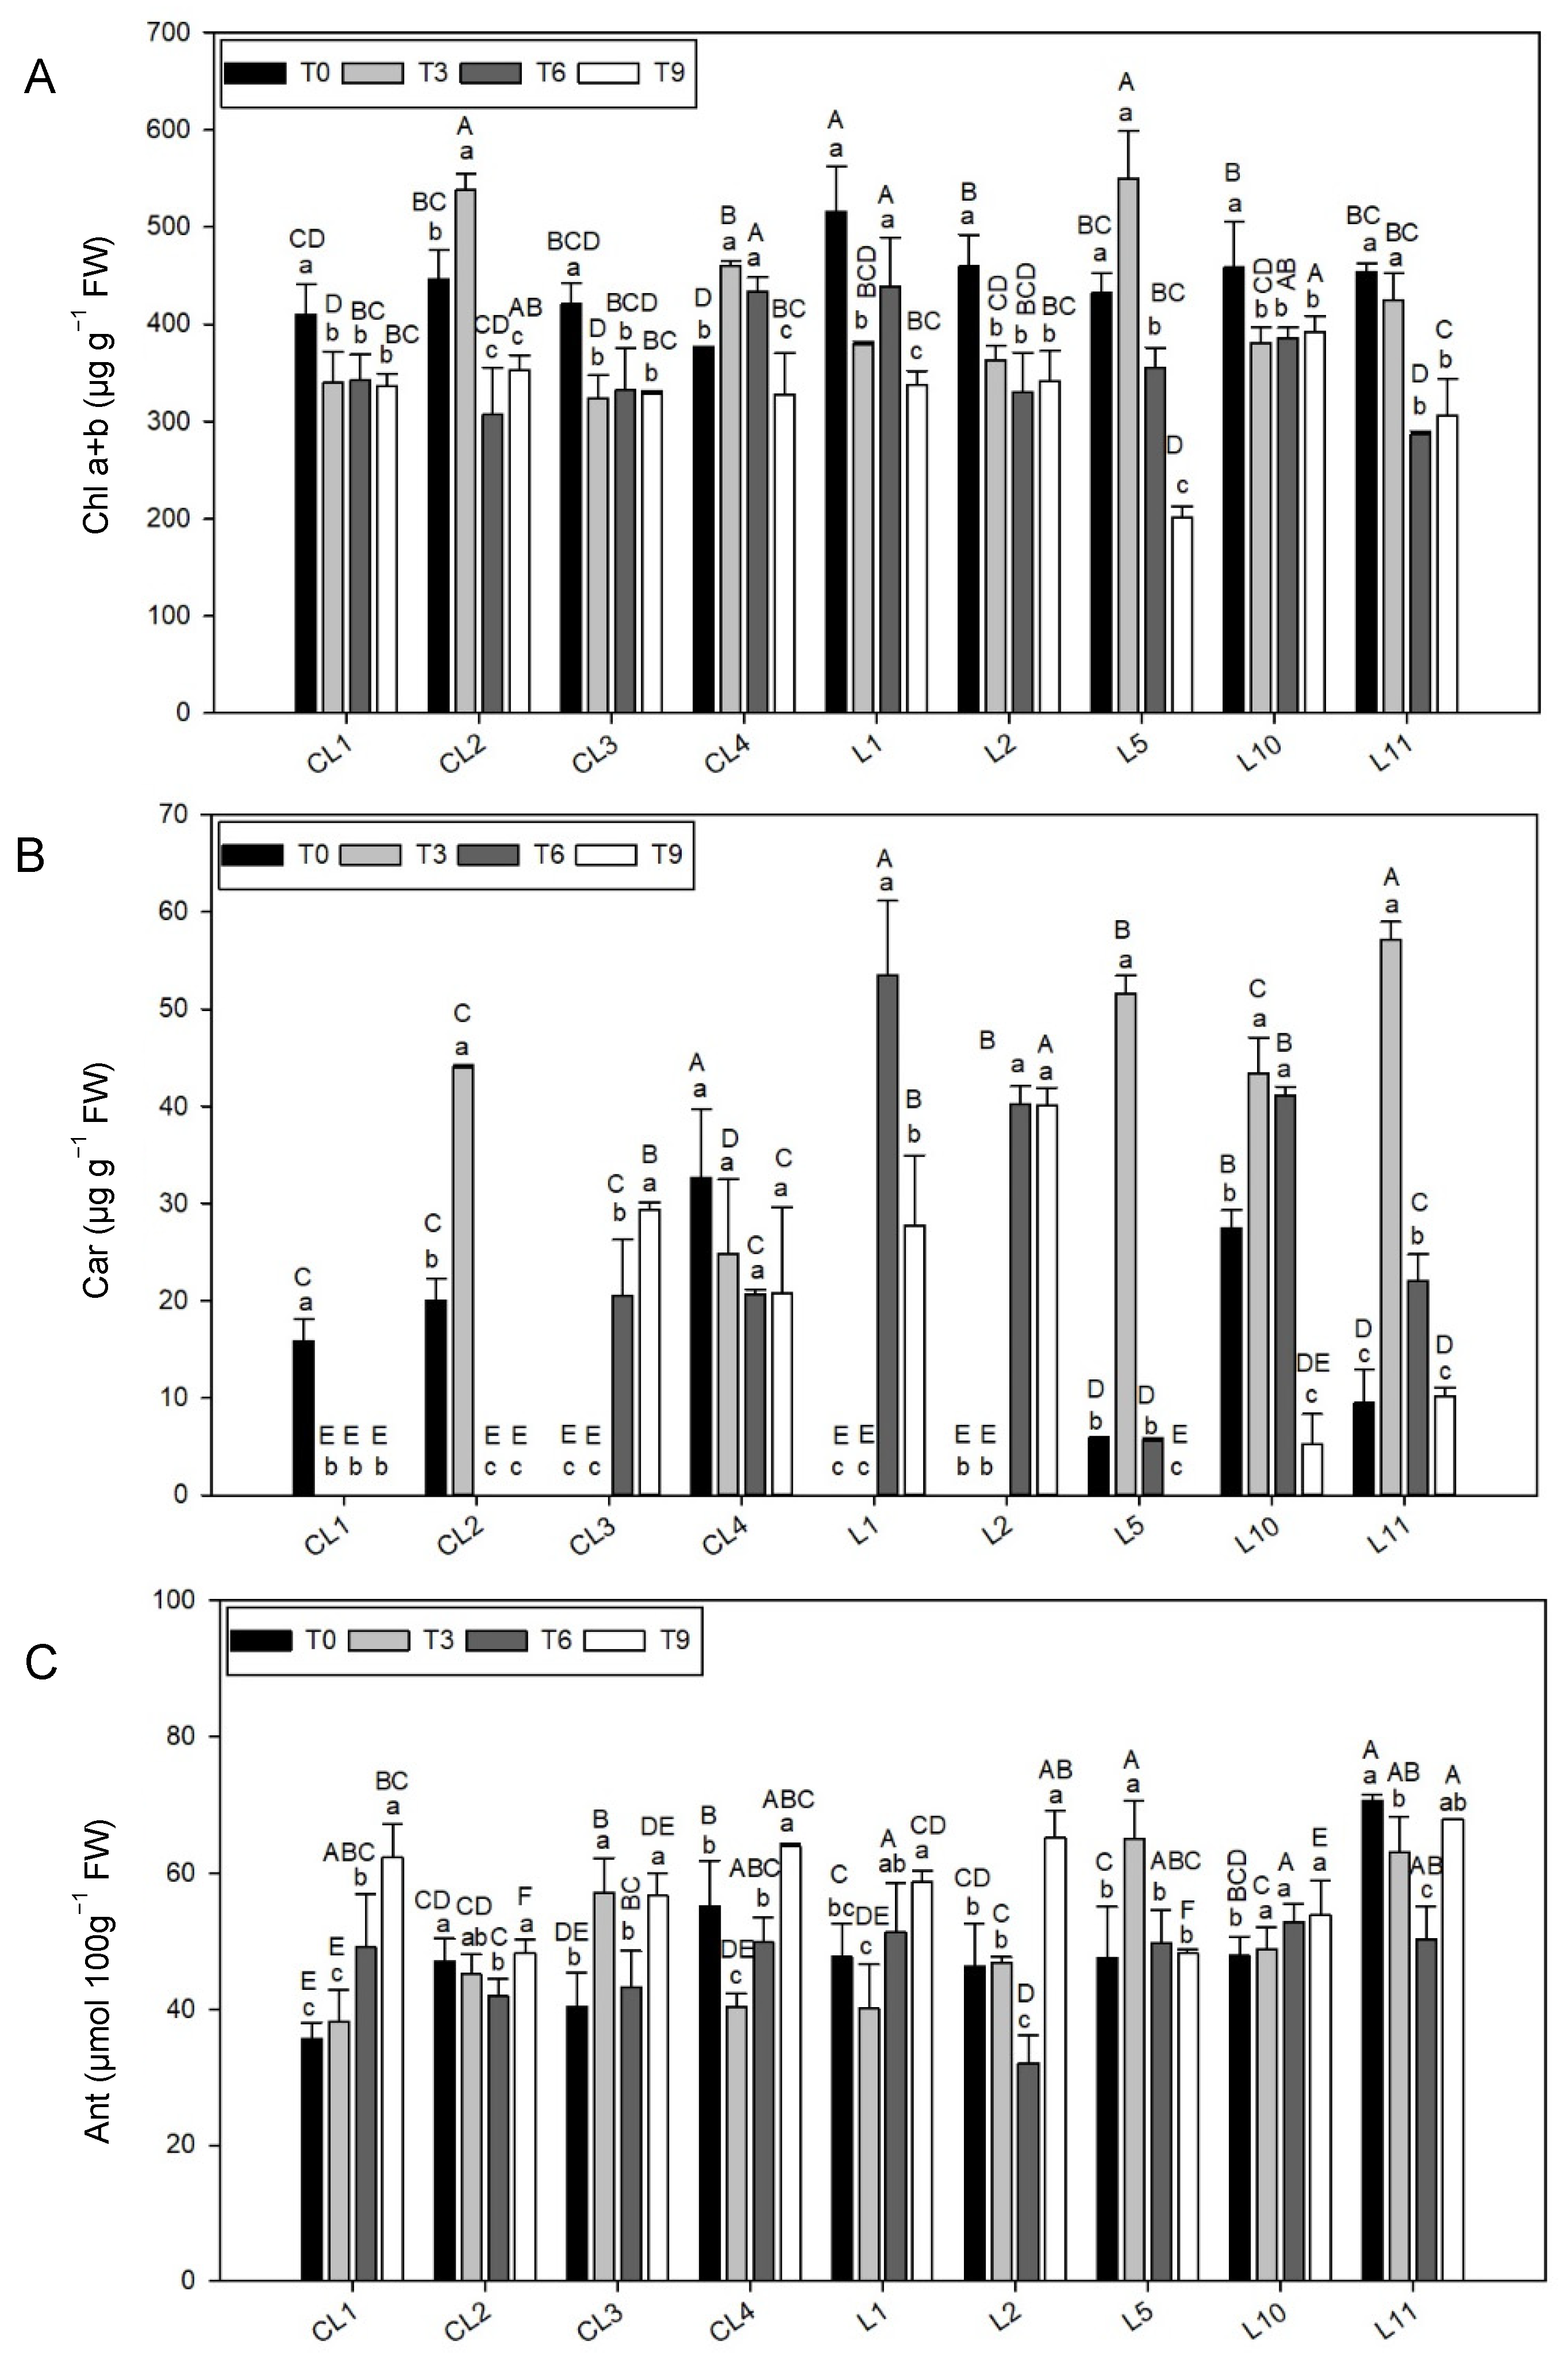
The Chl concentration (
Figure 2A,
Table 4) was significantly higher at T0 and T3 than for other treatments (
p < 0.001), which highlighted three varieties for their high Chl values: L1 (top level at T0) and CL2 and L5 (top levels at T3). The lowest Chl concentration at T0 went to CL1, CL3 and CL4, while the Chl level at T3 dropped to very low values for five of the nine varieties (CL1, CL3, L1, L2, L10).
At T6 the highest Chl was for CL4, L1 and L10, with the last one also notable at T9 in addition to CL2. At T9, a very low Chl value was obtained for landrace L5.
3.3.2. Total Carotenoid Content
The Car concentration was the most variable trait measured throughout the experiment, reflected by the coefficient of variation at each storage time (between 91.9% and 107.5%;
Table 4). In five of the nine varieties (
Figure 2B), the Car concentration was detected only at one storage time or two: CL1 and CL2 (initial time), CL3, L1 and L2 (late time).
A Car concentration was recorded for CL4, L10 and L11 throughout the experiment, however with differences in them. CL4 obtained the stable levels during the whole experiment (medium–high values and without differences between storage times). L10 had good Car levels at T6 and T3, with no significant differences between them, while L11 was highlighted at T3.
L5 was highlighted for having the second highest Car concentration level at T3, despite it being low or absent in the other treatments.
3.3.3. Anthocyanin Concentration
The highest Ant content in the commercial varieties and landraces was shown for storage treatment T9 (mean value between 16.8 and 23.4% higher than the other times;
Table 4). Only variety L10 showed no statistical differences between treatments (
Figure 2C) and the Ant concentration in L5 was higher at T3 than in the other treatments.
Of all the varieties, L11 stood out for having the highest Ant concentration in all the treatments. In addition to L11, CL4 also displayed a good Ant level (the second highest value) at T0, while the most remarkable levels at T3 were recorded for CL3, L11, and especially for L5. At T9, the best results were obtained by CL4 and L2 and L11.
On the whole, the lowest Ant concentration was obtained for each storage time by CL2 and CL1, and by L2 at the initial times.
3.3.4. Ascorbic Acid Content
AsA content was significantly higher (
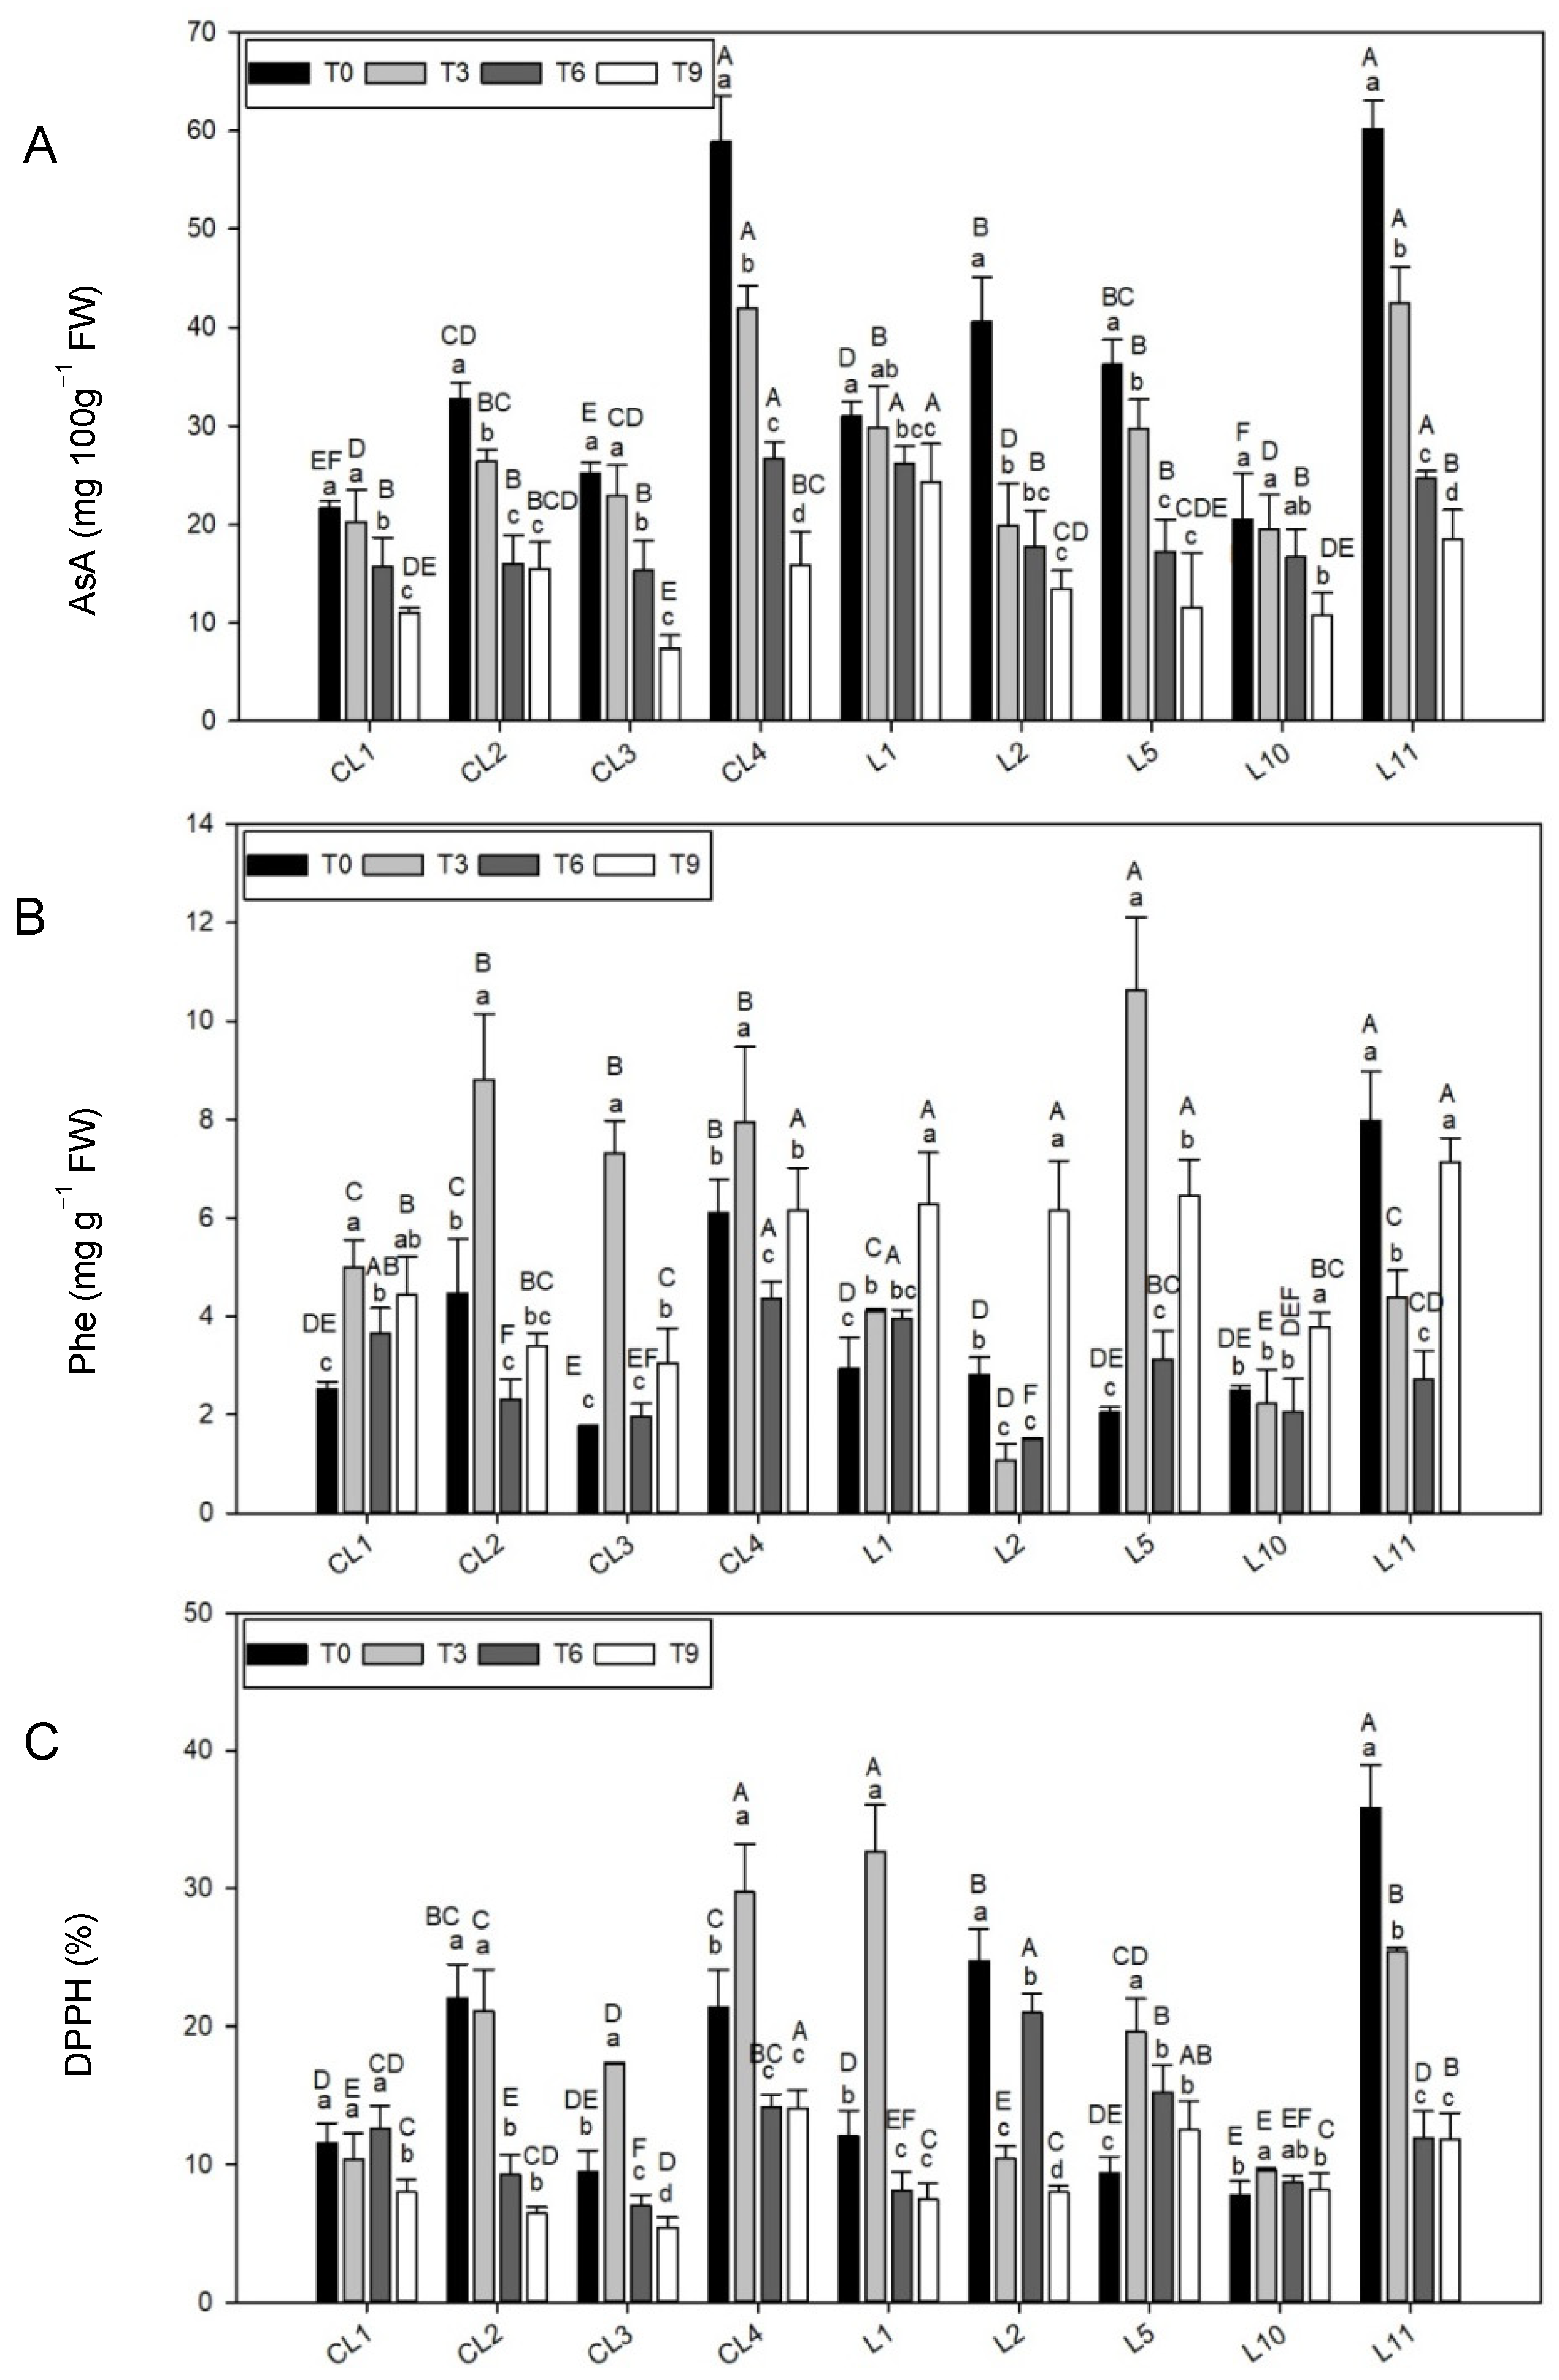
p < 0.001) in the initial treatments than at the end of the experiment (nearly 50% reduction;
Table 4).
Of all the varieties (
Figure 3A), CL4 and L11 stood out for having the highest AsA concentration in all the treatments (in first place from T0 to T6, with the second highest level at T9). L1 also showed good marks (first place) at T6 and T9. In contrast, CL1, CL3 and L10 had the lowest AsA contents at several storage times.
3.3.5. Total Phenolic Content
Statistically significant differences in Phe content were found in the different storage treatments (
Table 4), with the highest mean values recorded at T3 and T9 (5.44 ± 0.38 mg g
−1 FW, 38.6% higher than the other treatments).
At T0, the top Phe concentration was for L11 (107.7% over the T0 average;
Figure 3B). Landrace L5 had the top Phe content at T3 (85.66% over the T3 average) and three commercial lettuces (CL2, CL3 and CL4) also obtained high levels (between 27.9% and 53.9% over the average). At the end of the experiment, four local landraces (L1, L2, L5 and L11) and one commercial variety (CL4) were highlighted for their high Phe concentration (between 7.15 and 6.14 mg g
−1 FW). In general, the lowest Phe concentration values were for L10.
3.3.6. Antioxidant Capacity
Antioxidant capacity, as determined by the DPPH assay, was statistically higher (
p < 0.05) at T0 and T3 than at T6 and T9 (
Table 4).
Of all the varieties (
Figure 3C), CL4 and L11 stood out for their good antioxidant capacities, and L11 was especially relevant at T0 (18.7% over the T0 average) and CL4 at T3 (10.1% over the T3 average). DPPH at L1 and L2 was also remarkable at T0 and T6, respectively (13.1% and 8.9% over the mean, respectively).
On the whole, two commercial varieties (CL1 and CL3) and one local landrace (L10) obtained the lowest results and were especially significant at T0 (between 5.7% and 9.8% below the average) and at T3 for CL1 and L10 (around 9.6% below the average). The lowest DPPH activity value at the end of the experiment was for CL3, and also for CL2 (3.7% and 2.6% lower than the T9 mean, respectively).
3.4. Hydrogen Peroxide
Significant differences (
p < 0.05) were found in the H
2O
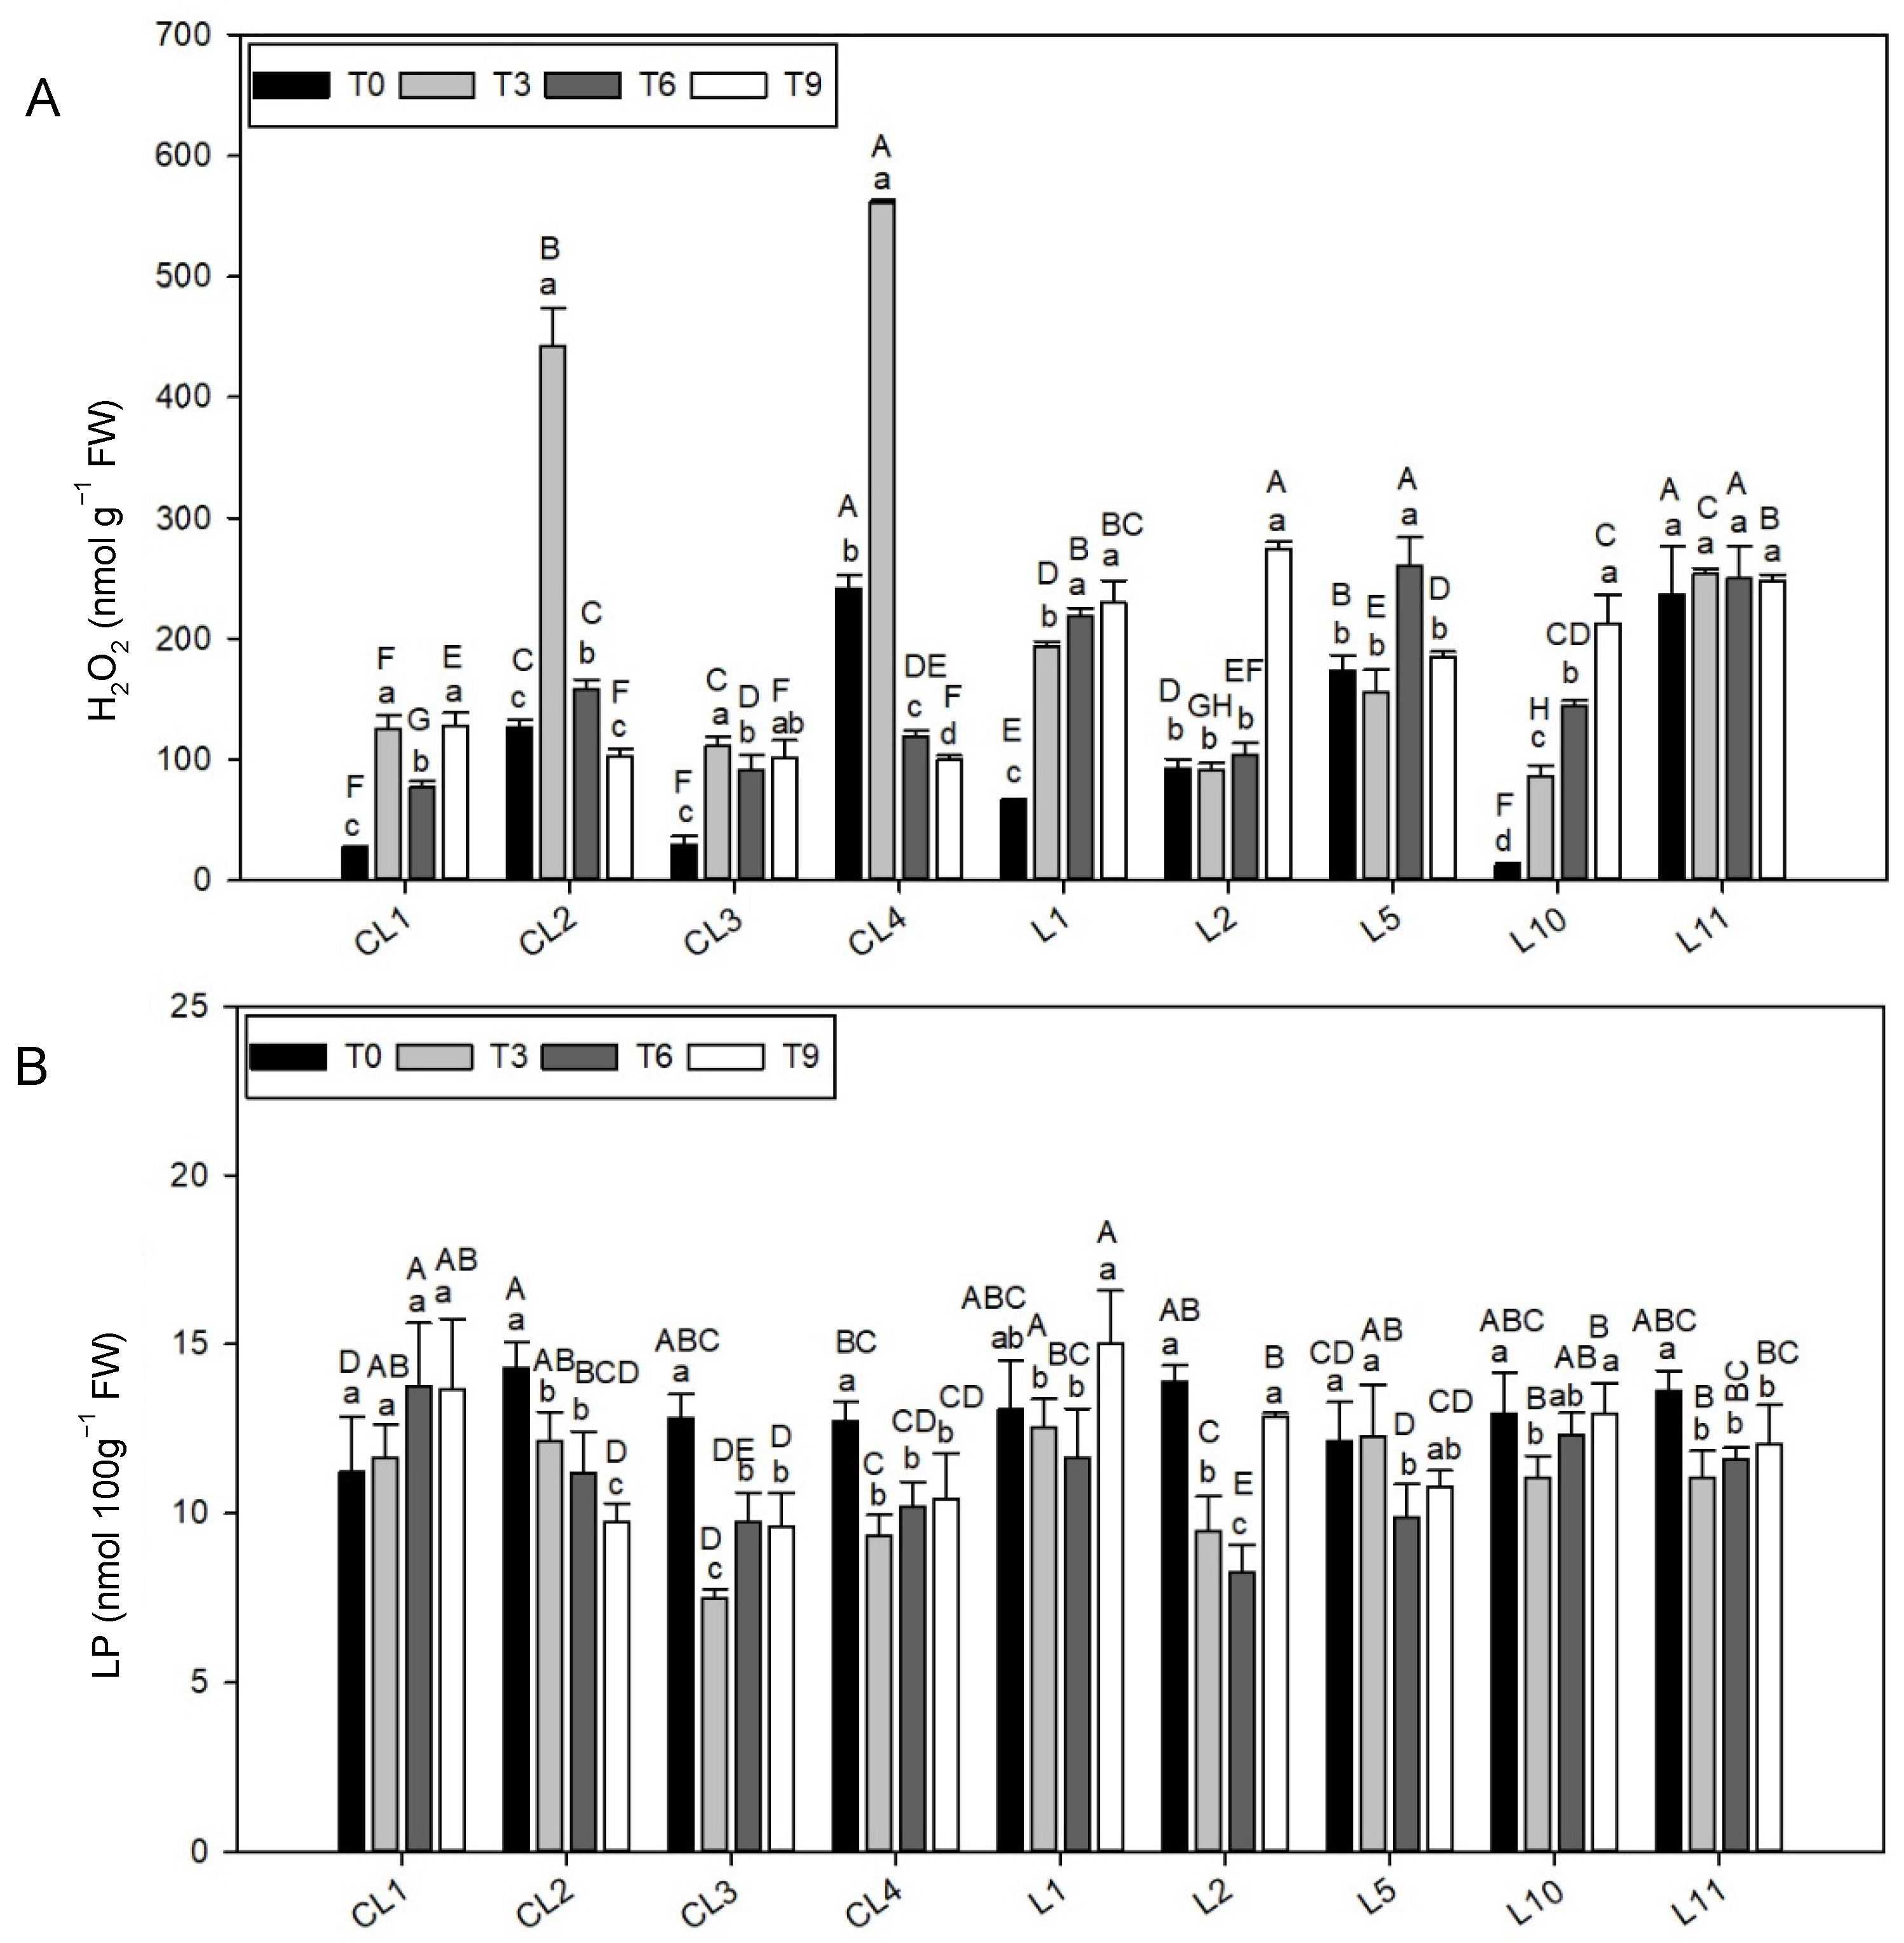
2 concentrations among T3, T6 and T9 when related to T0 (97.7%, 47.2% and 53.2% increase, respectively;
Table 4). One remarkable finding was that the H
2O
2 content in L11 did not differ between storage times (
Figure 4A) and was similar for three of the four measurements in landraces L2 and L5 (a higher level at T9 and T6, respectively).
At T0, the highest H2O2 value was shown by L11 and CL4 (239.1 ± 4.0 nmol g−1 FW, 113.8% over the T0 average). CL4 also occupied first place at T3 (150.0% over the T3 average). The H2O2 value in L11 was also remarkable at T6 in addition to L5 landrace (255.1 ± 7.3 nmol g−1 FW, 61.4% over the T6 average) and L2 was highlighted at T9 (56.2% over the T9 average).
In contrast, CL1, CL3 and L10 had very low H2O2 concentrations at T0 (22.8 ± 9.9 nmol g−1 FW, 79.6% below the T0 average) and L10 (61.6% decrease) and CL1 (51.4% decrease) at T3 and T6, respectively. The lowest H2O2 content at the end of the experiment was noted for three commercial varieties (CL2, CL3 and CL4, 101.1 ± 1.6 nmol g−1 FW, 42.4% below the T9 average).
3.5. Lipid Peroxidation
Unlike the H
2O
2 concentration, the highest lipid peroxidation (LP) result appeared at T0 with no significant differences (
p < 0.05) with T9 (
Table 4). The LP result in CL1 did not differ between storage times (
Figure 4B), was similar in three of the four measurements taken in landraces CL4 and L11 (T3, T6 and T9), and the highest level was displayed at T0 in both lettuces.
Of all the landraces, CL1 and L1 had the highest LP results in three of the four storage times, but at T0 and T6, respectively. Conversely, CL3 obtained the lowest values at T3, T6 and T9, but not at T0.
At T0, the most remarkable result was the low LP value in varieties CL1 and L5 (11.7 ± 0.7 nmol 100g−1 FW, 10.0% below the T0 average), and in CL3 at T3 (30.7% below the T3 average). The lowest LP value at T6 was also recorded at CL3 and L2 (9.0 ± 1.1 nmol 100g−1 FW, 25.5% below the T6 average). At the end of the experiment, three of the four commercial varieties and one local landrace (CL2, CL3, CL4 and L5) obtained the lowest LP results (10.1 ± 0.5 nmol 100g−1 FW, 14.8% below the T9 average).
3.6. Nitrate Concentration
Nitrate concentration did not depend on the time exposure to the storage conditions (
Table 4 and
Table 5), and ranged between 1.47 and 1.27 mg g
−1 FW from T0 to T9, yet with no differences between treatments (
p-value: 0.1522). A marked reduction in nitrate concentration was noted only for variety L2 (20.9%, 36.7% and 52.1% for T3, T6 and T9, respectively) in relation to the T0 level (
Table 5). Of all the varieties, L11 and CL4 had the highest concentrations (mean values of 1.73 and 1.54 mg g
−1 FW, respectively), while three commercial lettuces (CL1, CL2, CL3) and two local landraces (L2 and L5) obtained the lowest nitrate concentration (1.23 ± 0.10 mg g
−1 FW).
3.7. Mineral Concentration
Storage treatments did not statistically influence Ca concentration (p-value: 0.3306), however significant differences in lettuces were found (p < 0.001). Two of the nine varieties (CL1 and L10) had a similar Ca concentration at each time. Varieties CL4, L2 and L11 had the top Ca concentration levels (first or second place) at each storage time, which was a general trend, followed by L5 from T3 to T9 (between 15.0% and 32.7% higher than the average value at T0, T3, T6 and T9). In contrast, CL1, CL2 and L1 presented the lowest values (between 18.5% and 24.2% lower than the average value).
For K concentration (
Table 4), statistical differences were found between storage treatments (
p < 0.001) as all the landraces except CL4 presented the highest K level at T0. At first treatment, landrace L11 was highlighted for its high K concentration (4.8 mg g
−1 FW, 23.6% higher than the T0 average,
Table 5), with its maximum at T3 in CL4 and L5 (13.4% and 22.4% above the T3 average, respectively). CL4, L5 and L11 had a high K level for both T6 and T9 treatments (13.4% and 12.3% above the T6 and T9 average, respectively).
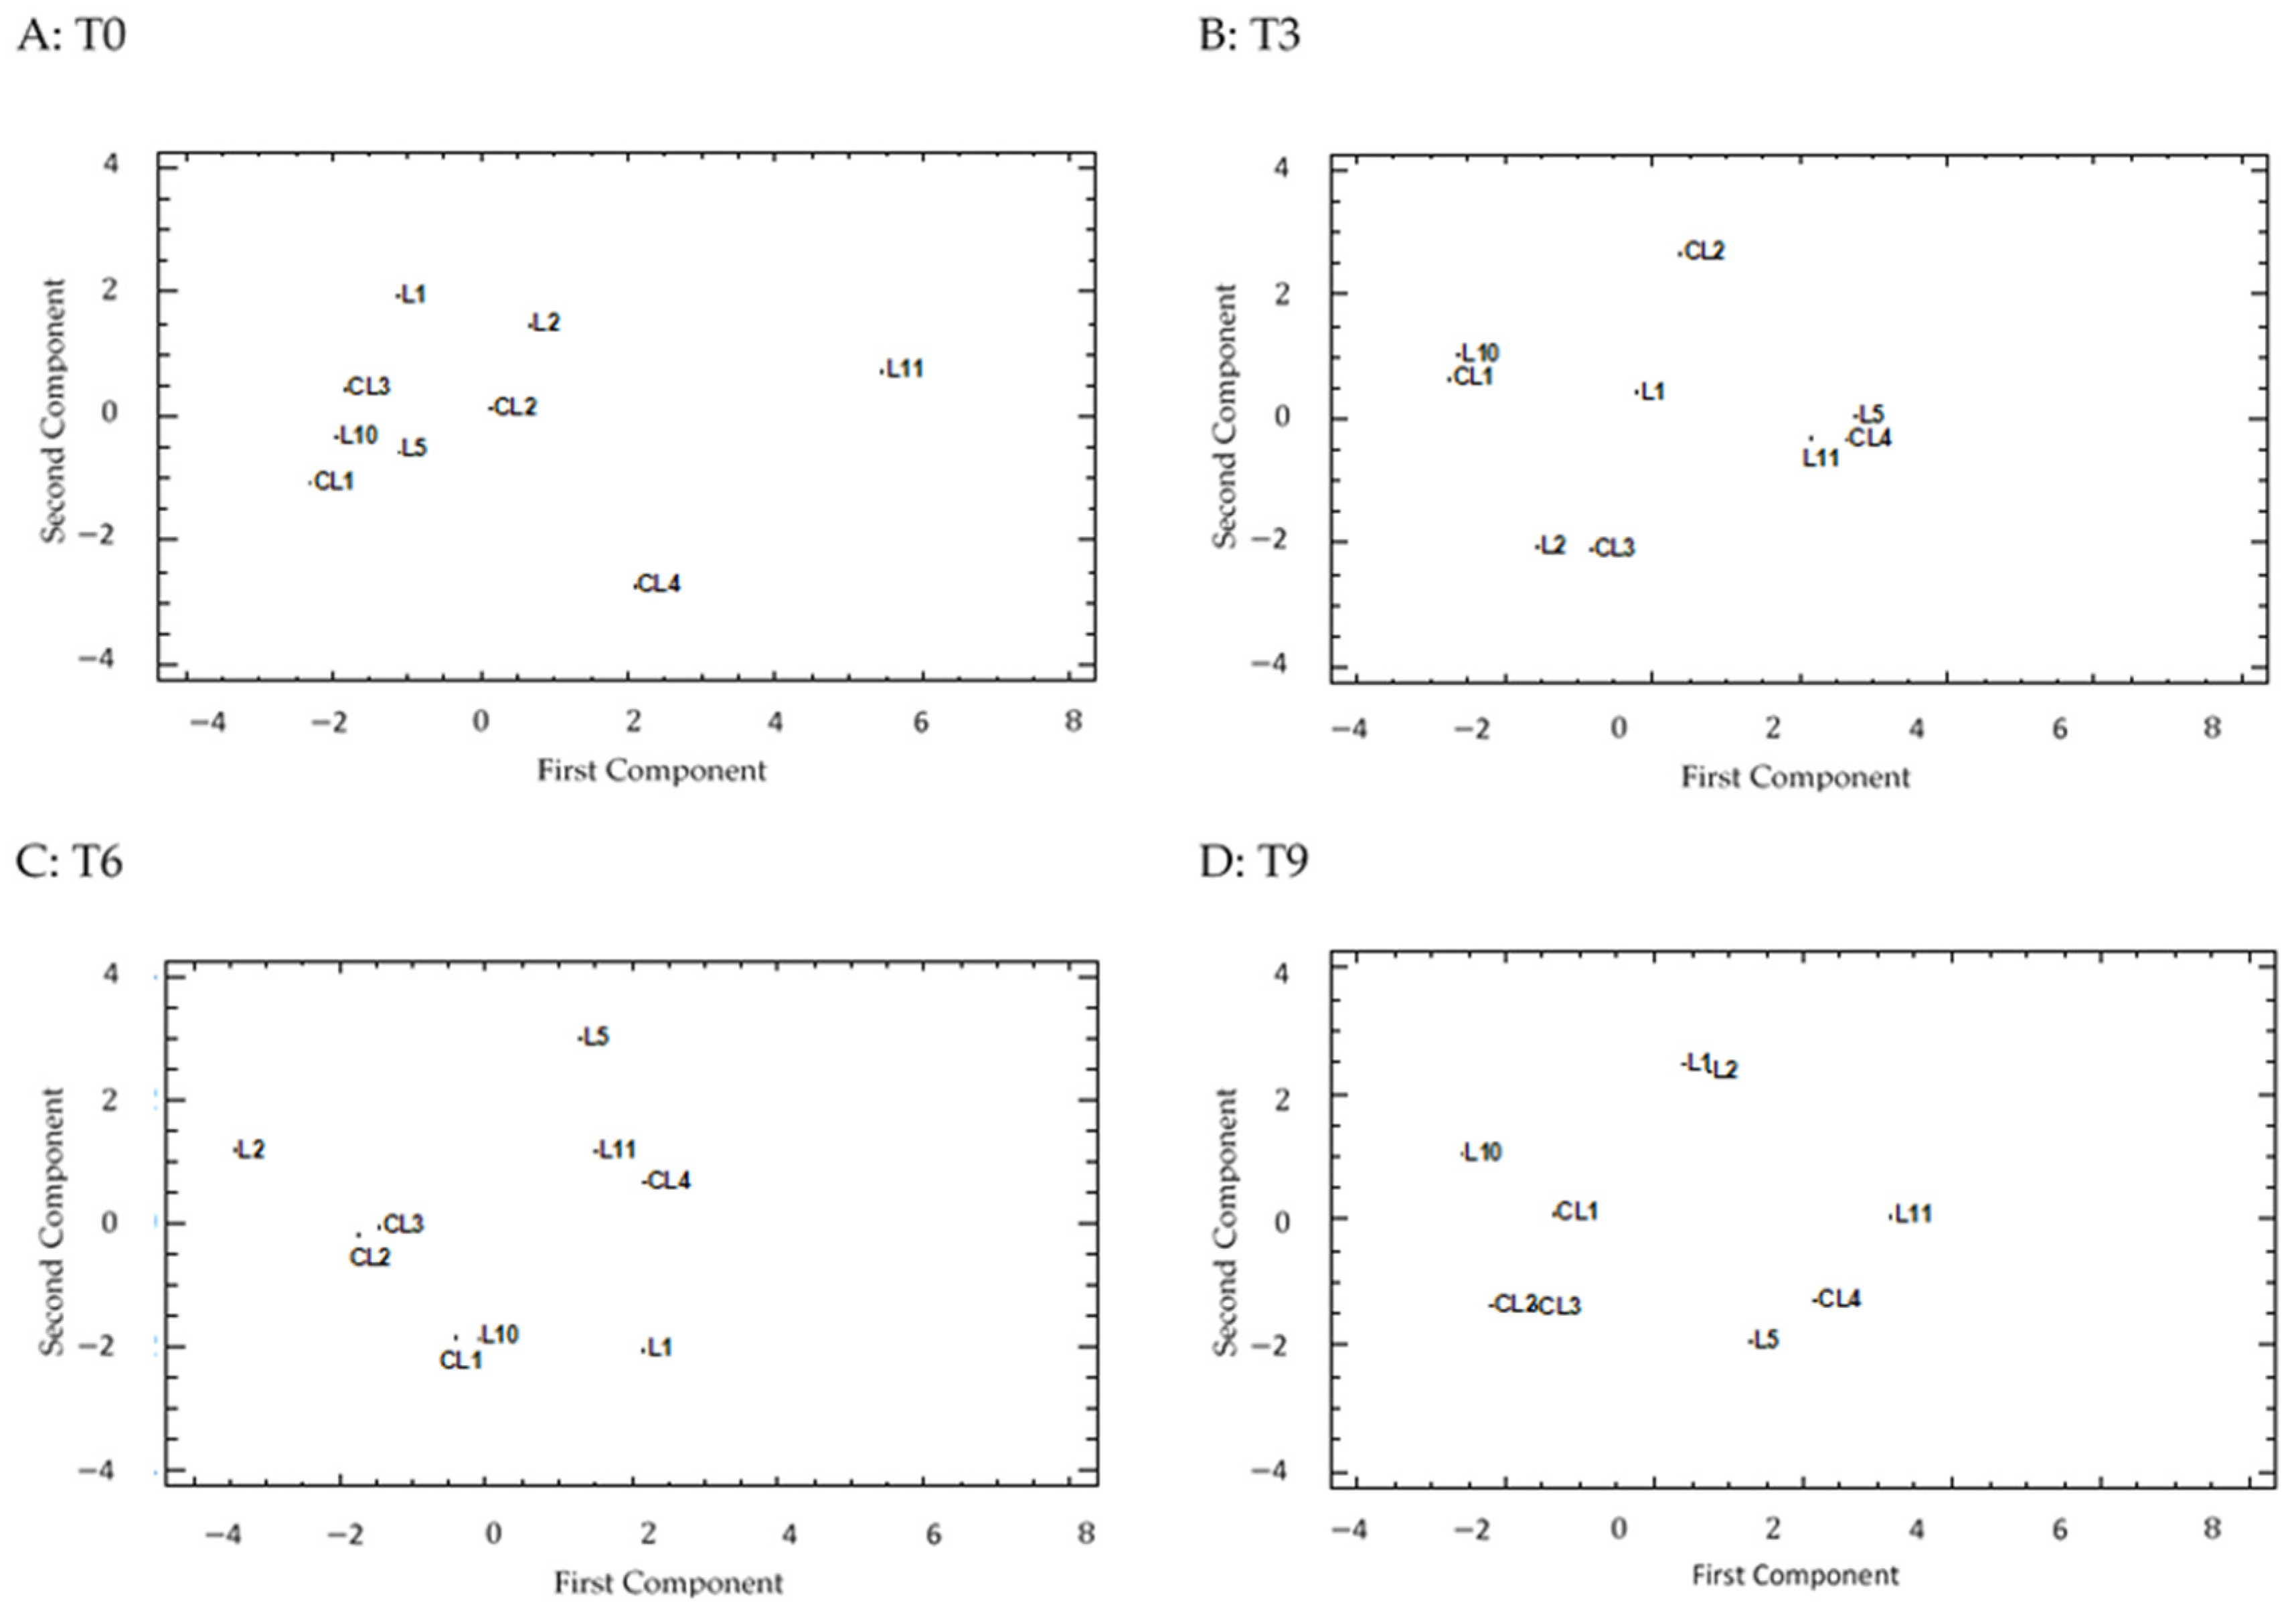
3.8. PCA Analysis
The PCA and those eigenvalues above one reflected a different pattern in the correlation of the lettuces in the four treatments (
Supplementary Table S3).
At T0, the number of the most significant PCs was that the first and second PCs accounted for around 74% (56.5% and 17.9% for the first and second PCs, respectively) of the total variation for the studied traits. The first PC positively correlated with all the traits in seven of the 11 parameters (NO
3−, Ca, Ant, AsA, Phe, DPPH, H
2O
2). The correlation values lay between 0.33 and 0.38. The second PC displayed two marked correlations, one was positive with Chl (0.63) and one was negative with Car (−0.56). From the projection on the PCA plot (
Figure 5A), a group of a large number of varieties appeared (seven out of nine) located in the central-left zone of the graphic, while two varieties were separately located. L11 was the variety furthest to the right from the rest as it had top levels for four traits: Ant, AsA, Phe and DPPH (
Figure 2C and
Figure 3A–C). The top AsA level and the second highest Phe concentration (
Figure 3A,B) left variety CL4 slightly to the right, and further to the bottom of the plot for its top Car and H
2O
2 concentrations (
Figure 2B and
Figure 4A, respectively).
At T3, T6 and T9 four PCs were recorded whose eigenvalue exceeded the unit and described around 87% of the variability among varieties for the three storage times. The distribution of lettuces in the PCA was located mostly by the variability of the traits in the first PC (between 42% and 35%). Most correlations were positive, and the highest coefficients were related to some mineral content (NO3− and K for T3, NO3− for T6, and both Ca and K for T9), pigments at T3 and T6 (Chl and Ant, respectively), AsA at T3 and T6 and DPPH at T3 and T9. The Phe concentration was notable at the three storage times, and the correlation value increased (from 0.30 to 0.46) as the experiment continued. The second PC explained between 20% and 26% of the distance between landraces and the most important correlation was recorded for the LP trait (0.52, −0.40 and 0.52, at T3, T6 and T9, respectively). The other remarkable correlations in the second PC were related to the three minerals (negative) and Chl (positive) at T3, Ca, K and DPPH at T6 (positive) and the H2O2 concentration at T9 (positive).
Although the projection on the PCA plot (
Figure 5B–D) spread the nine varieties over the whole area, some lettuces remained together along the three graphics. This was the case of CL4, L5 and L11 (central-right area) as they had similar Ca and K concentrations (top levels) for the three storage times. The good AsA levels at T3 and T6, and Phe and DPPH at T9, also favored their proximity at each particular time. Lettuces CL1 and L10 were very close (central-left area) for their low minerals contents, and good AsA and DPPH activity throughout the experiment. The top Chl level and the presence of Car in L10 at T9 placed this variety slightly further up and further left than CL1.
The CL2 and CL3 pair separated at T3, however they moved closer as the experiment continued given their low Phe and DPPH levels at T6 and T9 (two of the four varieties with the lowest results for these traits at later times).
L1 and L2 were also very distant at T3, and especially so at T6, for their different Phe and H2O2 concentrations (higher in L1 than L2), however they moved closer at T9 due to the Phe concentration having reached top levels in L2, as well as for their similar DPPH activity. In addition, these two local landraces were placed at the top of the graphic for their remarkable LP and H2O2 concentrations.
3.9. Correlation between Quality Compounds
Correlation analyses were carried out to estimate the relation between the top quality traits at the four storage times (
Table 6).
At T0, all the statistically significant pairwise coefficients (28 pairs of traits of the 55 studied ones) showed a positive correlation. Of them, 17 showed strong positive relations (p < 0.001), with the most representative in DPPH vs. the three minerals and vs. Ant, AsA and Phe (r between 0.806 and 0.545). The multiple combinations among Phe, Ant and AsA in addition to the Ca concentration were also closely related, with H2O2 vs. Ant, AsA, Phe and DPPH. LP was positive, although barely related to the Ant concentration and DPPH capacity.
T3 was the storage time with the most correlations (23 positive traits and 24 negative ones) and most were strongly correlated (80.8% with a p-value < 0.001). The most remarkable positive relations were the combinations among the Phe, Car, NO3− and K concentrations (r value between 0.872 and 0.997), and between Ca, Chl, Ant and AsA (r value between 0.601 and 0.742). DPPH was positive and strongly correlated with the Ca, Chl and AsA concentrations in addition to H2O2 and LP. Strong and negative relations appeared between both Chl and Ant pigments vs. several traits (Car, Phe, NO3− and K). The negative but more moderate trend was between the same four parameters and DPPH and LP.
At T6, the number of positive correlations lowered to 15 and the strongest coefficients were observed only in two pairwise coefficients (NO3− vs. K and Ca vs. K). Moderate/low positive correlations were found among NO3− and Ant, AsA, Phe and H2O2. Similar results were obtained between the Car and Chl pigments and the Car vs. the AsA concentration. H2O2 and LP were positively related to the Ant concentration. Only three negative and moderate/low relations were observed at T6: LP vs. the Ca concentration and vs. DPPH capacity, in addition to DPPH vs. Ant.
At the end of the experiment at T9, the pairwise coefficients showed positive correlations in 17 of the 55 combinations, with the strongest ones among the combinations of Ca, K, Phe and DPPH activity. Moderate positive relations were recorded between the combinations of minerals (NO3−, Ca and K), in addition to LP vs. three traits (H2O2, Ant, Phe) and H2O2 vs. AsA and the Phe concentrations. Only two negative relations appeared between the pairs NO3− vs. H2O2 and K vs. Chl.
4. Discussion
Postharvest environmental conditions, particularly temperature, RH and light, have a major impact on overall fruit and vegetable quality [
3,
17]. Although lettuce is not generally stored for long periods of time, its quality can be maintained for about 15 days at 0 °C with minimum 95% RH [
45]. Likewise, it is known that postharvest decay in lettuce and other vegetable crops is a major source of financial loss for producers [
46] and ranges from about 20% to 40% of all economic profits [
2]. Harvested products are metabolically active, and undergo ripening and senescence processes that must be controlled to prolong postharvest quality [
3].
Loss of product quality during shelf life is usually first perceived as declining visual appearance [
8]. Lettuce is a highly perishable vegetable whose quality and shelf life are principally limited by dehydration. Cellular wall degradation as a consequence of turgidity loss [
4] affects texture, firmness and color by producing detrimental texture changes and enzymatic browning during postharvest storage [
3,
4,
8]. For this matter, controlling the tissue water status is crucial for lettuce quality, whose content in water exceeds 95% [
11]. To prevent excessive water loss, vegetables need to be stored below optimum humidity level, generally at 95% to 98% RH [
4]. For this reason, these moisture levels were maintained throughout our trial, although lettuce weight loss is unavoidable during storage.
Leaf anatomy, including cell wall thickness and strength, cell size and cell:cell adhesion, determines firmness, along with leaf turgor as established by water content [
47]. Camejo et al. [
17] suggested making readjustments to the Ca content promoted by a specific light condition, which could modulate the rigid cell wall and, consequently, leaf texture. In our study, the variety with the most Ca accumulation was landrace L11, followed by L2 and CL4. This finding could indicate that they were better capable to absorb or accumulate this cation, likely through more efficient Ca acquisition or transport systems. However, L11 was the most affected variety by storage in visual appearance terms. It is also true that during storage, Ca seemed to be related to the analyzed antioxidant compounds, which suggests that varieties with a high Ca content are also those with a better antioxidant response, which was the case of L11. However, leaf texture and overall visual quality are factors that influence lettuce’s market value and its consumer appeal [
8,
17]. Among varieties, CL1 and L1 could be the most attractive for consumers as these varieties suffered the least losses in wilting and FW terms, although their Ca content was unremarkable.
Another major visual quality indicator is the retention of green color, associated with chlorophyll content [
4]. Lettuce discoloration is unpredictable and, therefore, difficult for growers and retailers to manage. One key approach to reduce the discoloration risk would be to breed cultivars that are ‘resistant’ to postharvest discoloration development [
30]. In this context, landraces can be considered potential sources. In our study, all except variety L11, we visually observed that the other landraces behaved similarly to the commercial varieties in discoloration terms (a drop of around 20% from T0 to T9;
Table S1). This implies that their storage capacity would be the equivalent, however they are not presently considered for market purposes. Chlorophyll loss was observed in all the varieties, except CL2, CL4 and L5 whose chlorophyll content increased at the beginning of storage times. As chlorophyll collaborates in neutralizing free radicals from damaging healthy cells [
48], increased Chl amount could be related to the stress protective response of these varieties. Along the same line, the visually observed discoloration could be associated with the generalized Chl loss that took place among varieties. Thus the differences in the changes in discoloration over time appeared to be specific to lettuce type, as proposed by Atkinson et al. [
30]. Examples of this would be the discoloration scores obtained for some landraces compared to the commercial varieties with a similar structure, such as L5 vs. CL3 (semi-open head) and L1 and L10 vs. CL2 (romaine type).
Similarly, chlorophylls (green color) are not the only pigment relevant for color determination as the pigments that cause coloration in lettuce leaves also include anthocyanins (red-purple color) and carotenoids (yellow-orange color) [
22]. The wide range of varieties available on the market includes different colors or mixtures in leaf zones or in the plant itself. So the proportion of these compounds in lettuce is very interesting, and even more so for its nutraceutical value.
In photosynthetic tissue, carotenoids, together with chlorophylls, operate in light harvesting and perform tasks during photo-protection by quenching free radicals, singlet oxygen and other reactive oxygen species (ROS) [
49]. At the different storage times of our study, there were significant correlations between carotenes and other antioxidant compounds, which would highlight the antioxidant properties of these pigments in lettuce. The biosynthesis of carotenoids is regulated by light, which means that differences in carotenoid content in lettuce types has been suggested to be related to head structure [
11,
12]. Kim et al. [
11] and Baslam et al. [
13] suggested that as crisphead has a closed head, the leaves inside receive less light than the leaves in open-head or semi-open lettuce types, which results in lower carotenoid synthesis. In contrast, romaine lettuce has an open-head structure, which allows more light to penetrate and results in higher carotenoids accumulation. However, these assumptions were not met in our study. Variety CL4, one which has the largest and closest heads, obtained the highest Car values at T0, while Car in the L1 and L2 romaine lettuces was not even detected. Simko et al. [
22] stated that the yellow–orange color provided by carotenes was masked in photosynthetically active tissues. It was most likely that the large amount of Chl in lettuce tissues could have eclipsed Car content as both compounds were determined together. Specifically, landrace L1 had the highest Chl concentration in our study at T0. When observing the Car content over the postharvest period, no pattern appeared to explain the behavior of varieties, not even for lettuce type. Changes in the content of these pigments seemed to be dependent on each variety. CL3, L1 and L2 started to synthesize carotenes from day 3, when lettuces were exposed to light. In these cases, the relation of carotenes with the incidence of light was evident. However, varieties CL1 and CL2 displayed the opposite behavior. For all these reasons, Car content did not provide us with any enlightening information for our study. We can only state that Car concentration appears to be specific to lettuce variety, which is most likely due to genetic background.
As mentioned in the previous case, the Ant concentration also seemed limited partly by the incidence of light [
16], favored by low leaf overlap rates. Anthocyanins appear abundantly in red-colored lettuce [
50,
51]. The biological functions of anthocyanins have been related to their antioxidant capacity and as photo-protectors of the photosynthetic apparatus [
28,
52]. This would, therefore, imply that the reddest varieties, with the highest Ant concentration, namely CL4 and L11, were those with the highest antioxidant potential. We observed that the correlations between anthocyanins and the other antioxidant compounds in this study were less correlated as postharvest time elapsed, however the relation linking this pigment to total phenols and overall antioxidant capacity remained significant and positive. We also observed that Ant content tended to increase during storage, which led us to believe that its antioxidant capacity was key during the postharvest period. So those varieties with a good synthesis capacity of anthocyanins would be interesting. Variety L10 should also be highlighted in Ant concentration terms. Although it did not stand out for its synthesis of anthocyanins during storage, it remained unperturbed. That is to say, it would appear that storage conditions did not destabilize it as anthocyanins were neither significantly degraded nor synthesized. Likewise, there is evidence for a high heritability of Car, Chl [
53] and Ant [
54] contents that would facilitate the selection of new cultivars with a desirable combination of traits for breeding programs [
22].
Regarding Phe content, it has been suggested that red leaf lettuce cultivars present larger amounts of phenolics [
8,
11,
25,
27,
50] which is, in turn, related to their high anthocyanin content and, thus, contribute to total antioxidant capacity [
27]. This would allow us to think that the behavior of phenols during lettuce preservation should follow a similar pattern to that of anthocyanins. It is true that reddish varieties L11 and CL4 stood out for their high Phe contents. As with anthocyanins, during storage a generalized phenol synthesis event was observed throughout the postharvest period. The individual behavior of each variety did not exactly coincide, however it was similar as far as the compound synthesis time is concerned. In the specific case of Phe, phenolic content increased at T9 in all the studied varieties, even in variety L10, which had remained unchanged until that time. This reflects the close relation between phenols and anthocyanins, which was also supported by the positive correlations between both at T0 and T9. At intermediate times T3 and T6, a positive correlation between the two compounds was not detected due to the diversity of responses obtained by varieties, although the majority of varieties showed obvious changes in Phe content at T3. The results obtained with this trial contrast those reported by Ferreres et al. [
55] and Dupont, et al. [
56] who claimed that postharvest processing and storage resulted in significant losses of flavonoids and phenolic contents in several lettuce cultivars, which could be due to either the employed storage conditions or the resistance capacity of the studied varieties.
As with Car and Ant, there is evidence that light intensity plays a crucial role in AsA content in cultivated leafy vegetables [
17,
23,
24]. Increased light intensity promotes the activity of the enzymes involved in vitamin C metabolism, which accelerates its synthesis in plant leaves [
57]. Ascorbic acid, also known as vitamin C, is considered a primary source of antioxidants in human diet as it reduces plant oxidative processes [
58]. As previously mentioned, red varieties CL4 and L11 contained the largest amount of AsA, followed by varieties L2 and L5. In our varieties, this indicates that plant structure, in relation to light incidence, does not particularly influence vitamin synthesis as varieties CL4 and L2 were those with the most pronounced bud. Therefore in this particular case, the genetic compound that would regulate vitamin C synthesis would be stronger than the environmental one. While observing the behavior of varieties, we observed that AsA content decreased with time, and became more gradual (with no significant differences in the initial treatments) in varieties CL1 and L1. For variety L10, there was no significant loss of AsA until T9. Once again, this highlights the landrace’s conservation capacity. All this supports the notion that the postharvest decay of fruit and vegetables is due mainly to the continuous consumption of their own nutrients [
59,
60]. For this reason, when we observe the correlation table, we can see that AsA is closely related to the total antioxidant capacity of lettuce at T0, however this relation subsequently fades.
H
2O
2 content and LP were determined as oxidative stress indicators. It has been suggested that anthocyanins inhibit LP [
61,
62]. This prediction is true when we look at the results of Ant and LP as each LP spike matched an anthocyanin synthesis event, with its subsequent peroxidation rate correction. A permanent correlation also appears between Ant content and LP, which was accentuated at T3. Based on this finding, the varieties with higher Ant content or greater pigment synthesis capacity under stress would better control the LP rate, which in our case would probably be CL4, L5 and L11. LP was not excessively altered in any variety but was unlike that observed in H
2O
2 quantification. A gradual increase in H
2O
2 content took place mainly in varieties CL1, L1 and L10. Conversely, variety L11 remained unperturbed, and varieties CL2, CL4 and L5 were able to effectively slow down the rising H
2O
2. These findings could indicate that other types of ROS could be implicated in the LP process; an apparently controlled process on a generalized basis, while the system controlling H
2O
2 concentration would be significantly altered. This could indicate the lesser ability of varieties CL1, L1 and L10 to withstand postharvest conditions. However, the other quantifications and the performed visual quality determination indicated the opposite. Therefore, the imbalance in the H
2O
2 accumulation in these cases may not cause these varieties excessive damage.
Concerning nitrate accumulation, nitrogen intake is known to influence plant growth and development [
63], and its main usable forms are NO
3− and ammonium (NH4
+) [
64]. The nitric form is preferred by most plants [
65], including lettuce [
66,
67]. Unfortunately, nitrate content is considered to be potentially dangerous for health, especially for its reaction products and metabolites, such as nitrite, nitric oxide and N-nitroso compounds [
17,
68,
69]. Therefore, in line with the World Health Organization, the European Commission Regulation 1881/2006 (EC, 2006) sets the maximum thresholds of nitrates in lettuce. According to this regulation, fresh lettuces harvested between October and March, and grown in the open air, must not exceed a threshold of 4000 mg NO
3 kg
−1 FW, except for ‘Iceberg’ type (2000 mg NO
3 kg
−1 FW). The harvest period seems to be a determining factor as nitrate content assimilation in cultivated leafy vegetables is regulated by light intensity [
57]. According to these data, none of the study varieties exceeded the maximum allowable nitrate concentration. Notwithstanding, and depending on starting levels and their evolution, two different behaviors are observed in lettuce: 1) the varieties with a low nitrate transformation rate (to potentially dangerous products), such as L11; 2) the varieties with low initial levels like L5 and L10, which suggests less efficient NO
3− absorption systems. To support this, the different propensity to accumulate nitrate can be related to: genetic factors [
23,
24,
66]; the variable location of nitrate reductase activity [
70]; differential nitrate absorption, transfer and assimilation in plants [
23]. It also depends on the quantity available in substrate [
24], although this variable is not applicable to our study as all the lettuces were grown under the same field conditions.
Commercial lettuce production also requires adequate potassium levels to provide the high-quality postharvest attributes needed for a longer shelf life [
46]. It is known that plant growth and yield are strongly affected by substrate K availability [
46,
71]. By growing lettuce varieties in the same soil in our study, we were able to compare the K accumulation capacity of our different lettuce varieties. Landrace L11 stood out from the rest, even though it was the worst preserved one during the postharvest period. This confirmed that some varietal genetic differences allow potassium to be taken up or retained more or less easily.
5. Conclusions
From the analysis comparing the postharvest evolution in the nutrient composition and visual quality of the five local Valencian lettuce landraces and four commercial varieties, we conclude that:
(1) The initial nutritional quality (T0) depends on lettuce type, especially due to leaf color and structure. In this regard, reddish varieties CL4 and L11 stand out for their high concentration of bioactive compounds;
(2) Postharvest behavior (T3, T6, T9) of lettuces is variety dependent. Among them, landrace L10 highlights as both, its nutraceutical content and visual appearance, are maintained along the storage period;
(3) Regarding other varieties, such as CL4, L2, L5 and L11, visual quality may not correspond to their bioactive properties, as antioxidant compound (anthocyanins, carotenes and phenols) synthesis events occurred during the storage period, likely as response to storage stress conditions;
(4) Based on consumer judgment, we highlight the already commercial varieties CL2 and CL3, followed by landraces L1 and L10, which retained their good appearance (firmness, freshness and color) through storage.


 ,
, 

