Article

Growth Performance and Nitrogen Fixing Efficiency of Faba Bean (Vicia faba L.) Genotypes in Symbiosis with Rhizobia under Combined Salinity and Hypoxia Stresses

1
Laboratory of Legumes and Sustainable Agrosystems, Biotechnology Center of Borj-Cedria. B.P. 901, Hammam-Lif 2050, Tunisia
2
Faculty of Science of Tunis, University of Tunis el-Manar, el-Manar II, Tunis 2098, Tunisia
3
INRA, Sophia Agrobiotech Institute (ISA), Nice Sophia Antipolis University, 1355 INRA/7254 CNRS, 0600 Nice, France
4
Laboratory of Olive Biotechnology, Biotechnology Center of Borj-Cedria. B.P. 901, Hammam-Lif 2050, Tunisia
5
Laboratory of Field Crops, National Institute of Agronomic Research of Tunisia (INRAT), University of Carthage, Ariana 2080, Tunisia
*
Author to whom correspondence should be addressed.
Agronomy 2022, 12(3), 606; https://doi.org/10.3390/agronomy12030606
Submission received: 17 January 2022 / Revised: 22 February 2022 / Accepted: 25 February 2022 / Published: 28 February 2022

Abstract

:
The present study was carried out in order to investigate the behaviour of six faba bean (Vicia faba Minor) genotypes (Saber 02, Locale, Baachar, Badii, Chourouk and Najeh) in response to salinity and flooding (hypoxia), either alone or combined, to identify tolerant genotypes and to select efficient faba bean-rhizobia symbiosis under salinity and/or hypoxia conditions. faba bean genotypes were cultivated in three agricultural soils with either low (160 µs/cm) or moderate (1850 µs/cm) salt content and submitted or not to a 30-day long flooding period. Growth parameters and photosynthetic performance were analyzed at the end of the flowering period. At harvest time, the Najeh genotype showed the highest dry mass production in both control and hypoxia conditions (7.90 and 6.75 g/plant, respectively), whereas Saber 02 showed the lowest (3.75 and 2.25 g/plant, respectively). Differences between genotypes were less marked in salinity or combined salinity/flooding conditions. Principal component analysis of the analyzed parameters revealed that the Najeh genotype presents the best growth and the lowest photosynthetic perturbation and lipid peroxidation levels, whether under control or hypoxic conditions, whereas Saber 02 and Locale genotypes were less productive. Ninety bacteria strains were isolated from Vicia faba root nodules. Of these, 47 strains were identified as rhizobia, and 20 were able to re-nodulate the host plant. After the characterization, identification and selection process, four strains were selected as the best faba bean symbiotic partners based on their symbiotic efficiency and salt tolerance behaviours. Our results suggest that faba bean tolerant genotypes in symbiosis with these strains could be useful in enhancing legume cultivation under saline and hypoxia field conditions.

1. Introduction

Plants encounter different environmental constraints such as salinity and flooding which limit their growth and productivity. In many regions, soil salinity is a major problem for agriculture, especially in arid and semi-arid areas where the soil salt content is naturally high and rainfall is often insufficient for leaching [1]. Today, more than 20% of arable lands in the world are considered saline [2]. In addition, irrigating crops with brackish or saline water tends to worsen the situation, resulting in lower crop productivity [3,4]. In Tunisia, more than 10% of the whole territory and 18% of arable lands are affected by salinity [5]. The decrease in plant growth observed in saline soils is due to osmotic stress generated by salt, specific ionic toxicities, nutrient deficiencies, or a combination of these factors [2,6,7]. Salt excess is particularly known to inhibit photosynthesis due to the decrease in stomatal conductance, stomata closure and the limitation of CO2 diffusion in chloroplasts [8,9]. In legumes, salt stress also strongly inhibits biological nitrogen fixation and, consequently, plant growth as well as biomass production in grain and/or fodder [2,10]. On the other hand, the excess of water in the rhizosphere also affects growth, as water slows down the transfer of oxygen (O2) and other gases between the soil and the atmosphere [11]. Thus, flooding and waterlogging lead to hypoxia of soils due to the rapid uptake of O2 in the rhizosphere and an almost 104-fold reduction in the diffusion of O2 in water compared to air [12]. Worldwide, nearly 2 billion hectares of land are flooded each year [13] and this phenomenon is reinforced by violent floods, associated with climate change, which have been steadily increasing for several decades [14]. In addition, in certain agricultural regions, the limitation of water reserves leads to periodic irrigation. Thus, either during the rainy season or between two irrigation rounds, agricultural areas can be flooded or engorged with water for several days, or even weeks, during the vegetative growth of crops. In Tunisia, nearly one million hectares of land (25% of arable land) are thus regularly flooded each year. Hypoxia leads to decrease O2 availability in the roots resulting mainly in mitochondrial respiration decline and leading to insufficient ATP for energy-consuming processes [15]. Moreover, hypoxia results in reduced photosynthesis, degradation of chlorophyll and deficiencies in N, P and K [16].
Much of the saline soils around the world are also prone to water logging due to the presence of shallow water tables or decreased infiltration of surface water due to sodicity [17]. The combined effects of salinity and flooding have been little discussed [18], although it is crucial to consider their interactions to understand the behaviour of crops in saline soils, and these must be taken into account in the design of revegetation programs for land affected by salt [19]. A few studies, taking into account this double constraint, have been carried out in tomato [20], common reed (Gorai et al.) [21] or sweet clover [22], with the objective to characterize the stress tolerance traits of species or genotypes likely to be used in varietal selection. faba beans (Vicia faba) are considered as major crops in North Africa. In Tunisia, these are the most widely cultivated legumes and occupy nearly 40,000 ha with average yields of around 7 quintals per hectare. In faba beans, the effects of hypoxia and salinity were analyzed separately, on root development for hypoxia [23] and on the physiological and biochemical response of the whole plant for salinity [24]. Few studies analysed the double hypoxia-NaCl stress on γ-aminobutyric acid accumulation [25,26], but no study has analyzed the effects of the double constraint on growth parameters. The selection of legume genotypes with better tolerance to hypoxia and salinity is therefore an important agronomic objective to allow more efficient use of legumes either alone or in rotation with other crops. The challenge is to improve their growth and increase their yield, on the one hand, and to maintain a significant supply of organic nitrogen in the soil for the cultivation of cereals on the other hand. Previous works [27,28,29] reported that for legumes, simultaneous selection of either tolerant genotypes and symbiotic microbial strains is a suitable strategy to enhance legume productivity under such conditions.
In the present work, we aimed at characterizing tolerant/sensitive Faba bean genotypes toward combined salinity and flooding stress, and at selecting efficient symbiotic rhizobia strains tolerant to salinity, in order to improve legume productivity under salinity and flooding conditions. To this end, we first analyzed the effects of both salinity and flooding, either alone or combined, on vegetative growth and photosynthetic performance of six faba bean genotypes cultivated on three agricultural soils in Tunisia. Second, rhizobium bacteria strains were isolated and selected from nodules of the six faba bean genotypes. The salt tolerance and the ability to fix atmospheric nitrogen for 20 of them were evaluated.

2. Materials and Methods

2.1. Experimental Soils

Three composite soils were collected from the North-East of Tunisia: Soil 1 was taken from an agricultural plot in the region of Korba and was used as the control soil; Soil 2 (saline soil) was taken from a salinized plot near the Korba lagoon—the soil is representative of flat and salty bottom of a closed depression, without vegetation, characterized by saline efflorescence during dry periods, flooded by flood waters or upwelling during periods of rain; Soil 3 was taken from a silty plot in the region of Soliman. The main physico-chemical characteristics of the three soils are reported in Table 1. The organic matter content, total phosphorus, total nitrogen, total organic carbon (TOC), potassium and conductivity in the soils were determined according to the protocols described in SSICA [30].

2.2. Plant Materials and Experimental Plan

Seeds of the faba bean used in this study were provided by the Field Crops Laboratory, National Agricultural Research Institute of Tunisia (INRAT). These genotypes were selected and registered in the Tunisian Varietals Catalog for their high productivity in Tunisia (JORT 2004). Faba bean seeds from six genotypes (Saber 02, Locale, Baachar, Badii, Chourouk and Najeh) of uniform size were selected, surface sterilized first with 95% alcohol and then by 2% sodium hypochlorite, and extensively washed with sterile distilled water, before being submerged in distilled water for 6 h. The hydrated seeds were sowed in 15-cm-diameter plastic pots in 1 kg of collected soil samples (Soil1, Soil 2 and Soil 3), with 4 plants per pot and 10 pots per genotype. Sixty pots from each soil type were placed in a greenhouse at 22/16 °C day/night temperatures, at 60–70% relative humidity and a 16/8 h photoperiod, irrigated with distilled water (4 times per week).
Two weeks after sowing, half of the plants (5 pots) were submitted to flooding stress (hypoxia) by immersion of their root part (up to the hypocotyl) in tap water. The second half of the plants (5 pots) constitutes the control in normoxia. They are watered once every two days and are in the same growing conditions as plants under flooding.
Thirty days after flooding application, shoots, roots, and nodules were harvested. Six plants were used for growth analysis, six plants for plant biomass measurement, and six plants for biochemical measurements (chlorophyll, protein and sugar contents, lipid peroxidation assay). One part was used for growth parameters analysis, and the remaining material was frozen at −80 °C for biochemical analysis. Three independent experiments were carried out for each treatment.

2.3. Growth Analysis

Parameters related to plant growth included the length of the lateral root (LR) and the shoot (LS), and the number of nodules (NN). LS and LR were calculated by measuring the distance between the crown and the leaf tip [cm] and the crown and the root tip [cm], respectively.

2.4. Plant Biomass

Fresh mass of roots and shoots were measured on fresh material; dry mass of roots (DMR) and shoots (DMS) were determined after desiccation of the samples for three days in a 65 °C oven.

2.5. Chlorophyll Content and Gas Exchange Measurement

Chlorophyll measurement was achieved as described by Wintermans and Mots [31]. About 100 mg of fresh leaves were homogenized with a mortar and pestle in 10 mL 80% (v/v) acetone (8 mL acetone with 2 mL distilled water). The mixture was then strongly shakenand kept at 4 °C for 48 h. After centrifugation for 1 min at 20,000× g, the absorbance of the supernatant was measured at 663 nm for chlorophyll a (Chl a), at 645 nm for chlorophyll b (Chl b) and 470 nm for carotenoids. Total chlorophyll content was calculated as the following [31]:
Chl a = 9.78 OD663 − 0.99 OD645
Chl b = 21.42 OD645 − 4.65 OD663
Chl a + b = 6.1 OD663 + 20.04 OD645

2.6. Photosynthetic Parameters

As net assimilation rate of CO2 (A), total transpiration (E), stomatal conductance (Gs) and intercellular CO2 concentrations (Ci) were measured using the ADC LCpro+ portable Photosynthesis measuring system (ADC Bioscientific Ltd., Hoddesdon, UK) equipped with different gaschambers, according to manufacturer instructions. The measurements were done under the following conditions: saturating light intensity of about 1.350 μmol (photon) m−2 s−1, CO2 concentration of 380 μmol mol−1, leaf temperature of 25 ± 2 °C, and relative humidity was 65 ± 5%. The measurement time was between 11:00 AM and 1:00 PM corresponding to the optimum of the photosynthetic activity. For each treatment, six plants were considered as different biological replicates

2.7. The Electrolyte Leakage

100 mg of leaf discs from the middle part of the freshly cut leaves (three plants per genotype and per treatment) were put in assay tubes repleted with 10 mL of ultrapure water. The tubes were incubated in a water bath for two hours at 32 °C. Then, the first electrical conductivity (EC1) of the solution was measured using a 712 conductometer (Metrohm). The tubes were then autoclaved at 100 °C for 20 min and cooled at ambient temperature, and the second electrical conductivity (EC2) was measured. The electrolyte leakage was measured by the formula EL = (EC1/EC2) × 100 [32].

2.8. Lipid Peroxidation Assay

Lipid peroxidation was estimated according to Cakmak and Horst [33]. 0.5 mg of fresh leaf sample (three plants per genotypes and per treatment) were homogenized in 0.1% (w/v) trichloro-acetic acid (TCA) solution, and centrifuged at 12,000× g for 15 min at 4°C.The supernatants were recovered, supplemented with 0.5% (w/v) thiobarbituric acid (TBA) in 20% (w/v) (TCA), and incubated at 100 °C for 20 min. The samples were then cooled in an ice bath and centrifuged at 10,000× g for 5 min. In addition, the absorbance of the supernatants was read at 532 nm, the value for non-specific absorption at 600 nm was subtracted to the 532 nm value, and the concentration of malondialdehyde-TBA complex (MDA-TBA) was calculated using an extinction coefficient of 155 Mm−1 cm−1.

2.9. Proteins Assay

The extraction of total proteins was effected at 4 °C. Plant samples (three plants per treatment) were homogenized into liquid nitrogen in a mortar with 1% (w/w) polyvinylpolypyrrolidone (PVPP) and 1 mLof phosphate buffer pH 7.8 (50 mM) containing 5 mM EDTA, 0.1% (v/v) Triton X-100, 1.5 mM DTT and 1 mM phenylmethylsulfonyl fluoride (PMSF), a protease inhibitor. Crude extract was centrifuged at 12,000× g for 25 min, the supernatant was collected, and the soluble protein contents were measured using bovine serum albumin as standard [34].

2.10. Sugar Assay Determination

Total soluble carbohydrates were extracted in 80% (v/v) methanol and measured in leaves and roots using the anthrone-sulfuric acid method with glucose as the standard as described in Horchani et al. [35].

2.11. Isolation of Bacterial Strains

Five to twenty nodules per Vicia faba genotype were collected, surface sterilized with 70% ethanol for 2–3 min, and with 0.1% HgCl2, and then washed four times with sterile distilled water [36]. The nodules were crushed and streaked on YEMA medium (Yeast Extract Mannitol Agar) as described by Vincent [37]. To check on the purity of single colonies repeated streaking were made on YEMA medium containing Congo red. Isolates were incubated at 28 °C and maintained in a 20% (v/v) glycerol solution at −80 °C according to Somasegaran and Hoben [36].

2.12. DNA Isolation

Total genomic DNA was isolated from 2 mL liquid cultures, mid log phase, of the rhizobium strains as described by Ausubel et al. [38]. The cells were lysed with 40 µL sodium dodecyl sulphate (SDS) 10% (v/v) (4 µL SDS and 36 µL distilled water), protein–lipopolysaccharides complexes were removed by using 5% (p/v) cetyltrimethylammonium bromide (CTAB), and DNA was precipitated from solution adding 0.6 isopropanol and incubated at −20 °C for overnight. Next day the pellet was washed with cold 70% ethanol (directly from −20 °C freezer) and let dry at room temp for 20 min. At the end, the pellet was resuspended in 170 µL of DNase-free water. The concentration of DNA was estimated by measuring the OD at 260 nm with Thermo FIisher Scientific NanoDrop 2000/2000c Spectrophotometer.

2.13. Amplification of the nodC Gene

The nodC gene from the Rhizobium isolates was amplified by PCR by using forward primer nodCf (5′-GCTGCCTATGCAGACGATG-3′) and reverse primer nodCr (5′ GGTTACTGGCTTTCATTTGGC-3′) [39], obtained from Rhizobium leguminosarum bv. viciae strain USDA 2478 (GeneBank accession number D28960). PCRs were realized out in 25 µL reaction mixtures according to Moschetti et al. [40] following the conditions below: 1 cycle at 94 °C for 5 min, followed by 35 cycles of 94 °C for 1 min, 55 °C for 1 min, 2 min at 72 °C and a final cycle at 72 °C for 7 min. PCR products stained with ethidium bromide were parted on a 1% (p/v) agarose gel at 100 V for 20 min in TBA buffer and visualized under UV light.

2.14. PCR Amplification of the 16S rRNA Gene

Bacteria were identified on the basis of their 16S rDNA gene sequences. Primers fD1 and rD1 [41] were utilized to amplify 16S rRNA genes [41]. Amplified products resulting from PCR reactions were purified in agarose gels using the EZ-10 spin column DNA gel extraction kit (Bio Basic Inc. Markham, ON, Canada). Purified fragments were sequenced on an ABI3130 genetic analyzer (Applied Biosystems). Sequences were assembled by the CAP program (http://doua.prabi.fr/software/cap3, accessed on 17 January 2022) and checked manually. The accession numbers are given in Table 2. The BLAST program (http://blast.ncbi.nlm.nih.gov/Blast.cgi, accessed on 17 January 2022) was used to search for sequence similarities in DNA databases.

2.15. Nodulation Assay

Seeds of the Najeh genotype faba bean were surface sterilized with 70% alcohol and 2% sodium hypochlorite, then thoroughly washed five times with sterile distilled water. After imbibition in sterile distilled water, seeds were retained in darkness at 4 °C overnight. Then, seeds were germinated in autoclaved perlite moistened with sterile distilled water for 3 days at 28 °C according to Mhadhbi et al. [42]. After germination, seeds were sowed into plastic pots (500 mL) filled with autoclaved sand. Plants were inoculated with one rhizobia strains (out of 20 rhizobia strains), and the control plants were nitrogen fertilized with KNO3 as a source of nitrogen without any bacterial inoculation. Six plants in six different pots were used for every strain. Two inoculations were performed after the transfer of the seeds in the pots. The first inoculation was carried out two weeks after the transfer and the second one after one month. Plants were grown for sixty days in a growth chamber under controlled conditions (16/8 h light/darkness, 19 °C in the dark with a relative humidity (RH) of 60% and 25 °C in the light with a RH of 80%, photosynthetic photon flux density of 300 μmol m−2 s−1) and watered with a nitrogen-free nutrient solution as described by Vadez et al. [43]. Root and shoot length, nodule number and ARA were independently measured on the six replicates.

2.16. Acetylene Reduction Assay (ARA)

Nitrogen fixation capacity was measured by acetylene reduction assay (ARA), in situ, using gas chromatography with a Porapak-column, according to Hardy et al. [44]. As detailed in Mhadhbi et al. [45], pure acetylene and ethylene were used as external standards.

2.17. Analysis of Bacteria Salinity Stress Tolerance

The salinity test was performed out on purified strains using various concentrations of NaCl (350 to 800 mM). A pre-culture of each strain was cultured for two days (shaking at 150 rpm, at 28 °C) in yeast extract Mannitol-Broth medium (YEM). Then, 1 mL of an equivalent of 0.04 OD unit culture was inoculated to 100 mL YEM supplemented with varying concentrations of NaCl [46]. Non-inoculated YEM medium was used as control. Bacterial growth was checked by measuring the optical density at 600 nm over a 5-days period. Three independent experiments were carried out for each treatment.

2.18. Statistical Analysis

Multivariate analysis and Two-way ANOVA variance analysis were performed using the SPSS software ver. 20, Inc., Chicago, IL, USA program.
The differences between treatment data were estimated using the STATISTICA software and the means of comparison by HSD (higher significant difference) Duncan’s test (p ≤ 0.05).
Results for growth parameters (DM, FM, nodule number, Chl, A, gs, E and Ci) are means of six replicates for each treatment.
Three replicates were performed for ARA, sugars, lipid peroxidation measurements and electrolytes leakage.
The statistical analysis “Principal Component Analysis (PCA)” was performed using the overall analyzed parameters in the study. The PCA analysis was performed to (1) classify the genotype groups, (2) identify genotypes with opposing behavior, and (3) fix the axes and important characters contributing to the diversification. The ranking of faba bean genotypes for the tolerance to salt and hypoxia stress and was performed using the selective physiological and morphological parameters under stress.

3. Results

3.1. Vegetative Growth Analysis

As a first approach, the vegetative growth parameters of the six faba bean genotypes (Saber 02, Locale, Baachar, Badii, Chourouk and Najeh) were analyzed on 45-day-old plants as a function of the nature of the soil (salinized or non-salinized) and the submission to a 30-day-long flooding period.
In control condition (Soil 1 in normoxia—N) and based on shoot and root dry mass (SDM and RDM), the Najeh genotype had the highest biomass production (5.1 and 2.7 g/plant for SDM and RDM, respectively), while Saber 02 (3.0 and 0.7 g/plant for SDM and RDM, respectively) and Locale (2.0 and 1.0 g per plant for SDM and RDM, respectively) genotypes are the least productive (Table 2). Regardless of soil salinity, all genotypes produce more SDM (+40 to 250%) in silty Soil 3 than in control Soil 1. In this soil, Saber 02, Baachar and Najeh genotypes have the highest SDM, and Locale the lowest. Their RDM production is similar to that obtained in Soil 1, with the exception of the Saber 02 and Locale genotypes whose RDM are significantly higher (+230 and 185% respectively). In saline soil (Soil 2), both the SDM and RDM of the different genotypes are significantly reduced (66 to 73% for shoots, 39 to 82% for roots), with the exception of Locale (Table 2). In Soil 2, the SDM of the six genotypes is statistically the same. In Soils 1 and 3, the length of shoots and roots is little different between the different genotypes (Table 2). In contrast, the presence of salt in the soil (Soil 2) results in a 5–30% decrease in shoot length and 25–50% in root length. The number of nodules per plant varies according to the genotype considered. In non-saline soils, the highest nodule number is observed in Najeh (45–54nodules/plant) and the lowest in Saber 02 (17–25 nodules/plant). The presence of salt in the soil (Soil 2) reduces the nodule number by 90 to 100% in all genotypes (Table 2). Flooding stress (hypoxia–H) results in a 5 to 70% decrease in SDM and RDM for the 6 genotypes (Table 2). In non-saline soils, Locale and Najeh SDM are little affected by flooding, while that of Saber 02 and Baachar are strongly reduced. Regarding RDM, the Najeh genotype exhibits the highest biomass (1.5 and 1.7 g per plant in Soil 1 and Soil 3, respectively) and Saber 02 the lowest (0.3 and 0.7 g per plant in Soil 1 and Soil 3, respectively). In the presence of combined salinity and flooding, the SDM of the 6 genotypes is little affected by flooding. In contrast, Najeh is the only genotype for which RDM is significantly increased by flooding.
While in non-saline soils shoot length is moderately reduced by flooding in the 6 genotypes (Table 2), the root length is significantly affected with a decrease of about 40 to 80%, and a reduction in the number of nodules per plant was observed (Table 2). The Badii genotype is an exception in that it is the least affected in its root growth and that flooding does not lead to a decrease in the number of nodules per plant. In the presence of combined salinity and flooding, leaf length is not affected any more than in the presence of salinity alone (Table 2). In contrast, with the exception of Najeh genotype, root length is more strongly affected by combined stress (Table 2). The presence of combined stress results in the absence of nodule in Saber 02 and Locale genotypes (Table 2).

3.2. Photosynthesis and Chlorophyll Contents

Parameters linked to photosynthesis, as well as the chlorophyll contents, were then analyzed in the leaves of the 6 faba bean genotypes to investigate the effects of salt and flooding on the plant capacity to fix CO2 and produce sugars. As reported in Table 3, the net assimilation rate of CO2 (A), the stomatal conductance (Gs), the intracellular CO2 concentration (Ci) and the transpiration (E) are of the same magnitude order for the 6 genotypes grown on control soils (Soils 1 and 3). For the 6 genotypes tested, transpiration is markedly higher on silty soil (Soil 3) than on sandy soil (Soil 1). On the other hand, chlorophyll contents vary between 5 and 24 mg/g FM (Najeh and Badii, respectively) and, for the same genotype, change significantly between Soil 1 and Soil 3 (Table 3).
The presence of salt (Soil 2) results in a drop in the net assimilation rate of CO2 (by approximately a factor 2) and an increase in intracellular CO2 concentration, while stomatal conductance is non-significantly affected (Table 3). Depending on the genotype, the chlorophyll content is either increased (Chourouk, Najeh), or decreased (Locale, Badii), or not affected (Saber 02, Bachar) by the presence of salt (Table 3), without being able to establish a relationship between this and the rate of net CO2 assimilation. The flooding treatment on Soil 1 results in an overall decrease in the net assimilation rate of CO2 (A) for the 6 genotypes, but it is either increased (Najeh) or not affected (Bachar and Badii) when plants are grown on silty soil (Soil 3). Under flooding, stomatal conductance is decreased, while transpiration and intercellular CO2 concentration are both increased. By comparison with non-stressed conditions, salinity plus flooding results in an overall drop in net CO2 assimilation rate in the 6 genotypes (Table 3). This decrease is accompanied by both a decrease in stomatal conductance (Gs) and an increase in the concentration of intercellular CO2 concentration (Ci, (Table 3).

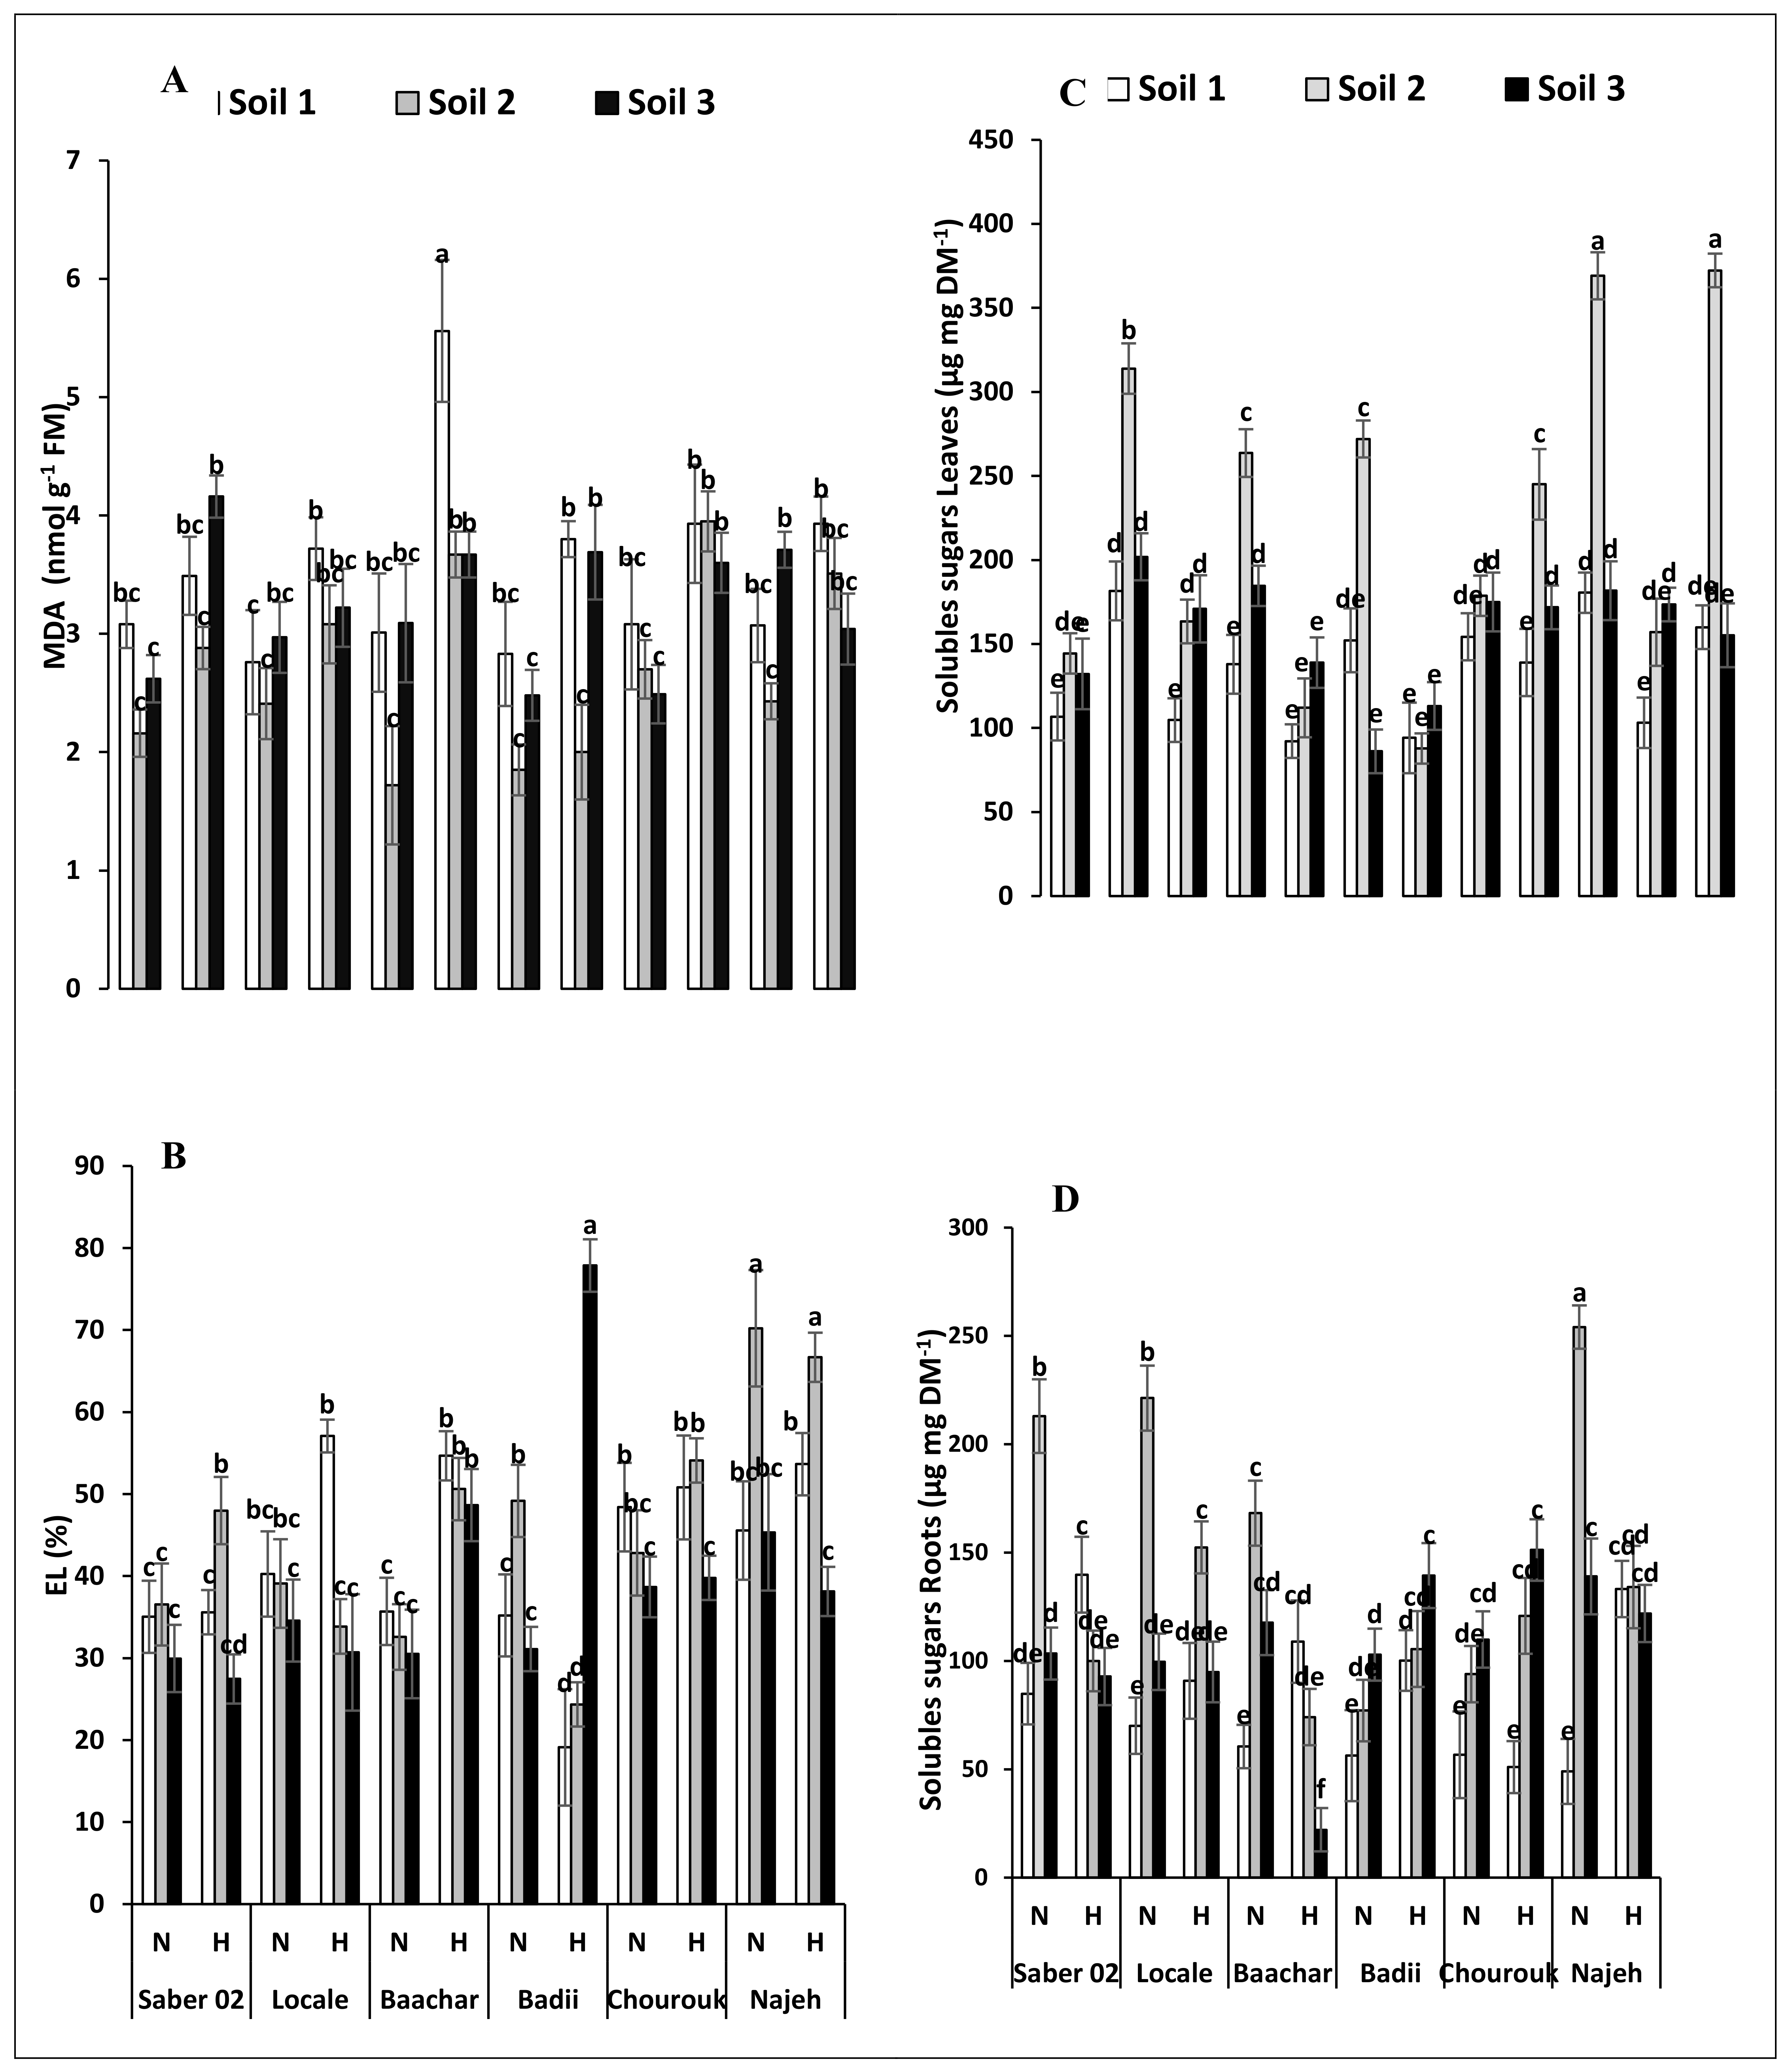
3.3. Peroxidation and Electrolyte Leakage

MDA is the major product of membrane lipid peroxidation, the contents of which may reflect the degree of damage to the cell membrane affected by reactive oxygen species (ROS). In control conditions, MDA contents are roughly equivalent in the leaves of the 6 genotypes of faba bean, whether on Soil 1 or on Soil 3 (Figure 1A). The presence of salt (Soil 2) causes a slight, non-significant drop in MDA contents. Under flooding, an opposite effect is observed with a slight increase in MDA contents, little marked for plants cultivated on Soil 1 and more significant for plants cultivated on Soil 3 (Figure 1A). The combined effect of salinity and flooding results in the absence of modification of the MDA content in the leaves of the 6 analysed genotypes.
Similarly, in the control situation (soils 1 and 3), the leaf electrolyte leakage is similar (between 30 and 45%) for the six genotypes on both sandy and silty soils (Figure 1B). The presence of salt triggers a slight increase in electrolyte leakage only in the Badii and Najeh genotypes. On the other hand, flooding results in little variation in electrolyte leakage in the 6 genotypes of Vicia faba (Figure 1B). Finally, combined salinity and flooding results in a slight increase in electrolyte leakage in the genotypes Saber 02, Baachar and Najeh, but not in the other three genotypes (Figure 1B).

3.4. Carbohydrate Contents

The leaf and root sugar contents reflect the balance between the activities of CO2 fixation and photosynthesis on the one hand, and the activities of consumption of the photosynthesis products for growth or tolerance to stress on the other hand. The contents of soluble sugars in the control plants are in the order of 100 to 150 µg g−1 DM in the leaves and 50 to 120 µg g DM in the roots (Figure 1C,D). Sugar contents are higher in the leaves and roots of plants grown on silty soil (Soil 3) than on sandy soil (Soil 1). In the presence of salt (Soil 2), soluble sugar contents increase by 1.2 to 5 times in the leaves and especially the roots of all genotypes, with the exception of Badii leaves (Figure 1C). Likewise, the flooding treatment causes a 1.3- to 3-fold increase in soluble sugars both in the leaves and the roots (Figure 1C,D), with the exception of Chourouk roots (Figure 1D). The highest increases in soluble sugars in stressed plant organs compared to controls ones are seen in the roots of the Najeh genotype. The combination of salinity and flooding results in a cumulative effect on the soluble sugars contents of the leaves of all genotypes. In the roots, the double constraint causes either the decrease (Saber 02, Locale, Baachar, Najeh) or the maintenance (Badii, Chourouk) of the soluble sugars contents when compared to the salt constraint alone.

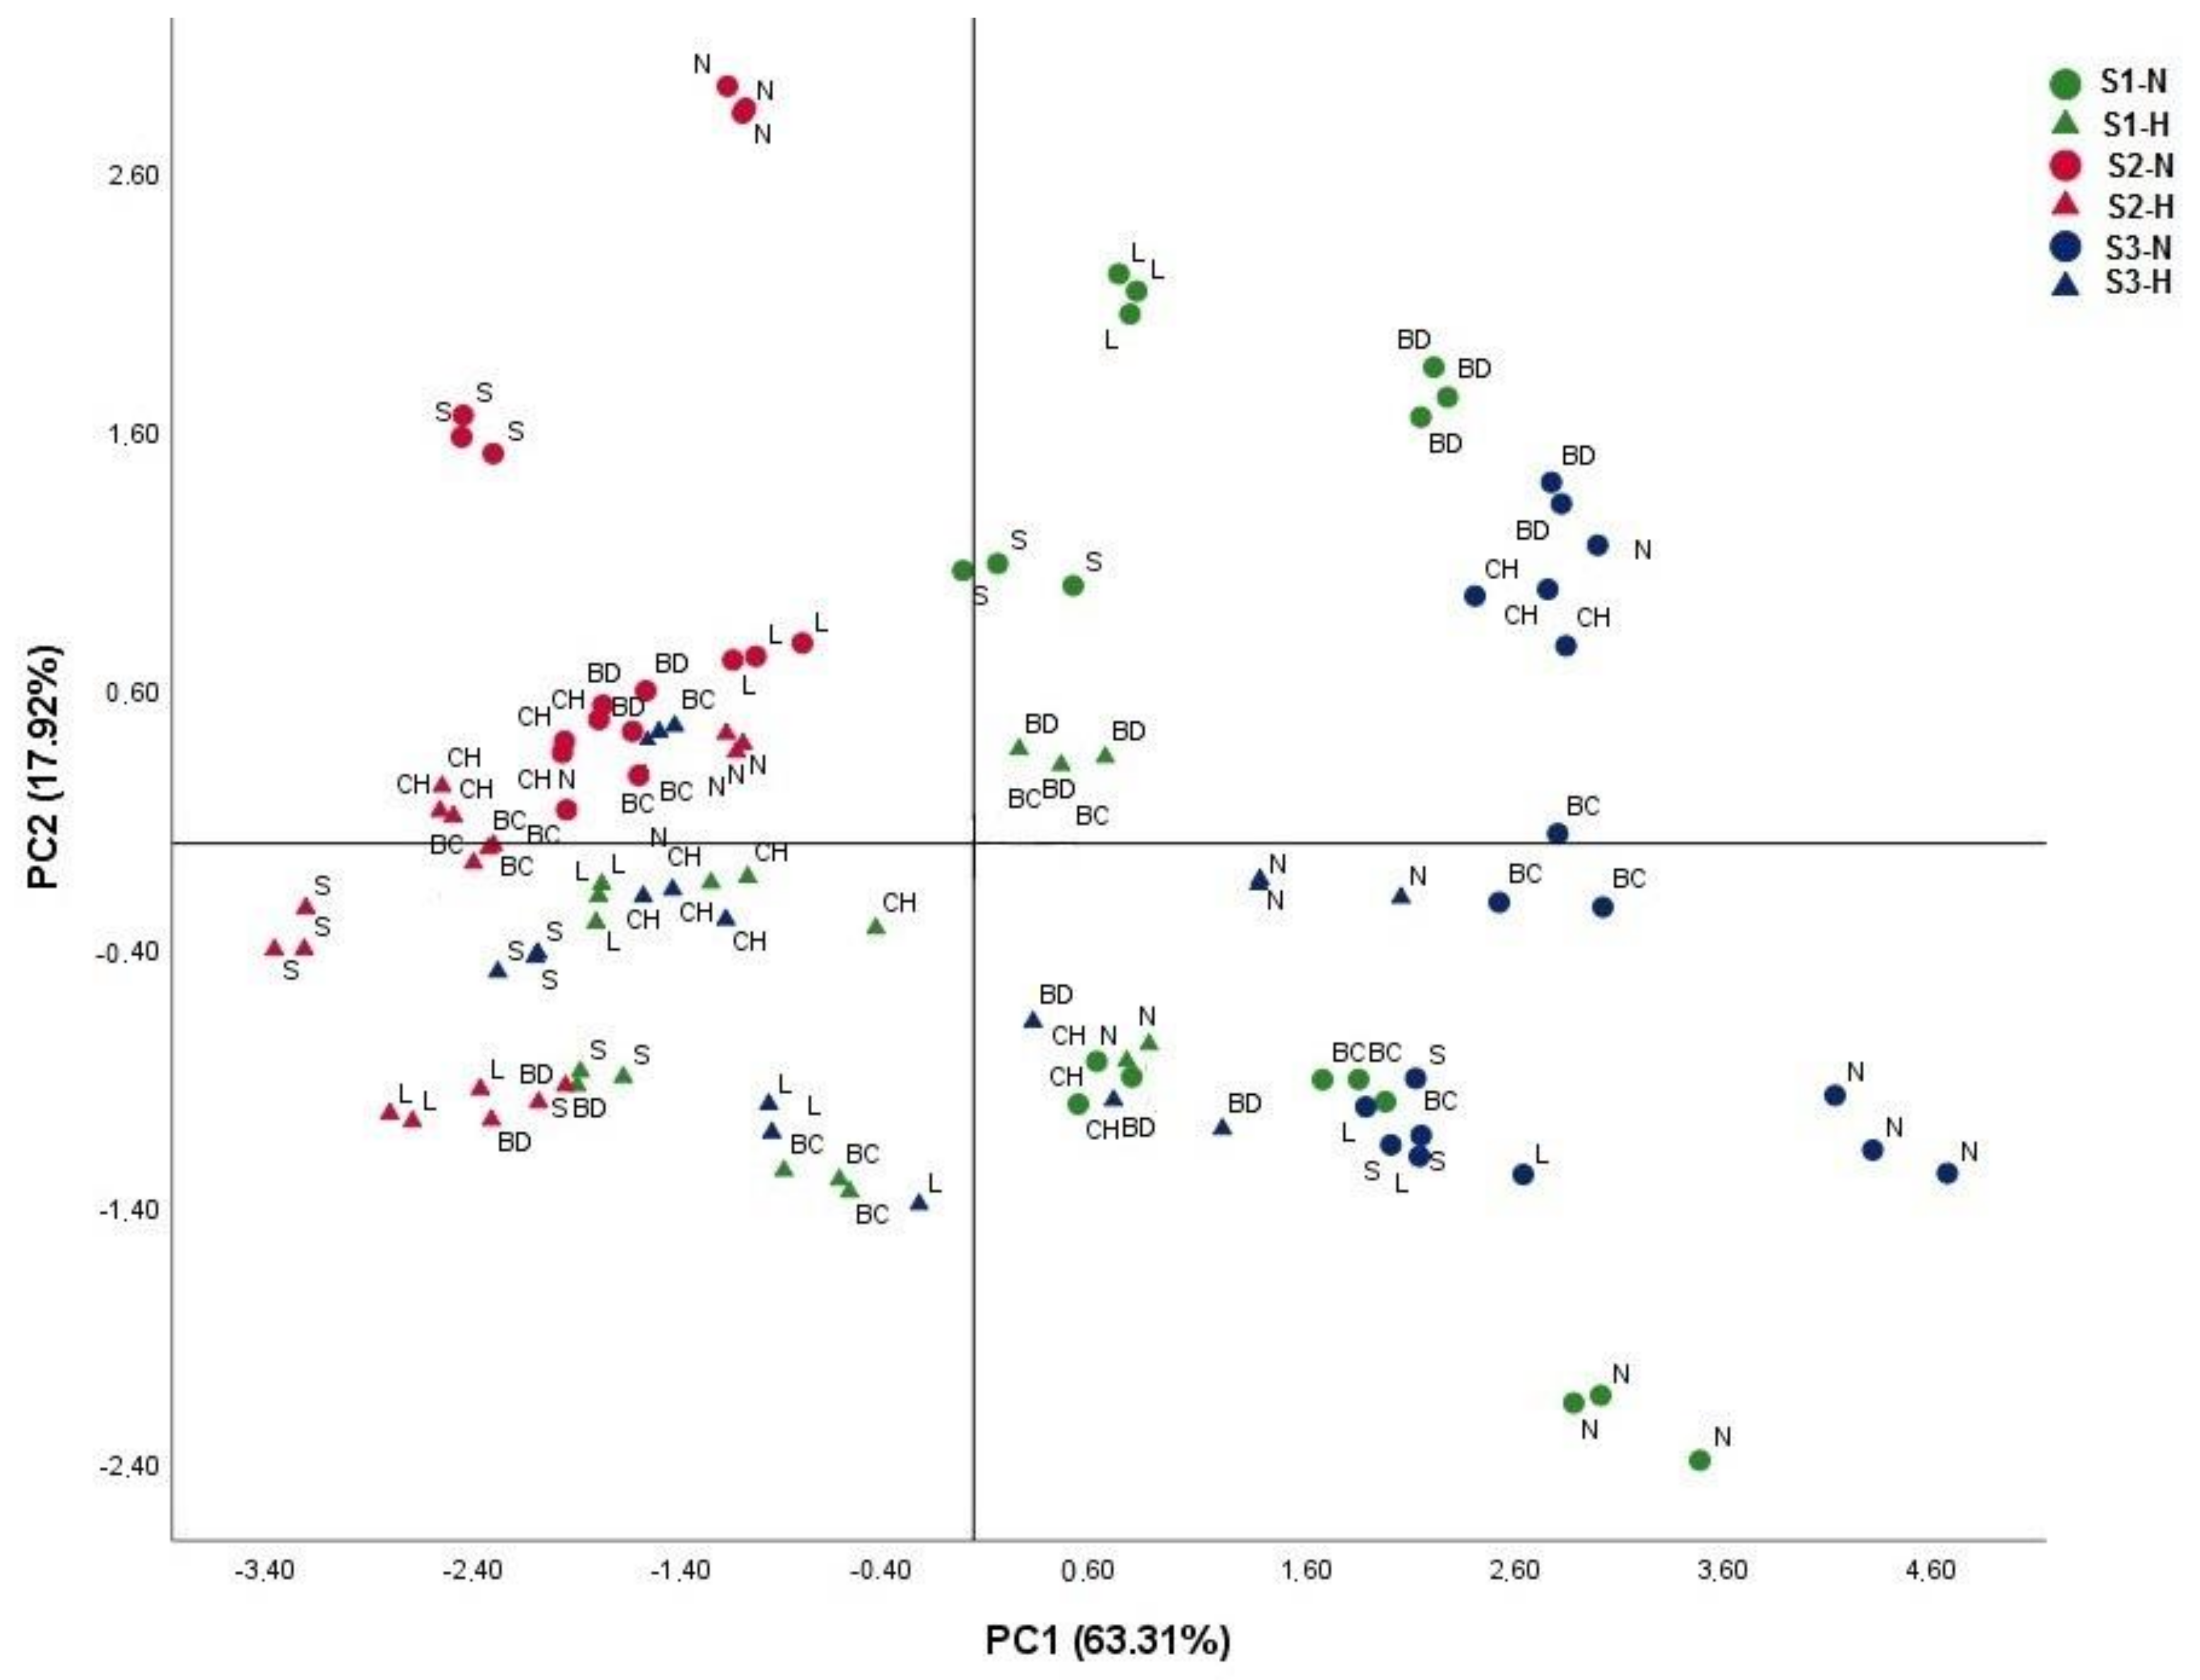
3.5. Selection of Efficient Genotype under Combined Salinity and Flooding

The analysis of variance for the various parameters studied on the six genotypes shows a significant effect for the three studied factors soils (S), treatment (T), genotypes (G) and their interaction (S*T*G) (Table 4). We note a high contribution of treatment effect to all variances and the strongest effect is for the chlorophyll content. Though, for SDM, soil shows the major effect, the genotype effect is shown remarkably in the variance of chlorophyll content. The interaction effect was lower for these parameters.
To get another meaningful analysis of these results, we performed a principal component analysis (PCA) on morphological parameters (root and shoot dry biomass, root and shoot length, and nodule number) of the six genotypes cultivated under hypoxia and/or salinity conditions (Figure 2). The first component (PC1) describes 63.31% of the original information and the second component (PC2) describes 17.92%. The cumulative percentage of PC1 and PC2 is 81.23%. The PCA shows two groups of genotypes. The first one (N—Najeh) is located on the positive side (flooding tolerant) and the second one (S—Saber, L—Local, BC—Bachar and CH—Chourouk) is located on the negative side (flooding sensitive).

3.6. Rhizobial Strains Selection and nodC Amplification

Ninety bacterial isolates forming root nodules on Vicia faba were obtained from the cultures performed in the three soils studied. After determination of the taxonomic status of these bacterial strains and analysis of the variation of the specific symbiotic gene (nodC), PCR analysis were performed to characterize the presence of the rhizobium specific nodC region in each bacterial strain. Fourty-seven rhizobium strains were characterized (Table S1).

3.7. Symbiotic Nitrogen Fixation Capacity

The 47 nodC positive strains were tested for their ability to nodulate the Vicia faba “Najeh” genotype (Table S1. The nodulation test showed that only 20 strains nodulatedthe host plant (Table 5). Among these strains, inoculation of Vicia faba by S12 and S23 enhanced shoots length by 49.7% and 36.8%, respectively, and roots length by 90% and 98%, respectively (Table 5), whereas inoculation with the strain S1 showed the lowest growth of Vicia faba Najeh genotype. On the other hand, inoculation with S12 and S26 resulted in the highest nodule numbers per plant, 67 and 56, respectively (Table 5). In terms of symbiotic nitrogen fixation, the strains generating the highest number of nodules per plant (S12, S21 and S26) led to the highest values of nitrogen fixation capacity as measured by ARA (Table 5). Based on their salinity tolerance limit (greater than or equal to 600 mM NaCl) and their nitrogen fixation capacity (Table 5), four lines (S12, S21, S23 and S26) were considered both efficient for plant growth and tolerant to salinity, and subsequently sequenced. The nucleotide sequence of the amplified DNA was determined and compared with available 16S rRNA sequences in Gen Bank using the BLAST program (http://blast.ncbi.nlm.nih.gov/Blast.cgi, accessed on 17 January 2022). The subsequent BLAST analysis show that the strain S21 presents 99% homology with EF549399.1 Rhizobium sp. CCBAU 83480, the strains S23 and S26 present 98% and 99% homology, respectively, with JN105993.1 Rhizobium leguminosarum strain 35-1, and the strain S12 presents 98.8% homology with EU074196.1 Rhizobium leguminosarum strain CCBAU 03285.

4. Discussions

4.1. Stress Conditions Differently Affect Genotype Productivity

It emerges from this study that, when the faba beans are grown in non-stressed conditions on sandy soil (Soil1), theNajeh genotype exhibits the highest biomass production (SDM + RDM), while the Saber 02 and Locale genotypes are the least productive (Table 2). On the other hand, the Saber 02 and Bachar genotypes are more productive on a silty soil (Soil 2) and present a production close to that of Najeh, which indicates that in the absence of environmental constraint, the texture and nature of the soil influence differently the productivity of each genotype. Unlike biomass, the growth of the aerial and root parts (Table 2) is not different from one genotype to another, which means that the genotypes with lower biomass are richer in water than the others. On the other hand, we can note a positive relationship between the dry biomass and the number of nodules per plant (Table 2), which suggests that the production of biomass is associated with an efficient functioning of the nitrogen fixation.
The productivity of the six genotypes is affected differently by flooding/hypoxia. Thus, the Najeh and Badii genotypes are those which retain the best yields, both for the aerial and root parts, while the genotypes Saber 02, Locale, Baachar and, to a lesser extent,Chourouk are the most affected by hypoxia (Table 2). Interestingly, Najeh and Badii, which maintained root growth and produce nitrogen fixing nodules, also maintained the best biomass production under hypoxia (Table 2). Previous studies of the effects of flooding on nodulation and nitrogen fixation in legumes showed a relationship between tolerance to hypoxia and the ability of the plant to form aerenchyma to allow oxygen to diffuse in roots and nodules [16]. Thus, in flood tolerant species, such as Lotus pedunculatus [47], Trifolium subterraneum [48], Melilotus siculus [49] or Vicia faba [23], the formation of aerenchyma in the roots and nodules increases the diffusion of oxygen to the nodules and thus makes it possible to maintain an energy metabolism compatible with efficient nitrogen fixation. It is therefore likely that the growth of the different faba bean genotypes under hypoxia is limited by their ability to develop a nitrogen-fixing symbiosis and to provide the plant with the reduced nitrogen it needs. In this regard, the principal component analysis on morphological parameters (Figure 2) clearly shows that the Najeh genotype, whose number of nodules per plant remains high in flooding conditions (Table 2), is characterized as a tolerant genotype to hypoxia, while the Saber 02 genotype, whose number of nodules per plant is low, appears to be a genotype sensitive to hypoxia.
The six genotypes are significantly and similarly affected by the presence of moderate salt concentration (equivalent to 20 mM NaCl, Table 1) in the soil, confirming the overall sensitivity of faba bean to salinity [2]. It should be noted that the number of nodules per plant is very strongly impacted by the presence of salt in the soil (Table 2), much more than the other parameters analyzed within the framework of this study (Table 2, Table 3, Table 4 and Table 5, Figure 1). This suggests that in faba beans the biological nitrogen fixation is particularly sensitive to salinity and that this would be a major limiting factor of plant growth in saline soil, more than photosynthesis (Table 4) or sensitivity to oxidative stress (Figure 1). These results are in agreement with previous observations which show that in so-called “salt-sensitive” legumes, biological nitrogen fixation is more sensitive to salinity than growth [2,50,51].

4.2. Photosynthesis Does Not Limit Faba Bean Growth under Stress Conditions

The analysis of the photosynthesis parameters shows that for the 6 genotypes studied (1) the net assimilation rate of CO2 is of the same order of magnitude, (2) the net assimilation rate of CO2 is reduced by approximately 50% in the presence of 20 mM NaCl, (3) flooding/hypoxia affects the net assimilation rate of CO2 differently in each genotype and (4) the effects of the combined salt and hypoxic stress on the net assimilation rate of CO2 are additive (Table 4). The inhibition of net CO2 uptake is mainly related to a decrease in stomatal conductance (Gs), as already observed in the response of Phaseolus vulgaris to hypoxia [52] and of Phragmites australis [21] and Solanum lycopersicum [20] to the double saline and hypoxic constraint. As also previously observed in faba bean under salt stress [24], or in other legumes subjected to either salt stress [53,54] or hypoxia [52], the total chlorophyll content in faba bean shoots is also altered in response to these two stresses (Table 2). However, no correlation between CO2 uptake and chlorophyll contents emerged from our study, which indicates that the photosynthetic machinery is not the limiting factor in CO2 uptake under saline and/or hypoxic stress. Although photosynthesis is affected by salinity and hypoxia, increasing or maintaining the levels of soluble sugars in the shoots and roots of the 6 faba bean genotypes (Figure 1C,D) indicates that photosynthesis is less affected by both stresses than sugar-consuming functions. Thus, the tolerance or sensitivity of Vicia faba genotypes to salinity and/or hypoxia is probably explained more by the sensitivity of physiological functions such as the symbiotic nitrogen fixation and assimilation, than by the decrease in photosynthesis (Table 4), the alteration of membrane systems or the sensitivity to oxidative stress (Figure 1A,B). According to our results, a tolerant faba bean genotype was capable of conserving its photosynthesis and biomass and therefore surmount salinity and flooding conditions. Photosynthetic and biomass parameters were considered as the most discriminating features to classify faba bean genotypes. A similar study showed that tolerant cultivars of barley had gas-exchange traits unmodified or less affected under salinity stress [55]. Our results were also in agreement with those of Rajhi et al. [56], who proved that photosynthetic capacity is an important trait for the plant to tolerate salt stress. Considering biomass and photosynthetic parameters, we could select pair genotypes with contradictory behavior to the combined stress salinity and hypoxia which is Najeh as tolerant and Saber as sensitive.

4.3. Identification of Salt Tolerant Rhizobial Strains and Their Effect on Symbiosis Performance

We revealed a variation in symbiotic performance between symbioses (Table 5), in agreement with the results of Mhadhbi et al. [42] and Tirichine et al. [57], who reported variability of symbiotic effectiveness between M. truncatula genotypes and S. meliloti strains. Similarly, Jebara et al. [58] reported different efficiency levels of Tunisian Sinorhizobium populations when inoculated into M. truncatula. We noted an important effect of the Vicia faba–rhizobia interaction to the aerial production, nodules numbers and the nitrogen-fixing capacity (Table 5). According to Mhadhbi et al. [29], this effect may be related to the metabolism of the bacterial partner in nodules and its variable interaction with plant metabolism. Such results promote the suggestion that the improvement in legume production through symbiotic nitrogen fixation should be based not only on the selection of effective plant genotypes and rhizobia strains, but also on the assessment of the most efficient associations [27,28,59].
This suggestion is further supported by the positive correlation found between nodules numbers and ARA, a result showed the reciprocal exchange of nitrogen compounds from nodules to shoots and from shoots to nodules [60].
The rhizobia strain had little effect on the root and shoots length, which was essentially dependent on the Vicia faba genotypes, probably because of the preferential allocation of nitrogen to aerial parts [61]. The number of nodules was mainly controlled by the rhizobia genotype, consistent with several studies on rhizobia infectivity [62,63]. Otherwise, Penmetsa et al. [64] reported that rhizobia attachment to the roots, and therefore nodule number, was, also controlled by plant genotype.
In this study, we examined the genetic biodiversity of 90 nodule-producing bacteria using nodC PCR analysis to characterize rhizobia isolates obtained from root nodules. PCR results showed that 47 strains had the specific nodC nodulation gene. The diversity of isolated strains of nodules is probably due to the symbiotic promiscuity of faba beans, the long history of cultivation of this leguminous host in Tunisian soils and the horizontal transfer of genes among soil microorganisms. The symbiotic characterization of performant-tolerant rhizobia strain-faba bean genotypes allowed the selection of four strains that were effective with the tolerant Najeh genotype and enhanced its resilience under combined hypoxia–salt stress. This result is of great interest at the applied level, since our former work showed that selection of such efficient and tolerant micro-symbionts enhances the legume productivity under abiotic constraints [27,28,29,45].

5. Conclusions

This study showed the potential of the ‘‘Najeh’’ genotype faba bean as an annual forage legume species for moderately saline and flooded soils in North-East Tunisia and countries with Mediterranean-type climates. Although moderately tolerant of salinity, the Najeh genotype appears to be hypoxia tolerant when compared to other genotypes.
Our study allowed four rhizobium strains (S12, S21, S23 and S26) to be characterized as both salt-tolerant and efficient for nitrogen fixation. Cultivation of these rhizobium strains in symbiosis with the Najeh genotype could be able to enhance the tolerance and productivity of faba bean in agricultural land affected by adverse salinity–flooding constraints. Behaviors of these selected symbiotic associations will be evaluated for field trial confirmation with the potential aim of commercial release.

Supplementary Materials

The following are available online at https://www.mdpi.com/article/10.3390/agronomy12030606/s1, Table S1: Amplification of the NODc gene of 47 selected bacteria, isolated from root nodules of six genotypes of Vicia faba: S—Saber 02, L—Locale, BC—Bachar, BD—Badii, CH—Chourouk et N—Najeh. grown in three different soils. (+) positive result.

Author Contributions

Formal analysis, I.R., S.R., K.M. and Z.A.; Funding acquisition, K.Z.; Supervision, R.B. and H.M.; Validation, W.T.; Writing—original draft, S.B.; Writing—review & editing, I.N., R.B. and H.M. All authors have read and agreed to the published version of the manuscript.

Funding

This research was funded by The PHC Utique Tunisian-French bilateral collaborative project] grant number [17GO904] And the APC was funded by the Sophia Agrobiotech Institute (ISA), Nice, France.

Data Availability Statement

Not applicable.

Acknowledgments

This work was supported by the Tunisian Ministry of Higher Education and Scientific Research and the Franco-Tunisian Committee for University Cooperation (PHC-Utique, Grant n°17G0904).

Conflicts of Interest

The authors declare that they have no conflict of interest.

References

  1. Zhao, G.Q.; Ma, B.L.; Ren, C.Z. Growth, gas exchange, chlorophyll fluorescence, and ion content of naked oat in response to salinity. Crop Sci. 2007, 47, 123–131. [Google Scholar] [CrossRef]
  2. Bruning, B.; Rozema, J. Symbiotic nitrogen fixation in legumes: Perspectives for saline agriculture. Environ. Exp. Bot. 2013, 92, 134–143. [Google Scholar] [CrossRef]
  3. Glenn, E.P.; Brown, J.J.; Blumwald, E. Salt Tolerance and Crop Potential of Halophytes. Crit. Rev. Plant Sci. 1999, 18, 227–255. [Google Scholar] [CrossRef]
  4. Hafsi, C.; Romero-Puertas, M.C.; Gupta, D.K.; del Rio, L.A.; Sandalio, L.M.; Abdelly, C. Moderate salinity enhances the antioxidative response in the halophyte Hordeum maritimum L. under potassium deficiency. Environ. Exp. Bot. 2010, 69, 129–136. [Google Scholar] [CrossRef]
  5. Hachicha, M.; Job, J.O.; Mtimet, A. Les sols salés et la salinisation en Tunisie. Sols Tunis 1994, 15, 271–341. [Google Scholar]
  6. Ashraf, M.; Foolad, M.R. Roles of glycine betaine and proline in improving plant abiotic stress resistance. Environ. Exp. Bot. 2007, 59, 206–216. [Google Scholar] [CrossRef]
  7. Isayenkov, S.V.; Maathuis, J.M. Plant salinity stress: Many unanswered questions remain. Front. Plant Sci. 2009, 10, 80. [Google Scholar] [CrossRef] [Green Version]
  8. Chaves, M.M.; Flexas, J.; Pinheiro, C. Photosynthesis under drought and salt stress: Regulation mechanisms from whole plant to cell. Ann. Bot. 2009, 103, 551–560. [Google Scholar] [CrossRef] [Green Version]
  9. Degl’Innocenti, E.; Hafsi, C.; Guidi, L.; Navari-Izzo, F. The effect of salinity on photosynthetic activity in potassium deficient barley species. J. Plant Physiol. 2009, 166, 1968–1981. [Google Scholar] [CrossRef]
  10. Flowers, T.J. Improving crop salt tolerance. J. Exp. Bot. 2004, 55, 307–319. [Google Scholar] [CrossRef]
  11. Blom, C.W.P.M.; Voeseneck, L.A.C.J. Flooding: The survival strategy of plants. Trends Ecol. Evol. 1996, 11, 290–295. [Google Scholar] [CrossRef] [Green Version]
  12. Armstrong, W. Aeration in higher plants. In Advances in Botanical Research; Woolhouse, H.W., Ed.; Academic Press: Cambridge, MA, USA, 1979; pp. 225–332. [Google Scholar]
  13. Voesenek, L.A.C.J.; Sasidharan, R. Ethylene-and oxygen signaling-drive plant survival during flooding. Plant Biol. 2013, 15, 426–435. [Google Scholar] [CrossRef] [PubMed]
  14. Bailey-Serres, J.; Fukao, T.; Gibbs, D.; Holdsworth, M.J.; Lee, S.C.; Licausi, F.; Perata, P.; Voesenek, L.A.C.J.; van Dongen, J.T. Making sense of low oxygen sensing. Trends Plant Sci. 2012, 17, 129–138. [Google Scholar] [CrossRef]
  15. Bailey-Serres, J.; Colmer, T.D. Plant tolerance of flooding stress recent advances. Plant Cell Environ. 2014, 37, 2211–2215. [Google Scholar] [CrossRef] [PubMed]
  16. Striker, G.G.; Colmer, T.D. Flooding tolerance of forage legumes. J. Exp. Bot. 2017, 68, 1851–1872. [Google Scholar] [CrossRef] [Green Version]
  17. Qadir, M.; Oster, J. Crop and irrigation management strategies for saline-sodic soils and waters aimed at environmentally sustainable agriculture. Sci. Total Environ. 2004, 323, 1–19. [Google Scholar] [CrossRef] [PubMed]
  18. Barrett-Lennard, E.G. The interaction between waterlogging and salinity in higher plants: Causes, consequences and implications. Plant Soil 2003, 253, 35–54. [Google Scholar] [CrossRef]
  19. Flowers, T.J.; Colmer, T.D. Salinity tolerance in halophytes. New Phytol. 2008, 179, 945–963. [Google Scholar] [CrossRef] [PubMed]
  20. Horchani, F.; Hajri, R.; Khayati, H.; Aschi-Smiti, S. Physiological responses of tomato plants to the combined effect of root hypoxia and NaCl salinity. J. Phytol. 2010, 2, 36–46. [Google Scholar]
  21. Gorai, M.; Ennajeh, M.; Khemira, H.; Neffati, M. Combined effect of NaCl-salinity and hypoxia on growth, photosynthesis, water relations and solute accumulation in Phragmites australis plants. Flora 2010, 205, 462–470. [Google Scholar] [CrossRef]
  22. Striker, G.G.; Teakle, N.L.; Colmer, T.D.; Barrett-Lennard, E.G. Growth responses of Melilotus siculus accessions to combined salinity and root-zone hypoxia are correlated with differences in tissue ion concentrations and not differences in root aeration. Environ. Exp. Bot. 2015, 109, 89–98. [Google Scholar] [CrossRef]
  23. Munir, R.; Konnerup, D.; Khan, H.A.; Siddique, K.H.M.; Colmer, T.D. Sensitivity of chickpea and faba bean to root-zone hypoxia, elevated ethylene, and carbone dioxide. Plant Cell Environ. 2019, 42, 85–97. [Google Scholar] [CrossRef] [Green Version]
  24. Achour, A.; Benjedou, H.; Kadiri, A.; Fares, I.; Belkhodja, M. Vicia faba (L.) physiological and biochemical response under saline conditions. Int. J. Agric. Biosci. 2020, 9, 36–42. [Google Scholar]
  25. Yang, R.; Yin, Y.; Guo, L.; Han, Y.; Gu, Z. Sequence analysis of diamine oxidase gene from faba bean and its expression related to g-aminobutyric acid accumulation in seeds germinating under hypoxia-NaCl stress. J. Sci. Food Agric. 2014, 94, 1585–1591. [Google Scholar] [CrossRef] [PubMed]
  26. Yang, R.; Wang, S.; Yin, Y.; Gu, Z. Hypoxia treatment on germinating faba bean (Vicia faba L.) seeds enhances GABA-related protection against salt stress. Chil. J. Agric. Res. 2015, 75, 184–191. [Google Scholar] [CrossRef] [Green Version]
  27. Mnasri, B.; Mrabet, M.; Laguerre, G.; Aouani, M.E.; Mhamdi, R. Salt-tolerant rhizobia isolated from a Tunisian oasis that are highly effective for symbiotic N2-fixation with Phaseolus vulgaris constitute a novel biovar (bv. mediterranense) of Sinorhizobium meliloti. Arch. Microbiol. 2007, 187, 79–85. [Google Scholar] [CrossRef] [PubMed]
  28. Tajini, F.; Drevon, J.; Lamouchi, L.; Aouani, M.E.; Trabelsi, M. Response of common bean lines to inoculation: Comparison between the Rhizobium tropici CIAT899 and the native Rhizobium etli 12a3 and their persistence in Tunisian soils. World J. Microbiol. Biotechnol. 2008, 24, 407–417. [Google Scholar] [CrossRef]
  29. Mhadhbi, H.; Fotopoulos, V.; Mylona, P.V.; Jebara, M.; Polidoros, A.N.; Aouani, M.E. Role of antioxidant gene-enzyme responses in Medicago truncatula genotypes with different degrees of sensitivity to high salinity. Physiol. Plant 2011, 141, 201–214. [Google Scholar] [CrossRef] [PubMed]
  30. Institute of Soil Science, Chinese Academy of Sciences. Soil Physical and Chemical Analysis. Physical and Chemical Analyses of Soils; Shanghai Academic Press: Shanghai, China, 1980. [Google Scholar]
  31. Wintermans, J.; Mots, A. Spectrophotometric characteristic of chlorophylls a and b and their pheophytins in ethanol. Biochem. Biophys. Acta 1965, 109, 448–453. [Google Scholar]
  32. Fan, L.; Zheng, S.; Wang, X. Antisense suppression of phospholipase D alpha retards abscisic acid-and ethylene-promoted senescence of postharvest Arabidopsis leaves. Plant Cell 1997, 9, 2183–2196. [Google Scholar] [CrossRef]
  33. Cakmak, I.; Horst, W.J. Effect of aluminiumon lipid peroxidation, superoxide dismutase, catalase, and peroxidase activities in root tips of soybean (Glycine max). Physiol. Plant 1991, 83, 463–468. [Google Scholar] [CrossRef]
  34. Bradford, M.M. A rapid and sensitive method for the quantitation of microgram quantities of protein utilizing the principle of protein-dye binding. Anal. Biochem. 1976, 72, 248–254. [Google Scholar] [CrossRef]
  35. Horchani, F.; Khayati, H.; Raymond, P.; Brouquisse, R.; Aschi-Smiti, S. Contrasted effects of prolonged root hypoxia on tomato (Solanum lycopersicum) roots and fruits metabolism. J. Agron. Crop Sci. 2009, 195, 313–318. [Google Scholar] [CrossRef]
  36. Somasegaran, P.; Hoben, H.J. Handbook of Rhizobia: Methods in Legume Rhizobium Technology; Springer: Berlin, Germany, 1985. [Google Scholar]
  37. Vincent, J.M. A Manual for the Practical Study of Root-Nodule Bacteria; Blackwell: Oxford, UK, 1970. [Google Scholar]
  38. Ausubel, F.M.; Brent, R.; Kingston, R.E.; Moore, D.D.; Smit, J.A.; Seidman, J.C.; Struhl, K.S. Current Protocols in Molecular Biology; Wiley: New York, NY, USA, 1994. [Google Scholar]
  39. Mhamdi, R.; Laguerre, G.; Aouani, M.E.; Mars, M.; Amarger, N. Different species and symbiotic genotypes of field rhizobia can nodulate Phaseolus vulgaris in Tunisian soils. FEMS Microbiol. Ecol. 2002, 41, 77–84. [Google Scholar] [CrossRef] [PubMed]
  40. Moschetti, G.; Peluso, A.L.; Protopapa, A.; Anastasio, M.; Pepe, O.; Defez, R. Use of nodulation pattern, stress tolerance, nodC amplification, RAPD-PCR and RFLP-16S rDNA analysis to discriminate genotypes of Rhizobium leguminosarum biovar viciae. Syst. Appl. Microbiol. 2005, 28, 619–631. [Google Scholar] [CrossRef] [PubMed]
  41. Weisburg, W.G.; Barns, S.M.; Pelletier, D.A.; Lane, D.J. 16S ribosomal DNA amplification for phylogenetic study. J. Bacteriol. 1991, 173, 697–703. [Google Scholar] [CrossRef] [Green Version]
  42. Mhadhbi, H.; Jebara, M.; Limam, F.; Huguet, T.; Aouani, M.E. Interaction between Medicago truncatula lines and Sinorhizobium meliloti strains for symbiotic efficiency and nodule antioxidant activities. Physiol. Plant. 2005, 124, 4–11. [Google Scholar] [CrossRef]
  43. Vadez, V.; Rodier, F.; Payre, H.; Drevon, J.J. Nodule permeability to O2 and nitrogenase-linked respiration in bean genotypes varying in the tolerance of N2 fixation to P deficiency. Plant Physiol. Biochem. 1996, 34, 871–878. [Google Scholar]
  44. Hardy, R.W.F.; Bums, C.; Hebert, R.R.; Holsten, R.D. Applications of the acetylene-ethylene assay for measurement of nitrogen fixation. Soil Biol. Biochem. 1973, 5, 47–81. [Google Scholar] [CrossRef]
  45. Mhadhbi, H.; Fotopoulos, V.; Djebali, N.; Polidoros, A.N.; Aouani, M.E. Behaviors of Medicago truncatula-Sinorhizobium meliloti symbioses under osmotic stress in relation with the symbiotic partner input: Effects on nodule functioning and protection. J. Agron. Crop. Sci. 2009, 195, 225–231. [Google Scholar] [CrossRef]
  46. Mrabet, M.; Zribi, K.; Mhadhbi, H.; Djébali, N.; Mhamdi, R.; Aouani, M.E.; Nakamura, K. Salt tolerance of a Sinorhizobium meliloti strain isolated from dry lands: Growth capacity and protein profile changes. Ann. Microbiol. 2011, 61, 361–369. [Google Scholar] [CrossRef]
  47. James, E.K.; Sprent, J.I. Development of N2-fixing nodules on the wetland legume Lotus uliginosus exposed to conditions of flooding. New Phytol. 1999, 142, 219–231. [Google Scholar] [CrossRef]
  48. Aschi-Smiti, S.; Chaibi, W.; Brouquisse, R.; Ricard, B.; Saglio, P. Assessment of enzyme induction and aerenchyma formation as mechanisms for flooding tolerance in Trifolium subterraneum ‘Park’. Ann. Bot. 2003, 91, 195–204. [Google Scholar] [CrossRef] [PubMed] [Green Version]
  49. Konnerup, D.; Toro, G.; Pedersen, O.; Colmer, T.D. Waterlogging tolerance, tissue nitrogen and oxygen transport in the forage legume Melilotus siculus: A comparison of nodulated and nitrate-fed plants. Ann. Bot. 2018, 121, 699–709. [Google Scholar] [CrossRef] [PubMed]
  50. Delgado, M.J.; Ligero, F.; Lluch, C. Effects of salt stress on growth and nitrogen fixation by pea, faba-bean, common bean and soybean plants. Soil Biol. Biochem. 1994, 26, 371–376. [Google Scholar] [CrossRef]
  51. Zahran, H.H. Rhizobium-legume symbiosis and nitrogen fixation under severe conditions and in an arid climate. Microbiol. Mol. Biol. Rev. 1999, 63, 968–989. [Google Scholar] [CrossRef] [Green Version]
  52. Velasco, N.F.; Ligarreto, G.A.; Diaz, H.R.; Fonseca, L.P.M. Photosynthetic responses and tolerance to root-zone hypoxia stress of five bean cultivars (Phaseolus vulgaris L.). S. Afr. J. Bot. 2019, 123, 200–207. [Google Scholar] [CrossRef]
  53. Hernandez, J.A.; Jimenez, A.; Mullineaux, P.M.; Sevilla, F. Tolerance of pea (Pisum sativum L.) to long-term salt stress is associated with induction of antioxidant defenses. Plant Cell Environ. 2000, 23, 853–862. [Google Scholar] [CrossRef]
  54. Saha, P.; Chatterjee, P.; Biswas, A.K. NaCl pretreatment alleviates salt stress by enhancement of antioxidant defense system and osmolyte accumulation in mungbean (Vigna radiata L. Wilczek). Indian J. Exp. Biol. 2010, 48, 593–600. [Google Scholar]
  55. Mahlooji, M.; Seyed Sharifi, R.; Razmjoo, J.; Sabzalian, M.R.; Sedghi, M. Effect of salt stress on photosynthesis and physiological parameters of three contrasting barley genotypes. Photosynthetica 2018, 56, 549–556. [Google Scholar] [CrossRef]
  56. Rajhi, I.; Benmoussa, S.; Neji, I.; Baccouri, B.; Chikha, M.; Chammakhi, C.; Amri, M.; Mhadhbi, H. Photosynthetic and physiological responses of small seeded faba bean genotypes (Vicia faba L.) to salinity stress: Identification of a contrasting pair towards salinity. Photosynthetica 2020, 58, 174–185. [Google Scholar] [CrossRef]
  57. Tirichine, L.; de Billy, F.; Huguet, T. Mtsym6, a gene conditioning Sinorhizobium strain-specific nitrogen fixation in Medicago truncatula. Plant Physiol. 2000, 123, 845–852. [Google Scholar] [CrossRef] [Green Version]
  58. Jebara, M.; Mhamdi, R.; Aouani, M.E.; Ghrir, R.; Mars, M. Genetic diversity of Sinorhizobium populations recovered from different Medicago varieties cultivated in Tunisian soils. Can. J. Microbiol. 2001, 47, 139–147. [Google Scholar] [CrossRef] [PubMed]
  59. Mhadhbi, H.; Jebara, M.; Zitoun, A.; Limam, F.; Aouani, M.E. Symbiotic effectiveness and response to mannitol-mediated osmotic stress of various chickpea–rhizobia associations. World J. Microbiol. Biotechnol. 2008, 24, 027–1035. [Google Scholar] [CrossRef]
  60. Giller, K.E. Nitrogen Fixation in Tropical Cropping Systems; CAB International: Wallingford, UK, 2001; pp. 14–56. [Google Scholar]
  61. Elsheikh, E.A.E.; Wood, M. Nodulation and N2 fixation by soybean inoculated with salt-tolerant rhizobia or salt-sensitive brady rhizobia in saline soil. Soil Biol. Biochem. 1995, 27, 657–661. [Google Scholar] [CrossRef]
  62. Dardanelli, M.; Angelini, J.; Fabra, A. A calcium-dependent bacterial surface protein is involved in the attachment of rhizobia to peanut roots. Can. J. Microbiol. 2003, 49, 399–405. [Google Scholar] [CrossRef]
  63. Fraysse, N.; Couderc, F.; Poinsot, V. Surfacepolysaccharide involvement in establishing theRhizobium-legume symbiosis. Eur. J. Biochem. 2003, 270, 1365–1380. [Google Scholar] [CrossRef]
  64. Penmetsa, R.V.; Frugoli, J.A.; Smith, L.S.; Long, S.R.; Cook, D.R. Dual genetic pathways controlling nodule number in Medicago truncatula. Plant Physiol. 2003, 131, 998–1008. [Google Scholar] [CrossRef] [Green Version]
Figure 1. Effect of hypoxia and/or salinity stress on the content of MDA (A) and electrolyte leakage (B) in leaves of six Vicia faba seedling genotypes, the content of soluble sugars in leaves (C) and root (D) of six Vicia faba seedlings genotypes treated for 30 days on three different soils. Values are the means of three replications ± SE. The data followed by different letters are significantly different at p≤ 0.05. N—Normoxia, H—Hypoxia, Soil 1—Control, Soil 2—Saline, Soil 3—Dhari.
Agronomy 12 00606 g001
Figure 2. Principal component analysis (PCA) performed on six genotypes of Vicia faba under either normoxia or hypoxia defined by root dry weight, shoot dry weight, root length, shoot length, nodules number and chlorophyll content. The percentage of variation is presented on each corresponding axis. Abbreviation: S1-N—Soil 1-Normoxia, S1-H—Soil 1-Hypoxia, S2-N—Soil 2-Normoxia, S2-H—Soil 2-Hypoxia, S3-N—Soil 3-Normoxia, S3-H—Soil 3-Hypoxia. Soil 1—control, Soil 2—saline, Soil 3—Dhari. Genotypes: S—Saber 02, L—Locale, BC—Baachar, BD—Badii, CH—Chourouket N—Najeh.
Agronomy 12 00606 g002
Table 1. Content of organic material, total organic carbon, total nitrogen, total phosphorus, Exchangeable potassiumand percentage of particle size fractions in the investigated soils samples: Soil 1—Korba, Soil 2—Korba saline, Soil 3—SolimanDhari. % [per 100 g of dry mass].
IdentificationUnitSoils
Soil 1Soil 2Soil 3
Conductivityµs cm−11531849173
Organic materialg kg−1 DM36.424.744.1
Total organic carbon(TOC)g kg−1 DM16.58.511.3
Total nitrogeng kg−1 DM2.10.91.4
Total phosphorusg kg−1 DM1.11.31.4
Exchangeable Potassiumg kg−1 DM2.822.284.39
Clay%12.206.909.60
Silt%6.387.7052.10
Sand%78.5085.2038
Table 2. Shoot dry mass SDM [mg plant−1], root dry mass RDM [mg plant−1], shoots length SL [cm plant−1], roots length RL [cm plant−1] and number of nodules NN [N plant−1] in six Vicia faba genotypes. For each parameter, values followed by different letters are significantly different at p < 5% according to Duncan test. N—Normoxia, H—Hypoxia, Soil 1—Control, Soil 2—Saline, Soil 3—Dhari.
SoilsVarietiesParameters
SDM [mg Plant−1]RDM [mg Plant−1]Shoots Length [cm]Roots Length [cm]Nodules Number
[N plant−1]
NHNHNHNHNH
Soil 1Saber3 d1.9 d0.7 cd0.4 e69 b66 b31 b11 d17 e5 fg
Locale2 d1.7 d1.1 c0.5 de66.3 b66.3 b38.3 a8.5 d19 e3 g
Bachar3.3 c2.5 d2.1 b1.1 c71 b69 b26 b11.7 d43 b17 e
Badii4 c2.2 d1.7 b1.3 bc71 b70 b32.7 ab20 c31 c25 d
Chourouk3.2 c2.9 cd1.5 b1.2 bc65.3 b58 bc27.7 b11 d25 cd10 f
Najeh5.2 bc4.8 bc2.7 a1.7 b62 b84.7 a33.3 b12.3 d54 a31 c
Soil 2Saber0.9 e0.8 e0.5 de0.4 e42.3 d40 d15.5 cd4.3 e1 g0
Locale1.2 e1.1 e1.1 c0.8 cd58 bc44.3 d27.7 b12 d00
Bachar1.1 e0.9 e0.9 cd0.6 de55.2 bc51.3 c18 c12.3 d1 g1 g
Badii1.2 e1.1 e0.6 de0.6 de53.3 c50.3 c22.7 bc18 c4 g2 g
Chourouk1.3 e1.2 e0.6 e0.4 e56.3 bc45.7 d17.7 c13.7 d2 g2 g
Najeh1.6 e1.4 e0.5 e0.8 d59.7 bc63.3 b19.2 c23 bc5 g2 g
Soil 3Saber7.6 a1.7 de1.6 b0.7 d67.3 b49 c32.7 b10.3 d26 cd6 fg
Locale4.5 c4.0 c2.0 b1.2 c76.7 a59.7 b26.3 b9.7 d28 c18 e
Bachar6.8 ab1.7 de1.6 b0.4 e80.7 a65 b32.3 b11.3 d34 c9 f
Badii5.7b5.5 b1.6 b1.1 c80.7 a59 bc41 a26.3 b27 cd27 cd
Chourouk5.6b3.1 cd1.8 b0.8 cd79.7 a58 bc31.3 b5.3 e27 cd9 f
Najeh7.7 a6.3 b2.5 a1.6 bc84.3 a67.7 b40 a19.7 c44 b30 c
Table 3. Net assimilation rate of CO2 (A), transpiration (E), stomatal conductance (gs) and intercellular CO2 concentrations (Ci) and chlorophyll content [mg g−1 FM] of six genotypes of Vicia faba grown in three different soils during the treatment period (30 days). Values followed by different letters are significantly different at p < 5% according to Duncan test. N—Normoxia, H—Hypoxia, Soil 1—Control, Soil 2—Saline, Soil 3—Dhari.
SoilsVarietiesParameters
A
[µmol CO2 m−1 s−1]
Gs
[mol m−1 s−1]
E
[mmol H2O2 m−1 s−1]
Ci
[µmol CO2 mol−1]
Chlorophyll
[mg g−1 FM]
NHNHNHNHNH
Soil 1Saber11.14 cd2.99 h0.07 g0.03 h0.74 fg0.95 f109 g234 de15.4 c3.8 e
Locale13.54 b10.44 d0.16 d0.13 e1.66 e2.93 d220 e236 de21.4 ab8.8 d
Bachar10.06 d8.86 e0.08 fg0.03 h1.29 ef4.56 b184 f325 b10.1 cd4.4 de
Badii13.95 b9 de0.12 e0.08 fg0.95 f2.60 dND248 d24 a14.4 c
Chourouk11.17 cd6.40 f0.11 i0.06 g1.05 f2.49 d124 g251 d6.9 de11.7 c
Najeh10.40 d4.49 g0.12 e0.09 f1.13 f1.67 e183 f221 e6 de9.6 cd
Soil 2Saber4.89 g4.61 g0.11 ef0.03 h0.35 g0.95 f125 g321 b19 b8.3 d
Locale6.25 f2.09 hi0.07 g0.07 g0.54 g1.40 ef175 f338 b13 c4.4 e
Bachar6.24 f1.36 i0.09 f0.07 g1.02 f1.46 ef186 f367 a10.8 cd9.6 d
Badii5.85 f4.45 g0.13 e0.07 g0.82 f2.38 d289 c318 b11.8 c3 e
Chourouk6.06 f3.42 h0.10 f0.08 fg1.18 f1.67 e284 c321 b11.1 cd10.4 cd
Najeh4.37 g2.87 h0.06 g0.04 h0.64 fg1.49 ef230 de336 b25.9 a10.7 cd
Soil 3Saber8.37 e5.27 fg0.19 c0.17 d4.28 b5.53 a291 c327 b8.5 d8.3 d
Locale12.31 c8.04 e0.14 de0.06 g2.40 d4.10b c216 e271 cd8.8 d8.6 d
Bachar8.49 e8.46 e0.11 ef0.09 f3.17 cd3.31 c243 d250 d13.5 c12.8 c
Badii9.54 d9.96 d0.16 d0.12 e4.08 bc4.45 b233 de275 c19.9 b8.2 d
Chourouk10.07 d1.36 i0.12 e0.01 i1.35 i3.61 c217 e213 e19.8 b12 c
Najeh9.58 de16.41 a0.11 ef0.22 b3.51 c5.98 a222 e229 de10.3 cd15.3 c
Table 4. Results of three-way analysis of the effect of soil (S), genotypes (G), and treatment (T) and their interaction (S*G*T) on roots length RL [cm plant−1], root dry mass RDM [mg plant−1], number of nodules NN [N plant−1], shoot dry mass SDM [mg plant−1] and chlorophyll content [mg g−1 FM] in Vicia faba genotypes.
Soil (S)Genotypes (G)Treatment (T)S*G*T
RL [cm plant−1]60.587 **7.020 **767.821 **17.303 **
RDM [mg plant−1]1070.191 **186.526 **692.104 **89.325 **
Number of Nod [N plant−1]364.947 **12.171 **322.520 **21.657 **
SL [cm plant−1]389.572 **30.116 **124.614 **26.336 **
SDM [mg Plant−1]967.465 **78.886 **344.263 **38.445 **
Chlorophyll [mg g−1 FM]626.226 **1089.681 **19,213.788 **1771.654 **
Numbers represent F-value: ** p < 0.001.
Table 5. Identification, percentage of similarity of strains, growth and nodulation test of Vicia faba inoculated with different bacterial strains (Salinity tolerance limits, ARA, shoots length, roots length and Nodules number). The values are the average of three repetitions in three independent pots and the molecular characterization of 20 isolates by PCR/sequencing of the 16rDNA gene.
Strains CodeGenBank Accession NumbersIdentical Strains% Similarity Compared to the Identified SequenceSalinity Tolerance Limits (mM)ARA (µmol h−1Plant−1)Shoots Length (cm)Roots Length (cm)Nodules Number (NN/Plant-1)
1MK809163KT387834.1 Rhizobium sp. L598.9880030.1 ± 0.4729.7 ± 2.515.2 ± 1.336 ± 1
2MK809170MH345076.1 Rhizobium laguerreae strain PEPV0898.6935022.8 ± 3.2662 ± 1.737 ± 1.720 ± 3
3MK809176JN105993.1 Rhizobium leguminosarum strain 35-198.6535014.7 ± 1.4358.3 ± 1.535.7 ± 2.111 ± 3
7MK809181JN105993.1 Rhizobium leguminosarum strain 35-197.924005.6 ± 0.9959 ± 1.744.6 ± 0.60
12MK809162EU074196.1 Rhizobium leguminosarum strain98.8080053.0 ± 1.4281.3 ± 2.339.3 ± 1.267 ± 4
21MK809164EF549399.1 Rhizobium sp. CCBAU 8348098.7860041.7 ± 1.9269 ± 127 ± 350 ± 3
23MK809165JN105993.1 Rhizobium leguminosarum strain 35-198.6980028.2 ± 0.9774.3 ± 2.541 ± 1.731 ± 4
24MK809166KT387835.1 Rhizobium sp. L1598.8245037.6 ± 0.3566.6 ± 3.136.6 ± 3.143 ± 3
26MK809167JN105993.1 Rhizobium leguminosarum strain 35-199.2660044.5 ± 1.0862.6 ± 2.550.3 ± 1.556 ± 4
28MK809168JN105993.1 Rhizobium leguminosarum strain 35-198.5460035.2 ± 0.5766.3 ± 432.3 ± 2.547 ± 3
29MK809169MH345080.1 Rhizobium laguerreae strain PEPV3198.975006.7 ± 0.9961.3 ± 2.337.6 ± 1.20
34MK809171KJ532459.1 Rhizobium sp. UFSM-B7499.1635012.3 ± 1.4263 ± 3.642.3 ± 2.510 ± 3
36MK809172MH345080.1 Rhizobium laguerreae strain PEPV319235010.8 ± 1.6976.6 ± 1.534.3 ± 0.69 ± 3
37MK809173JN105993.1 Rhizobium leguminosarum strain 35-198.6835012.3 ± 1.8376.6 ± 2.531 ± 19 ± 3
38MK809174JN105993.1 Rhizobium leguminosarum strain 35-198.9735014.3 ± 0.8472.3 ± 2.537.6 ± 2.511 ± 3
39MK809175MH345080.1 Rhizobium laguerreae strain PEPV3197.3660024.7 ± 1.7965.6 ± 3.824.3 ± 3.121 ± 1
41MK809177KX226363.1 Rhizobium leguminosarum strain PM2595.2680030.5 ± 2.2474 ± 225 ± 537 ± 2
42MK809178JF974177.1 Rhizobium sp. PZ-Ar-6-1198.6280020.1 ± 2.2770 ± 331.3 ± 1.226 ± 0
45MK809179KU878960.1 Rhizobium sp. SWF2300897.0560025.4 ± 0.9777.3 ± 2.532.3 ± 4.522 ± 0
48MK809180KJ634549.1 Rhizobium leguminosarum bv. trifolii strain SCD23-298.363509.6 ± 1.0866 ± 1.723.6 ± 2.55 ± 1
Publisher’s Note: MDPI stays neutral with regard to jurisdictional claims in published maps and institutional affiliations.

