Article

Effect of Salinity and Nitrogen Fertilization Levels on Growth Parameters of Sarcocornia fruticosa, Salicornia brachiata, and Arthrocnemum macrostachyum

1
The Jacob Blaustein Institutes for Desert Research, The Albert Katz International School for Desert Studies, Ben-Gurion University of the Negev, Sede Boqer Campus, Sede Boker 8499000, Israel
2
Jacob Blaustein Center for Scientific Cooperation, The Jacob Blaustein Institutes for Desert Research, Ben-Gurion University of the Negev, Sede Boqer Campus, Sede Boker 8499000, Israel
3
School of Petroleum Technology, Pandit Deendayal Energy University, Gandhinagar 382007, Gujarat, India
4
Morris Kahn Marine Research Station, The Leon H. Charney School of Marine Sciences, University of Haifa, Haifa 3498838, Israel
5
The Interuniversity Institute for Marine Sciences in Eilat, Eilat 8810302, Israel
6
Department of Environmental Sciences, G. B. Pant University of Agriculture and Technology, Pantnagar 263153, Uttarakhand, India
7
Centre of Marine Sciences, University of Algarve, Campus de Gambelas, 8005-139 Faro, Portugal
8
The Albert Katz Department of Dryland Biotechnologies, French Associates Institute for Agriculture and Biotechnology of Dryland, The Jacob Blaustein Institutes for Desert Research, Ben-Gurion University of the Negev, Sede Boqer Campus, Beersheba 8499000, Israel
*
Authors to whom correspondence should be addressed.
Agronomy 2022, 12(8), 1749; https://doi.org/10.3390/agronomy12081749
Submission received: 16 June 2022 / Revised: 19 July 2022 / Accepted: 19 July 2022 / Published: 25 July 2022

Abstract

:
Salinity negatively influences crop growth, but several salt-tolerant plant species (halophytes) are viable crops. Sarcocornia fruticosa (ecotypes EL and VM) is currently cultivated, but there is demand for new crop candidates and higher biomass production. Salicornia brachiata Roxb. and Arthrocneum macrostachyum L. are considered novel crops, and to realize their potential, their response to salinity and nitrogen nutrition was compared to S. fruticosa ecotypes. Experiments revealed that higher N supplemented with lower NaCl significantly increased fresh and dry shoot biomass. Lower biomass was obtained at lower nitrogen supplemented with elevated NaCl, whereas total soluble solids content positively correlated with NaCl fertigation in both Sarcocornia ecotypes. Protein content increased with a lower nitrogen supply. Anthocyanins and oxygen radical absorbance capacity were highest in S. fruticosa EL and A. macrostachyum at higher NaCl supply. The results show that halophytes have a variety of strategies to cope with high NaCl, even between ecotypes of the same species. Notably, repetitive harvesting of S. brachiata delayed flowering enabling year-round biomass production. Additionally, S. brachiata accumulated higher biomass than Sarcocornia VM when grown in a greenhouse at higher radiation than in a growth room and strongly supports its inclusion as a cash-crop halophyte.

1. Introduction

The global reduction in available fresh water and arable land for crops, due partly to increasing salinization, has created an urgent need for alternative crops [1]. Halophytes, as salt-tolerant plants, can help fill this need by their ability to thrive on saline soils and saline water [2,3,4]. Indeed, some halophytes can grow well on seawater salinity. Thus, land and water previously regarded as lost to agriculture have acquired new, added value. Of the halophytes, a small subset, including Salicornia and Sarcocornia, has been readily adapted for agriculture [5,6,7]. Both genera belong to the Amaranthacae and have long been collected for food by coastal communities. They have been commercially cultivated for over a decade [8], and Sarcocornia, in particular, has proven to be a valuable multi-harvest crop. Year-round availability is a desirable trait from a consumer perspective, and these halophytes are now well established in the cuisines of most of Northern and Southern Europe and North America. The two Sarcocornia ecotypes used in the present study have been well characterized in previous research [8]. Arthrocnemum macrostachyum has attracted attention as a potential edible halophyte because of its high levels of nutritionally important PUFAs and other metabolites [9]. Salicornia brachiata has long been regarded as a nutritionally valuable halophyte [10], although, similar to A. macrostachyum, it has not been investigated as a potential crop plant.
Introducing novel halophytes requires careful study of the nitrogen demand for plant growth. Shpigel et al. [11] demonstrated in a constructed wetland study that the growth of Salicornia was significantly affected by nitrogen with higher N, leading to higher biomass production. Under saline conditions, nitrate (NO3) uptake is influenced considerably by the antagonism between Cl and NO3 uptake mechanisms [12]. The resulting nitrogen deficiency affects plant development and yield, although increasing the N supply does alleviate this, at least in part. Salicornia has proved difficult to grow commercially as it needs a supplementary light supply to repress flowering for all year round. In contrast, Sarcocornia does not need artificial light if it is grown under successive harvest conditions [8]. However, reliance on a handful of ecotypes is not a viable strategy. New ecotypes are needed to buffer against unforeseen biotic and abiotic perturbations. These new ecotypes need to be screened for certain desirable traits: biomass production, salt tolerance, and nutritional value. We selected eight parameters as a screen for these traits. The selection criteria were that the parameter assays should be well proven and sensitive enough to be able to distinguish differences in treatment. To this end, the following parameters were chosen: fresh weight and dry weight (FW and DW), relative water content (RWC), electrical conductivity (EC), total soluble solids (TSS), total soluble proteins (TSP), anthocyanins, and oxygen radical absorbance capacity (ORAC). Of these, RWC, TSP, EC, and TSS reflect on osmotica and water relations (Liang et al., 2018), while anthocyanins and ORAC reflect on antioxidant capacity, which contributes to the nutritional value of the plants [13,14]. Our results show that the assays revealed differences in response to nitrogen and salt levels between species and were sensitive enough to show differences between ecotypes and species. Together, this ‘toolkit’ of assays can be used as a rapid and effective screen to select candidate halophytic crop plants for further study and use.

2. Materials and Methods

2.1. Plant Material and Growth Conditions

Seed material of Sarcocornia fruticosa L. (VM and EL) ecotypes, S. brachiata Roxb. (SB) were obtained from existing stocks, and A. macrostachyum L. (AM) seeds were collected from the southern area of the Dead Sea, Israel.
Fresh tap water (EC 0.7 dS/m2) was used for the germination phase and initial seedling establishment in a temperature-controlled growth room with temperatures between 30 and 35 °C and a long-day regime of 16:8 h of light and dark, respectively. The light (200 µMol/m2/s) was provided by 100 W fluorescent tubes, and the photoperiod was set to long-day conditions to prevent flowering. Seeds were surface sterilized in a 2% bleach solution for 20 min and washed thoroughly with distilled water before sowing in autoclave sterilized, thoroughly wetted, potting soil. Germinated seedlings were carefully transferred to 12 × 8 × 6 cm (Length × Width × Depth) plastic pots. Each pot contained ten similarly sized individuals of one ecotype.
After seedlings had reached ~2 cm height fertilization was started using 3 g/L NaCl + 0.5 g/L NPK (20-20-20 + micronutrients) (Haifa Chemicals, Haifa, Israel). After this initial growth phase, when plants had reached ~6 cm height, the NPK was supplemented with NH4NO3 to provide the low and high N treatments. The N from the 20:20:20 comprised 7.4 mM N consisting of urea (3.7 mM), ammonium (1.5 mM), and nitrate (2.2 mM). To this was added 1 mM NH4NO3 (2 mM N) designated as Low N (LN), or 4 mM NH4NO3 (8 mM N) designated as the High N (HN). Other nutrients in the applied 0.5 g/L 20:20:20 included phosphorous (0.3 mM P as P2O5) and potassium (0.4 mM K as K2O) as well as the following micronutrients: Fe 1000 ppm, Mn = 500 ppm, Zn 150 ppm, Cu 110 ppm, and Mo 70 ppm. The two salinity levels comprised low salinity (LS) containing 50 mM NaCl and high salinity (HS) containing 120 mM NaCl. The experiment contained four treatments comprising two different N and salt combinations referred to as LN + LS, HN + LS, LN + HS, and HN + HS, and each was replicated four times.
The irrigated solution volume was adjusted so that approximately 50% of the solution leached out of the pots. The EC values of the input irrigation solution and the leaching fraction are presented in Table 1. The leaching fraction EC under the above irrigated volume was higher than that of the input solution by approximately 1.3-fold.

2.2. Harvesting Regime

The first harvest is known as the “technical cut” and is the basis of the cutting table. This harvest was established by trimming the upper part of the shoot by approximately 5 cm when the plant’s height was 11–16 cm. After that, shoot regrowth was harvested. New shoots quickly grow from above the previously cut shoot, producing an evenly growing crop for the subsequent harvest. These shoots constitute the commercially viable part of the plant as it is succulent and without unpalatable woody stems. The weight of the harvested fresh shoot biomass (FW) was determined immediately after harvesting, and ~2 g was retained for further analysis. Dry weight (DW) biomass was dried in a forced-air oven (DK-500, MRC, Holon, Israel) at a temperature of 65 °C until a constant weight was attained. The fresh shoot and dry weight biomass per unit area are presented (kg per m−2). The retained fresh shoot samples were immediately flash-frozen in liquid nitrogen and stored at −80 °C until analyzed.
It was noted that S. brachiata did not flower under the 14 h day length, and thus biomass accumulation was not interrupted by flowering. To examine if, under natural day length conditions, the successive harvest will prevent flowering, a parallel trial was set up in a greenhouse under natural day length for 30.8523° N, 34.7834° E. The temperature was partially controlled (~10 °C min to 40 °C max), and midday PAR reached 650–700 µMol/m2/s. Two 9 L pots of ten plants per pot were planted, using the same potting medium as for the growth room experiments, for S. brachiata and S. fruticosa VM in June 2021. Plants received the LN + LS treatment and were subject to a repetitive harvest regime (same as the growth room plants) over one year.

2.3. Relative Water Content

For the determination of relative water content (RWC), three developed shoots of each ecotype were cut at 5 cm in height. Three replicates were used for each treatment. The fresh weight of the cut shoot was immediately weighed on an analytical balance, and the shoots were then placed in 10 mL double-distilled water (DDW) in 15 mL tubes. The tubes were closed and kept at 25 °C for 24 h for the shoots to achieve full turgidity. After this, the shoots were gently blotted with tissue paper to remove free surface water, and their turgid weight (TW) was immediately taken. Dry weight was determined by drying the shoots at 65 °C until they reached a constant weight. The relative water content was calculated using the equation of Yamasaki and Dillenburg [15]:
% RWC = ((FW − DW)/(TW − DW)) × 100

2.4. Assessment of Electrical Conductivity (EC) and Total Soluble Solids (TSS)

0.5 g of fresh shoot samples in four replicates were collected and immediately snap-frozen in liquid nitrogen and stored at −80 °C until further analysis. Shoot tissue extractions were carried out with modifications as described by Ventura and Mendlinger [16]. Frozen samples were ground into a fine powder using a mortar and pestle and homogenized with DDW at the ratio of 1:4 (w/v). Homogenates were centrifuged (Eppendorf 5424R, Hamburg, Germany) at 18,400 rcf at 4 °C for 20 min, and the clear supernatant was collected. Electrical conductivity (EC) and total soluble solids (TSS) were determined by using a standard EC meter (ECTestr 11, Eutech Instruments, Paisley, UK) and a refractometer (Atago Digital Refractometer PR-1, Tokyo, Japan). The concentration of TSS and EC was expressed in % and deci-Siemens per meter (dS m−1), respectively.

2.5. Anthocyanin Determination

Shoot extractions were carried out with modifications as described by Laby et al. [17]. First, 100 mg of fresh shoot tissue was macerated in a mortar and pestle with 5 ml of 1% HCl-acidified methanol (1.56 mL 32N HCl plus 48.4 mL methanol). Next, anthocyanins were separated from chlorophylls by adding 500 µL of DDW and extracted with 1 mL of chloroform, followed by centrifugation at 18,400 rcf for 20 min at 4 °C. The supernatants were then centrifuged for an additional 20 min. The absorbance (OD) was read at 657 nm and 530 nm (Epoch Microplate Spectrophotometer, BioTek, Santa Clara, CA, USA). The relative anthocyanin levels were determined using the following equation: OD530 − (0.25 − OD657) × extraction volume (mL) × 1/weight of tissue sample (g) = relative units of anthocyanin/g fresh weight of tissue.

2.6. Protein Extraction and Determination of Protein Content

Total soluble proteins were determined as previously described by Ventura et al. [18] using the Bio-Rad Protein assay, with a modification of the Bradford procedure [19]. The reference compound used was bovine serum albumin. Briefly, proteins were extracted from the shoot in an extraction buffer containing 250 mM Tris-HCl (pH 8.48), 1 mM ethylenediaminetetraacetic acid (EDTA), 1 mM Dithiothreitol (DTT), 5 mM L-cysteine, 10 mM glutathione (GSH), 0.05 mM Na2MoO4, 0.1 mM phenylmethylsulphonyl fluoride (PMSF), and 250 mM sucrose in the ratio of 1:6 and 1:4 (w/v) respectively. The extracted samples were centrifuged at 4 °C at 18,400 rcf for 20 min. Protein contents were read in a spectrophotometer at 595 nm. Protein content was calculated by the formula: optical density (OD) × dilution factor and expressed as mg g−1 FW.

2.7. Oxygen Radical Absorbance Capacity (ORAC) Measurements

The total antioxidant content (oxygen radical absorbance capacity (ORAC)) of the shoot tissue was determined according to Gillespie et al. [20], with slight modifications. Briefly, 25 mg of fresh leaf tissue was flash-frozen in liquid N immediately after harvest and homogenized in Eppendorf tubes with three tungsten carbide beads for 30 s at 25 Hz (using liquid N cooled Teflon adaptors in a Retsch MM400 mixer mill (Retsch GmbH, Haan, Germany)). Then 1 mL of 50% acetone was added to each sample tube. Homogenized tissue samples were centrifuged at 1900 rcf for 10 min at 4 °C. After centrifugation, 500 µL supernatant was removed to a new centrifuge tube and centrifuged again at 1900 rcf, diluted ten times, and the total antioxidant capacity of each sample was determined as further described.
In each well of a black 96-well microplate, 25 µL of the plant extract, blank (phosphate buffer) or standard (0–50 µM Trolox), and 150 µL of fluorescein (0.09 M) were mixed and incubated at 37 °C for 10 min. Subsequently, 25 µL of 2,2-Azobis-2-methyl-propanimidamide dihydrochloride (150 mM) (AAPH), also heated to 37 °C, was added to start the reaction, and the kinetic was read every minute for one hour. The fluorescence kinetics was measured at 485 nm excitation and 530 nm emissions (Synergy H4, BioTek, Santa Clara, CA, USA). The area under the curve (AUC) for the one-hour kinetic reading was calculated as:
AUC = 0.5 + [f2/f1] + [f3/f1] + [f4/f1] + … + [fn/f1] × t
where f is the fluorescence reading and t is time (minutes).
The net AUC is calculated by subtracting the blank from each standard or sample.
Net AUC = AUCsample − AUCblank
The Trolox equivalent (TE) in each extract was calculated from the standard curve using Trolox of known concentration. The results are expressed as µmol Trolox equivalent per gram fresh weight (mol TE g−1 FW).

2.8. Data Analysis

The effects of nitrogen and salinity treatments on the means of fresh and dry plant biomass were compared. Significant differences between treatments were tested by one-way ANOVA followed by the Tukey–Kramer HSD test at a 5% significance level (JMP8 (SAS, Cary, NC, USA)) or Student’s t-test (Microsoft Excel). The sample number, n, varied from 3 to 7.

3. Results

The following notation is used: 9 mM N is LN, 15 mM N is HN, 50 mM NaCl is LS, and 120 mM NaCl is HS. Thus, 9 mM N + 50 mM NaCl is LN + LS, etc.

3.1. Fresh Shoot Biomass Accumulation

Effect on ecotype (Figure 1). AM biomass was negatively affected by salinity, with the low salinity (LS) treatments having significantly higher biomass than the high salinity (HS) treatments. SB, VM, and EL exhibited significantly higher biomass in the HN + LS treatment. Other treatments did not significantly affect biomass accumulation.
Effect within treatment (Figure 1). VM and EL generally had significantly higher biomass than AM and SB, except for the LN + HS treatment (VM and SB were not significantly different). Overall, VM and EL ecotypes attained approximately twice the fresh weight of AM and SB.
For the greenhouse trial, the individual harvest fresh biomass and cumulative fresh biomass for seven successive harvests are shown in Table 2. Harvests were approximately 40 days apart. Overall, SB biomass greatly exceeded that of VM at each harvest except for the seventh harvest. SB plants showed die-off below the growing crown, whereas VM growth continued with increasing vigor. Supplementary Figure S1A,B in the Supplementary Materials shows the plants before and after harvest and the differences in growth habits of the two halophytes. VM has an upright, sparsely branched phenotype, whereas SB has a more prostrate and bushy phenotype.

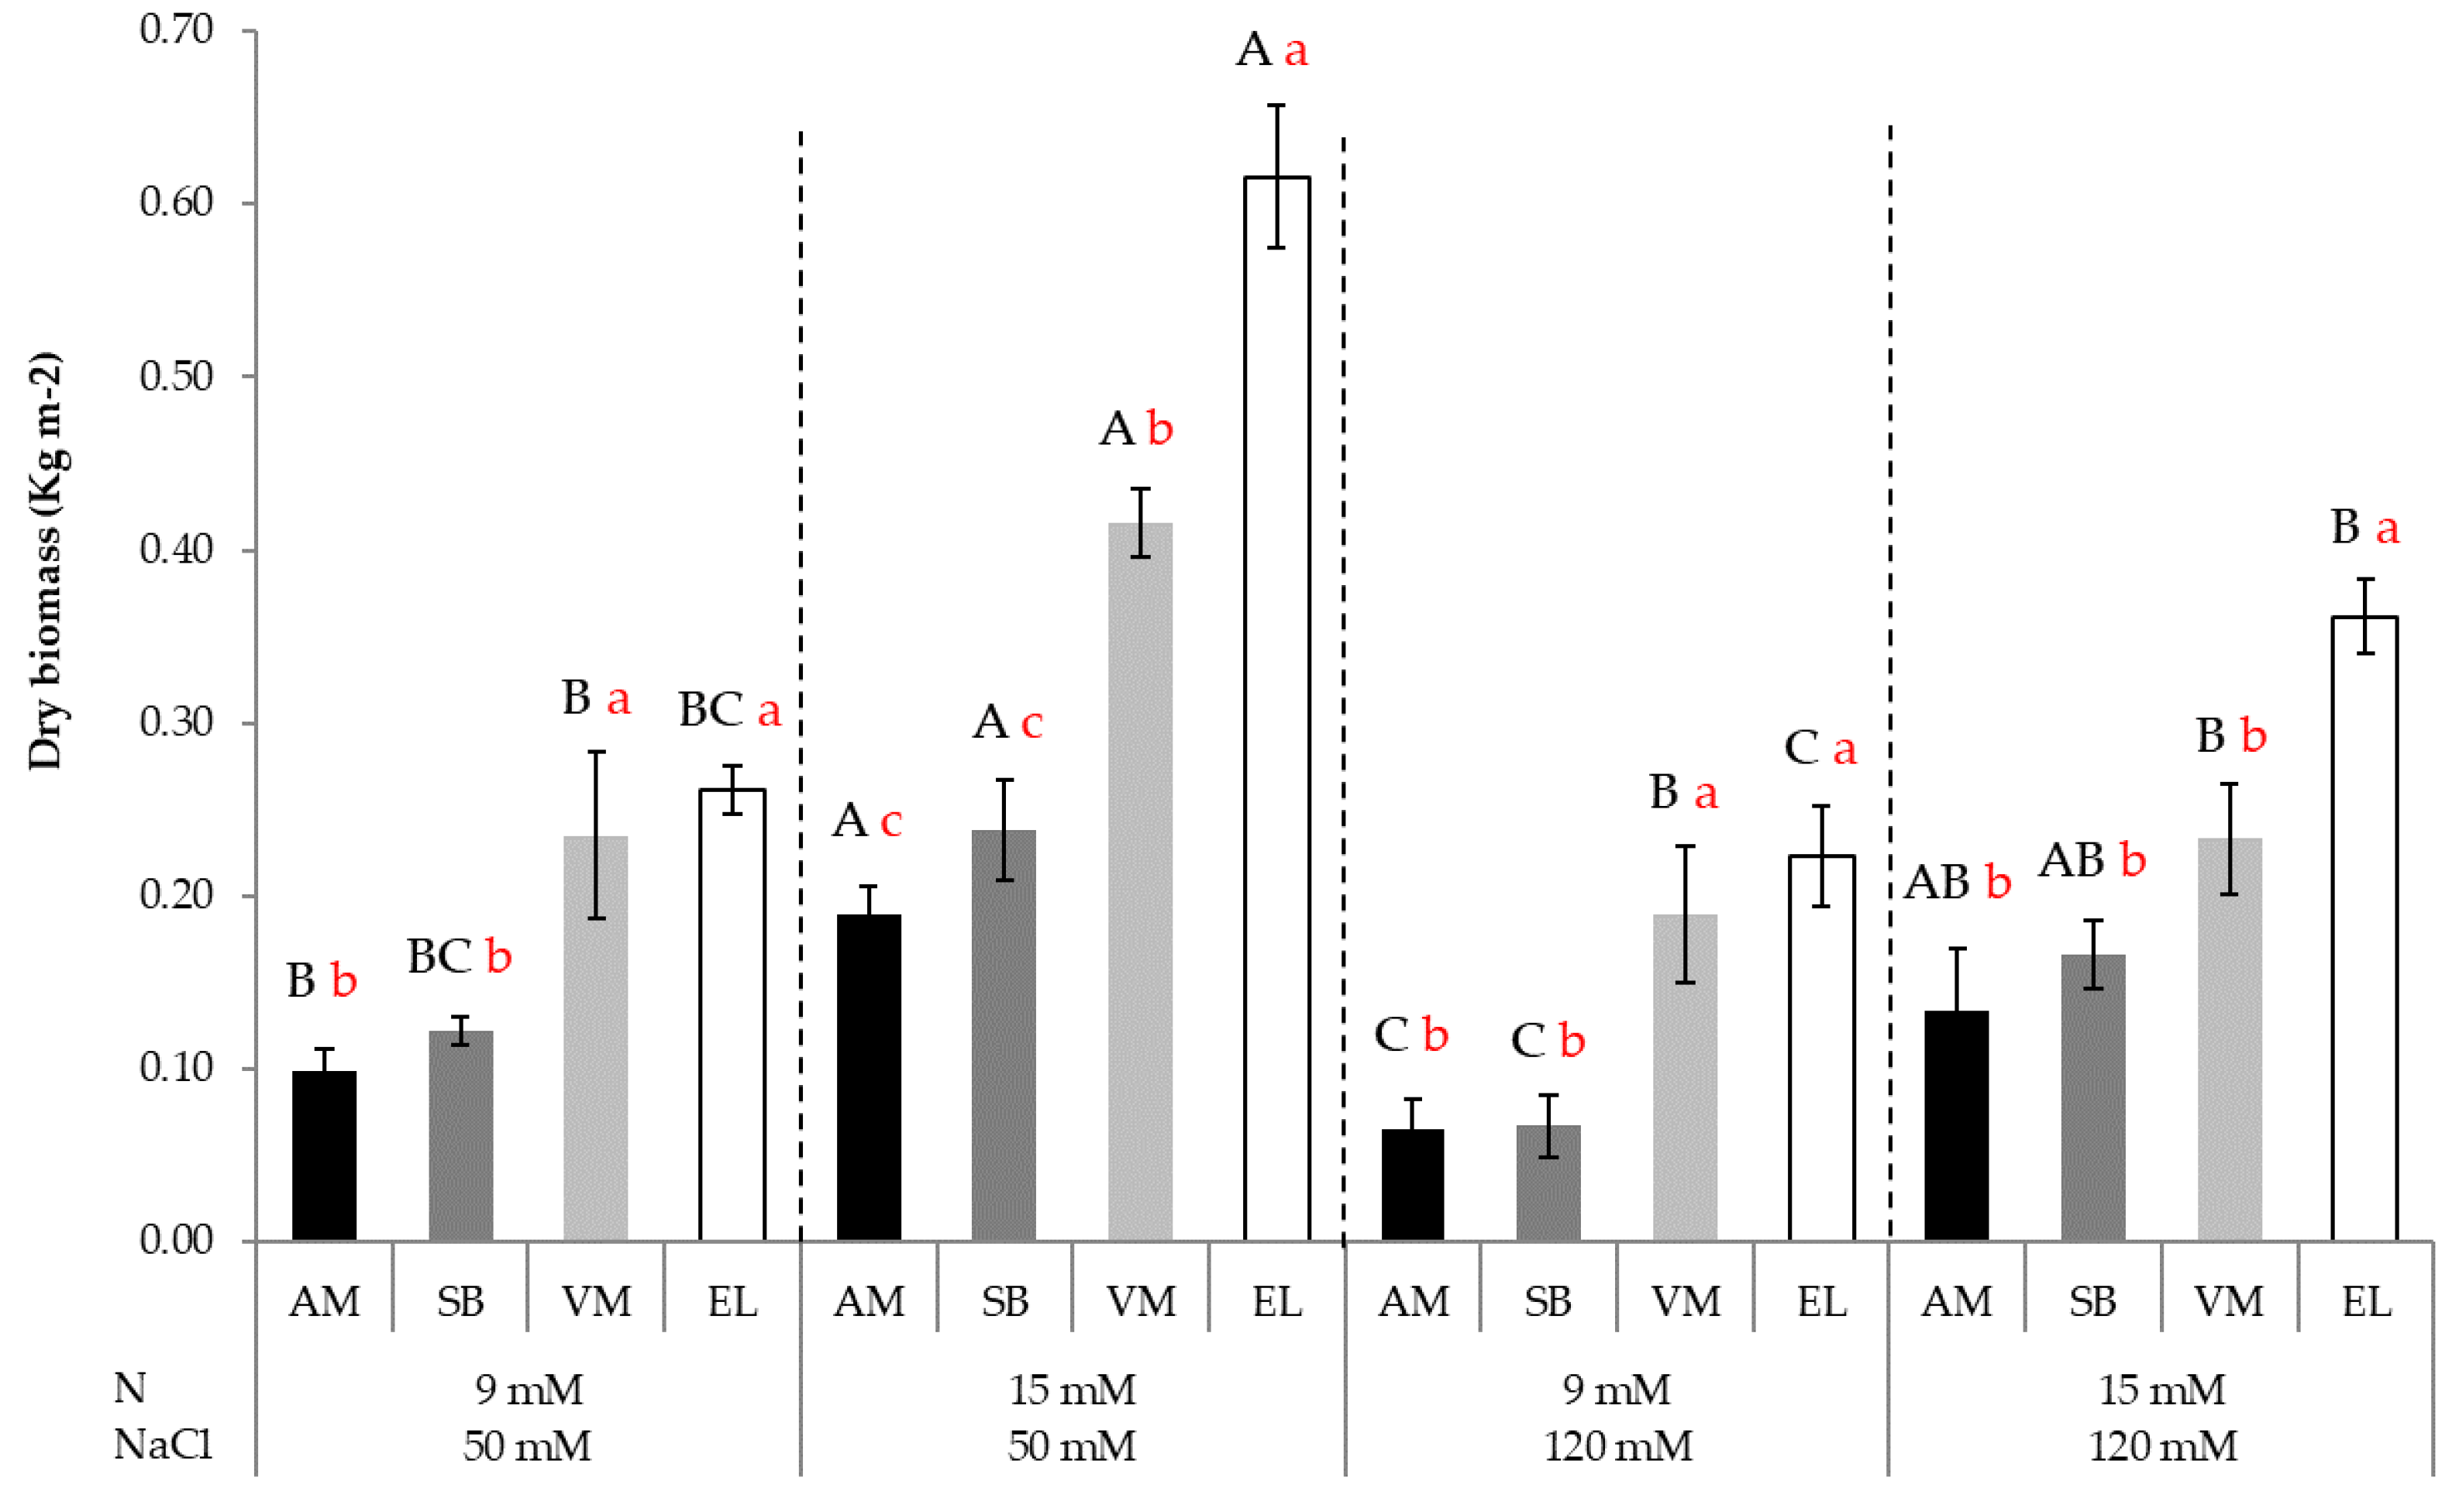
3.2. Dry Biomass Accumulation

Effect on ecotype (Figure 2). AM: dry biomass was negatively affected by salt, with the low salt (LS) treatments having significantly higher biomass than the high salt (HS) treatments. Within each salinity level, the higher N treatment plants had significantly higher dry biomass. For EL, significantly higher biomass was recorded in the HN + LS treatment. Other treatments did not significantly affect dry biomass accumulation.
Effect within treatment (Figure 2). VM and EL had significantly higher biomass than AM and SB. Similar to the fresh weight trends, the Sarcocornia ecotypes attained approximately twice the dry biomass of AM and SB.

3.3. Relative Water Content (RWC)

Effect on ecotype (Figure 3). AM: the LN+HS-treated plants had a significantly higher RWC than in other treatments. For SB, however, this treatment had the lowest RWC. This was significantly lower than the LN + LS plants and not significantly lower than the other treatments.
Effect within treatment (Figure 3). SB had a significantly lower RWC in two treatments: HN + LS and LN + HS. Otherwise, no differences were found in RWC between ecotypes.

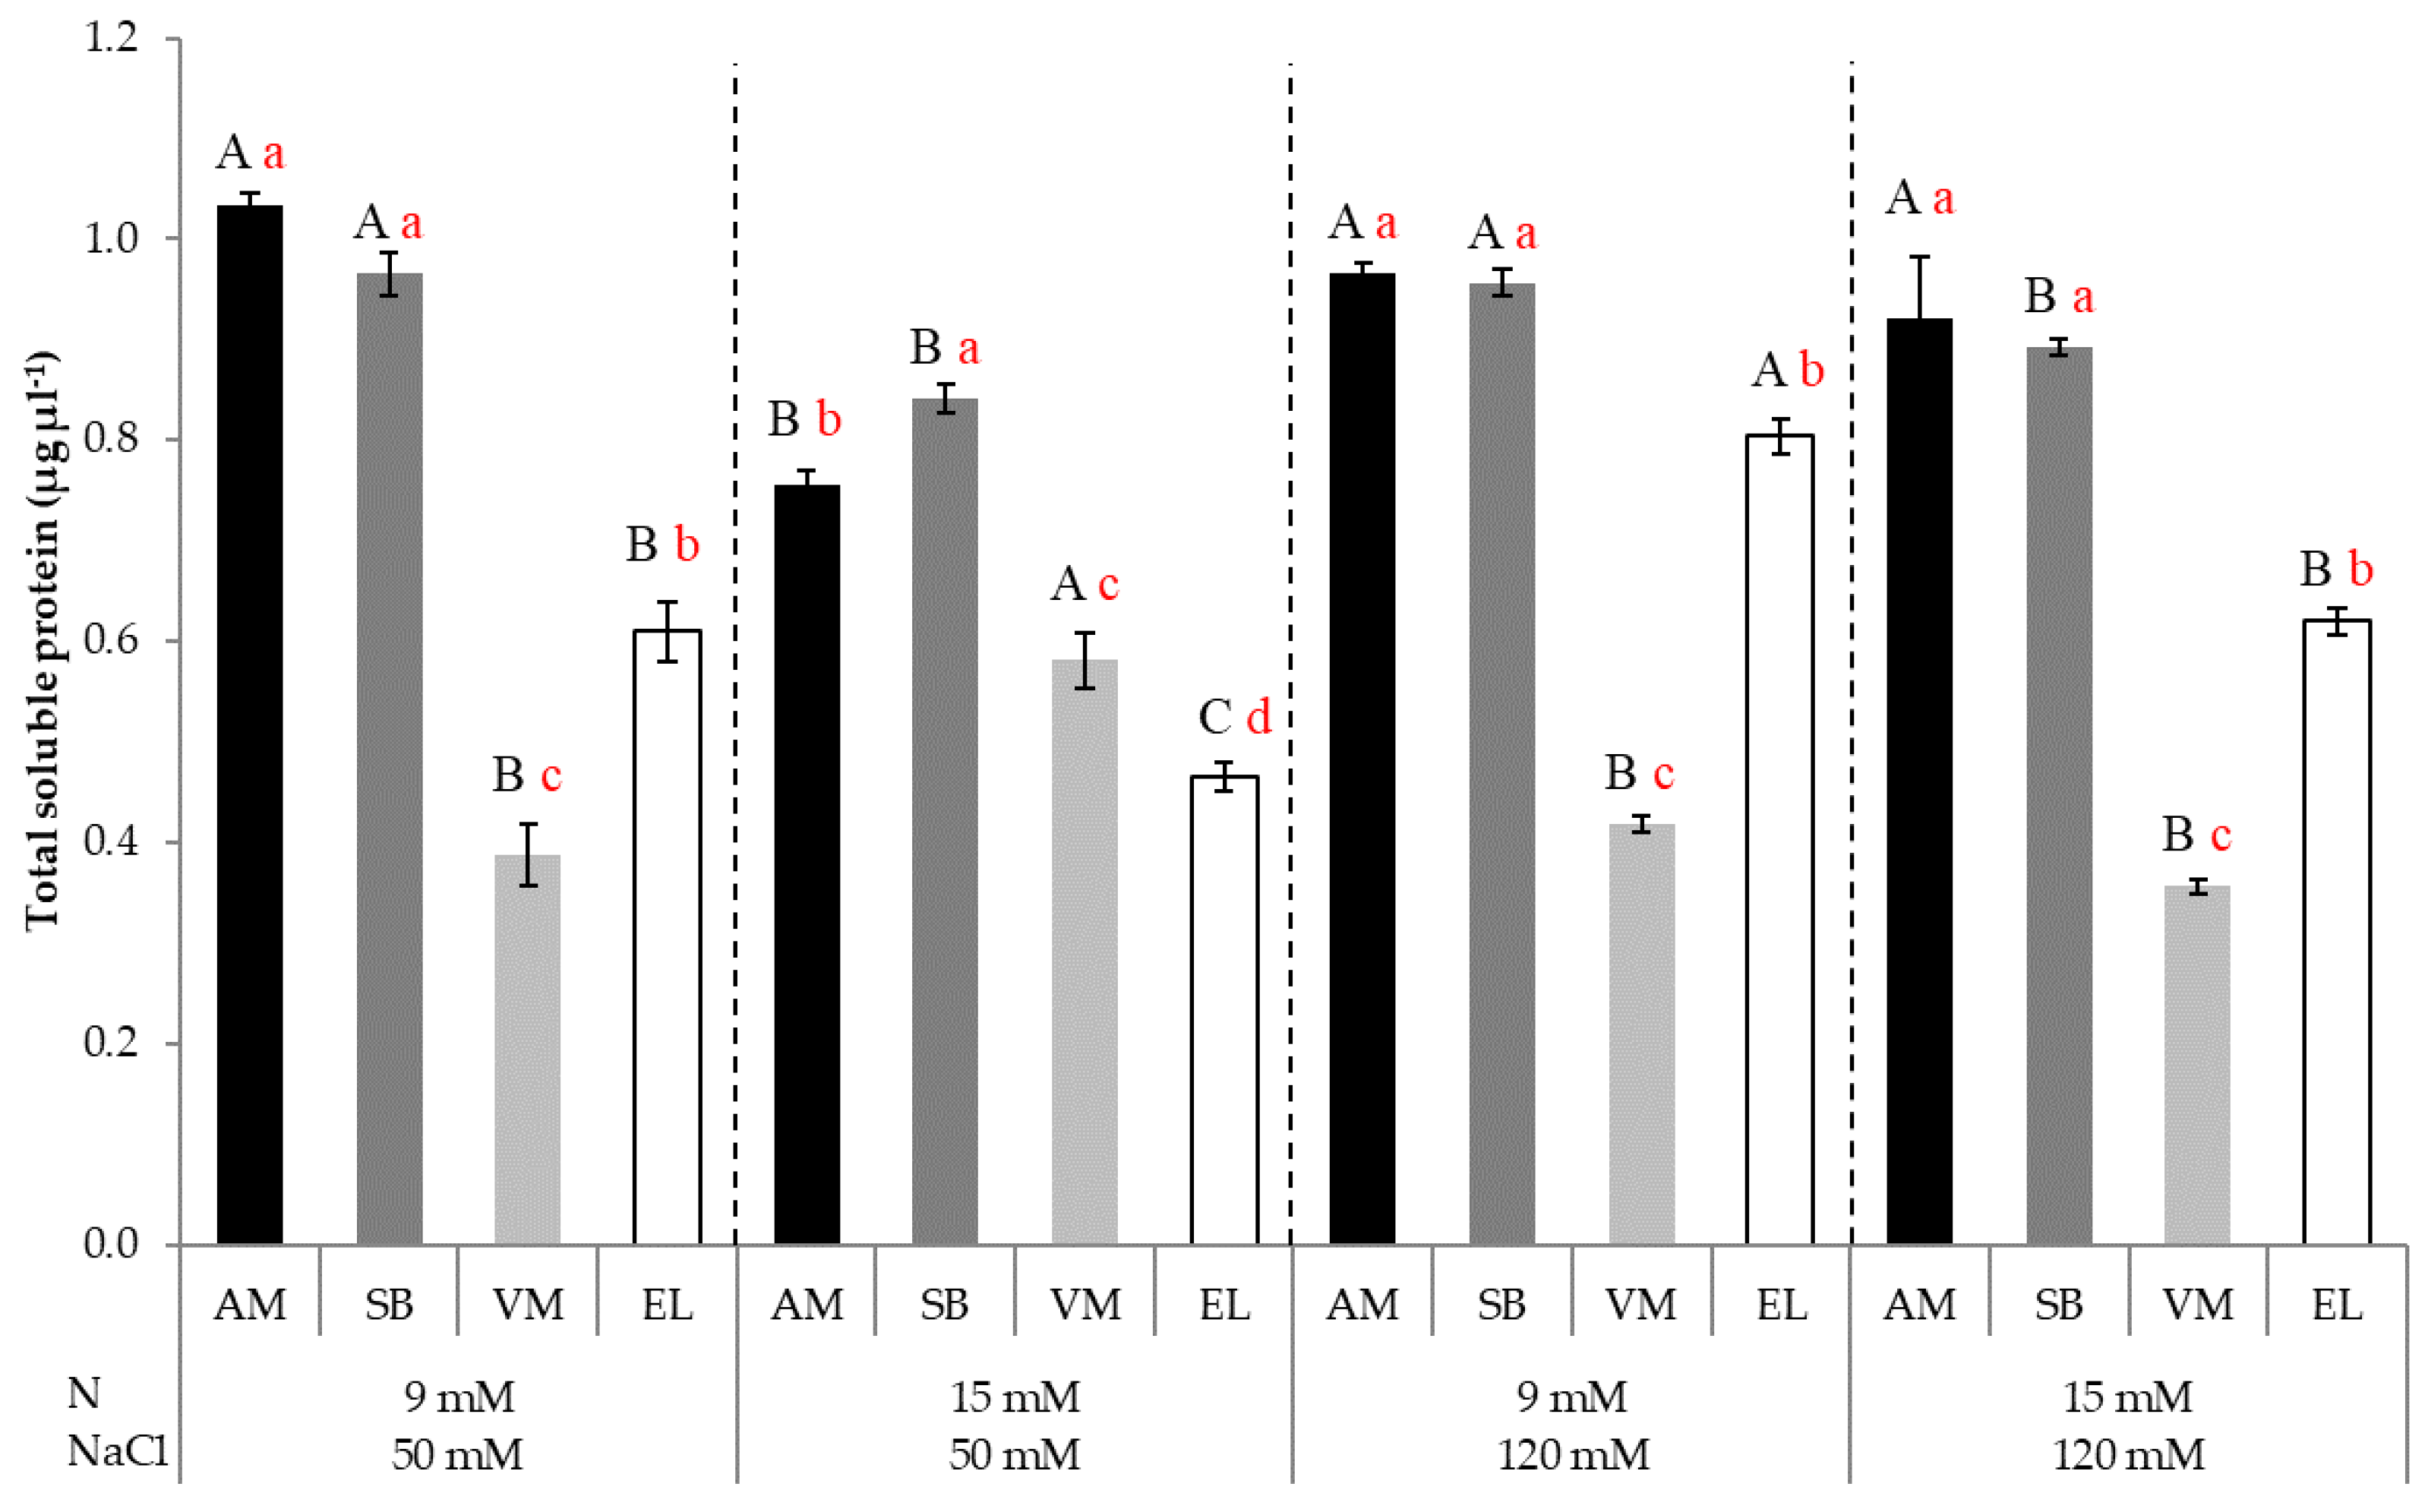
3.4. Total Soluble Protein Content

Effect on ecotype (Figure 4). For AM, no difference was found in total soluble protein content (TSP) except for a decrease in the HN + LS treatment. For SB, the TSP content was significantly higher for the LN treatments than for the HN treatments. VM, in the HN + LS treatment, had significantly higher TSP content than the other treatments but generally had low TSP. The other Sarcocornia ecotype, EL, had the lowest TSP content in the HN + LS treatment and the highest in the LN + HS treatment, with no difference between the other two treatments.
Effect within treatment (Figure 4). AM and SB had significantly greater TSP contents than the VM and EL ecotypes within each treatment. EL had a significantly higher TSP content than VM in all treatments except for HN + LS.

3.5. Total Soluble Solids Content

A significant difference was found between salinity treatments, with the HS treatments having significantly higher total soluble solids (TSS) contents than the LS treatments (t-test, p = 0.01, n = 8).
Effect on ecotype (Figure 5). No difference in TSS was found between AM plants. The highest and lowest TSS values for SB plants were found in the LN + HS and HN + LS treatments. TSS in VM plants increased with increasing total salts (N + NaCl) with LN + LS < HN + LS < LN + HS < HN + HS. Here, the increase between the lowest and highest was approximately two-fold. TSS levels in EL plants differed significantly between salinity levels, where the high salinity treatments produced higher TSS than the low salinity treatments.
Effect within treatment (Figure 5). No differences were found in TSS within the LN + LS treatment. However, in the HN + LS treatment, SB had significantly lower TSS than VM. The high salt treatments separated VM and EL ecotypes from AM and SB. In the LN + HS treatment, the EL plants had significantly higher TSS than AM and SB, and in the HN + HS treatment, both VM and EL were found to have significantly higher TSS than AM and SB.

3.6. Anthocyanin Determination

A significant difference was found between salinity treatments, with the HS treatments having significantly higher anthocyanin contents than the LS treatments (t-test, p < 0.01, n = 8).
Effect on ecotype (Figure 6). For AM, the anthocyanin content varied significantly between treatments, with the highest values found in the HS treatments. The high anthocyanin contents in the HS treatments were repeated for SB, with the two HS values significantly higher than the LS treatments. EL had no differences between treatments. No differences were found between the LS treatments for the VM ecotype, and both anthocyanin contents were significantly lower than those from the HS treatments. Here, the LN + HS VM plants contained significantly more anthocyanins than the HN + HS plants.
Effect within treatment (Figure 6). Within the LN + LS treatment, SB had the highest anthocyanin values and EL the lowest. No significant differences were found between ecotypes in the HN + LS treatment. In the LN + HS treatment AM, SB and EL had significantly higher anthocyanin contents than EL. At the highest salts treatment (HN + HS), SB and VM had significantly higher anthocyanin contents than EL, but these were lower than those found in the LN + HS treatment.

3.7. Oxygen Radical Absorbance Capacity (ORAC)

Effect on ecotype (Figure 7). ORAC in the AM plants increased significantly with salinity. The two LS treatments have 6- to 8-fold lower ORAC than the HN + HS plants. AM in the LN + HS treatment had lower ORAC than the HN+HS plants but significantly greater values than the low salt treatments. The pattern for SB was similar, with high salt treatments having higher ORAC values. Here though, the LN + HS plants had the highest values, followed by HN + HS and LN + HS, with LN + LS plants having the lowest values. For EL, the highest values were found in HN+HS plants, with lower values in the LN + HS and HN + LS treatments. The lowest salts treatment, LN + LS, was not significantly different from the highest salts treatment (HN + HS). Opposite to AM, ORAC values for VM were highest in the lowest salts treatment and significantly lower in the high salt treatments (LN + HS, HN + HS).
Effect within treatment (Figure 7). In the LN+LS treatment, VM contained the highest ORAC values, with the other ecotypes having non-significant differences within the group. For the HN + LS plants, SB and VM had significantly higher ORAC values compared to AM and EL. In the LN + HS treatment, AM had the highest ORAC values, followed by SB. The VM and EL ecotypes had significantly lower values. This pattern was repeated in the HN + HS treatment, with AM plants having nearly 3-fold greater ORAC values than SB, the next highest value. VM and EL ecotypes had the lowest ORAC values in this treatment.

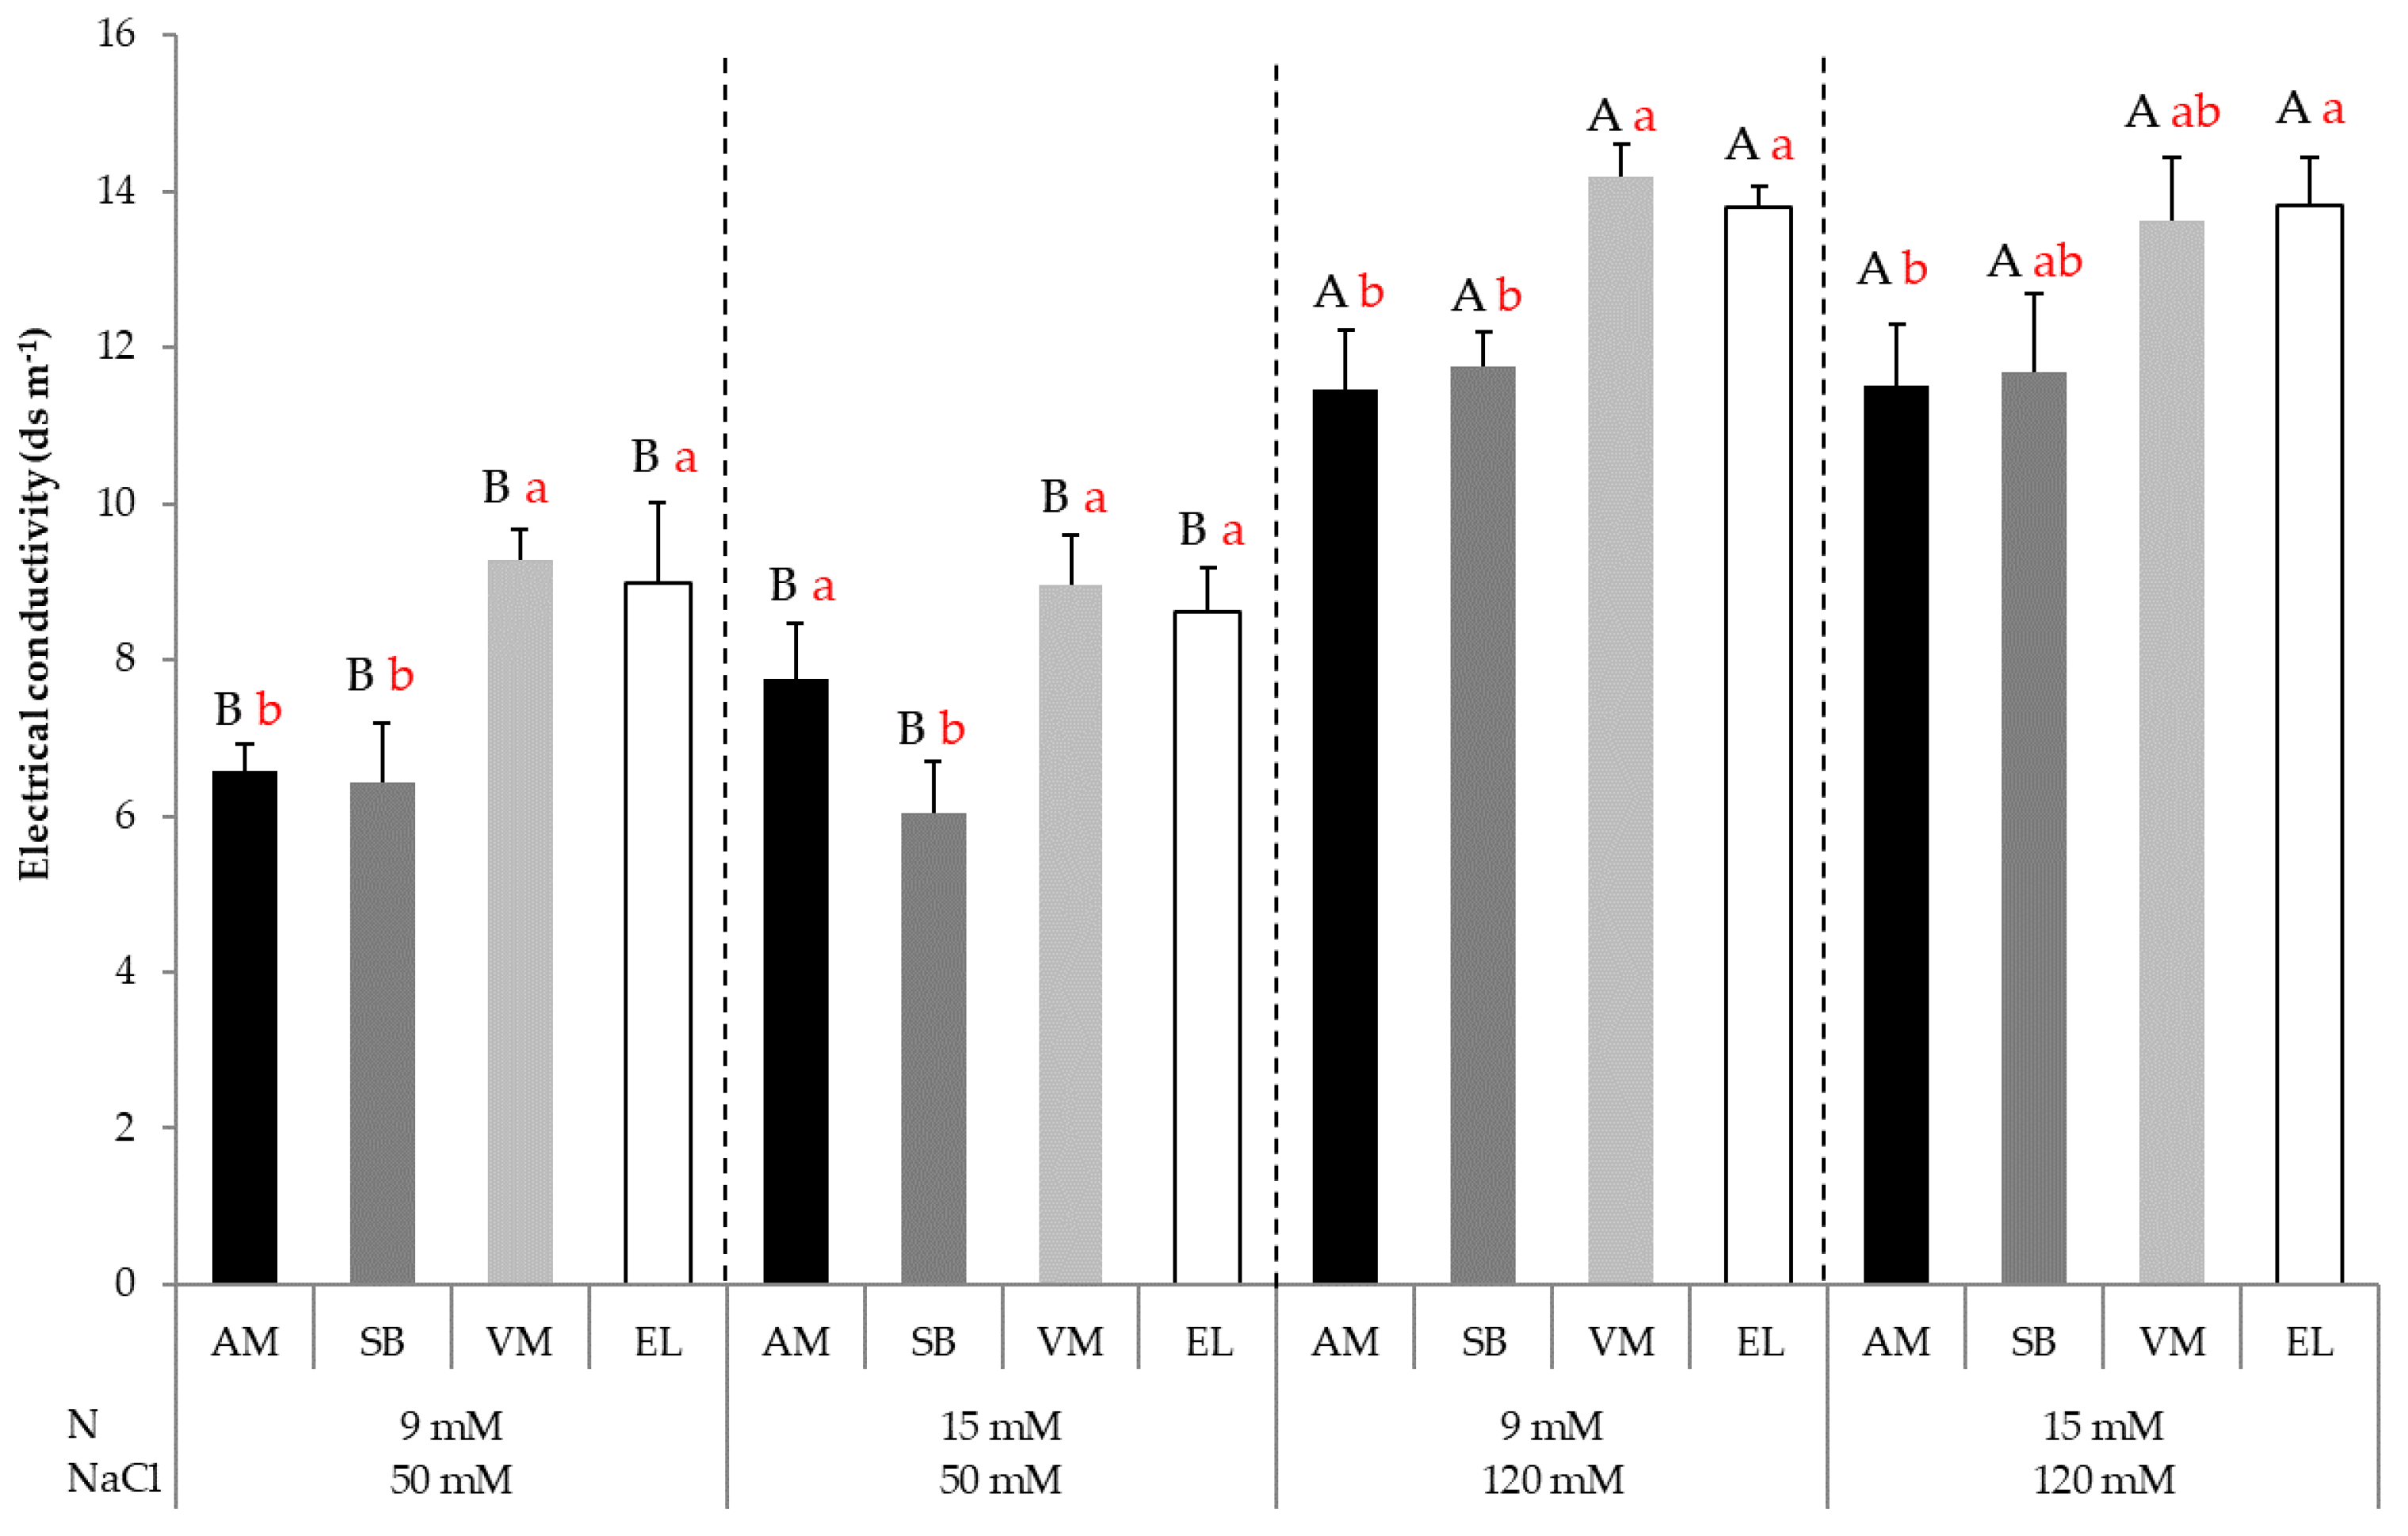
3.8. Electrical Conductivity

A significant difference was found between salinity treatments, with the HS treatments having significantly higher EC values than the LS treatments (t-test, p < 0.001, n = 8).
Effect on ecotype (Figure 8). For all ecotypes, the HS treatments resulted in significantly higher EC values than the LS treatments. On the other hand, N treatment did not affect the EC values within an ecotype.
Effect within treatment (Figure 8). For the LN + LS plants, the VM and EL ecotypes had significantly higher EC values than AM and SB. At HN + LS, SB had a significantly lower tissue extract EC with no difference found between AM, VM, and EL. The LN + HS and HN + HS results were the same as for LN + LS plants, except the absolute values were higher.

4. Discussion

The current study focused on the responses of various halophytes to nitrogen and salt treatments, with the objective being the development of additional crop species suitable for growth in brackish water. Two novel halophytes, SB and AM, were compared to the currently cultivated VM and EL ecotypes. SB has been suggested as a valuable source of seed oils and nutraceuticals and a heavy metal accumulator for bioremediation [21] but has not yet been cultivated as a crop in a significant way. AM has also been identified as a potentially valuable source of nutraceuticals [22,23,24] and a gourmet addition to cuisine [23].
Regarding fresh biomass, our data for Sarcocornia ecotypes EL and VM are in broad agreement with those of Ventura et al. [8] at a similar salt level. Here it is worth noting that the new novel halophyte, SB, accumulated double the amount of biomass as compared to the currently cultivated VM under greenhouse conditions with greatly increased PAR (650–700 Mol/m2/s, midday) and temperatures reaching 40 °C during the summer months (Table 2). In addition to the high biomass, SB did not flower over the year. This is of great interest for commercialization since the local Salicornia generally starts to flower as day length decreases, which greatly diminishes its annual biomass production, whereas Sarcocornia was shown not to flower all year round under successive harvest conditions. [8]. The multiple harvest regime applied to S. brachiata has two significant advantages: (1) postponement of flowering (see Supplementary Figure S2 for flowering plant) and continued vegetative growth, and (2) multiple harvests ensure a quality product in that only young shoots are harvested [25]. Notably, there is considerable variation in harvest biomass for S. brachiata. Ventura et al. [26] demonstrated that the time between harvests is an important metric when evaluating crop potential. Additionally, harvest frequency/biomass experiments should be conducted to optimize the growth protocol.
Salinity stress may result in oxidative stress and damage by the generated reactive oxygen species (ROS), ROS generation triggers anthocyanin production, and these antioxidants are used to scavenge ROS to ameliorate osmotic damage to cells [27,28]. Anthocyanin production, as a response to salinity, has been reported in rice plants [29,30]) where leaf anthocyanin content correlates strongly with salt stress tolerance [29]. In contrast, although high anthocyanin contents may protect sensitive plants against salt stress, salt-tolerant plants do not always produce elevated levels of anthocyanins, presumably because they have alternative mechanisms to reduce oxidative damage [31]. Our data show a sharp division between low and high salt treatments, with most plants in the LN + HS having higher levels of anthocyanins. The exception to this is VM, which had low anthocyanin contents for all treatments indicating possible differences in VM responses to oxidative stress.
The total soluble protein contents in the various halophytes followed anthocyanin contents. Changes in soluble protein contents in response to salinity have been reported and fall into two groups: salt stress proteins and stress-associated proteins [32,33,34]. The former group accumulates only under salinity stress, while the latter group is associated with other abiotic stress such as cold, heat, drought, or mineral nutrition imbalances. Ashraf and O’Leary [34] showed an increase in soluble proteins in salt-challenged wheat cultivars. This response depended on the salt tolerance of the cultivar, with greater increases in salt-sensitive plants compared to salt-tolerant plants. This is reflected in our data where VM, which, together with EL, exhibited the highest biomass accumulation under the high salinity treatments, had the lowest soluble protein content. Since proteins, in addition to their role as osmotica, are a storage mechanism for nitrogen that is available for growth [35], the results indicate a possible limitation of VM for further biomass increase unless N supply by fertigation is enhanced.
The ORAC assay is a widely used and biologically relevant method [36,37,38]. The antioxidant capacity of a particular crop will vary across cultivar and growth conditions and is, therefore, a useful assay to determine relative differences between experimental treatments. Given that anthocyanins are important antioxidants, a positive relationship between ORAC values and anthocyanins can be expected and has been established by others [39]. We did not find a significant correlation between anthocyanin levels and ORAC, although the high salt treatments did produce plants with high ORAC values. This was particularly evident with AM, where increasing N and NaCl were associated with increased ORAC values, and also with VM, which had a consistently low ORAC together with the low anthocyanin contents discussed above. This is likely because the ORAC includes other antioxidants in addition to the anthocyanins.
Shoot relative water content (RWC) is a measure of shoot tissue hydration and a suitable indication of the shoot response to salinity: a decrease indicates physiological droughting because of osmolytes limitation, and an increase indicates the outcome of osmolytes accumulated within the plant tissue, while a steady state indicates that the plant water status is stable. Here, the halophytes showed different responses to salinity. Of particular interest was the response of SB to increased salts, where the RWC was consistently lower than the lowest salts treatment (LN + LS). Ben Amor et al. [40] show that salt tolerance is related to tissue osmolyte accumulation, and it suggests that SB is the most sensitive to salts. A decreased RWC could be the result of physical drought in the root environment, but this is not the case here as the experimental layout precludes this with all four ecotypes represented in each treatment tray. The RWC of VM, AM, and EL generally increased with increasing salinity levels, suggesting that tissue osmolyte accumulation was a tolerance strategy for this ecotype. It is worth mentioning that glycophytic plants show decreases in RWC in response to salinity increase as demonstrated by Soni et al. [41] using 15 wheat genotypes at two salinities similar to those used in the current study (6 and 10 dS/m). Similarly, Kapoor and Pande [42], in a study on Fenugreek, also comparing salinities similar to this study, found that RWC decreased with increasing salinity. The halophyte response is contrary to this, and halophytes grown at high salinities have increased RWC [43]. It was interesting to record both responses in our study. SB RWC clearly decreased with increasing salinity presenting a response more glycophytic than halophytic, the result of lower osmotica expressed generally by the lowest TSS and EC compared to the other halophytes examined (Figure 5 and Figure 8), whereas VM, EL, and AM exhibited a more typical halophytic response.
The enhancement of the total soluble solids (TSS) increase with salinity in Sarcocornia ecotypes is in agreement with other studies [44,45,46] showing that sugars content increase is presumably a plant response to salinity increasing osmo-protective mechanism balancing the increased salt uptake, as seen with EC values [47]. Interestingly, this was only observed for the Sarcocornia ecotypes, while AM showed no variation in TSS across the treatments, whereas SB showed varied TSS values with no apparent pattern across the treatments.
With regard to control plants in studies that include halophytic plants such as Salicornia and/or Sarcocornia, it should be considered that ‘zero salinity’ as the control treatment would, in itself, be a stressor. Accordingly, it is entirely appropriate to include a salt treatment as the control when the plant material is Salicornia and/or Sarcocornia and compare other salinity level treatments to it, as done before by Ventura et al. [18,24,25] and Kurmanbayeva et al. [48].

5. Conclusions

The assays, including osmotica, antioxidant status, and biomass accumulation, used here provided a useful and informative screen for evaluating candidate crops. Different combinations of nitrogen and salt were used to examine the generation of plant crops with differing characteristics. High biomass, for example, can be achieved using high nitrogen levels together with low salinity. The data also revealed unexpected findings in that SB, a quintessential halophyte, presents a glycophytic RWC response to salinity and opens the door to more detailed physiological studies. We also demonstrate, for the first time, the potential for SB to become a high biomass crop capable of producing biomass year-round, with sequential harvesting being the key to delaying flowering.

Supplementary Materials

The following supporting information can be downloaded at: https://www.mdpi.com/article/10.3390/agronomy12081749/s1, Figure S1: Sarcocornia fruticosa VM (two left hand pots) and Salicornia brachiata (two right hand pots). The upper Figure S1A shows the plants immediately before harvest, and the lower Figure S1B shows the plants after harvest. Harvesting was performed using the commercial protocol. Briefly, plants were allowed to grow until they reached ~15 cm high. The plants were cut back to ~10 cm, forming a ‘cutting table’. Plants regrew and were harvested again when the new shoots were ~8–10 cm long. This ensures young stems for the market without fibrous material. Note the different growth habits of S. brachiata: Figure S2: Flowering Salicornia brachiata in plants grown without shoot harvest.

Author Contributions

Conceptualization, T.A.S., Z.N., D.O., A.K.D., K.K., A.N., L.M.B.C., A.M., V.M., M.S. (Muki Shpigel), R.K.S., D.S. and M.S. (Moshe Sagi); methodology, T.A.S., Z.N., D.O., A.K.D., K.K., D.S. and M.S. (Moshe Sagi); validation, T.A.S., D.S., Z.N., D.O., A.K.D., K.K. and M.S. (Moshe Sagi); formal analysis, T.A.S., Z.N., D.O., D.S., A.K.D. and M.S. (Moshe Sagi); investigation, T.A.S. and M.S. (Moshe Sagi); resources, M.S. (Moshe Sagi); data curation, T.A.S. and M.S. (Moshe Sagi); writing—original draft preparation, T.A.S., D.S. and M.S. (Moshe Sagi); writing—review and editing, T.A.S., D.S., Z.N., D.O., A.K.D., K.K., A.N., L.M.B.C., A.M., V.M., M.S. (Muki Shpigel), R.K.S. and M.S. (Moshe Sagi); visualization, T.A.S., D.S., Z.N., D.O., A.K.D., K.K., A.N., L.M.B.C., A.M., V.M., M.S. (Muki Shpigel), R.K.S. and M.S. (Moshe Sagi); supervision, D.S. and M.S. (Moshe Sagi); project administration, M.S. (Moshe Sagi); funding acquisition, L.M.B.C., A.N., M.S. (Moshe Sagi) and M.S. (Muki Shpigel). All authors have read and agreed to the published version of the manuscript.

Funding

Provided by the European Commission H2O2O initiative, project number 820906 INDIAH2O, the Ministry of Innovation, Science & Technology, Israel-Portugal, project number 3-16524, the Portuguese National Budget (bilateral project, Portugal/Israel, PT-IL/0003/2019, UIDB/04326/2020 projects) and FCT Scientific Employment Stimulus (CEECIND/00425/2017).

Institutional Review Board Statement

Not applicable.

Informed Consent Statement

Not applicable.

Data Availability Statement

The data presented in this study are available upon request from the corresponding authors.

Acknowledgments

We gratefully acknowledge the funding provided by the EC (project number 820906) and the Israel Portugal Ministry of Science (project number 3-16524).

Conflicts of Interest

The authors declare no conflict of interest.

References

  1. Kaushal, S.S.; Likens, G.E.; Pace, M.L.; Utz, R.M.; Haq, S.; Gorman, J.; Grese, M. Freshwater salinization syndrome on a continental scale. Proc. Natl. Acad. Sci. USA 2018, 115, E574–E583. [Google Scholar] [CrossRef] [PubMed] [Green Version]
  2. Wienhold, B.J. Soils, Land, and Food: Managing the Land during the Twenty-First Century. Soil Sci. 2003, 168, 748–749. [Google Scholar] [CrossRef] [Green Version]
  3. Flowers, T.J.; Hajibagheri, M.A.; Clipson, N.J.W. Halophytes. Quart. Rev. Biol. 1986, 61, 313–337. [Google Scholar] [CrossRef]
  4. Lombardi, T.; Bertacchi, A.; Pistelli, L.; Pardossi, A.; Pecchia, S.; Toffanin, A.; Sanmartin, C. Biological and Agronomic Traits of the Main Halophytes Widespread in the Mediterranean Region as Potential New Vegetable Crops. Horticulturae 2022, 8, 195. [Google Scholar] [CrossRef]
  5. Agudelo, A.; Carvajal, M.; del Carmen Martinez-Ballesta, M. Halophytes of the Mediterranean Basin—Underutilized Species with the Potential to Be Nutritious Crops in the Scenario of the Climate Change. Foods 2021, 10, 119. [Google Scholar] [CrossRef]
  6. Grieve, C.M.; Suarez, D.L. Purslane (Portulaca oleracea L.): A halophytic crop for drainage water reuses systems. Plant Soil 1997, 192, 277–283. [Google Scholar] [CrossRef]
  7. Ventura, Y.; Eshel, A.; Pasternak, D.; Sagi, M. The development of halophyte-based agriculture: Past and present. Ann. Bot. 2015, 115, 529–540. [Google Scholar] [CrossRef] [Green Version]
  8. Ventura, Y.; Wuddineh, W.A.; Shpigel, M.; Samocha, T.M.; Klim, B.C.; Cohen, S.; Shemer, Z.; Santos, R.; Sagi, M. Effects of day length on flowering and yield production of Salicornia and Sarcocornia species. Sci. Hortic. 2011, 130, 510–516. [Google Scholar] [CrossRef]
  9. Custódio, L.; Ferreira, A.C.; Pereira, H.; Silvestre, L.; Vizetto-Duarte, C.; Barreira, L.; Rauter, A.P.; Alberício, F.; Varela, J. The marine halophytes Carpobrotus edulis L. and Arthrocnemum macrostachyum L. are potential sources of nutritionally important PUFAs and metabolites with antioxidant, metal chelating and anticholinesterase inhibitory activities. Bot. Mar. 2012, 55, 281–288. [Google Scholar] [CrossRef]
  10. Stanley, O.D. Bio prospecting marine halophyte Salicornia brachiata for medical importance and salt encrusted land development. J. Coast. Dev. 2008, 11, 62–69. [Google Scholar]
  11. Shpigel, M.; Ben-Ezra, D.; Shauli, L.; Sagi, M.; Ventura, Y.; Samocha, T.; Lee, J.J. Constructed Wetland with Salicornia as a Biofilter for Mariculture Effluents. Aquaculture 2013, 412–413, 52–63. [Google Scholar] [CrossRef]
  12. Feigin, A.; Rylski, I.; Meiri, A.; Shalhevet, J. Response of melon and tomato plants to chloride-nitrate ratios in saline nutrient solutions. J. Plant Nutr. 1987, 10, 1787–1794. [Google Scholar] [CrossRef]
  13. Prior, R.L.; Cao, G.; Martin, A.; Sofic, E.; McEwen, J.; O’Brien, C.; Lischner, N.; Ehlenfeldt, M.; Kalt, W.; Krewer, G.; et al. Antioxidant capacity as influenced by total phenolic and anthocyanin content, maturity, and variety of Vaccinium Species. J. Agric. Food Chem. 1998, 46, 2686–2693. [Google Scholar] [CrossRef]
  14. Ou, B.; Huang, D.; Hampsch-Woodill, M.; Flanagan, J.; Deemer, E. Analysis of antioxidant activities of common vegetables employing oxygen radical absorbance capacity (ORAC) and ferric reducing antioxidant power (FRAP) assays: A comparative study. J. Agric. Food Chem. 2002, 50, 3122–3128. [Google Scholar] [CrossRef]
  15. Yamasaki, S.; Dillenburg, L.R. Measurements of leaf relative water content in araucaria angustifolia. R. Bras. Fisiol. Veg. 1999, 11, 69–75. [Google Scholar]
  16. Ventura, Y.; Mendlinger, S. Effects of suboptimal low temperature on yield, fruit appearance and quality in muskmelon (Cucumis melo L.) cultivars. J. Hortic. Sci. Biotechnol. 1999, 74, 602–607. [Google Scholar] [CrossRef]
  17. Laby, R.J.; Kincaid, M.S.; Kim, D.; Gibson, S.I. The Arabidopsis sugar-insensitive mutants sis4 and sis5 are defective in abscisic acid synthesis and response. Plant J. 2000, 23, 587–596. [Google Scholar] [CrossRef]
  18. Ventura, Y.; Wuddineh, W.A.; Ephrath, Y.; Shpigel, M.; Sagi, M. Molybdenum as an essential element for improving total yield in seawater-grown Salicornia europaea L. Sci. Hortic. 2010, 126, 395–401. [Google Scholar] [CrossRef]
  19. Bradford, M.M. A rapid and sensitive method for the quantitation of microgram quantities of protein utilizing the principle of protein–dye binding. Anal. Biochem. 1976, 72, 248–254. [Google Scholar] [CrossRef]
  20. Gillespie, K.M.; Chae, J.M.; Ainsworth, E.A. Rapid measurement of total antioxidant capacity in plants. Nat. Protoc. 2007, 2, 867–870. [Google Scholar] [CrossRef]
  21. Cárdenas-Pérez, S.; Piernik, A.; Chanona-Pérez, J.J.; Grigore, M.N.; Perea-Flores, M.J. An overview of the emerging trends of the Salicornia L. genus as a sustainable crop. Environ. Exp. Bot. 2021, 191, 104606. [Google Scholar] [CrossRef]
  22. Custódio, L.; Rodrigues, M.J.; Pereira, C.G.; Castañeda-Loaiza, V.; Fernandes, E.; Standing, D.; Neori, A.; Shpigel, M.; Sagi, M. A Review on Sarcocornia Species: Ethnopharmacology, Nutritional Properties, Phytochemistry, Biological Activities and Propagation. Foods 2021, 10, 2778. [Google Scholar] [CrossRef] [PubMed]
  23. Barreira, L.; Resek, E.; Rodrigues, M.J.; Rocha, M.I.; Pereira, H.; Bandarra, N.; Silva, M.M.; Varela, J.; Custódio, L. Halophytes: Gourmet food with nutritional health benefits? J. Food Comp. Anal. 2017, 59, 35–42. [Google Scholar] [CrossRef]
  24. Ventura, Y.; Sagi, M. Halophyte crop cultivation: The case for Salicornia and Sarcocornia. Environ. Exp. Bot. 2013, 92, 144–153. [Google Scholar] [CrossRef]
  25. Ventura, Y.; Wuddineh, W.A.; Myrzabayeva, M.; Khozin-Goldberg, I.; Shpigel, M.; Samocha, T.M.; Sagi, M. Effect of seawater concentration on the productivity and nutritional value of annual Salicornia and perennial Sarcocornia halophytes as leafy vegetable crops. Sci. Hortic. 2011, 128, 189–196. [Google Scholar] [CrossRef]
  26. Deghan, S.; Sadeghi, M.; Pöppel, A.; Fischer, R.; Lakes-Harlan, R.; Kavousi, H.R.; Vilcinskas, A.; Rahnamaeian, M. Differential inductions of phenylalanine ammonia-lyase and chalcone synthase during wounding, salicylic acid treatment, and salinity stress in safflower, Carthamus tinctorius. Biosci. Rep. 2014, 34, e00114. [Google Scholar] [CrossRef]
  27. Chunthaburee, S.; Sakuanrungsirikul, S.; Wongwarat, T.; Sanitchon, J.; Pattanagul, W.; Theerakulpisut, P. Changes in anthocyanin content and expression of anthocyanin synthesis genes in seedlings of black glutinous rice in response to salt stress. Asian J. Plant Sci. 2016, 15, 56–65. [Google Scholar] [CrossRef] [Green Version]
  28. Chutipaijit, S.; Cha-um, S.; Sompornpailin, K. High contents of proline and anthocyanin increase protective response to salinity in Oryza sativa L. spp. indica. Aust. J. Crop Sci. 2011, 5, 1191–1198. [Google Scholar]
  29. Djanaguiraman, M.; Ramadass, R.; Devi, D.D. Effect of salt stress on germination and seedling growth in rice genotypes. Madras Agric. J. 2003, 90, 50–53. [Google Scholar]
  30. Kovinich, N.; Kayanja, G.; Chanoca, A.; Riedl, K.; Otegui, M.S.; Grotewold, E. Not all anthocyanins are born equal: Distinct patterns induced by stress in Arabidopsis. Planta 2014, 240, 931–940. [Google Scholar] [CrossRef] [Green Version]
  31. Hurkman, W.J.; Fornari, C.S.; Tanaka, C.K. A comparison of the effect of salt on polypeptide and translatable mRNA in roots of a salt tolerant and salt sensitive cultivar of barley. Plant Physiol. 1989, 90, 1444–1456. [Google Scholar] [CrossRef] [PubMed] [Green Version]
  32. Pareek, A.; Singla, S.L.; Grover, A. Salt responsive proteins/genes in crop plants. In Strategies for Improving Salt Tolerance in Higher Plants; Jaiwal, P.K., Singh, R.P., Gulati, A., Eds.; Oxford and IBH Publication Co.: New Delhi, India, 1997; pp. 365–391. [Google Scholar]
  33. Ali, G.; Srivastava, P.S.; Iqbal, M. Proline accumulation, protein pattern and photosynthesis in regenerants grown under NaCl stress. Biol. Plant. 1999, 42, 89–95. [Google Scholar] [CrossRef]
  34. Ashraf, M.; O’Leary, J.W. Changes in soluble proteins in spring wheat stressed with sodium chloride. Biol. Plant. 1999, 42, 113–117. [Google Scholar] [CrossRef]
  35. Singh, N.K.; Bracken, C.A.; Hasegawa, P.M.; Handa, A.K.; Buckel, S.; Hermodson, M.A.; Pfankoch, F.; Regnier, F.E.; Bressan, R.A. Characterization of osmotin. A thaumatin-like protein associated with osmotic adjustment in plant cells. Plant Physiol. 1987, 85, 529–536. [Google Scholar] [CrossRef] [Green Version]
  36. Dudonné, S.; Vitrac, X.; Coutière, P.; Woillez, M.; Mérillon, J.-M. Comparative study of antioxidant properties and total phenolic content of 30 plant extracts of industrial interest using DPPH, ABTS, FRAP, SOD, and ORAC assays. J. Agric. Food Chem. 2009, 57, 1768–1774. [Google Scholar] [CrossRef] [PubMed]
  37. Huang, D.; Ou, B.; Prior, R.L. The chemistry behind antioxidant capacity assays. J. Agric. Food Chem. 2005, 53, 1841–1856. [Google Scholar] [CrossRef]
  38. Prior, R.L.; Cao, G. In vivo total antioxidant capacity: Comparison of different analytical methods. Free Rad. Biol. Med. 1999, 27, 1173–1181. [Google Scholar] [CrossRef]
  39. Ehlenfeldt, M.K.; Prior, R.L. Oxygen radical absorbance capacity (ORAC) and phenolic and anthocyanin concentrations in fruit and leaf tissues of Highbush Blueberry. J. Agric. Food Chem. 2001, 49, 2222–2227. [Google Scholar] [CrossRef]
  40. Ben Amor, N.; Jiménez, A.; Boudabbous, M.; Sevilla, F.; Abdelly, C. Chloroplast Implication in the Tolerance to Salinity of the Halophyte Cakile maritima. Russ. J. Plant Physiol. 2020, 67, 507–514. [Google Scholar] [CrossRef]
  41. Soni, S.; Kumar, A.; Sehrawat, N.; Kumar, A.; Kumar, N.; Lata, C.; Mann, A. Effect of saline irrigation on plant water traits, photosynthesis and ionic balance in durum wheat genotypes. Saudi J. Bio. Sci. 2021, 28, 2510–2517. [Google Scholar] [CrossRef]
  42. Kapoor, N.; Pande, V. Effect of salt stress on growth parameters, moisture content, relative water content and photosynthetic pigments of Fenugreek variety RMt-1. J. Plant Sci. 2015, 10, 210–221. [Google Scholar] [CrossRef] [Green Version]
  43. Parida, A.K.; Veerabathini, S.K.; Kumari, A.; Agarwal, P.K. Implications of Salt Tolerance in the Halophyte Salvadora persica under Hydroponic Culture Condition. Front. Plant Sci. 2016, 7, 351. [Google Scholar] [CrossRef] [PubMed] [Green Version]
  44. Yang, C.; Shi, D.; Wang, D. Comparative effects of salt and alkali stresses on growth, osmotic adjustment and ionic balance of an alkali-resistant halophyte Suaeda glauca (Bge). Plant Growth Regul. 2008, 56, 179–190. [Google Scholar] [CrossRef]
  45. Zakery-Asl, M.A.; Bolandnazar, S.; Oustan, S. Effect of salinity and nitrogen on growth, sodium, potassium accumulation, and osmotic adjustment of halophyte Suaeda aegyptiaca (Hasselq.) Zoh. Arch. Agron. Soil Sci. 2014, 60, 785–792. [Google Scholar] [CrossRef]
  46. Ventura, Y.; Myrzabayeva, M.; Alikulov, Z.; Omarov, R.; Khozin-Goldberg, I.; Sagi, M. Effects of salinity on flowering, morphology, biomass accumulation and leaf metabolites in an edible halophyte. AoB Plants 2014, 6, plu053. [Google Scholar] [CrossRef] [PubMed] [Green Version]
  47. Türkan, I.; Demiral, T. Recent developments in understanding salinity tolerance. Env. Exp. Bot. 2009, 67, 2–9. [Google Scholar] [CrossRef]
  48. Kurmanbayeva, A.; Bekturova, A.; Srivastava, S.; Soltabayeva, A.; Asatryan, A.; Ventura, Y.; Khan, M.S.; Salazar, O.; Fedoroff, N.; Sagi, M. Higher novel L-Cys degradation activity results in lower organic-S and biomass in Sarcocornia than the related saltwort, Salicornia. Plant Physiol. 2017, 175, 272–289. [Google Scholar] [CrossRef] [Green Version]
Figure 1. Fresh shoot biomass in Arthrocnemum macrostachyum (AM), Salicornia brachiata (SB), and Sarcocornia fruticosa ecotypes (EL and VM). LN under different combinations of N (9 and 15 mM) and NaCl (50 and 120 mM). Means plus standard errors (±SE) are shown. Different uppercase letters show significant differences between treatments of one ecotype (same color bars), and different lowercase red letters show significant differences between ecotypes within the same treatment (Tukey’s HSD, p ≤ 0.05, n = 4).
Agronomy 12 01749 g001
Figure 2. Dry shoot biomass in Arthrocnemum macrostachyum (AM), Salicornia brachiata (SB), and Sarcocornia fruticosa ecotypes (EL and VM). LN under different combinations of N (9 and 15 mM) and NaCl (50 and 120 mM). Means plus standard errors (±SE) are shown. Different uppercase letters show significant differences between treatments of one ecotype (same color bars), and different lowercase red letters show significant differences between ecotypes within the same treatment (Tukey’s HSD, p ≤ 0.05, n = 4).
Agronomy 12 01749 g002
Figure 3. Relative water content (RWC) in Arthrocnemum macrostachyum (AM), Salicornia brachiata (SB), and Sarcocornia fruticosa ecotypes (EL and VM). LN under different combinations of N (9 and 15 mM) and NaCl (50 and 120 mM). Means plus standard errors (±SE) are shown. Different uppercase letters show significant differences between treatments of one ecotype (same color bars), and different lowercase red letters show significant differences between ecotypes within the same treatment (Tukey’s HSD, p ≤ 0.05, n = 3).
Agronomy 12 01749 g003
Figure 4. Total soluble protein in Arthrocnemum macrostachyum (AM), Salicornia brachiata (SB), and Sarcocornia fruticosa ecotypes (EL and VM). LN under different combinations of N (9 and 15 mM) and NaCl (50 and 120 mM). Means plus standard errors (±SE) are shown. Different uppercase letters show significant differences between treatments of one ecotype (same color bars), and different lowercase red letters show significant differences between ecotypes within the same treatment (Tukey’s HSD, p ≤ 0.05, n = 7).
Agronomy 12 01749 g004
Figure 5. Total soluble solids Arthrocnemum macrostachyum (AM), Salicornia brachiata (SB), and Sarcocornia fruticosa ecotypes (EL and VM). LN under different combinations of N (9 and 15 mM) and NaCl (50 and 120 mM). Means plus standard errors (±SE) are shown. Different uppercase letters show significant differences between treatments of one ecotype (same color bars), and different lowercase red letters show significant differences between ecotypes within the same treatment (Tukey’s HSD, p ≤ 0.05, n = 3).
Agronomy 12 01749 g005
Figure 6. Anthocyanin contents in Arthrocnemum macrostachyum (AM), Salicornia brachiata (SB), and Sarcocornia fruticosa ecotypes (EL and VM). LN under different combinations of N (9 and 15 mM) and NaCl (50 and 120 mM). Means plus standard errors (±SE) are shown. Different uppercase letters show significant differences between treatments of one ecotype (same color bars), and different lowercase red letters show significant differences between ecotypes within the same treatment (Tukey’s HSD, p ≤ 0.05, n = 2–3).
Agronomy 12 01749 g006
Figure 7. ORAC (moles TE g−1) in Arthrocnemum macrostachyum (AM), Salicornia brachiata (SB), and Sarcocornia fruticosa ecotypes (EL and VM). LN under different combinations of N (9 and 15 mM) and NaCl (50 and 120 mM). Means plus standard errors (±SE) are shown. Different uppercase letters show significant differences between treatments of one ecotype (same color bars), and different lowercase red letters show significant differences between ecotypes within the same treatment (Tukey’s HSD, p ≤ 0.05, n = 3).
Agronomy 12 01749 g007
Figure 8. Electrical conductivity (ds m−1) in shoot extracts of Arthrocnemum macrostachyum (AM), Salicornia brachiata (SB), and Sarcocornia fruticosa ecotypes (EL and VM). LN under different combinations of N (9 and 15 mM) and NaCl (50 and 120 mM). Means plus standard errors (±SE) are shown. Different uppercase letters show significant differences between treatments of one ecotype (same color bars), and different lowercase red letters show significant differences between ecotypes within the same treatment (Tukey’s HSD, p ≤ 0.05, n = 3).
Agronomy 12 01749 g008
Table 1. Electrical conductivity (EC) (ds m−1) of the input nutrient solution and leaching fraction. The means plus standard errors (±SE) are shown, n = 7.
TreatmentInputLeaching Fraction
Nitrogen (mM)NaCl (mM)EC (ds m−1)EC (ds m−1)
9.42505.878.12 ± 0.21
15.42506.198.45 ± 0.22
9.4212011.8714.76 ± 0.84
15.4212011.9516.1 ± 0.84
Table 2. Fresh shoot biomass in Salicornia brachiata (SB) and Sarcocornia fruticosa (VM) for seven harvests approximately 40 days apart over one year. Plants were grown under greenhouse conditions and with natural daylight and 9 mM N and 50 mM NaCl. The means plus standard errors (±SE) of each harvest are shown, n = 2, * n = 1.
HarvestsFresh Biomass (kg m2)Total
Biomass (kg m2)
1st2nd3rd4th5th6th7th
S. brachiata (SB)2.89 ± 0.5310.38 ± 0.335.72 ± 0.097.18 ± 0.604.62 ± 0.957.20 ± 0.781.7 ± 0.1039.73 ± 1.10
S. fruticosa (VM)0.26 ± 0.071.00 ± 0.150.90 ± 0.361.00 ± 0.551.75 *4.70 *5.0 *14.60 ± 0.65
Publisher’s Note: MDPI stays neutral with regard to jurisdictional claims in published maps and institutional affiliations.

