Article

Increased Soil Fertility in Tea Gardens Leads to Declines in Fungal Diversity and Complexity in Subsoils

1
Key Laboratory of Tea Quality and Safety Control, Ministry of Agriculture, Tea Research Institute, Chinese Academy of Agricultural Sciences, Hangzhou 310008, China
2
Department of Soil Science of Temperate Ecosystems, University of Göttingen, 37077 Göttingen, Germany
3
Biogeochemistry of Agroecosystems, Department of Crop Science, University of Göttingen, 37077 Göttingen, Germany
4
Key Laboratory for Plant Diversity and Biogeography of East Asia, Kunming Institute of Botany, Chinese Academy of Sciences, Kunming 650201, China
5
East and Central Asia, World Agroforestry Centre, Kunming 650201, China
*
Author to whom correspondence should be addressed.
Agronomy 2022, 12(8), 1751; https://doi.org/10.3390/agronomy12081751
Submission received: 17 June 2022 / Revised: 12 July 2022 / Accepted: 12 July 2022 / Published: 25 July 2022
(This article belongs to the Special Issue Applied Research and Extension in Agronomic Soil Fertility)

Abstract

:
Soil fungi are key drivers regulating processes between ecosystem fertility and plant growth; however, the responses of soil fungi community composition and diversity in deeper soil layers to the plantation and fertilization remain limited. Using soil samples along with vertical soil profile gradients with 0–10 cm, 0–20 cm, 20–40 cm, and 40–60 cm in a tea garden, we used Illumina sequencing to investigate the fungal diversity and assemblage complexity, and correlated to the low, middle, and high-level fertilize levels. The results showed that the fungal community dissimilarities were different between adjacent forests and tea gardens, with predominate groups changed from saprotrophs to symbiotrophs and pathotrophs after the forest converted to the tea garden. Additionally, the symbiotrophs were more sensitive to soil fertility than pathotrophs and saprotrophs. Subsoil fungal communities present lower diversity and fewer network connections under high soil fertility, which contrasted with the trends of topsoil fungi. Soil pH and nutrients were correlated with fungal diversity in the topsoils, while soil K and P concentrations showed significant effects in the subsoil. Overall, the soil fungal communities in tea gardens responded to soil fertility varied with soil vertical spatial locations, which can be explained by the vertical distribution of fungal species. It was revealed that fertility treatment could affect fungal diversity, and alter network structure and potential ecosystem function in tea garden subsoils.

1. Introduction

Tea (Camellia sinensis) is an evergreen perennial plant, predominately distributed in tropical and subtropical areas [1]. As the largest tea producer in the world, China holds 2.93 million hectares, accounting for over half of the world’s total tea product zones [2]. Recently, tea expansion in China mainly from tropical or subtropical forest transformation. Tea plants are perennial and are always plucked for young shoots and leaves, consequently, demand more N for high yield and quality components [3]. With these requirements, tea farmers commonly applied excess amounts of synthetic and organic fertilizers, particularly nitrogen (N) fertilizers to their Tea gardens [4]; however, overuse of fertilizers or pesticides in the Tea gardens led to reductions in tea yield and soil quality [5]. To assess soil quality in the Tea garden, several sensitive soil properties (soil C/N, pH or heave metal concentration) have been generally used to build a linkage between soil quality with fertilization [6]; however, until recently, our understanding of organic fertilization in Tea gardens affects soil biological properties is still limited.
Soil microbes are the drivers of soil functional processes, while several microbial properties (e.g., microbial biomass, enzymatic activities, metabolic quotient, functional genetic diversity), have been indicated as soil quality indexes [6]. Previous studies have pointed out that fertilization reduced the bacterial diversity and microbial biomass in Tea gardens, but fewer studies focus on soil fungal communities [7,8]. Soil fungi consist of multiple functional groups and play critical roles in decomposing, mutualists, and pathogenic processes [9,10]. Saprotrophic fungi are primarily carbon (C) decomposers and thus occur in the topsoil, where organic matter from plant litter accumulates [11]. By contrast, symbiotic fungi occur in subsoils, obtaining C entirely from plant roots, and are directly involved in plant nutrient uptake [12]. Soil pH, C/N and nutrient inputs can significantly affect soil fungal diversity and community composition, due to their high realization of the substrate and habitat environment [13,14]. For example, N amendments increased the relative abundance of the sub-fungal group -Ascomycota, together with an increase in fungal diversity [15]. Consist to these studies, higher doses of N supplementation or supplementation over periods appeared to disrupt carbon allocation in trees and N retention in ectomycorrhizal sporocarps [16]. Soil fungal communities are diverse and highly interactive in the agriculture system, their interactions are attracting more and more attention recently.
Soil fungal species have distinct ecological niches with diverse substrate utilization profiles, which mediate the response of soil fungi to fertilization. Therefore, the assembly of fungal communities is a critic of their ecological functions in the soil process. The assembly of microbial communities has traditionally been predominantly driven through deterministic (e.g., selection) processes [17]. Environmental stress selects microbes by substrate availability, and species persist according to the availability of their ecological niche [18]. Microbial interactions in turn affect populations via predation, competition, or facilitation [19]. The balance between selective forces, both extrinsic and intrinsic, shapes community composition and function.
As remarkable microbial community characteristics, microbial interactions have been recently explored by using Network analysis in various environments, to figure out the most connected microbial populations and identify keystone species that may have the greatest impact on the microbial community assembly process [20,21,22]. Gu et al., 2019 used network analysis to indicate that the network of organic fertilizer treatment soils contained more functionally interrelated microbial modules than soils with chemic fertilizer treatment [23]. Li et al., 2020 analysis indicated that additional organic substitution could enhance the soil fungal network complexity, which also showed a positive correlation with the SQI [24]. A similar result was found by Guo et al., 2019, which indicated that soil fungal assemblage complexity is dependent on soil fertility and dominated by deterministic processes [25]. Besides high diversity and complex interactions, soil fungi have another significant property, which is higher spatial heterogenetic distribution than other microbes. Soil fungal species are usually separated into saprotrophic and mycorrhizal fungi, which distribute in top- and sub-soils, affected by plant root morphology and soil properties [26]. The previous study focused on fungi on surface-soil, but how the fungi located in subsoil respond to fertilization is still unknown.
Most studies have shown that different fertilization treatments affect soil nutrients and fertility, change soil structure and enzyme activities, and alter soil microbial community structure [27,28,29]; however, it remains unclear how top and subsoil fungi response to long-term fertilization. To fill this knowledge gap, we used pyrosequencing techniques to analyze soil fungal microbiomes across tea farms in Eastern China that use organic management practices. The study aimed to investigate how organic matter inputs gradient affects fungal community diversity and composition, and fungal co-occurs networks of top- and subsoils in Tea gardens. (1) shifts in soil fungal community structure and abundance are linked to changes in the chemical properties of soil SOC and pH as affected by fertilization; (2) shifts in the saprotrophic fungal community are linked to the increased SOM content; (3) increased fungal community network interactions are linked to fertility selection, and (4) the response of soil fungal community is more sensitive in the top- than in the subsoil.

2. Materials and Methods

2.1. Study Sites

Study plots were established in 3 large tea gardens (with an average age of 35 years) located in regions of Hangzhou, Zhejiang Province (120°10′ E, 30°10′ N), China. The annual average temperature is 17.0 °C with the average daily minimum and maximum temperatures of 1.7 °C and 33 °C, respectively. The average annual sunshine hours are 1500–1850 h, and the annual average precipitation is 1553 mm, and about 74% of the total rainfall occurs during the tea growing season, between March and September. The soil is classified as Ultisol (USDA soil taxonomy), it has been developed on Anshan quartz-free porphyry parental material. Three tea gardens (with low, moderate, and high fertilizer input) were chosen to sample, which were separated by less than 0.5 km. Rates of mineral N application were 300 kg ha–1, 600 kg ha–1, and 900 kg ha–1 in the low, moderate, and high input plantations, respectively. Normally, 40% and 30% of the total mineral N in the form of compound fertilizer-N were applied in October and April, and the other 30% mineral N was applied in the form of urea-N in February; what is more, in October, organic fertilizer (rape seed cake with 4.6% N, 0.9% P, 1.2% K) was applied to the low (L), moderate (M), and high input (H) plantations at rates of 0 kg ha–1, 1125 kg ha–1, and 2250 kg ha–1, respectively. Other agronomic management techniques were similar among plantations and included pruning, tilling, and weeding. The tea garden was originally transformed from an adjacent forest (Figure S1). To evaluate the effect of a tea plantation with fertilization on soil quality, four plots were set up in an adjacent forest and sampled as a reference.
The tea gardens were >1000 m2, and four plots of approximately 250 m2 were established on each plantation. Soil samples were collected from each plot in October 2017 and analyzed in 2018 (Figure S1). Sampling was conducted in 10 cm increments at depths of 0–20 cm (topsoil), and in 20 cm increments at depths of 20–60 cm (subsoil). Each composite sample consisted of ten points in each plot, and was completely mixed to form a homogenized sample. The fresh soil samples were passed through a 5 mm sieve, and plant residues, roots, and stones were removed. Then, soil samples were air-dried and passed through a 2 mm sieve for physicochemical analyses [5]. The following soil physicochemical properties were determined: pH, total organic carbon (TOC), total nitrogen (TN), nitrate-nitrogen (NO3-N), ammonia nitrogen (NH4-N), available phosphorus (AP), water content (WC), total phosphorus (TP). Soil properties were quantified at the Institute of Soil Science, Chinese Academy of Sciences (Nanjing, China). Soil NO3 and NH4+ were extracted using 0.1 mol L–1 KCl and measured using continuous flow analysis (TRAACS 2000; Seal Analysis, Mequon, WI, USA). Soil pH was measured in pastes of 1:1 (w/v) soil: distilled water was mixed with an ORION 3 STAR pH meter (Thermo Ltd., Waltham, MA, USA). Soil organic C (SOC) and total soil N concentrations (TN) were measured using a Vario Max CN Analyzer (Elementar Analysensystem GmbH, Langenselbold, Germany). Available phosphorus (AP) and potassium (AK) were extracted using the Mehlich 3 method and measured using inductively coupled plasma atomic emission spectroscopy (ICP-AES) [5].

2.2. Soil Fertility Index Analysis

The soil fertility index (SFI), evaluated based on the soil management assessment framework (SMAF), was used as a quantitative index to evaluate soil fertility as previously described [30]. The SMAF comprises three basic components: indicator selection, indicator interpretation, and integration into a soil quality index value described [30]. Soil pH, SOC, TN, AP, and AK were selected as indicator parameters. After selecting the appropriate parameters, factor analyses were conducted. Communality was explained by each soil parameter based on the load matrix. Each parameter was weighted by the ratio of its communality to the summed communalities of all parameters [31]. Parameters were normalized to values ranging from 0.1 to 1.0 using the standard scoring function method, which contains three types of equations [32]. The “more is better” curve equation was used when the relationship between a parameter and soil fertility was positive. Conversely, when this relationship was negative, we used the “more is worse” curve equation. Finally, the “optimum” curve equation was used in cases where the relationship between the parameter and fertility was positive up to a certain threshold, and negative thereafter. The SFI was calculated as follows:
Soil   fertility   index   ( SFI ) = i = 1 n W i S i
where W is the assigned weight of each parameter, S is the parameter score and n is the number of parameters in the TDS [33]. In the model, a higher index score indicates greater soil fertility; this soil fertility index corresponds to a proxy for fertility. All physicochemical properties and the soil fertility index are given in the Supplement Table S1.

2.3. DNA Amplicon and Illumina Sequencing of Fungal Communities

Total DNA was extracted from a 0.5 g sample of soil with the Fast DNA Spin kit (MP Biomedicals LLC, Santa Ana, CA, USA) according to the manufacturer’s instructions. DNA quality and concentration were detected by a NanoDrop Spectrophotometer (Nano-100, Aosheng Instrument Co., Ltd., Hangzhou, China) to assess absorbance ratios of 260/280 nm (~1.8) and 260/230 nm (>1.7). The broad-spectrum fungal primer set ITS5 (50-GGAAGT AAAAGTCGTAACAAGG-30) and ITS2 (50-GCTGCGTT CTTCATCGATGC-30) with adaptors and barcodes was used to amplify the first internal transcribed spacer (ITS1) region [34]. Amplification was conducted in a total volume of 20 mL using 50 ng DNA, 4 mL HOT MOLPol BlendMaster Mix (Molegene, Butzbach, Germany), and 0.5 mM each of the forward and reverse primers. PCR conditions were 5 min at 95 °C, followed by 35 cycles of 30 s at 95 °C, 30 s at 53 °C, and 50 s at 72 °C. PCR was repeated three times, with an annealing temperature of 53 °C. Final elongation was conducted at 72 °C for 5 min. Amplicons from the five parallel PCR runs (3 × 53 °C) were individually labeled to estimate the effects of annealing temperatures and repeated PCR runs on richness recovery. Purification was achieved using Agencourt AMPure XP SPRI magnetic beads. We normalized PCR products after quantifying them using a Qubit 2.0 Fluorometer (Invitrogen, Carlsbad, CA, USA), and a Qubit dsDNA HS Assay Kit (Invitrogen). Products were pooled following normalization. Paired-end (2 9 250) sequencing was performed on the MiSeq platform (Illumina, San Diego, CA, USA) by Personal Biotechnology (Shanghai, China). Noise reduction was performed using Denoiser 0.851 [35]. Chimeric sequences were detected using UCHIME [36] and deleted. Sequences were shortened to 300 bp, and any sequences shorter than 300 bp were removed. Sequences were independently clustered using USEARCH at 97% similarity. To determine the identity of each remaining sequence, sequence quality was determined and demultiplexed using the denoised data. Then these sequences were clustered into operational taxonomic units (OTUs) using the UPARSE algorithm. The centroid sequence from each cluster was run against either the USEARCH global alignment algorithm or against high-quality sequences derived from the NCBI database [37]. The output was analyzed using an internally developed Python program that assigns taxonomic information to each sequence and then computes and writes the final analysis files. Fungal OTUs were assigned to functional groups by comparison to the FUNGuild 1.0 database [38,39]. Assignment to functional guilds was conducted at the genus level, and only assignments with confidence levels of “highly probable” or “probable” were retained for analyses. Approximately 60% of the OTUs were matched to a functional guild. The relative abundance of each functional group was equal to the sum of the relative abundance of all OTUs in the group [40]. The Shannon diversity of functional groups was calculated using the phyloseq package [41] in R.

2.4. Statistical Analyses

All datasets were rarefied to 6341 per sample, using the “rarefy” function in the R package vegan, to reduce differences in sequencing depth. We calculated OTU richness using the “diversity” function in vegan and standardized richness using the “scale” function. Both the Chao 1 (community richness) and Shannon (community diversity) index were calculated on the rarefied data using MOTHUR [42]. Linear regression analyses were conducted on the relationship between Chao 1/Shannon and the soil fertility index when the Pearson correlations were significant (R v.3.3.3, ‘lm’ function). Community composition was analyzed using global nonmetric multidimensional scaling. Nonmetric multidimensional scaling (NMDS), based on the Bray–Curtis distances of the sequencing data and generated using vegan, was used to assess community composition along with the soil profile, as well as the correlation between community structure and environmental factors (i.e., soil properties, plant richness, and diversity). The relation between the soil microbial community and the soil physicochemical properties was established through a redundancy analysis (RDA) using R. Power, NY, USA), with microbial PLFAs as dependent variables and the measured chemical properties as explanatory variables. The Monte Carlo permutation test was used to investigate the effect of each environmental factor on the microbial community structure changes. A correlation analysis was conducted between fungal diversity (richness) and environmental factors in the whole soil profile and each soil layer using R; this filter standard of OTUs (an occurrence of 80% per sample) reduced the appearance of pseudo correlation and enhanced the accuracy of network structure. Similarity matrices were measured by Spearman correlation coefficients. To compare network topologies, all networks were generated with a similar and appropriate similarity threshold (St = 0.81–0.84), identified based on RMT. All network analyses were performed using the Molecular Ecological Network Analyses (MENA) Pipeline [43]. Networks were visualized using the GEPHI 0.9.2-BETA software. All statistical analyses were conducted in R v.3.4.3.

3. Results

3.1. Soil Fertility Index

The soil fertility index (SFI) and its indicator parameters were varied among the tea gardens with different input levels (Table S1). The lowest SFI (0.171–0.391) were observed in the forest soils, and the SFI increased as the input level increased from low to moderate. While the SFI was similar between the tea gardens with moderate-input and high-input. What’s more, the soil depth was another factor that influenced the SFI. Our results showed that the SFI decreased with increasing the soil depth from 0–10 cm to 10–20, 20–40 and 40–60 cm.

3.2. Fungal Diversity

Average Shannon diversity of fungal communities in the tea gardens ranged from 4.2 to 5.0, and species richness ranged from 1200 to 1500 (Figure 1a,b). Fertility had no significant effects on diversity in the soil profile, either between tea gardens and forests or among fertilizer input levels; however, soil fertility broader the higher fungal diversity and species richness of topsoil (0–20 cm) compared to the subsoil (20–60 cm), with significant higher diversity and richness in high fertility topsoil than in subsoil (p = 0.027 and p = 0.032, respectively, Figure 1a,b). Correlation analyses indicated that soil pH was slightly positively correlated with fungal diversity, while most of the other environmental factors showed no significant effects, but an interactive effect between soil depth and fertility disturb these correlations (Figure 1c). When separating the effects of environmental factors into soil layers, the correlation results indicated that soil diversity was positively correlated with soil pH in 0–10 cm, slightly positively correlated with soil K, Ca and Mg within 10–40 cm, and significantly positively correlated with soil P in 40–60 cm (Figure S2a–d). In the topsoil (0–10 cm), fungal diversity increased with SFI (r = 0.49, p = 0.05). Diversity was similar under different fertilizer inputs at depths of 10–20 cm and 40–60 cm (r = 0.12, p = 0.66, r = 0.27, p = 0.32). In contrast to topsoil, diversity at 20–40 cm was negatively associated with SFI (r = 0.23, p = 0.04) (Figure 1d).

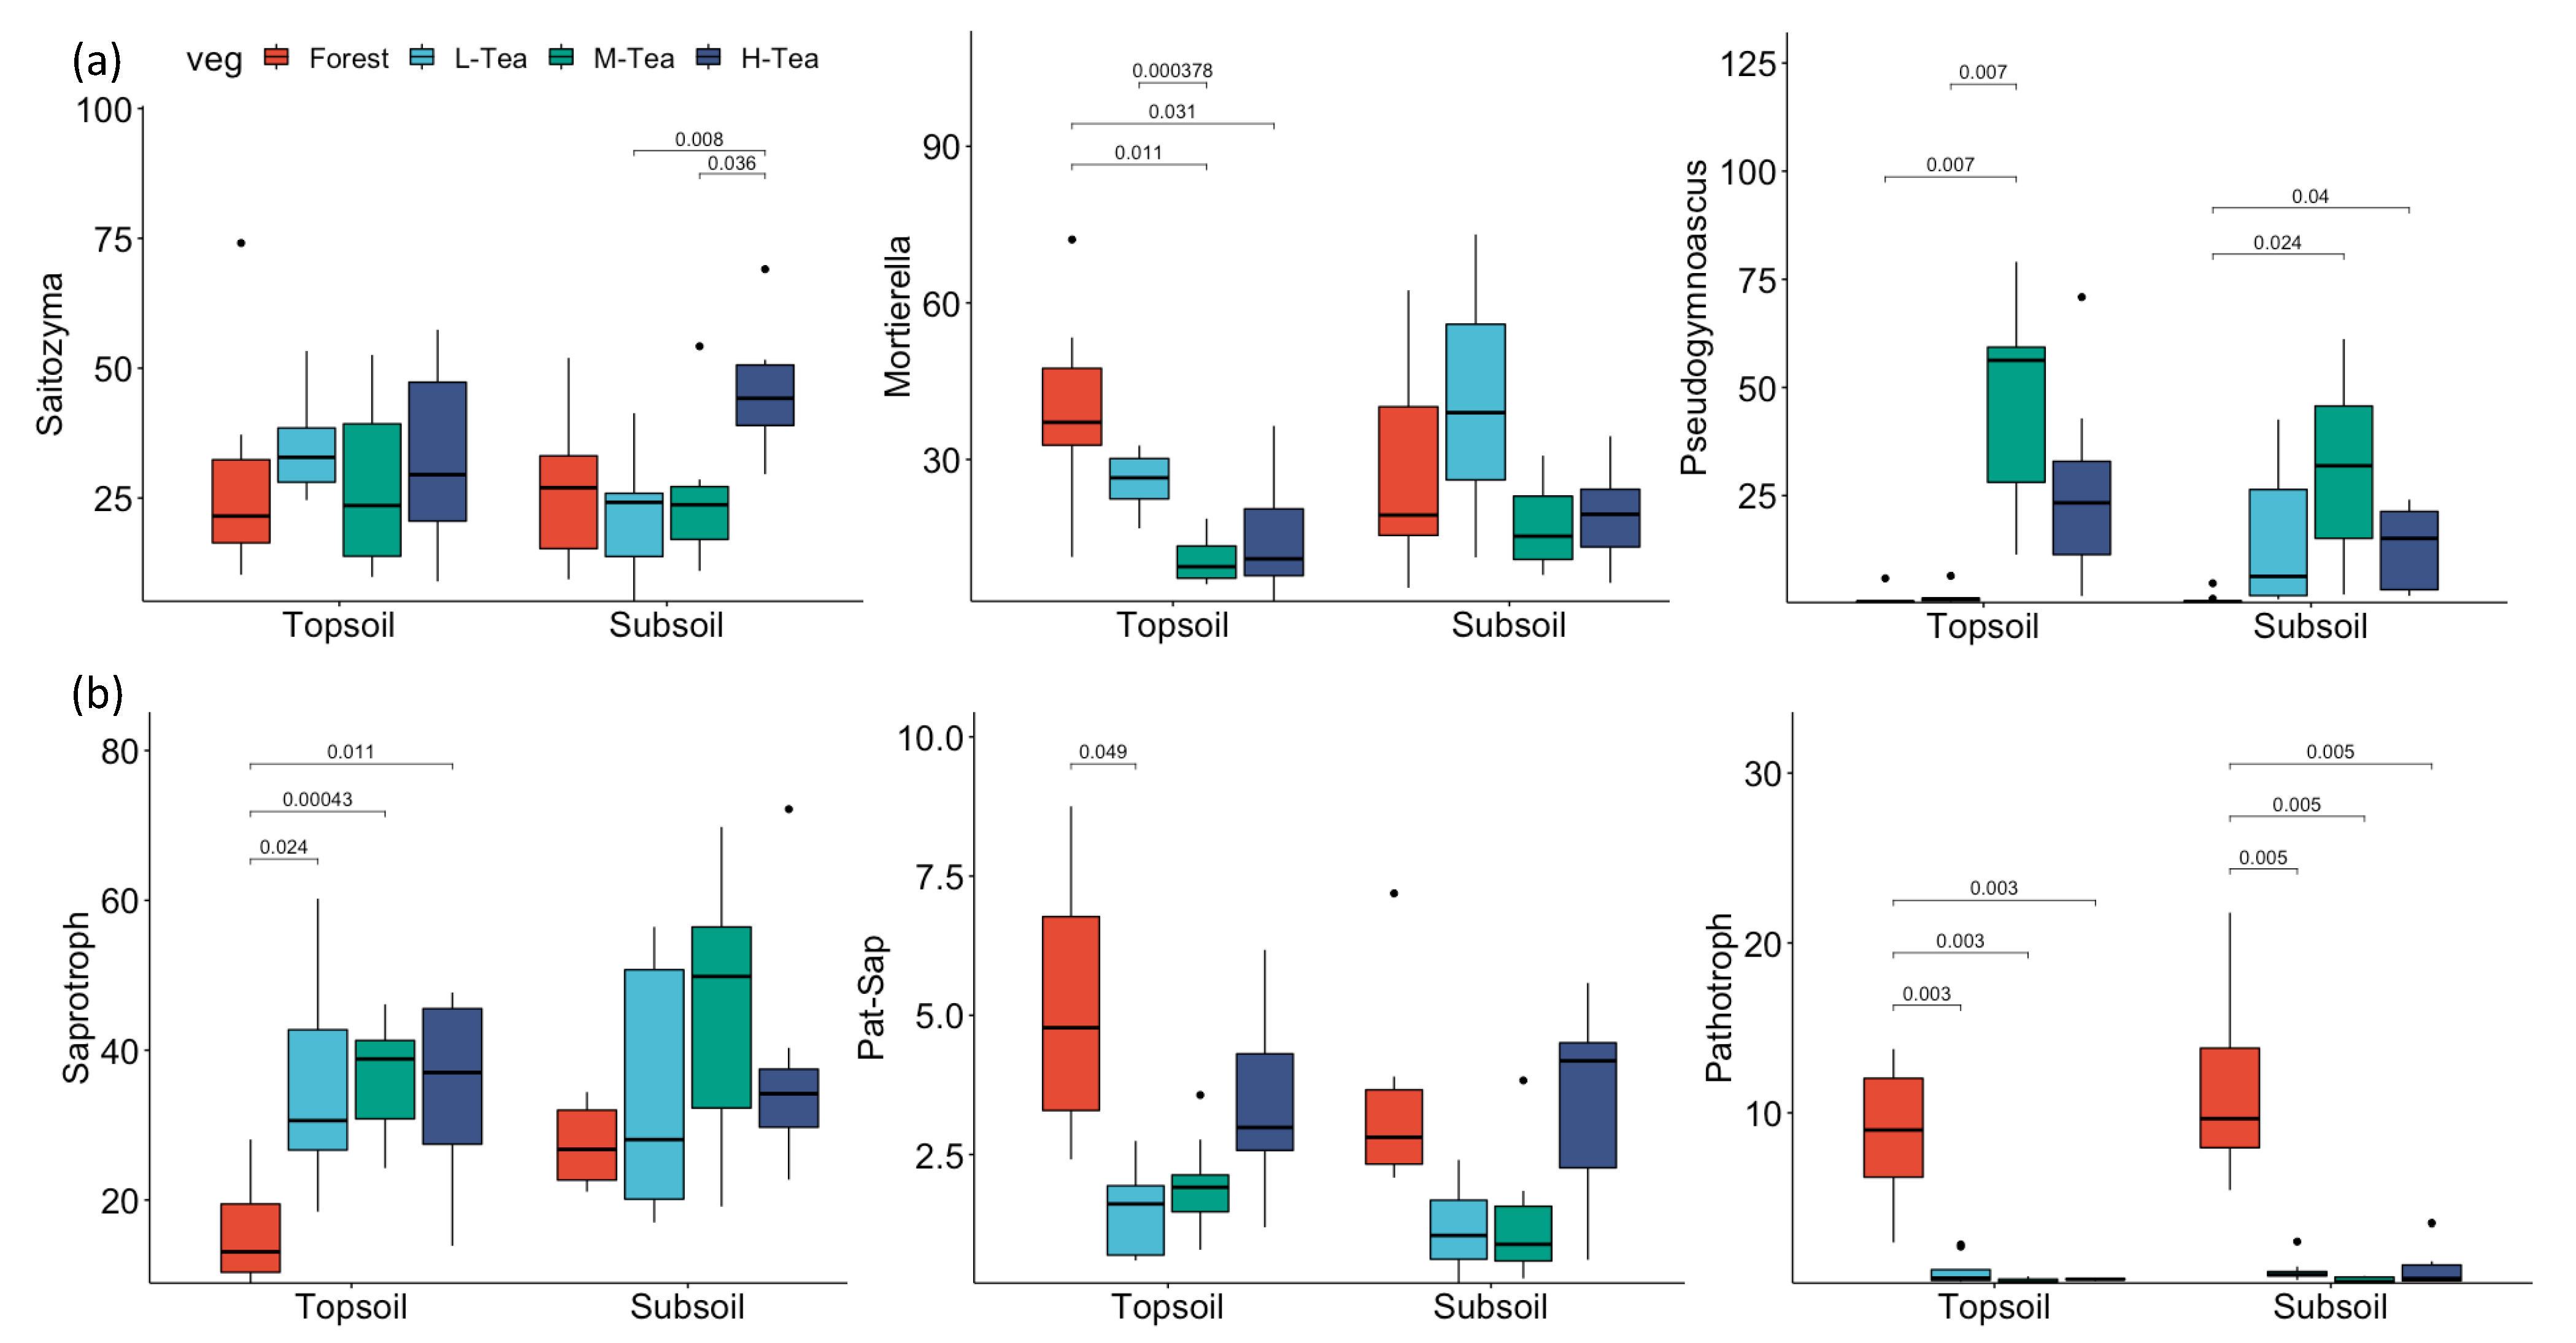
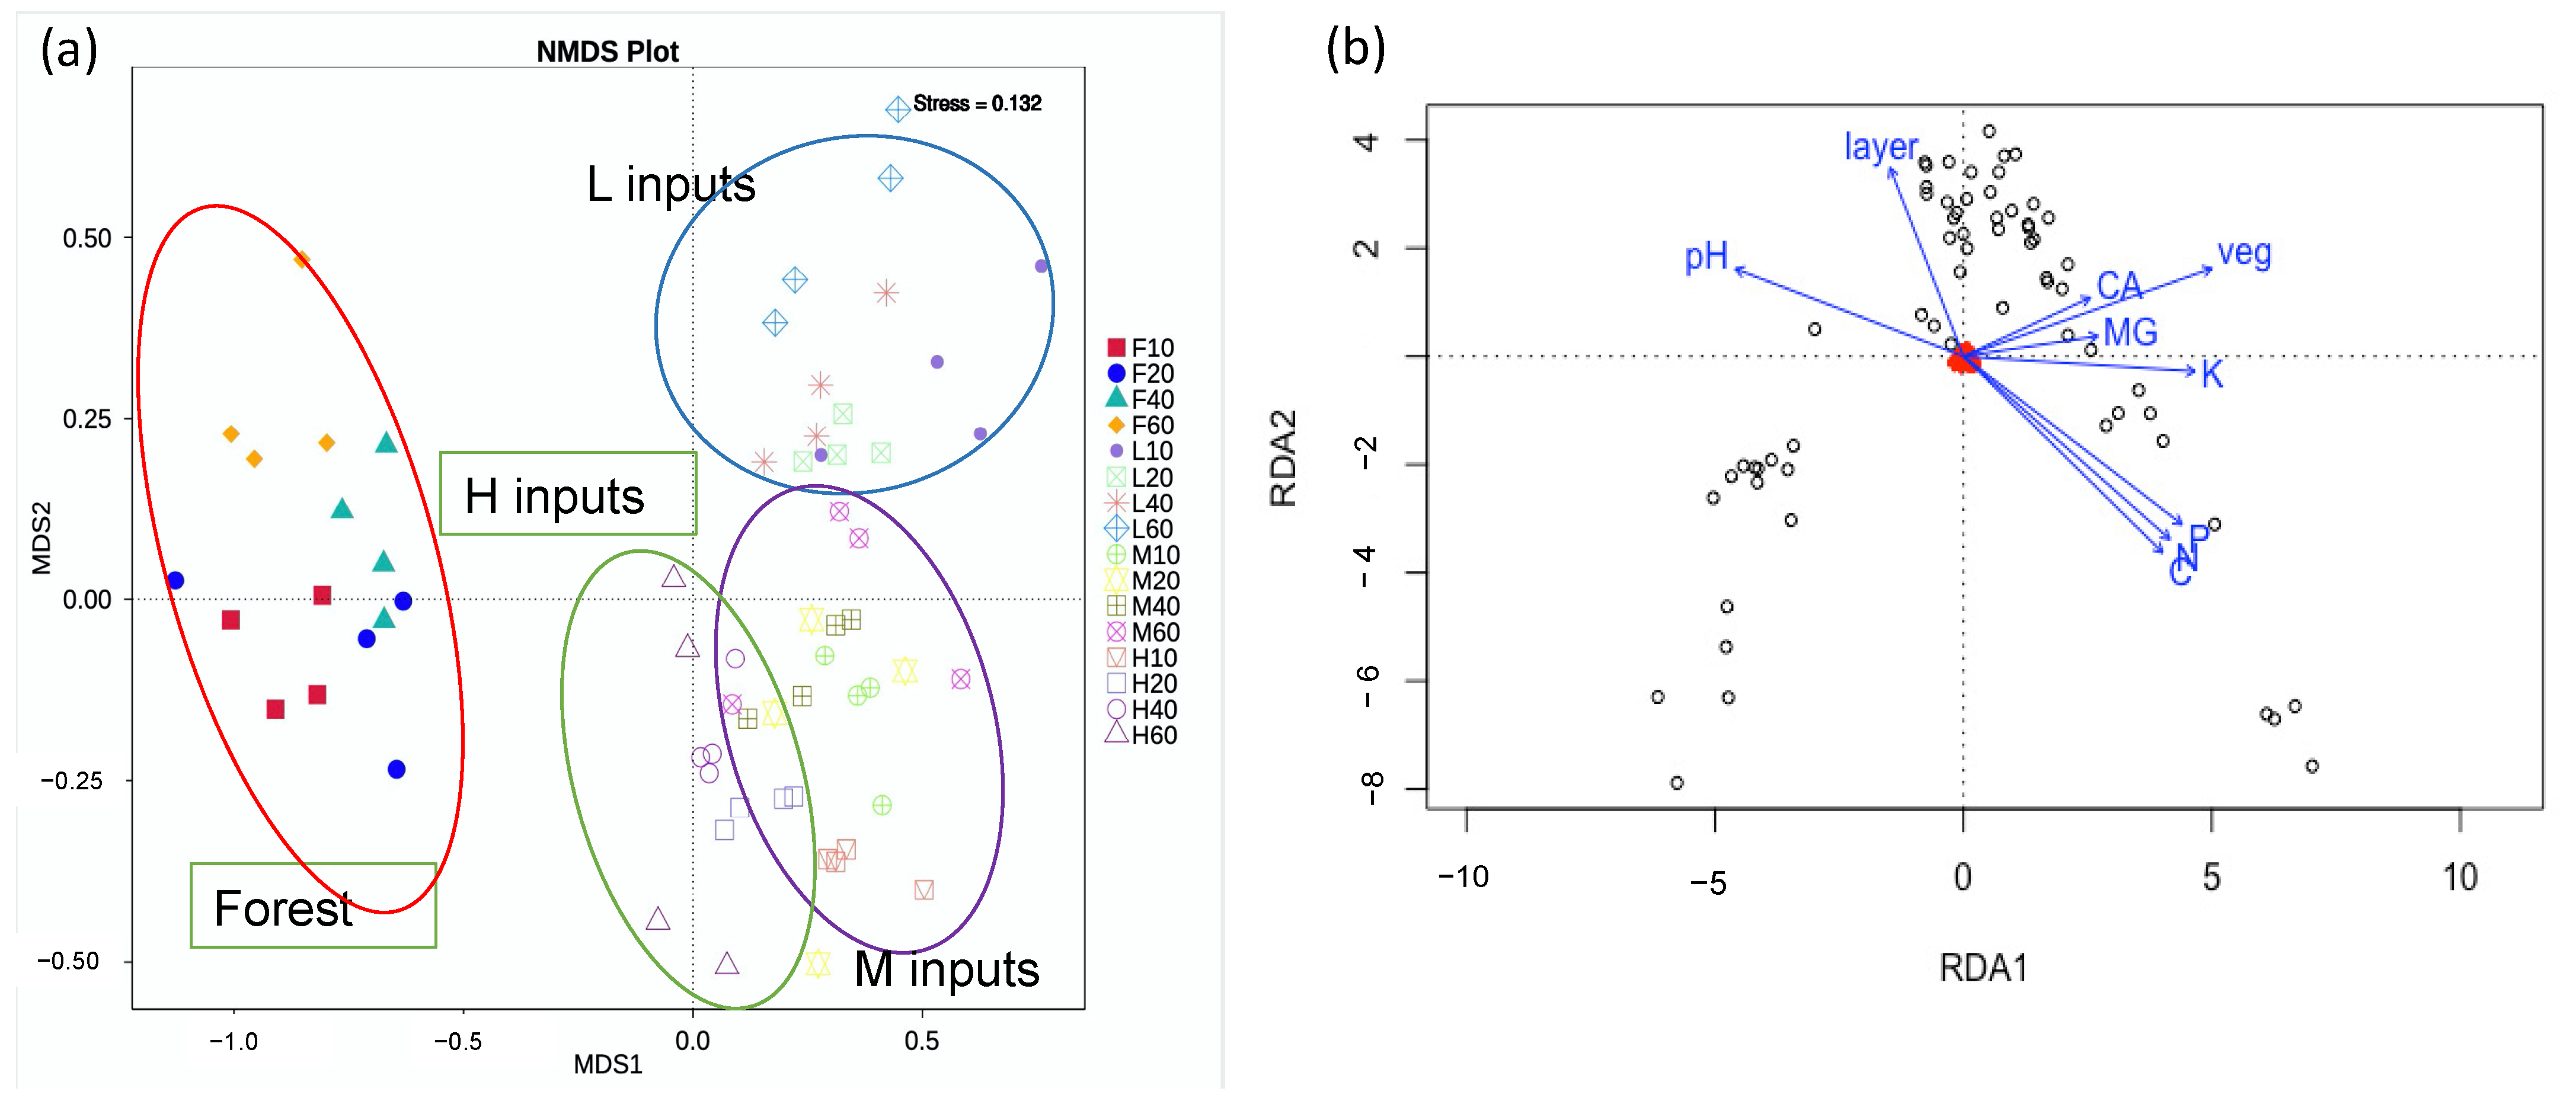
3.3. Fungal Community Composition

At the genus level, soil fungal communities consisted primarily of taxa in the class Saitozyma, which accounted for an average relative abundance of 30% of the sequences from the soils, followed by Mortierella (20%) and Pseudogymnoascus (10%) (Figure 2a). The relative abundance of Pseudogymnoascus and Umbelopsis increased in plantation soils compared to forest soils, whereas Solicoccozyma and Trichoderma had higher relative abundance in the forest (Figure 2a). In particular, the relative abundance of Pseudogymnoascus in the plantations was higher under moderate and high fertilizer inputs, while Mortierella exhibited the opposite pattern (Figure 2a). In contrast to the dominant fungal groups, the richness of minor groups (accounting for approximately 20% of the total fungal community) increased in the subsoils, particularly under higher fertilizer inputs (Figure 2a). Heat map analyses were used to determine whether fungal species increased or decreased between land-use types and fertility (Figure S3). The fungal community in forest sites was dominated by Mortierella, whereas plantation soils were dominated by Leucoosporidum (Figure S3). Among samples from all sites, abundant fungal groups (shown in deep red) commonly occurred in topsoil (0–20 cm) and varied with fertilizer input level but did not exhibit general patterns (Figure S3). For example, Richenella and Fusarium dominated in low input soils, Phoma in moderate input soils, and Oidoma in the highest input soils. Genetic distances indicate that as fertilizer inputs increase, fungal communities in the plantations approach those of the forest soils (Figure S3). NMDS ordination plots based on the Bray–Curtis distance metric showed that community composition differed significantly among fertilizer input treatments (Bray–Curtis dissimilarity: PERMANOVA: R2 = 0.51, p = 0.001) (Figure 3a,b). Soil chemical properties (fertilizer effects) explained approximately 40% of the variation in fungal community composition, while vegetation and soil layers explained an additional 10%, but the interactions between the two factors explained more than 50% of the fungal variation (Figure 3b). Model selection indicated that fertilizer, soil layer, C, P, and N produced the best model (AIC = 814.3 p = 0.001) (Table 1).

3.4. Functional Guild Composition

Concerning the functional guilds identified by comparison to FUNGuild, ectomycorrhizal fungi, endophytic fungi, plant pathogens, soil saprotrophs, and animal and fungal parasites accounted for approximately 40% of the sequences, whereas the function of the other 60% was unclear. Soil saprotrophs and parasites were the dominant functional groups, accounting for approximately 10%, and 15% of the total fungal community (Figure 2b). The relative abundance of soil saprotrophs increased with fertilizer inputs throughout the soil profile, particularly at depths of 0–10 cm (topsoil) and 20–40 cm (subsoil) (Figure 2b). Most of these additional saprotrophs represented saprotrophs that also exhibit pathogenic traits (Figure S4). Clavarioids and Gasteroids were enriched in moderate fertilizer input plots (Figure S4). Microfungus yeasts were dominant in low input plots (Figure S4), and facultative yeast microfungi were commonly found in higher input plots (Figure S4). Plant pathogens were distributed in deeper layers (40–60 cm) and increased slightly with increased fertilizer inputs (Figure S4).

3.5. Fungal Co-Occurrence Networks

Co-occurrence network analyses suggested that fertilizer inputs simplified the soil fungal network structure in deeper soil layers. By contrast, no significant differences were found among layers within fertility treatments. High network complexity was observed at depths of 0–10 cm, reflecting increased niche links (Figure 4) and indicating that the input treatments underlie the higher network complexity observed at these depths. Conversely, networks were much simpler in deeper soil layers within input treatments. Samples collected at depths of 10–20 cm and 20–40 cm were similar with respect to network connections (Figure 4). The deepest layer (40–60 cm) had fewer interactions than shallower soil layers (0–40 cm) (Figure 4). Complex networks suggest that most microbial species share similar ecological niches, which are shaped by environmental factors. Simple networks, by contrast, suggest that microbial species have variable ecological niches that are shaped by microbial interactions.

4. Discussion

4.1. Fertilizer Influences Soil Fungal Diversity and Richness in the Tea Garden

The effects of fertilization practices on soil biological ecological functions are of great importance for agricultural sustainability. The response of soil microbiota in topsoil to fertilization has been illustrated in previous studies [23]. The results of this study revealed that the vertical distribution of the soil fungi response is different from the soil fertility index (SFI), with higher diversity with increasing fertility in topsoil but a contrast pattern in the subsoil. Under high fertility conduction, more fungal species appeared in topsoil, while some fungal species were lost in the subsoil. Soil fertilization played as critical substrate for microorganisms, being indispensable for most microorganism components, such as the cyto-membrane, proteins, and nucleic acids; they are also the energy source of many types of microorganisms [44]. The previous study has demonstrated that fungal community succession is closely correlated with their substrate quality and quantity [45]. The higher soil nutrient level in topsoil, results in enrichment for available C and N, proved more ecological niches for soil fungal species coexisting, which contribute to higher fungal richness and diversity in the topsoil (Figure S5). In contrast, fertilizer conduction did not significantly change soil C and nutrients in subsoil (especially for 40–60 cm), therefore, a few selected fungal species, which can use plant root C input, such as, root endophytes and mycorrhizae, dominated in subsoils. For example, topsoil harbored a higher proportion of Umbelopsis, most of which were found to grow rapidly in high nutrient conditions. In contrast, Trichoderma, which was enriched in the subsoil, has the potential to utilize root exudates and SOM can be distributed in the deep subsurface [46,47]. It is supposed that fungi in subsoil were more correlated with plant C belowground allocation rather than direct effects from fertilization [48]). Fertilization showed negative effects on plant-associated mycorrhizal fungal diversity due to limiting plant C allocation for N mining [49]. Ji et al. (2020) investigated fungal diversity in tea gardens across China, similar to our study, and suggested that fertilizer inputs significantly increase fungal diversity in topsoil [6]. Therefore, plant C allocation and soil environmental conditions critically impact substrate availability and utilization for fungal species in subsoils [48]. Fertilization reduces plant C allocation, consequently reducing mycorrhizal fungi in agricultural areas [50].

4.2. Fertilizer Influences Soil Fungal Comunitity Stucture and Functional Guilds in the Tea Garden

The profound effects of fertilization on soil microbial diversity, biomass, and functions in the topsoil have been revealed in numerous studies [25,51,52,53]. Fusarium, a large genus of filamentous fungi, commonly found as saprotrophic decomposer, which predominated in low fertilizer input soils. With the increase of fertilizer, Phoma and Oidoma fungi, known as plant pathogenic fungi, turn out to be dominate in our study; this shift pattern can be explained by additional available C from fertilization releasing the C limitations for pathogenic fungi, which usually have low decomposition ability but have an advantage in fast growth when meet available C. Similar patterns were also found in studies of changes plant diversity or increased litter inputs [48]. Additionally, the changes of the fungal community could also be due to the reduced of soil pH after fertilization, which is not favor by most of the saprotrophic decomposer, due to the limitation in their enzyme activities under low pH environment. In this study, we illustrated that fertilization also changed the fungal communities in the subsoil; however, the response of fungi appeared to be opposite to that of topsoil, which could be explained by the disturbance of fertilization affecting different on topsoil and subsoil. Most soil properties in topsoil, including pH, TN, SOC, AP, and AK, were greatly altered by fertilization, but in subsoil, they showed a reduced impact (Table S1); however, the changes in ecological functions in subsoil under environmental disturbance should not be neglected. Here, we found that both land-use change, and fertilization altered the dominant soil fungi, not only at the species level but also with respect to functional guilds. When forests are converted into tea gardens, the primary change in fungal groups is the loss of root symbionts of woody plants. The development of tea gardens is associated with reduced litter inputs and increased fertilization, which mostly affect saprotrophic fungi (Figure 2). The loss of mycorrhizal fungal diversity was a result of losses of host-specific taxa due to declines in plant diversity [54]. Mycorrhizal fungi in the tea gardens also declined slightly with fertilization, which may be the result of changes in plant C allocation [48]. Tea gardens in the study area were established on forest soils, and whereas land-use changes involve significant losses of plant diversity, soil physical and chemical properties remain relatively unchanged by fertilization [23]; however, high levels of fertilization increase differences between topsoil and subsoil fungi. In addition, it appears that high inputs shift the fungal community from recalcitrant C decomposers toward labile C decomposers [55]. Laboratory experiments have shown that labile C inputs reduce the efficiency of microbial C use and simplify community composition [56]. With the loss of mycorrhizal fungi in the subsoil following fertilization, some saprotrophic opportunities disappear due to additional substrate availability from decomposition processes in topsoil [57]; however, these species still comprise a small fraction of the total fungal community.

4.3. Soil Fungal Vertical Networks Complexity Varied along Soil Depths

By contrast, the fungal community in topsoil 0–20 cm had the highest microbial network complexity among all layers (Figure 4), indicating the important role of fertility in driving the fungal community assembly process in the soil below the top- and subsoil layer (Table 1). Two theories have been proposed to explain soil fungal assembly processes under natural conditions: ecological niche selection and neutral theory. Initial processes generally result in simpler co-occurrence networks, while later processes promote complex networks [58]. With increased fertilization, the fungal community exhibited more complex interactions in the topsoil, but fewer interactions in subsoils (Figure 4). The complex interactions suggest that a dominant environmental factor was limiting the niches of fungal species; in our study, this factor was fertilizer inputs. Fertilizer inputs created new niches with respect to nutrients and C conditions, as suggested in several studies [59]. In the topsoil, fertilization pushed fungal community assembly processes toward more connectivity and increasingly complex interactions, suggesting that the available C in fertilizer may act as an important regulator, as proposed in previous studies [60]. In contrast to patterns in the topsoil, assembly processes in the subsoil responded to fertilization by shifting toward decreased and fewer connections, suggesting that they were driven by microbial interactions rather than environmental stress [61]; these microbial interactions are located among mycorrhizal fungi, saprotrophic fungi, and pathogenetic fungi due to their substrate’s competition.

4.4. Soil Properties Correlated with Soil Fungal Diversity Varied along Soil Depths

Soil microbes are sensitive to soil property changes; here, we found that the correlations between fungal community and soil properties were disparate along with the soil depth. In surface soil, the fungal diversity was mostly correlated with pH, whereas in the soil below 10 cm, it showed an increased correlation with SFI. Additionally, in the deeper soil layer (40–60 cm), soil P concentration is represented as a driver of fungal diversity (Figures S2 and S3). These differences indicated different contributions of soil factors in structuring the fungal community, and different mechanisms of fungal community assembly in topsoil and subsoil. pH is considered an important factor in structuring bacterial communities [62,63,64]. Chemical fertilization mostly impacts the soil fungal community by decreasing the soil pH, as these fertilizers, especially nitrogen fertilizers, cause significant acidification in many croplands [25]; however, pH showed little variation among the soil layers, even though lower pH was also found in fertilized 0–10 cm soil. Additionally, we observed higher AP, and AK levels in the subsoils of fertilized soil, which might be due to the leaching of fertility on the topsoils (Figure S4). The influences of soil P on fungal diversity in subsoil have been demonstrated in previous studies [65,66], which might be due to the predominate mycorrhizal fungi in this soil layer [46].

5. Conclusions

The study in the tea garden revealed that the soil fungal community of the top- and subsoils presented a reverse response to fertilize. With increase of fertilize conduction, a increase of fungal diversity was found in topsoil, while a reduce of fungal diversity was found in subsoil. Besides, soil fungal community composition and network structure were correlated variable soil properties along soil profiles, such as soil pH was significantly reduced with increased soil fertility of topsoil compared to the subsoil. Soil fungal communities generally present high vertical heterogeneity and present variable functions to mediate the biochemical process along between plant roots and soil profile. The observation of fungi responses to fertilize varied with top- and subsoils has been generally ignored previously, but it reveals the potential activated subsoil microbial processes under fertilization. Due large C storage in subsoil, a better understanding of the underlying relationship between microbial activities and agriculture management requires further research.

Supplementary Materials

The following supporting information can be downloaded at: https://www.mdpi.com/article/10.3390/agronomy12081751/s1, Figure S1: The location (120°10′ E, 30°10′ N) and plot set up for tea gardens with low-, medium-, high-input levels, and the adjacent forest. Figure S2: Correlations between soil properties and fungal diversity along the tea soil layers (a) 0–10 cm (b) 10–20 cm (c) 20–40 cm (d) 40–60 cm under fertilizer inputs. Figure S3: The relative abundances of top 20 abundant fungal genus and heatmap analysis of fungal composition. For: forest; L: low fertility tea garden; M: Middle fertility tea garden; H: High fertility tea garden; top: topsoil (0–20 cm); sub: subsoil (20–60 cm). Figure S4: fungal traits in tea garden in different soil layers under high, low and middle fertilizer inputs. For: forest; L: low fertility tea garden; M: Middle fertility tea garden; H: High fertility tea garden; top: topsoil (0–20 cm); sub: subsoil (20–60 cm). Figure S5: Changes of soil properties along soil profiles in studying sites. veg: vegetation types. F: forest; L: low fertility tea garden; M: Middle fertility tea garden; H: High fertility tea garden. Table S1: All physicochemical properties and the soil fertility index of tea gardens and forest in the 0−10, 10–20, 20–40 and 40−60 cm soil depth (mean ± standard error).

Author Contributions

Conceptualization, P.Y., J.F. and W.H.; methodology, C.D.; software, L.S.; validation, L.Z. (Liping Zhang) and L.F.; formal analysis, and C.S.; investigation, L.Z. (Lan Zhang); resources, X.L.; data curation, L.S.; writing—original draft preparation, L.S.; writing—review and editing, P.Y. and L.S.; visualization, Z.Z.; supervision, J.F. and W.H.; project administration, Z.Z.; funding acquisition, P.Y. All authors have read and agreed to the published version of the manuscript.

Funding

The National Natural Science Foundation of China (42007096), P.Y. The National Key R and D Program of China (2020YFD1000701), P.Y.

Institutional Review Board Statement

Not applicable.

Informed Consent Statement

Not applicable.

Data Availability Statement

Not applicable.

Acknowledgments

This work was financially supported by the Science and Technology Innovation Project of the Chinese Academy of Agricultural Sciences (CAAS-ASTIP-2014-TRICAAS).

Conflicts of Interest

The authors declare no conflict of interest.

References

  1. Liu, Z.; Yuan, Y.; Zhang, Y.; Shi, Y.; Hu, G.; Zhu, J.; Rogers, K.M. Geographical traceability of Chinese green tea using stable isotope and multi-element chemometrics. Rapid Commun. Mass Spectrom. 2019, 33, 778–788. [Google Scholar] [CrossRef] [PubMed]
  2. Xu, G.; Liu, Y.; Long, Z.; Hu, S.; Zhang, Y.; Jiang, H. Effects of exotic plantation forests on soil edaphon and organic matter fractions. Sci. Total Environ. 2018, 626, 59–68. [Google Scholar] [CrossRef] [PubMed]
  3. Ruan, J.; Haerdter, R.; Gerendás, J. Impact of nitrogen supply on carbon/nitrogen allocation: A case study on amino acids and catechins in green tea [Camellia sinensis (L.) O. Kuntze] plants. Plant Biol. 2010, 12, 724–734. [Google Scholar] [CrossRef]
  4. Han, B.; Zhang, Q.-H.; Byers, J.A. Attraction of the tea aphid, Toxoptera aurantii, to combinations of volatiles and colors related to tea plants. Èntomol. Exp. Appl. 2012, 144, 258–269. [Google Scholar] [CrossRef]
  5. Yan, P.; Shen, C.; Fan, L.; Li, X.; Zhang, L.; Zhang, L.; Han, W. Tea planting affects soil acidification and nitrogen and phosphorus distribution in soil. Agric. Ecosyst. Environ. 2018, 254, 20–25. [Google Scholar] [CrossRef]
  6. Ji, L.; Ni, K.; Wu, Z.; Zhang, J.; Yi, X.; Yang, X.; Ling, N.; You, Z.; Guo, S.; Ruan, J. Effect of organic substitution rates on soil quality and fungal community composition in a tea plantation with long-term fertilization. Biol. Fertil. Soils 2020, 56, 633–646. [Google Scholar] [CrossRef]
  7. Zhang, C.; Zhang, X.; Kuzyakov, Y.; Wang, H.; Fu, X.; Yang, Y.; Chen, F.; Dungait, J.A.; Green, S.M.; Fang, X. Responses of C-, N- and P-acquiring hydrolases to P and N fertilizers in a subtropical Chinese fir plantation depend on soil depth. Appl. Soil Ecol. 2019, 150, 103465. [Google Scholar] [CrossRef]
  8. Chen, W.-C.; Ko, C.-H.; Su, Y.-S.; Lai, W.-A.; Shen, F.-T. Metabolic potential and community structure of bacteria in an organic tea plantation. Appl. Soil Ecol. 2020, 157, 103762. [Google Scholar] [CrossRef]
  9. Van Der Putten, W.H.; Bardgett, R.D.; Bever, J.D.; Bezemer, M.; Casper, B.B.; Fukami, T.; Kardol, P.; Klironomos, J.N.; Kulmatiski, A.; Schweitzer, J.A.; et al. Plant-soil feedbacks: The past, the present and future challenges. J. Ecol. 2013, 101, 265–276. [Google Scholar] [CrossRef]
  10. Tedersoo, L.; Bahram, M.; Põlme, S.; Kõljalg, U.; Yorou, N.S.; Wijesundera, R.; Ruiz, L.V.; Vasco-Palacios, A.M.; Thu, P.Q.; Suija, A.; et al. Global diversity and geography of soil fungi. Science 2014, 346, 1256688. [Google Scholar] [CrossRef] [Green Version]
  11. Rousk, J.; Brookes, P.C.; Bååth, E. Contrasting Soil pH Effects on Fungal and Bacterial Growth Suggest Functional Redundancy in Carbon Mineralization. Appl. Environ. Microbiol. 2009, 75, 1589–1596. [Google Scholar] [CrossRef] [PubMed] [Green Version]
  12. Bonfante, P. The future has roots in the past: The ideas and scientists that shaped mycorrhizal research. New Phytol. 2018, 220, 982–995. [Google Scholar] [CrossRef] [PubMed] [Green Version]
  13. Guenet, B.; Lenhart, K.; Leloup, J.; Giusti-Miller, S.; Pouteau, V.; Mora, P.; Nunan, N.; Abbadie, L. The impact of long-term CO2 enrichment and moisture levels on soil microbial community structure and enzyme activities. Geoderma 2012, 170, 331–336. [Google Scholar] [CrossRef]
  14. Huang, Y.; Guenet, B.; Ciais, P.; Janssens, I.A.; Soong, J.L.; Wang, Y.; Goll, D.; Blagodatskaya, E.; Huang, Y. ORCHIMIC (v1.0), a microbe-mediated model for soil organic matter decomposition. Geosci. Model Dev. 2018, 11, 2111–2138. [Google Scholar] [CrossRef] [Green Version]
  15. Sun, H.Y.; Koal, P.; Gerl, G.; Schroll, R.; Joergensen, R.G.; Munch, J.C. Response of water extractable organic matter and its fluorescence fractions to organic farming and tree species in poplar and robinia-based alley cropping agroforestry systems. Geoderma 2016, 290, 83–90. [Google Scholar] [CrossRef] [Green Version]
  16. Högberg, M.N.; Blaško, R.; Bach, L.H.; Hasselquist, N.J.; Egnell, G.; Näsholm, T.; Högberg, P. The return of an experimentally N-saturated boreal forest to an N-limited state: Observations on the soil microbial community structure, biotic N retention capacity and gross N mineralisation. Plant Soil 2014, 381, 45–60. [Google Scholar] [CrossRef] [Green Version]
  17. Cira, N.J.; Pearce, M.T.; Quake, S.R. Neutral and selective dynamics in a synthetic microbial community. Proc. Natl. Acad. Sci. USA 2018, 115, E9842–E9848. [Google Scholar] [CrossRef] [Green Version]
  18. O’Malley, M.A. Everything is everywhere: But the environment selects’: Ubiquitous distribution and ecological determinism in microbial biogeography. Stud. Hist. Philos. Sci. Part C Stud. Hist. Philos. Biol. Biomed. Sci. 2008, 39, 314–325. [Google Scholar] [CrossRef]
  19. Dumbrell, A.J.; Nelson, M.; Helgason, T.; Dytham, C.; Fitter, A.H. Relative roles of niche and neutral processes in structuring a soil microbial community. ISME J. 2009, 4, 337–345. [Google Scholar] [CrossRef] [Green Version]
  20. Berry, D.; Widder, S. Deciphering microbial interactions and detecting keystone species with co-occurrence networks. Front. Microbiol. 2014, 5, 219. [Google Scholar] [CrossRef] [Green Version]
  21. Banerjee, S.; Baah-Acheamfour, M.; Carlyle, C.N.; Bissett, A.; Richardson, A.E.; Siddique, T.; Bork, E.W.; Chang, S.X. Determinants of bacterial communities in Canadian agroforestry systems. Environ. Microbiol. 2015, 18, 1805–1816. [Google Scholar] [CrossRef] [PubMed]
  22. Layeghifard, M.; Hwang, D.M.; Guttman, D.S. Disentangling Interactions in the Microbiome: A Network Perspective. Trends Microbiol. 2016, 25, 217–228. [Google Scholar] [CrossRef] [PubMed]
  23. Gu, S.; Hu, Q.; Cheng, Y.; Bai, L.; Liu, Z.; Xiao, W.; Gong, Z.; Wu, Y.; Feng, K.; Deng, Y.; et al. Application of organic fertilizer improves microbial community diversity and alters microbial network structure in tea (Camellia sinensis) plantation soils. Soil Tillage Res. 2019, 195, 104356. [Google Scholar] [CrossRef]
  24. Li, J.; Li, C.; Kou, Y.; Yao, M.; He, Z.; Li, X. Distinct mechanisms shape soil bacterial and fungal co-occurrence networks in a mountain ecosystem. FEMS Microbiol. Ecol. 2020, 96, fiaa030. [Google Scholar] [CrossRef]
  25. Guo, S.; Xu, Y.; He, C.; Wu, S.; Ren, C.; Han, X.; Feng, Y.; Ren, G.; Yang, G. Differential responses of soil quality in revegetation types to precipitation gradients on the Loess Plateau. Agric. For. Meteorol. 2019, 276–277, 107622. [Google Scholar] [CrossRef]
  26. Fontaine, S.; Henault, C.; Aamor, A.; Bdioui, N.; Bloor, J.; Maire, V.; Mary, B.; Revaillot, S.; Maron, P. Fungi mediate long term sequestration of carbon and nitrogen in soil through their priming effect. Soil Biol. Biochem. 2011, 43, 86–96. [Google Scholar] [CrossRef]
  27. Geisseler, D.; Scow, K.M. Long-term effects of mineral fertilizers on soil microorganisms—A review. Soil Biol. Biochem. 2014, 75, 54–63. [Google Scholar] [CrossRef]
  28. Chang, C.-H.; Szlavecz, K.; Buyer, J.S. Species-specific effects of earthworms on microbial communities and the fate of litter-derived carbon. Soil Biol. Biochem. 2016, 100, 129–139. [Google Scholar] [CrossRef] [Green Version]
  29. Li, R.; Tun, H.M.; Jahan, M.; Zhang, Z.; Kumar, A.; Fernando, W.G.D.; Farenhorst, A.; Khafipour, E. Comparison of DNA-, PMA-, and RNA-based 16S rRNA Illumina sequencing for detection of live bacteria in water. Sci. Rep. 2017, 7, 5752. [Google Scholar] [CrossRef] [Green Version]
  30. Andrews, S.S.; Karlen, D.L.; Cambardella, C.A. The soil management assessment framework: A quantitative soil quality evaluation method. Soil Sci. Soc. Am. J. 2004, 68, 1945–1962. [Google Scholar] [CrossRef]
  31. Shukla, M.K.; Lal, R.; Ebinger, M. Determining soil quality indicators by factor analysis. Soil Till. Res. 2006, 87, 194–204. [Google Scholar] [CrossRef]
  32. Karlen, D.L.; Ditzler, C.A.; Andrews, S.S. Soil quality: Why and how? Geoderma 2003, 114, 145–156. [Google Scholar] [CrossRef]
  33. Shang, Q.; Ling, N.; Feng, X.; Yang, X.; Wu, P.; Zou, J.; Shen, Q.; Guo, S. Soil fertility and its significance to crop productivity and sustainability in typical agroecosystem: A summary of long-term fertilizer experiments in China. Plant Soil 2014, 381, 13–23. [Google Scholar] [CrossRef]
  34. White, T.J.; Bruns, T.; Lee, S.; Taylor, J.; Innis, M.A.; Gelfand, D.H.; Sninsky, J. Amplification and Direct Sequencing of Fungal Ribosomal Rna Genes for Phylogenetics. In PCR Protocols; Academic Press: Cambridge, MA, USA, 1990; pp. 315–322. [Google Scholar]
  35. Reeder, J.; Knight, R. Rapidly denoising pyrosequencing amplicon reads by exploiting rank-abundance distributions. Nat. Methods 2010, 7, 668–669. [Google Scholar] [CrossRef] [PubMed]
  36. Edgar, R.C. Search and clustering orders of magnitude faster than BLAST. Bioinformatics 2010, 26, 2460–2461. [Google Scholar] [CrossRef] [PubMed] [Green Version]
  37. Pruitt, K.D.; Brown, G.R.; Hiatt, S.M.; Thibaud-Nissen, F.; Astashyn, A.; Ermolaeva, O.; Farrell, C.M.; Hart, J.; Landrum, M.J.; McGarvey, K.M.; et al. RefSeq: An update on mammalian reference sequences. Nucleic Acids Res. 2013, 42, D756–D763. [Google Scholar] [CrossRef]
  38. Nguyen, N.H.; Williams, L.J.; Vincent, J.B.; Stefanski, A.; Cavender-Bares, J.; Messier, C.; Paquette, A.; Gravel, D.; Reich, P.; Kennedy, P.G. Ectomycorrhizal fungal diversity and saprotrophic fungal diversity are linked to different tree community attributes in a field-based tree experiment. Mol. Ecol. 2016, 25, 4032–4046. [Google Scholar] [CrossRef]
  39. Yang, X.; Yu, H.; Zhang, T.; Guo, J.; Zhang, X. Arbuscular Mycorrhizal Fungi Improve the Antioxidative Response and the Seed Production of Suaedoideae Species Suaeda physophora Pall Under Salt Stress. Not. Bot. Horti Agrobot. Cluj-Napoca 2016, 44, 533–540. [Google Scholar] [CrossRef] [Green Version]
  40. Delgado-Baquerizo, M.; Fry, E.L.; Eldridge, D.J.; de Vries, F.T.; Manning, P.; Hamonts, K.; Kattge, J.; Boenisch, G.; Singh, B.K.; Bardgett, R.D. Plant attributes explain the distribution of soil microbial communities in two contrasting regions of the globe. New Phytol. 2018, 219, 574–587. [Google Scholar] [CrossRef] [Green Version]
  41. McMurdie, P.J.; Holmes, S. phyloseq: An R package for reproducible interactive analysis and graphics of microbiome census data. PLoS ONE 2013, 8, e61217. [Google Scholar] [CrossRef] [Green Version]
  42. Schloss, P.D.; Westcott, S.L.; Ryabin, T.; Hall, J.R.; Hartmann, M.; Hollister, E.B.; Lesniewski, R.A.; Oakley, B.B.; Parks, D.H.; Robinson, C.J.; et al. Introducing mothur: Open-source, platform-independent, community-supported software for describing and comparing microbial communities. Appl. Environ. Microbiol. 2009, 75, 7537–7541. [Google Scholar] [CrossRef] [PubMed] [Green Version]
  43. Available online: http://ieg4.rccc.ou.edu/mena (accessed on 16 June 2022).
  44. Baldrian, P.; Trögl, J.; Frouz, J.; Šnajdr, J.; Valášková, V.; Merhautová, V.; Cajthaml, T.; Herinková, J. Enzyme activities and microbial biomass in topsoil layer during spontaneous succession in spoil heaps after brown coal mining. Soil Biol. Biochem. 2008, 40, 2107–2115. [Google Scholar] [CrossRef]
  45. Klaubauf, S.; Inselsbacher, E.; Zechmeister-Boltenstern, S.; Wanek, W.; Gottsberger, R.; Strauss, J.; Gorfer, M. Molecular diversity of fungal communities in agricultural soils from Lower Austria. Fungal Divers. 2010, 44, 65–75. [Google Scholar] [CrossRef] [PubMed] [Green Version]
  46. Sosa-Hernández, M.A.; Roy, J.; Hempel, S.; Kautz, T.; Köpke, U.; Uksa, M.; Schloter, M.; Caruso, T.; Rillig, M.C. Subsoil arbuscular mycorrhizal fungal communities in arable soil differ from those in topsoil. Soil Biol. Biochem. 2018, 117, 83–86. [Google Scholar] [CrossRef]
  47. Baumert, V.L.; Vasilyeva, N.A.; Vladimirov, A.A.; Meier, I.C.; Kögel-Knabner, I.; Mueller, C.W. Root exudates induce soil macroaggregation facilitated by fungi in subsoil. Front. Environ. Sci. 2018, 6, 140. [Google Scholar] [CrossRef]
  48. Shi, L.-L.; Mortimer, P.E.; Slik, J.W.F.; Zou, X.-M.; Xu, J.; Feng, W.-T.; Qiao, L. Variation in forest soil fungal diversity along a latitudinal gradient. Fungal Divers. 2014, 64, 305–315. [Google Scholar] [CrossRef]
  49. Lin, X.; Feng, Y.; Zhang, H.; Chen, R.; Wang, J.; Zhang, J.; Chu, H. Long-Term Balanced Fertilization Decreases Arbuscular Mycorrhizal Fungal Diversity in an Arable Soil in North China Revealed by 454 Pyrosequencing. Environ. Sci. Technol. 2012, 46, 5764–5771. [Google Scholar] [CrossRef]
  50. Dai, M.; Bainard, L.D.; Hamel, C.; Gan, Y.; Lynch, D. Impact of Land Use on Arbuscular Mycorrhizal Fungal Communities in Rural Canada. Appl. Environ. Microbiol. 2013, 79, 6719–6729. [Google Scholar] [CrossRef] [Green Version]
  51. Rousk, J.; Nadkarni, N.M. Growth measurements of saprotrophic fungi and bacteria reveal differences between canopy and forest floor soils. Soil Biol. Biochem. 2009, 41, 862–865. [Google Scholar] [CrossRef]
  52. Zhou, L.; Zhao, P.; Chi, Y.; Wang, N.; Wang, P.; Liu, N.; Cai, D.; Wu, Z.; Zhong, N. Controlling the Hydrolysis and Loss of Nitrogen Fertilizer (Urea) by using a Nanocomposite Favors Plant Growth. ChemSusChem 2017, 10, 2068–2079. [Google Scholar] [CrossRef]
  53. Negassa, W.; Baum, C.; Schlichting, A.; Müller, J.; Leinweber, P. Small-Scale Spatial Variability of Soil Chemical and Biochemical Properties in a Rewetted Degraded Peatland. Front. Environ. Sci. 2019, 7, 116. [Google Scholar] [CrossRef] [Green Version]
  54. Shi, L.; Feng, W.; Jing, X.; Zang, H.; Mortimer, P.; Zou, X. Contrasting responses of soil fungal communities and soil respiration to the above- and below-ground plant C inputs in a subtropical forest. Eur. J. Soil Sci. 2018, 70, 751–764. [Google Scholar] [CrossRef]
  55. Rovira, P.; Vallejo, V. Labile and recalcitrant pools of carbon and nitrogen in organic matter decomposing at different depths in soil: An acid hydrolysis approach. Geoderma 2002, 107, 109–141. [Google Scholar] [CrossRef]
  56. Kallenbach, C.; Grandy, A.; Frey, S.; Diefendorf, A. Microbial physiology and necromass regulate agricultural soil carbon accumulation. Soil Biol. Biochem. 2015, 91, 279–290. [Google Scholar] [CrossRef] [Green Version]
  57. Dannenmann, M.; Simon, J.; Gasche, R.; Holst, J.; Naumann, P.S.; Kögel-Knabner, I.; Knicker, H.; Mayer, H.; Schloter, M.; Pena, R.; et al. Tree girdling provides insight on the role of labile carbon in nitrogen partitioning between soil microorganisms and adult European beech. Soil Biol. Biochem. 2009, 41, 1622–1631. [Google Scholar] [CrossRef]
  58. Weiher, E.; Freund, D.; Bunton, T.; Stefanski, A.; Lee, T.; Bentivenga, S. Advances, challenges and a developing synthesis of ecological community assembly theory. Philos. Trans. R. Soc. B Biol. Sci. 2011, 366, 2403–2413. [Google Scholar] [CrossRef]
  59. Ahmed, W.; Jing, H.; Kaillou, L.; Qaswar, M.; Khan, M.N.; Jin, C.; Geng, S.; Qinghai, H.; Yiren, L.; Guangrong, L.; et al. Changes in phosphorus fractions associated with soil chemical properties under long-term organic and inorganic fertilization in paddy soils of southern China. PLoS ONE 2019, 14, e0216881. [Google Scholar] [CrossRef]
  60. Ahmed, M.A.; Banfield, C.C.; Sanaullah, M.; Gunina, A.; Dippold, M.A. Utilisation of mucilage C by microbial communities under drought. Biol. Fertil. Soils 2017, 54, 83–94. [Google Scholar] [CrossRef]
  61. Rosado, B.H.P.; Holder, C.D. The significance of leaf water repellency in ecohydrological research: A review. Ecohydrology 2012, 6, 150–161. [Google Scholar] [CrossRef]
  62. Lauber, C.L.; Strickland, M.S.; Bradford, M.A.; Fierer, N. The influence of soil properties on the structure of bacterial and fungal communities across land-use types. Soil Biol. Biochem. 2008, 40, 2407–2415. [Google Scholar] [CrossRef]
  63. Fukasawa, Y.; Osono, T.; Takeda, H. Dynamics of physicochemical properties and occurrence of fungal fruit bodies during decomposition of coarse woody debris of Fagus crenata. J. For. Res. 2009, 14, 20. [Google Scholar] [CrossRef]
  64. Bartram, A.K.; Jiang, X.; Lynch, M.D.; Masella, A.P.; Nicol, G.; Dushoff, J.; Neufeld, J.D. Exploring links between pH and bacterial community composition in soils from the Craibstone Experimental Farm. FEMS Microbiol. Ecol. 2013, 87, 403–415. [Google Scholar] [CrossRef] [PubMed]
  65. Chen, W.; Xu, R.; Hu, T.; Chen, J.; Zhang, Y.; Cao, X.; Wu, D.; Wu, Y.; Shen, Y. Soil-mediated effects of acidification as the major driver of species loss following N enrichment in a semi-arid grassland. Plant Soil 2017, 419, 541–556. [Google Scholar] [CrossRef]
  66. He, M.; Chen, W.-J.; Tian, L.; Shao, B.; Lin, Y. Plant-microbial synergism: An effective approach for the remediation of shale-gas fracturing flowback and produced water. J. Hazard. Mater. 2018, 363, 170–178. [Google Scholar] [CrossRef] [PubMed]
Figure 1. Fungal diversity (a) and richness (b) in topsoil and subsoil in forests compare to tea plantations under high, low, and moderate fertilizer inputs. (c) the correlation between fungal diversity indexes with environmental factors. Layer: soil layers, H: fungal Shannon diversity, S: species richness, apha: apha diversity, veg: vegetation types, CA: soil total Ca, MG: soil total Mg, P, N, C: soil total P, N, C, SFI: soil fertility index; (d) correlation between SFI and soil fungal diversity (Shannon index).
Agronomy 12 01751 g001
Figure 2. Dominate fungal genus (a) and functional guilds (b) in topsoil and subsoil in forests compare to tea plantations under high (H), low (L), and moderate (M) fertilizer inputs.
Agronomy 12 01751 g002
Figure 3. (a) NMDS plot showed that fungal communities varied between forest and tea plantations. (b) RDA analysis the correlation between fungal diversity indexes with environmental factors. Layer: soil layers, H: fungal Shannon diversity, S: species richness, apha: apha diversity, veg: vegetation types, CA: soil total Ca, MG: soil total Mg, P, N, C: soil total P, N, C.
Agronomy 12 01751 g003
Figure 4. Co-occurrence networks of fungal communities at 14 studied sites with different fertility. Networks are randomly colored by modules.
Agronomy 12 01751 g004
Table 1. Indicator analysis figured out the factors combine to explain the variations of fungal communities. *** means p < 0.001(Duncan Multiple Range Test).
1.
Factor combinations
2.
Df
3.
Variance
4.
F
5.
Pr(>F)
6.
K + P + C + N + CA + MG + pH
7.
7
8.
885.1
9.
1.772
10.
0.001 ***
11.
veg + layer
12.
2
13.
454.7
14.
3.133
15.
0.001 ***
16.
K + P + C + N + CA + MG + pH + veg + layer
17.
9
18.
1099.2
19.
1.7439
20.
0.001 ***
21.
K + P + C + N + CA + MG + pH + Condition (veg + layer)
22.
7
23.
644.5
24.
1.3147
25.
0.001 ***
26.
veg + layer + Condition (K + P + C + N + CA + MG + pH)
27.
2
28.
214.1
29.
1.5285
30.
0.001 ***
Publisher’s Note: MDPI stays neutral with regard to jurisdictional claims in published maps and institutional affiliations.

