Article

Model Development of the Phenological Cycle from Flower to Fruit of Strawberries (Fragaria × ananassa)

by
Nelda Hernández-Martínez
1,
Melba Salazar-Gutiérrez
1,*,
Bernardo Chaves-Córdoba
2,
Daniel Wells
1,
Wheeler Foshee
1 and
Amanda McWhirt
3
1
Department of Horticulture, Auburn University, Auburn, AL 36849, USA
2
College of Agriculture, Auburn University, Auburn, AL 36849, USA
3
Horticulture Department, Cooperative Extension Service, University of Arkansas, Fayetteville, AR 72701, USA
*
Author to whom correspondence should be addressed.
Agronomy 2023, 13(10), 2489; https://doi.org/10.3390/agronomy13102489
Submission received: 1 September 2023 / Revised: 22 September 2023 / Accepted: 25 September 2023 / Published: 27 September 2023
(This article belongs to the Section Precision and Digital Agriculture)

Abstract

:
Strawberries are a very important economic crop; thus, a lot of research has been conducted on several production areas. However, phenological performance is still lacking information, especially when it comes to modeling. Therefore, this study aims to develop a phenological model for flower–fruit development under hydroponic conditions to support growers’ decision-making. Two day-neutral cultivars, ‘Albion’ and ‘San Andreas’, were established in a drip hydroponic system in Auburn, Alabama for the 2022–2023 production season. Phenological data were collected daily on 30 flowers per cultivar for three periods (Oct 25–Dec 16, Dec 27–Feb 21, and Feb 28–Apr 16). Weather data were obtained from a weather station placed in the greenhouse. Growing degree days (GDD) accumulation was calculated for each stage and cycle using a base temperature (Tb) of 3 °C. The Gaussian model was adjusted for each stage and cycle using a non-linear procedure to obtain Gaussian curves. Simulations were made for the model assuming temperature would increase or decrease by 1 °C. Six stages were identified, and their cycle ranged from 43–56 days to be accomplished. ‘Albion’ needed more days to reach maturity, with 51, 56, and 47 days, and ‘San Andreas’ took 43, 54, and 46 days for cycles 1, 2, and 3 respectively. In addition, for cycles 1 and 2, not all the buds reached maturity, as expected. Stage 5 (fruit formation) needed more days than the rest of the stages to be completed. Because of the different starting dates for each cycle, the starting GDD was different as well. A sensitivity analysis simulation of the model showed that if temperature decreases by 1 °C, the GDD accumulated to complete the stages would be less (same dates), and it would be more if the temperature increased by 1 °C. The opposite happened with the days, if the temperature increased by 1 °C, the duration of the stage decreased, and it would increase if the temperature decreased by 1 °C, affecting stages 4, 5, and 6. Overall, ‘San Andreas’ performed better than ‘Albion’ under hydroponic conditions during three productive cycles.

1. Introduction

Phenological changes in strawberries are directly influenced mainly by climatic conditions during the whole production cycle including photoperiod, light quality and intensity, chilling, and temperature [1]. Temperature is a critical factor that triggers important physiological processes such as flowering. The response to temperatures will vary depending on the type of cultivar, which can be short-day (SD) (seasonal flowering), long-day (LD) (everbearing or perpetual flowering), or day-neutral (DN). SD cultivars, also known as June-bearing cultivars, require short days and temperatures above 18–20 °C; under lower temperatures, SD cultivars behave as DN cultivars flowering under long days [2]. Even though SD cultivars require temperatures around 20 °C to induce flowering, they will fail in producing flowers at temperatures above 30 °C, disregarding the day length [3]. For LD cultivars, the same applies; temperatures above 26 °C will significantly reduce the number of flowers, and higher numbers will be produced at 18 °C [4]. Everbearing cultivars at high temperatures (>25 °C) are qualitative (obligatory) LD plants, intermediate temperatures (15–21 °C) are quantitative LD plants, and only at low temperatures (below 10 °C) are DN plants [5]. Significant interactions between day length and temperature have been observed and reported by several authors, highlighting the complex nature of the responses of strawberries to the environment [6,7,8]. DN cultivars initiate flowers at a constant 21 °C regardless of day length, and above 22/18 °C they respond as LD plants [8]. Photoperiod-intensive DN cultivars can produce fruit at temperatures between 4.4 and 29.4 °C [9,10]. A temperature of 10 °C promotes flowering in DN plants [6]. It has been indicated that night temperature is more critical for flowering than day temperature and length of day.
The base temperatures (the critical temperature at which plants will stop growth) for strawberries have been widely researched and reported [11]. The base temperature for leaf appearance is 0 °C for the cultivars Arazá (early) and Yvapitá (late) [12]. Meanwhile, the base temperature for crown growth and development in a strawberry crop is 10 °C [13]. Other studies indicate that for leaves and crown development, the base temperature is 7 °C [14,15,16]. Nevertheless, the base temperature for floral induction has been reported to be 5 °C [17]. Some other studies in flower phenology have used a base temperature of 3 °C to obtain the accumulation of GDD [18,19,20].
The flowering and fruiting of strawberry crops can also be influenced by other biotic factors regarding management practices such as pollination, irrigation, nutrition, diseases, and insect pressure, among others [21,22,23,24,25]. Despite light intensity being an abiotic factor, in indoor productions, it turns out to be a critical management factor for flower development uniformity [26]. When flowering starts, several recurrent biological events take place between the floral bud and the ripening of the berry at the end of the cycle. The duration of these phenological stages is modulated by the thermal time, usually expressed in cumulative growing degree days. Strawberry phenology has been evaluated in long time intervals that remark mainly specific phenological trait changes such as the time of first flower appearance, duration of flowering, trade-off between flower and runner production, and duration of anthesis to ripening. However, the specific flower phenological stages between anthesis and ripening are still not well described. In addition, while the general phenology response of strawberries to some U.S. states’ climates is very well known, genotypes released for warmer climates (California) might not perform well in cooler states (Oregon), affecting fruit development and thus producing smaller fruits. Their phenological performance under Alabama’s climate is still uncertain [27,28]. The strawberry responses to Alabama’s climate need to be known to allow making predictions about future strawberry performance.
The development of a crop spans several different phenological events and growth stages [29]. The accurate prediction of phenological stages is crucial for decision-making about crop management, including the application of pesticides and fungicides and scheduling irrigation, fertilization, pruning, and harvesting [29,30].
Predicting tools to support growers’ decision-making for the optimization of strawberry production is an urgent issue, especially for protected environments, and knowing the phenological changes in strawberries will help to guide the management of the environmental conditions around the crop to maximize and optimize the economic returns. Models can help predict scenarios related to weather [31], crop performance or cultivation [32,33,34], and the markets. The different models tested to identify strawberry phenological stages can be multiple change-point models such as Gariguette, Cléry, Cir107, Darselect, Capriss, and Ciflorette. In addition, the hidden semi-Markov chains for segmentation have been used to evaluate the synchronicity of the phenological stages of different individuals [35]. Sigmoidal functions have also been used, but in datasets that focus exclusively on slowly varying components in phenological datasets [36,37], which is not the case in strawberry phenological stages [35]. From the grower’s perspective, for commercialization, a model as a supporting tool is important to plan management practices depending on the needs, i.e., in the case of a nursery, it will require management of nutrition and climatic factors for vegetative growth instead of reproductive. On the other hand, a commercial farm will use the model to plan on demand to manage environmental factors to delay or accelerate production. A very recently developed model is CROPGRO-strawberry, and it has shown good results in development and growth, as well as harvests, of the cultivars Florida Radiance, Sensation, and Florida Brilliance [28]. Having a model for strawberry flower phenology is important to be able to predict the blooming periods and implement management practices such as pollination, pest management, frost protection (outdoors), fertilization planning, and others [38]. This study aimed to develop a model for the flower and fruit phenology of strawberries. This is research-based information for evaluating through simulations alternative season extensions of strawberries produced using alternative systems such as hydroponics.

2. Materials and Methods

2.1. Experiment Description

Strawberry flower phenology was evaluated in two day-neutral cultivars, ‘Albion’ and ‘San Andreas’, during the 2022–2023 production season. ‘Albion’ (a cross between ‘Diamante’ and ‘Cal 94.16-1’) and ‘San Andreas’ (a cross between ‘Albion’ and ‘Cal 97.86-1’) both were developed by UC Davis (Davis, CA, USA). ‘San Andreas’ is considered an improved version of ‘Albion’.

2.2. Plant Material and Growth Conditions

This study was performed in a greenhouse, and plants were grown in a hydroponic system located at the Plant Science Research Center (Auburn, Alabama; lat. 32°35′17.52″ N, long. 85°29′20.41″ W; elevation, 678 m) during 2022–2023 production. A total of 192 ‘Albion’ plug plants and 192 ‘San Andreas’ plug plants were transplanted on September 2022 in a glasshouse of 11 × 10 m with forced-air natural gas heaters and fan and pad evaporative cooling systems, cooling, and lighting systems using HPS (high-pressure sodium) lamps (2 m above the plants) with 100 W/m2 of intensity and changing photoperiods between 12–18 h to ensure 20 mol.m−2.d−1 DLI at the canopy level per day. Temperatures were set to 12/15–20/25 °C for day/night temperature, and the average RH was 70% for the whole season. The drip hydroponic system used consisted of six rows of gutters holding eight soilless growing medium substrate slabs each. The slabs consisted of 35% coir chips and 65% Coir Natural Mix (Riococo worldwide, -Irving, TX, USA) on each gutter; each bag held 8 plug plants, for a total of 384 plants (192 plants per cultivar). The nutritive solution was delivered to the plants individually via drip irrigation delivered at 1.89 L every two hours. The stock solution containing Chem-grow (8–12–32), calcium nitrate (19% and 15.5%), and magnesium sulfate (9.8% and 12.9%), which were diluted to final concentrations and injected into irrigation lines at every irrigation event using in-line proportional injectors (dosatron) supplying 250 mL per plant per day. Weekly amounts for each fertilizer were 22,436.05 mg L−1, 22,436.05 mg L−1, and 14,997.36 mg L−1, respectively, using 5 gallon (18.92 L) buckets to store the nutritive solution. The pH and EC levels in stock solution and leachate were recorded daily to maintain 5.8 and <1.2 (dS/m) for pH and EC, respectively. The pH was controlled using battery fluid acid, which was injected from the stock solution into irrigation water. When flowers were initiated, bumblebees (Biobest Group, Redding, CA, USA) were placed in the greenhouse. Pollination was monitored, and bees were moved to other nearby vegetable crops if and when strawberry plants were being over-pollinated. When bees were not present, hand pollination was performed using small brushes. Pruning of runners and old and sick leaves was done every week. Plant health was maintained as thoroughly as possible, but insect and disease pests were encountered. The strawberry crop was continually monitored for diseases and insect pests and was sprayed with labeled pesticides when thresholds were exceeded. Thrips, aphids, whiteflies, and spider mites were predominant insect pests, while powdery mildew and phytophthora were predominant diseases.

2.3. Phenological Observations

Phenology was observed during three different periods (cycles) in the season. The first cycle went from 25 October 2022 until 16 December 2022, the second cycle was from 27 December 2022 until 31 February 2023, and the third cycle was from 28 February 2023 until 16 May 2023. A total of 10 plants per cultivar were selected, and then 3 flowers per plant were tagged to be tracked from floral bud to ripe berry, for a total of 60 flowers (30 per cultivar). The scale used to identify the flower stages consisted of six categories from flower bud to maturity. Data were collected daily to avoid skipping short-duration stages. Pictures of each flower’s phenological stage were captured, and a descriptive scale for a better understanding of flower–fruit development was developed.

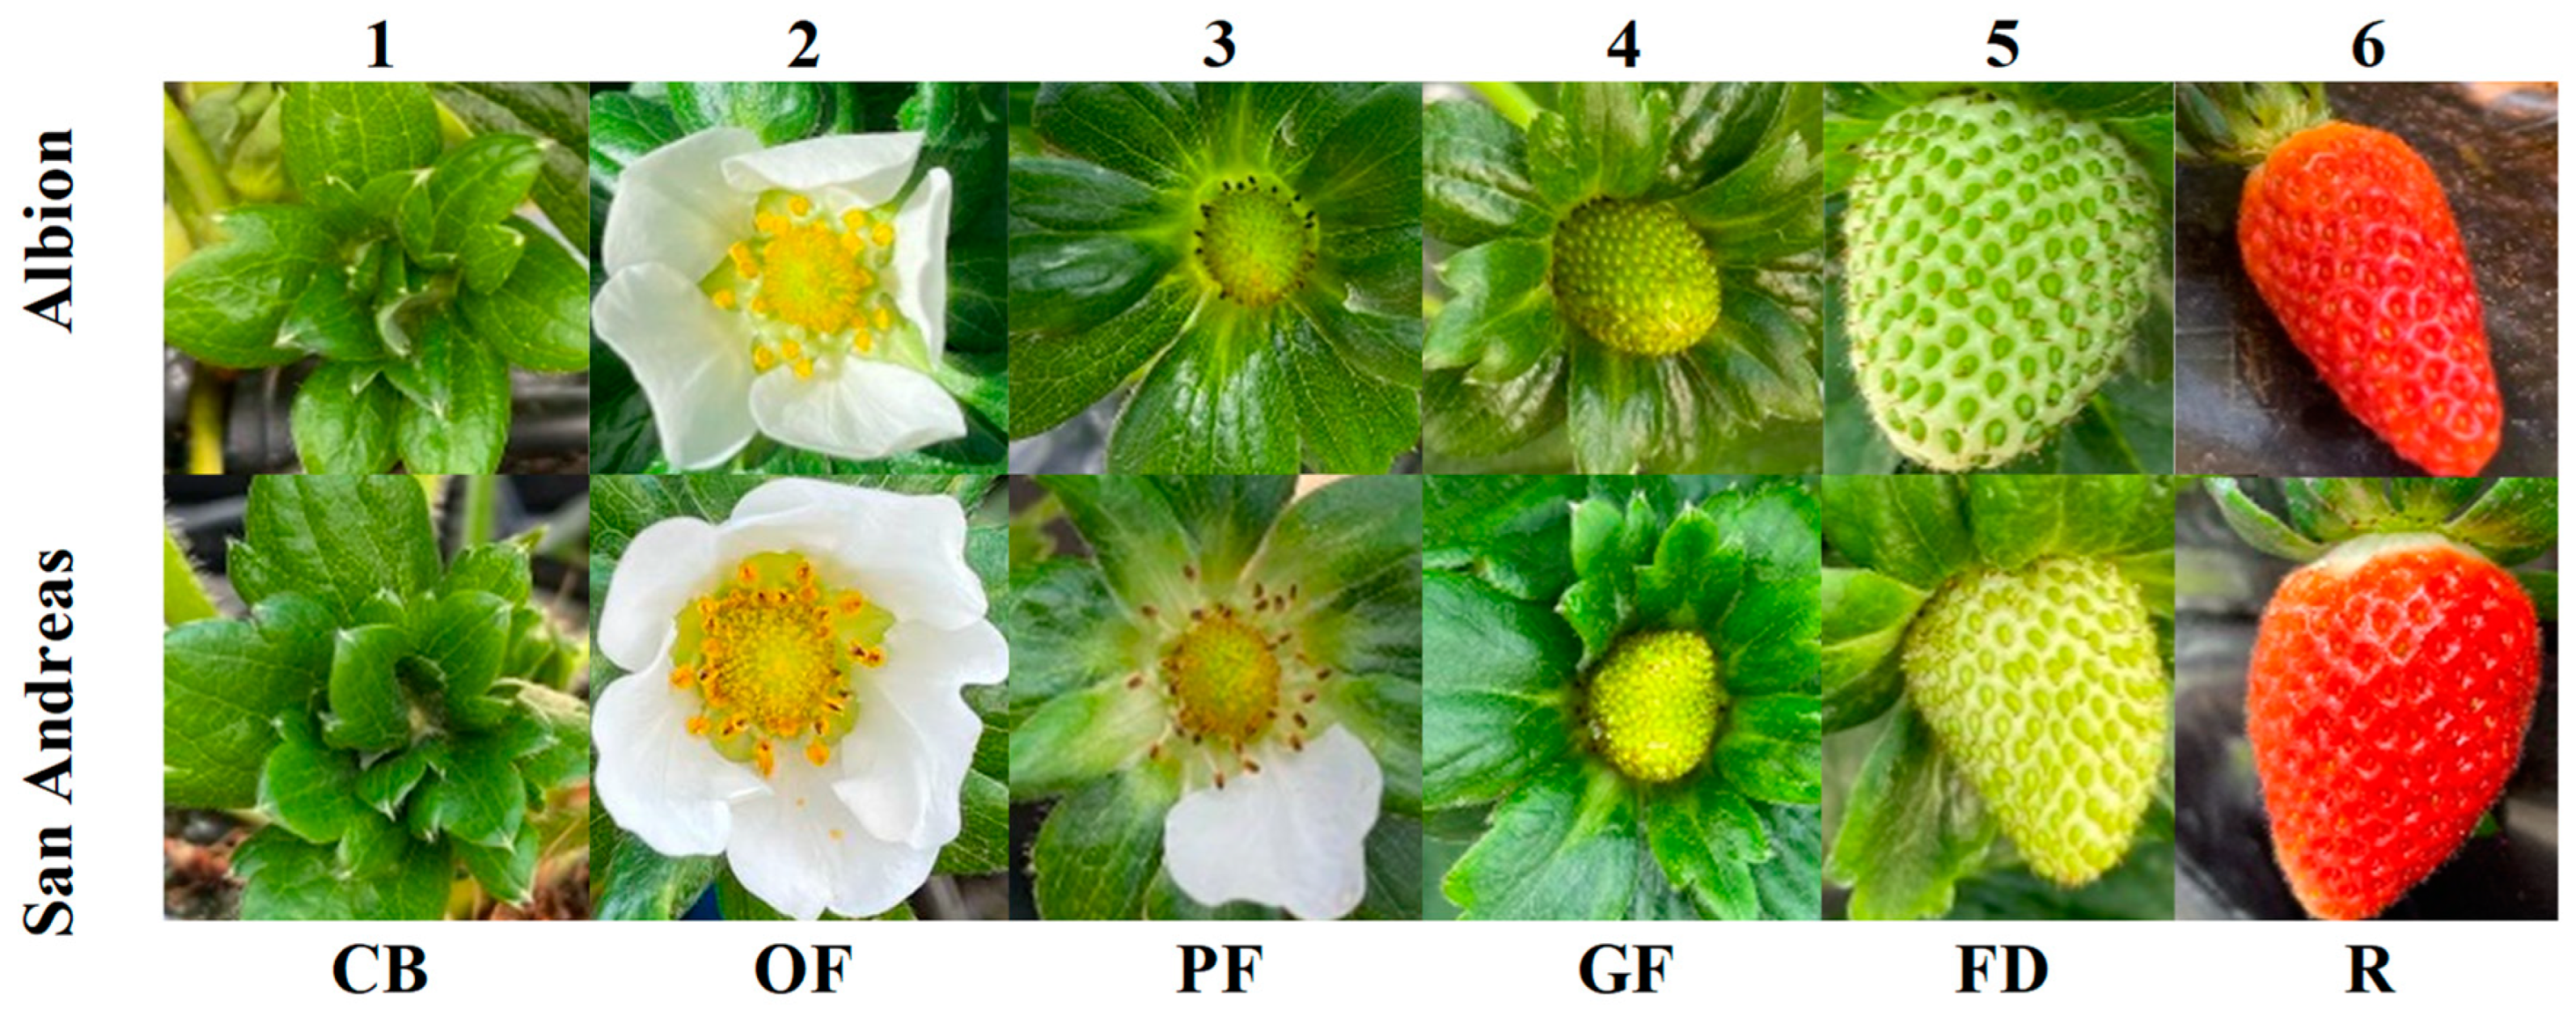
Identification of the Stages
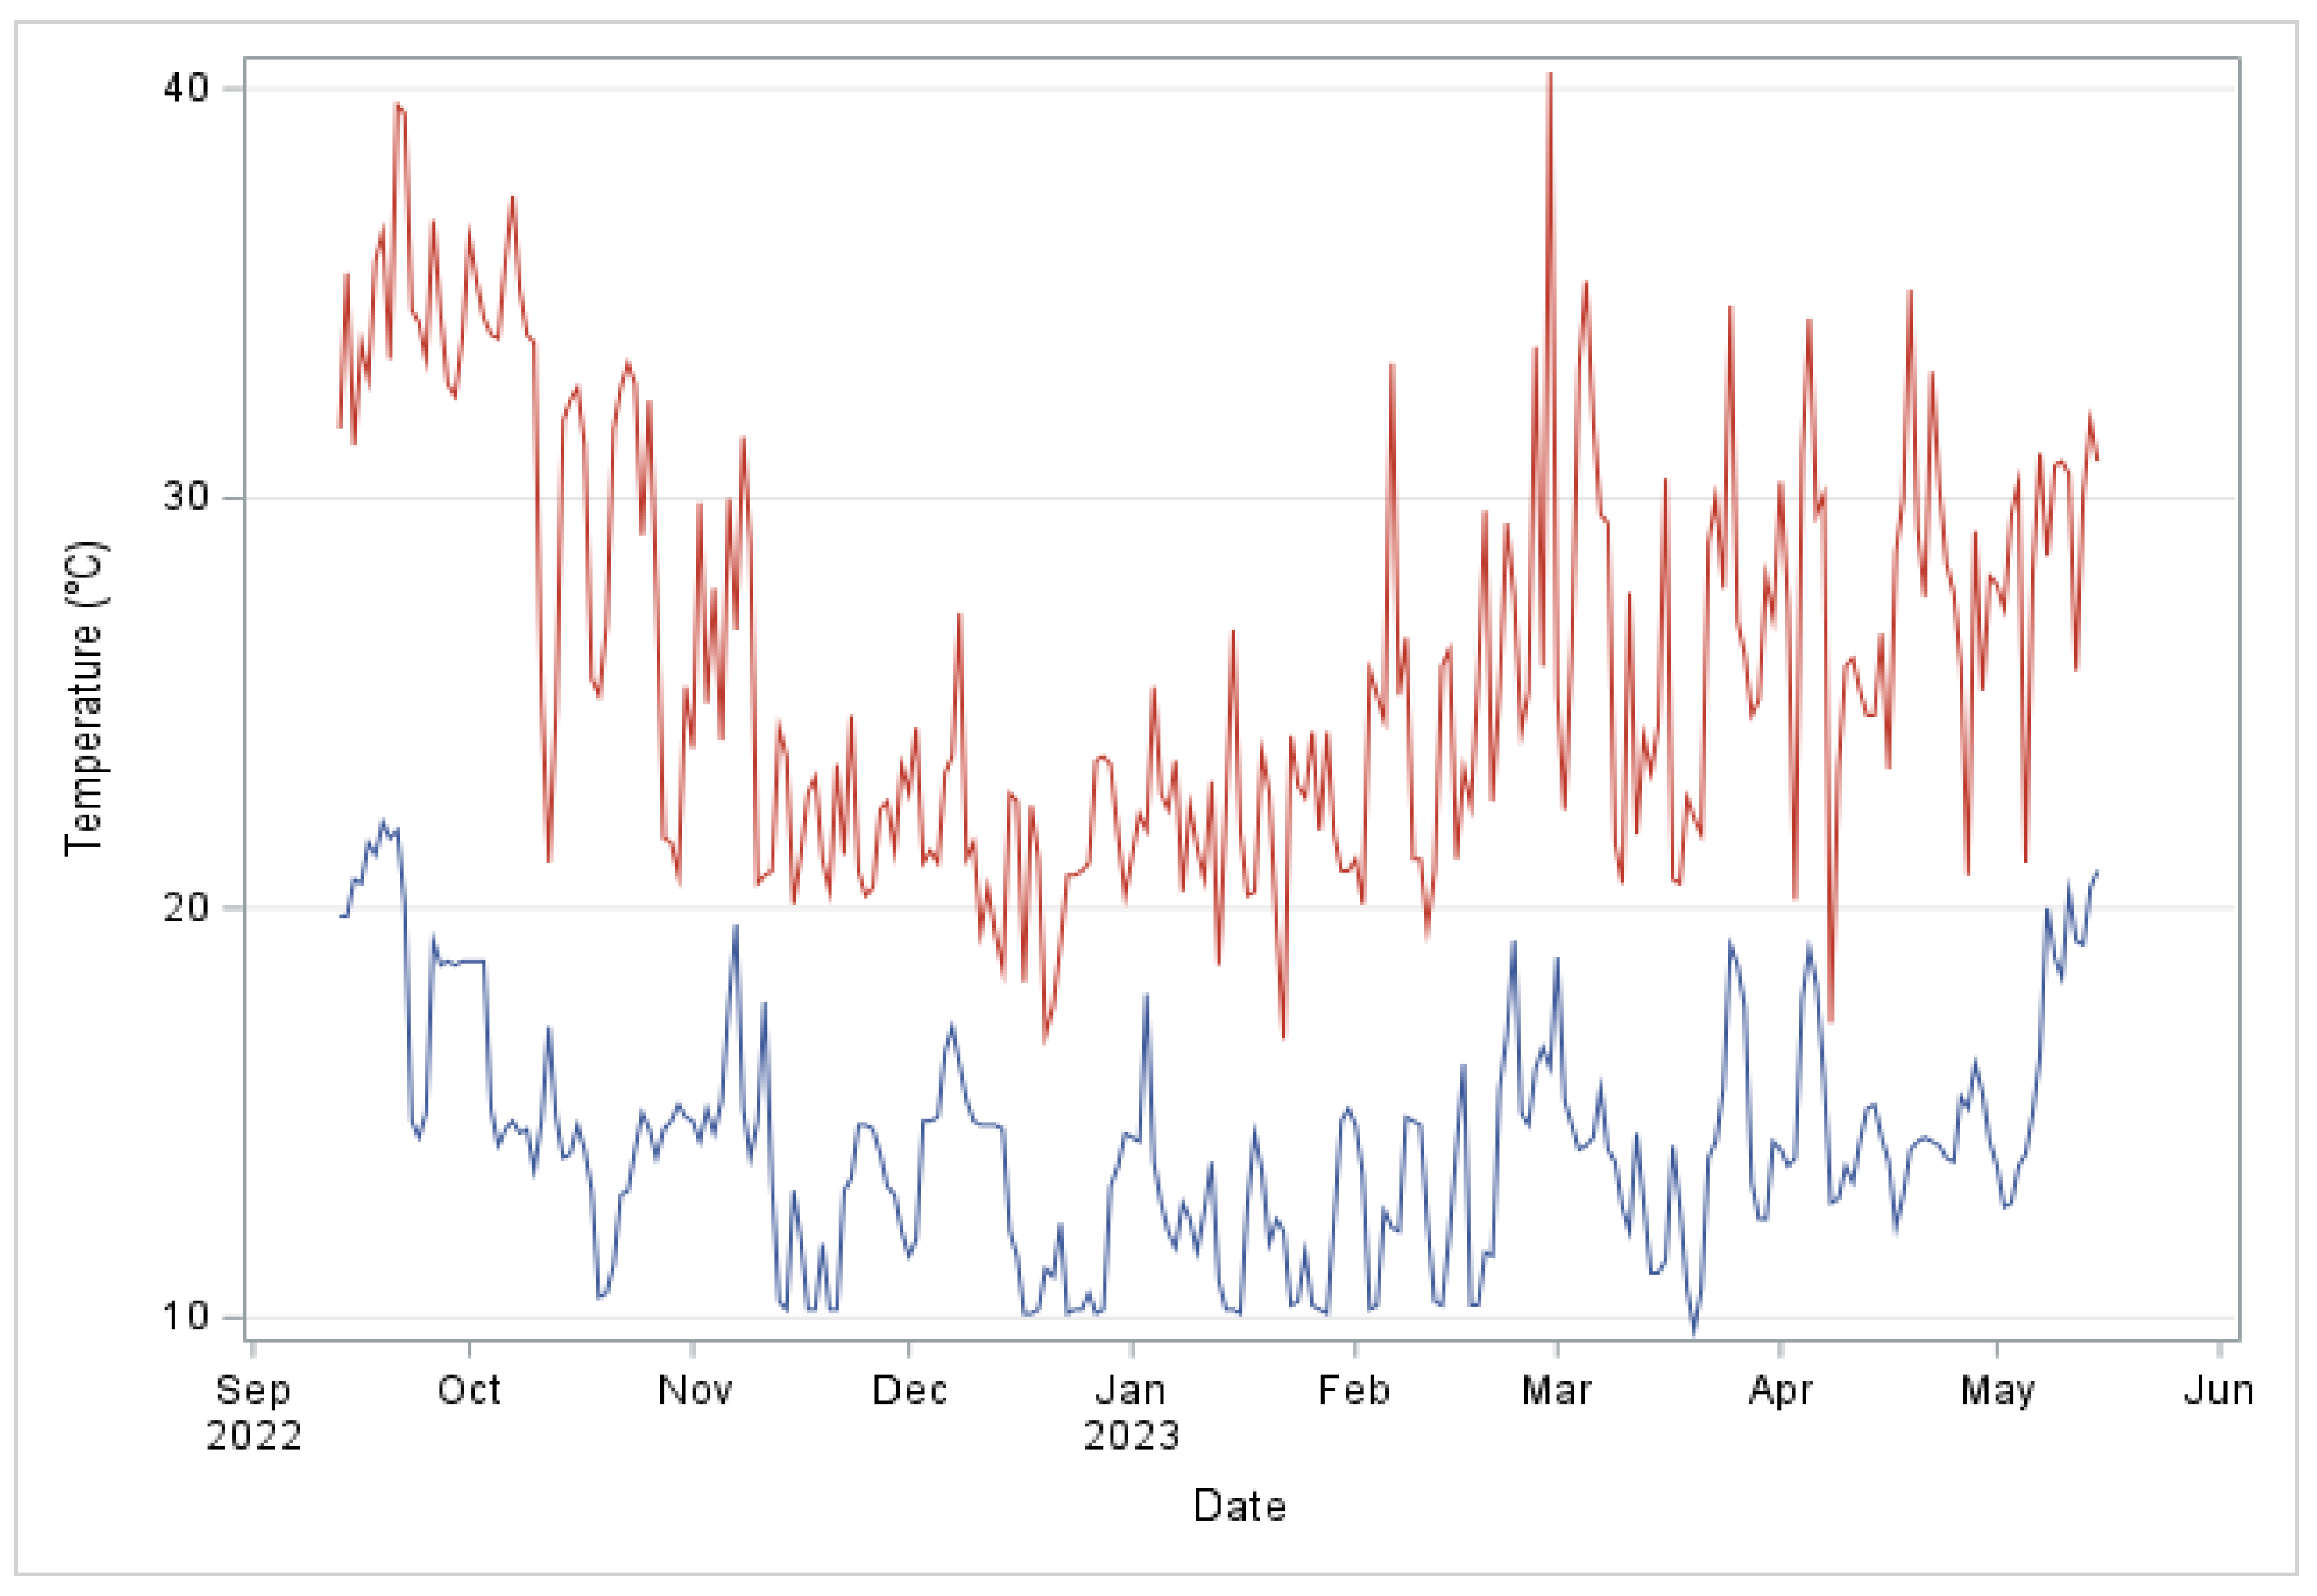
The stages were identified and named based on their morphological description following some stages described in other articles [1,39]. Stage 1: closed bud—from the bud appearance until bud opening starts. Stage 2: open flower—from the beginning of the flower opening until it starts to lose the first petals. Stage 3: petal fall—from the first petals fall until none of them are in the flower. Stage 4: green fruit—from the pistils becoming brown until achenes swell and form a greenish receptacle. Stage 5: fruit development—when there is space in between achenes, the receptacle starts to turn white. Stage 6: ripening—from when the berry starts to ripen until it is completely mature.

2.4. Weather Data

Data were retrieved from a weather station (Watchdog, Spectrum Technologies, Inc. San Dimas, CA, USA) placed in the middle of the greenhouse. Data were collected at intervals of 15 min for providing air temperature, relative humidity, PAR light, and radiation shield. Data were stored on the device and downloaded weekly to analyze them. The temperature was set to range from 22–25 °C/12–15 °C for day/night, respectively. However, the minimum and maximum temperatures registered were 9.7 °C and 40.7 °C, respectively, with an average temperature of 18.7 °C (Figure 1). The three periods in which phenology was observed have average temperatures of 17.6 °C, 16.6 °C, and 19 °C, respectively.

2.5. Data Analysis

The probabilistic distribution of the stages for each cycle and cultivar was determined using a PROC LOGISTIC regression procedure in SAS (SAS version 9.4; SAS Institute, Cary, NC, USA). The total and percent by category were calculated for each stage from close bud to ripe strawberry. The duration of each stage was calculated in terms of the number of days and thermal time, using a base or threshold temperature of 3 °C to calculate the thermal time (representing the GDD accumulated) (Equation (1)) [18,19], where TT is thermal time, accumulated from the first day (i) of tracking until the last day (n) of each cycle. Tb is the base temperature (3 °C).
T T = i = 1 n ( T i T b )
Each stage was modeled in terms of the percentage using a non-linear regression method to estimate a Gaussian curve. The PROC NLIN procedure in SAS was employed for fitting the models and parameter estimation. The non-linear model took into consideration the accumulation of GDD and the parameters a, b, and c (Equation (2)). Parameter a was a constant depending on parameter b, parameter b was the standard deviation of the data, and parameter c was a range given to the model where the maximum value of the percentage was found. The following model was used for each stage.
Y = 1 a e 0.5 G D D c b 2
A sensitivity analysis of the model was performed with a temperature modification to simulate all phenological stages for both cultivars under two scenarios plus and minus 1 °C in temperature.
The adjusted models were evaluated by the coefficient of determination (R2), the root mean square error (RMSE) (Equation (3)) [40,41,42,43], and the regression 1:1 of the predicted and the observed values for each cultivar.
R S M E = 1 n i = 1 n P i O i 2
where Pi and Oi are the predicted and observed dates for the year i, and n is the number of years that were compared.

3. Results

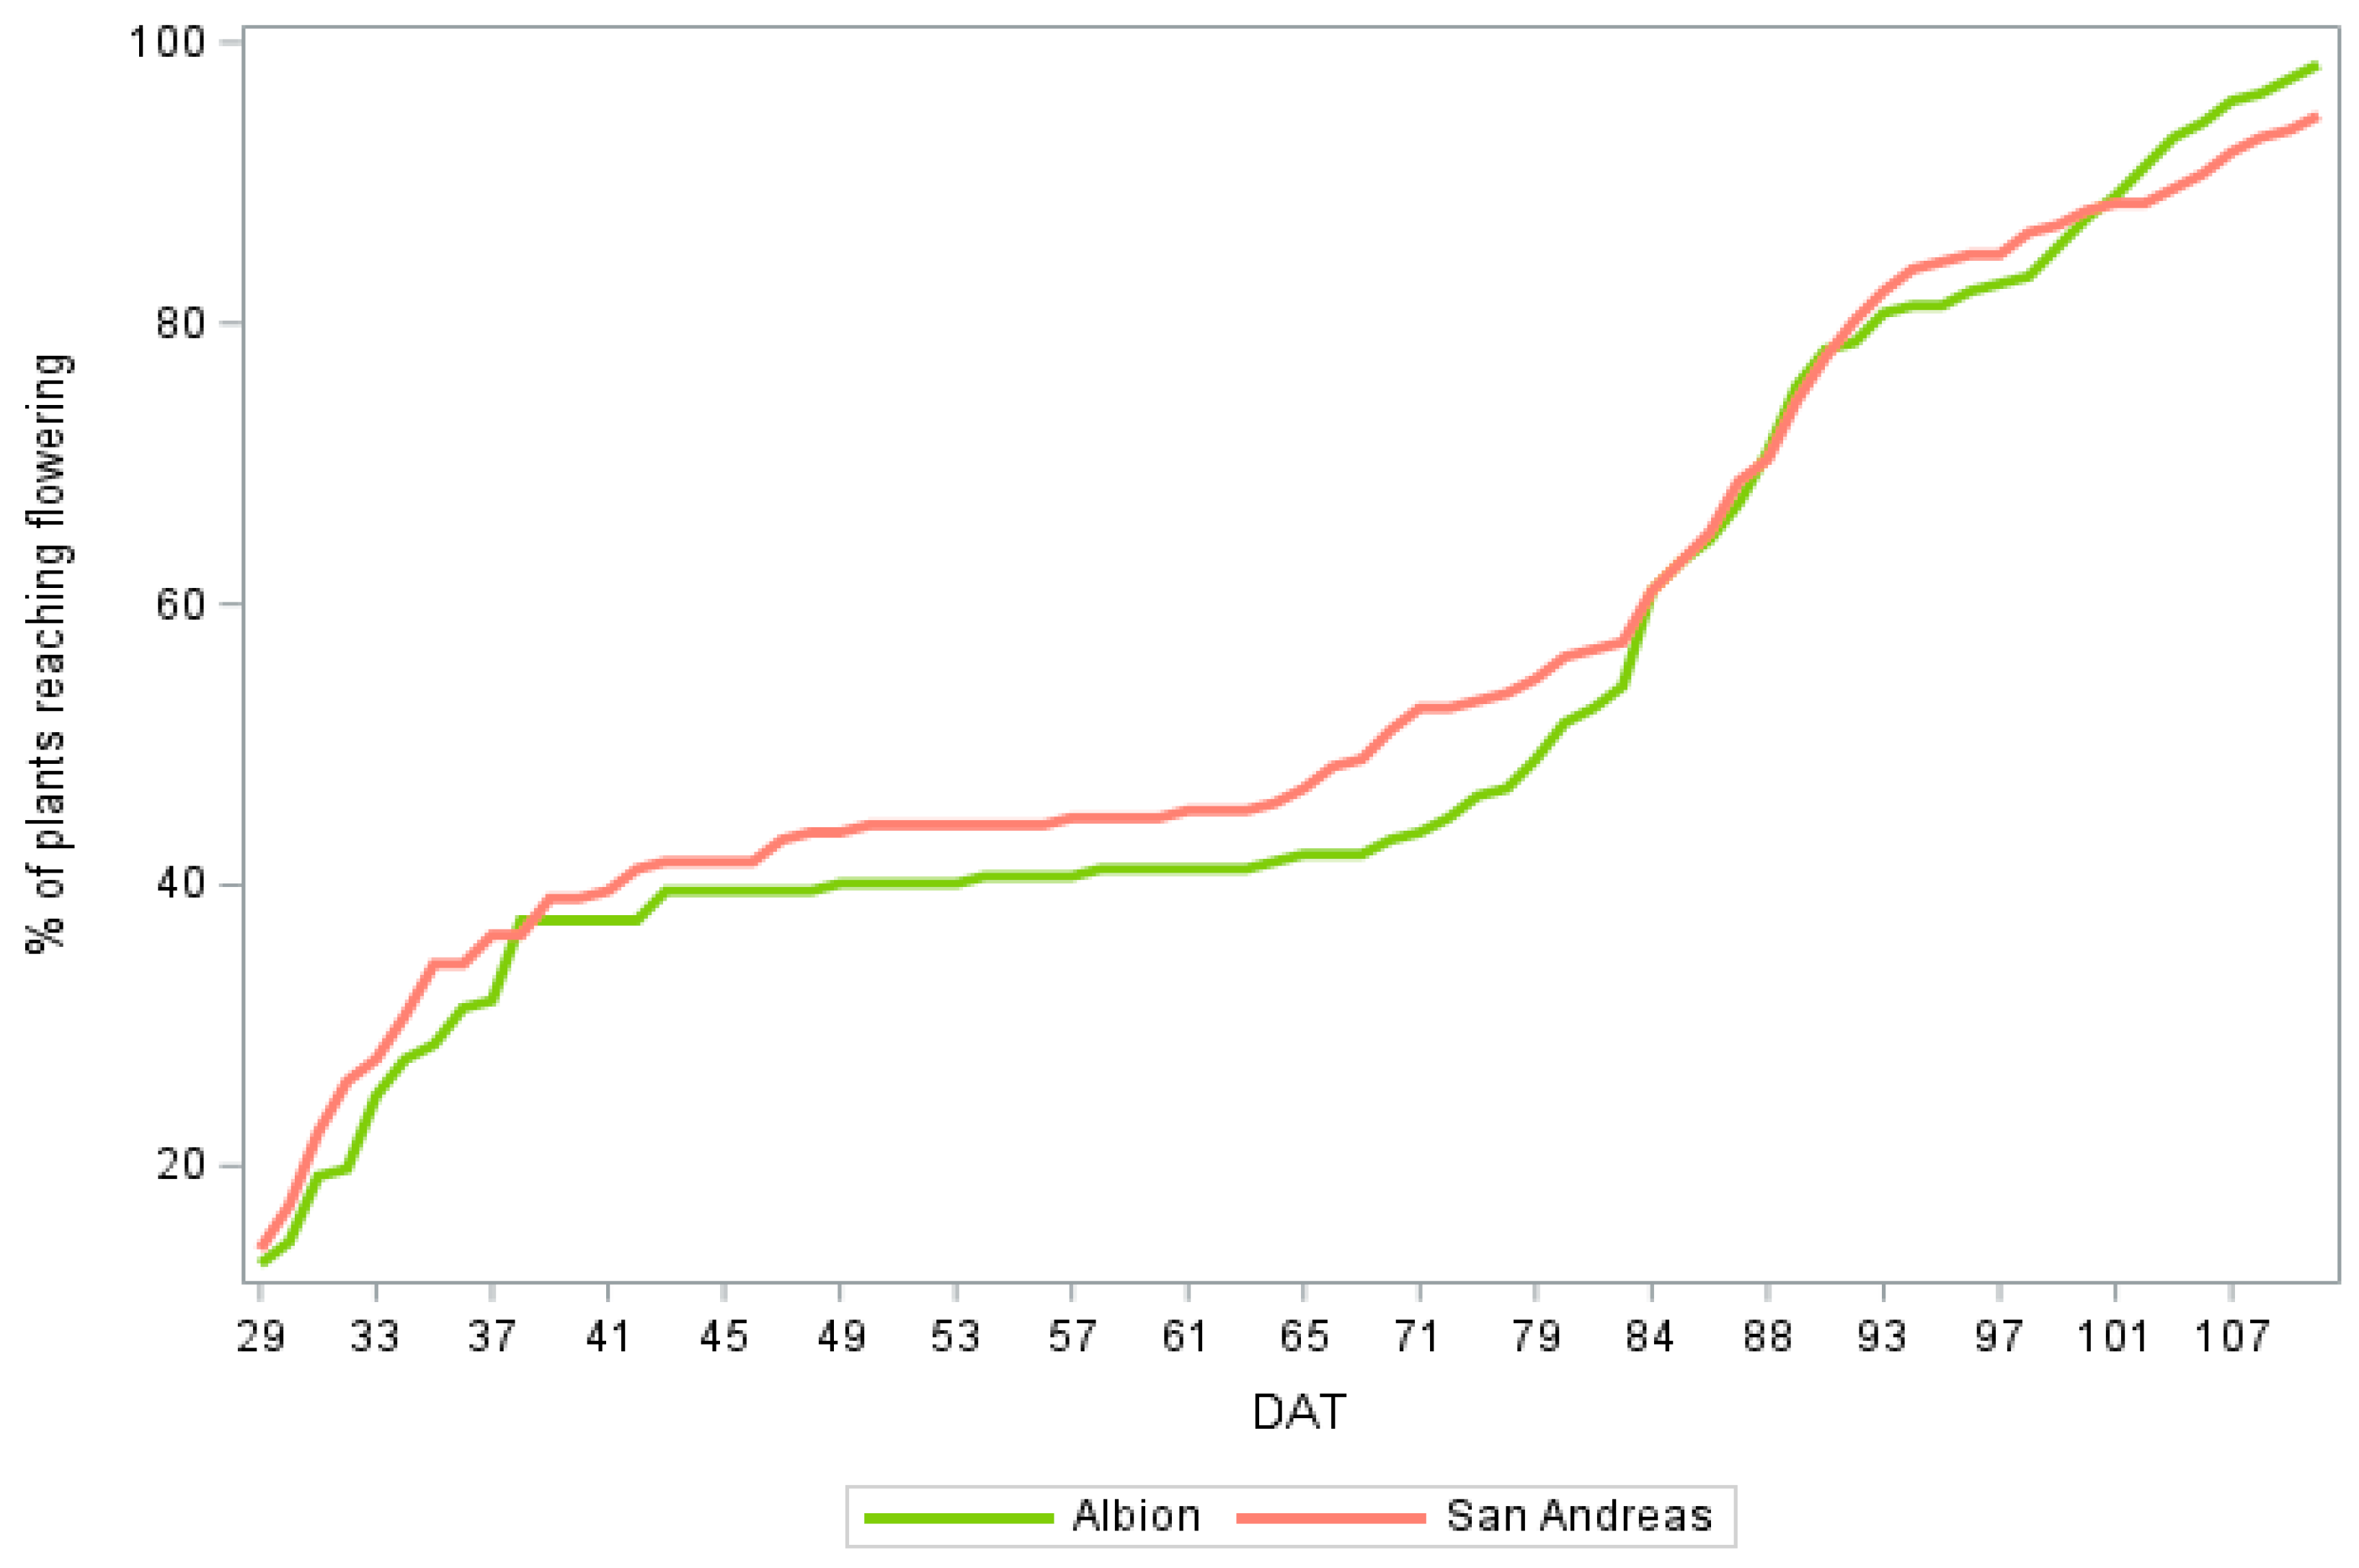
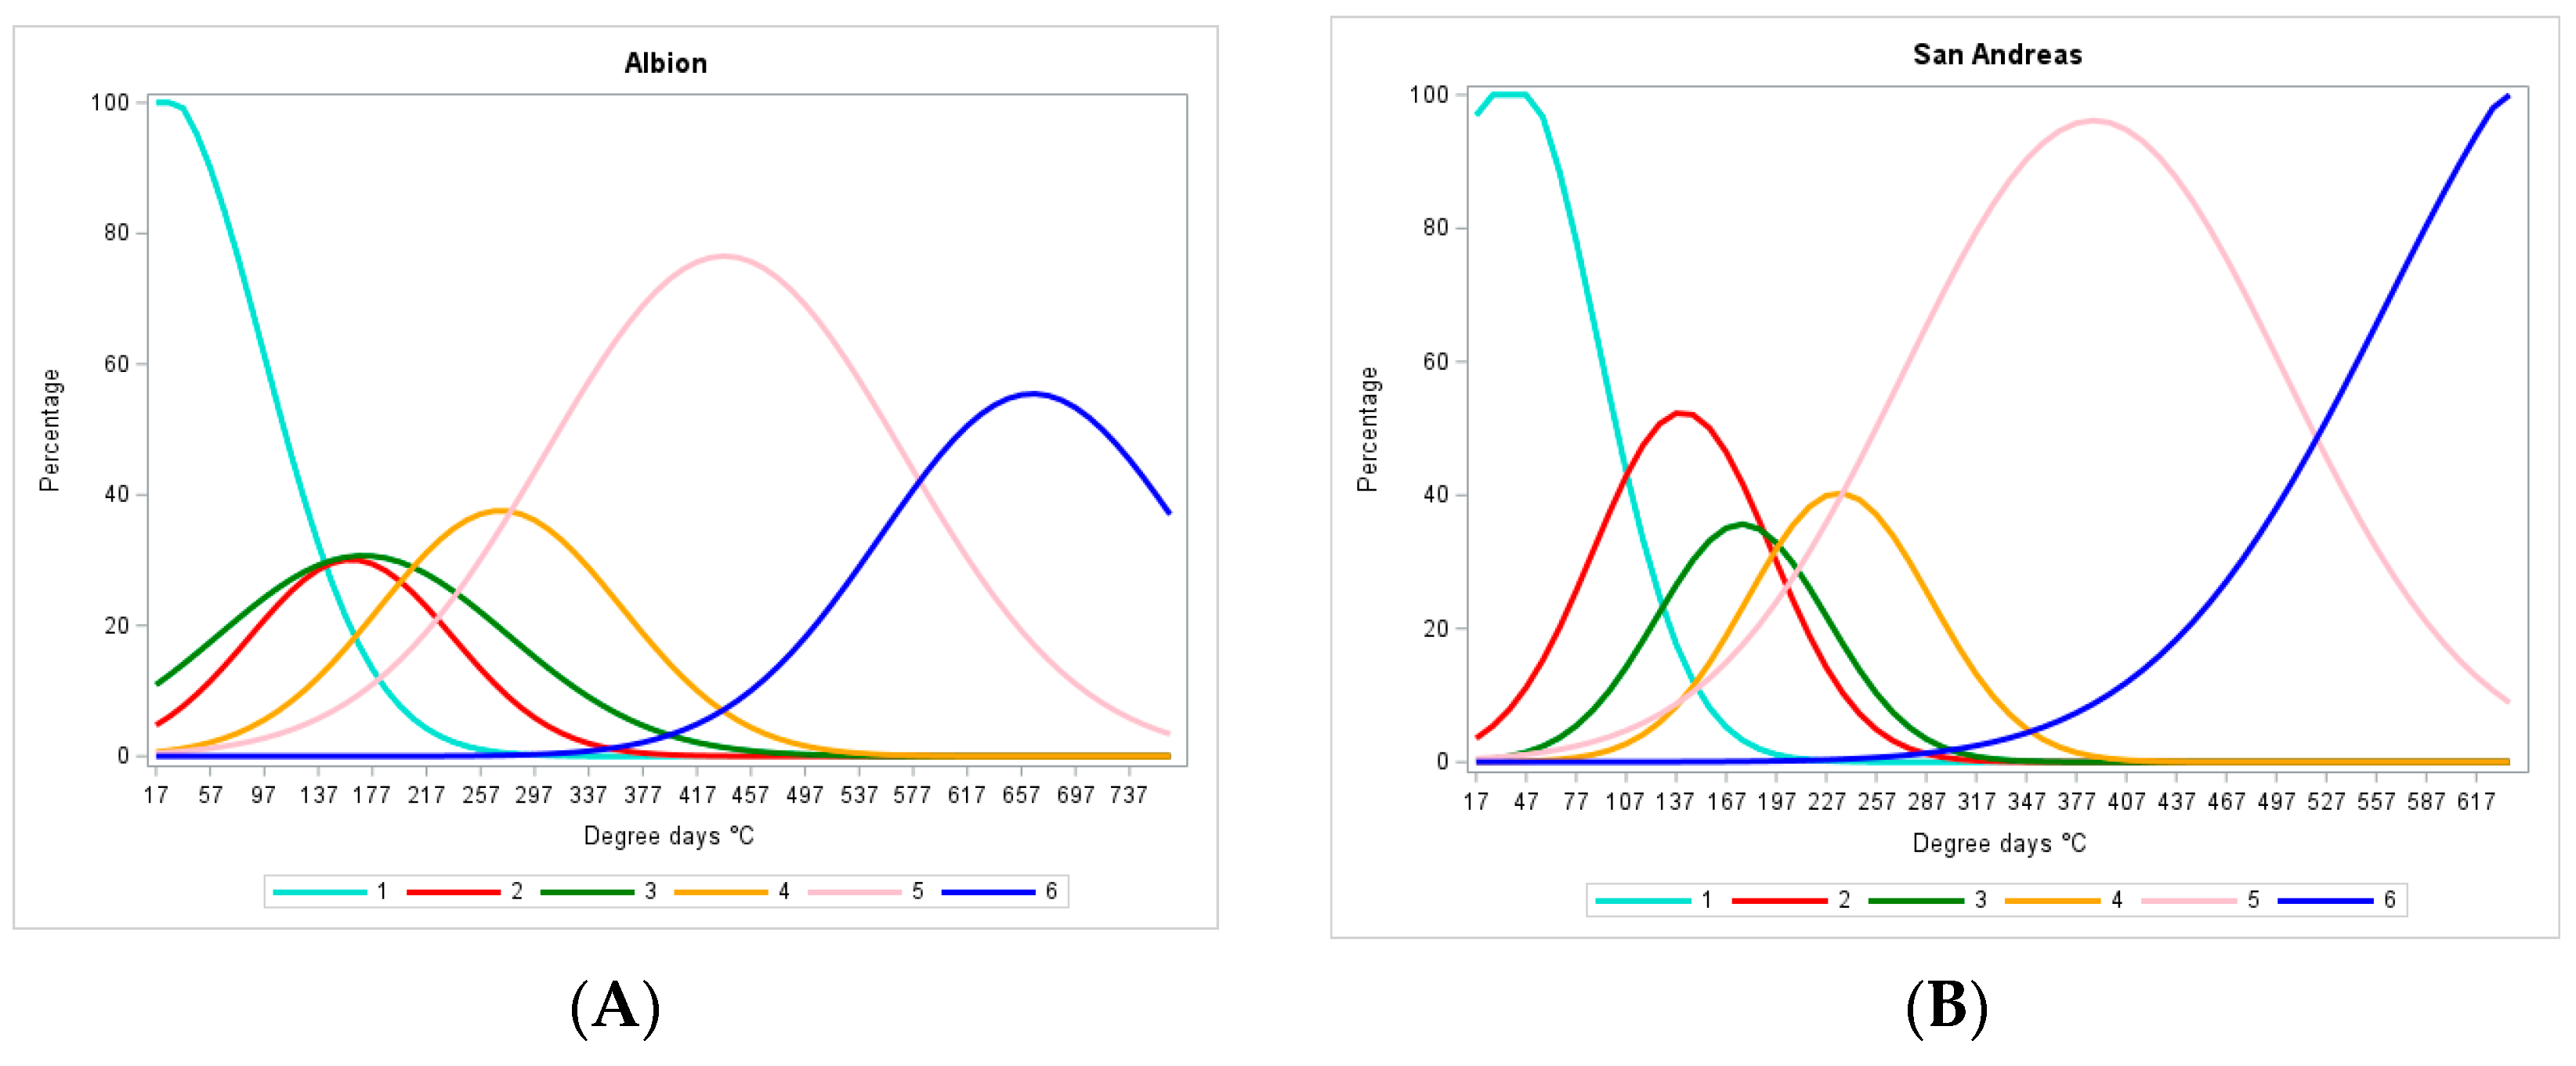
3.1. Flowering Rate of the Crop

Since both cultivars were DN type, they started to flower as soon as they were transplanted, and flowers were pruned until 5–6 completely open leaves per plant were available; this was reached at 29 days after transplanting (DAT). Once this occurred, the flowering was recorded until all plants reached reproductivity at 112 DAT (Figure 2). The increment of the % of the plants reaching flowering was exponential, both cultivars performed similarly, and the temperature and daily light interval (DLI) correlated negatively with both cultivars, ‘Albion’ (r = −0.46491 and r = −0.13270) and ‘San Andreas’ (r = −0.46961 and r = −0.12609). Significant correlations were found between temperature and the percentage of plants reaching flowering for both cultivars (p-value < 0.0001); however, no significant correlations between DLI and the percentage of plants reaching flowering (p-value < 0.2665) for ‘Albion’ and (p-value < 0.2913) for ‘San Andreas’ were found.

3.2. Identification of Stages

Strawberries’ phenological stages from floral bud to ripe berry for ‘Albion’ and ‘San Andreas’ cultivars were identified (Figure 3). The recreation of the stages for both cultivars is one of the most important contributions of this study since a scale for these cultivars has not been reported before.

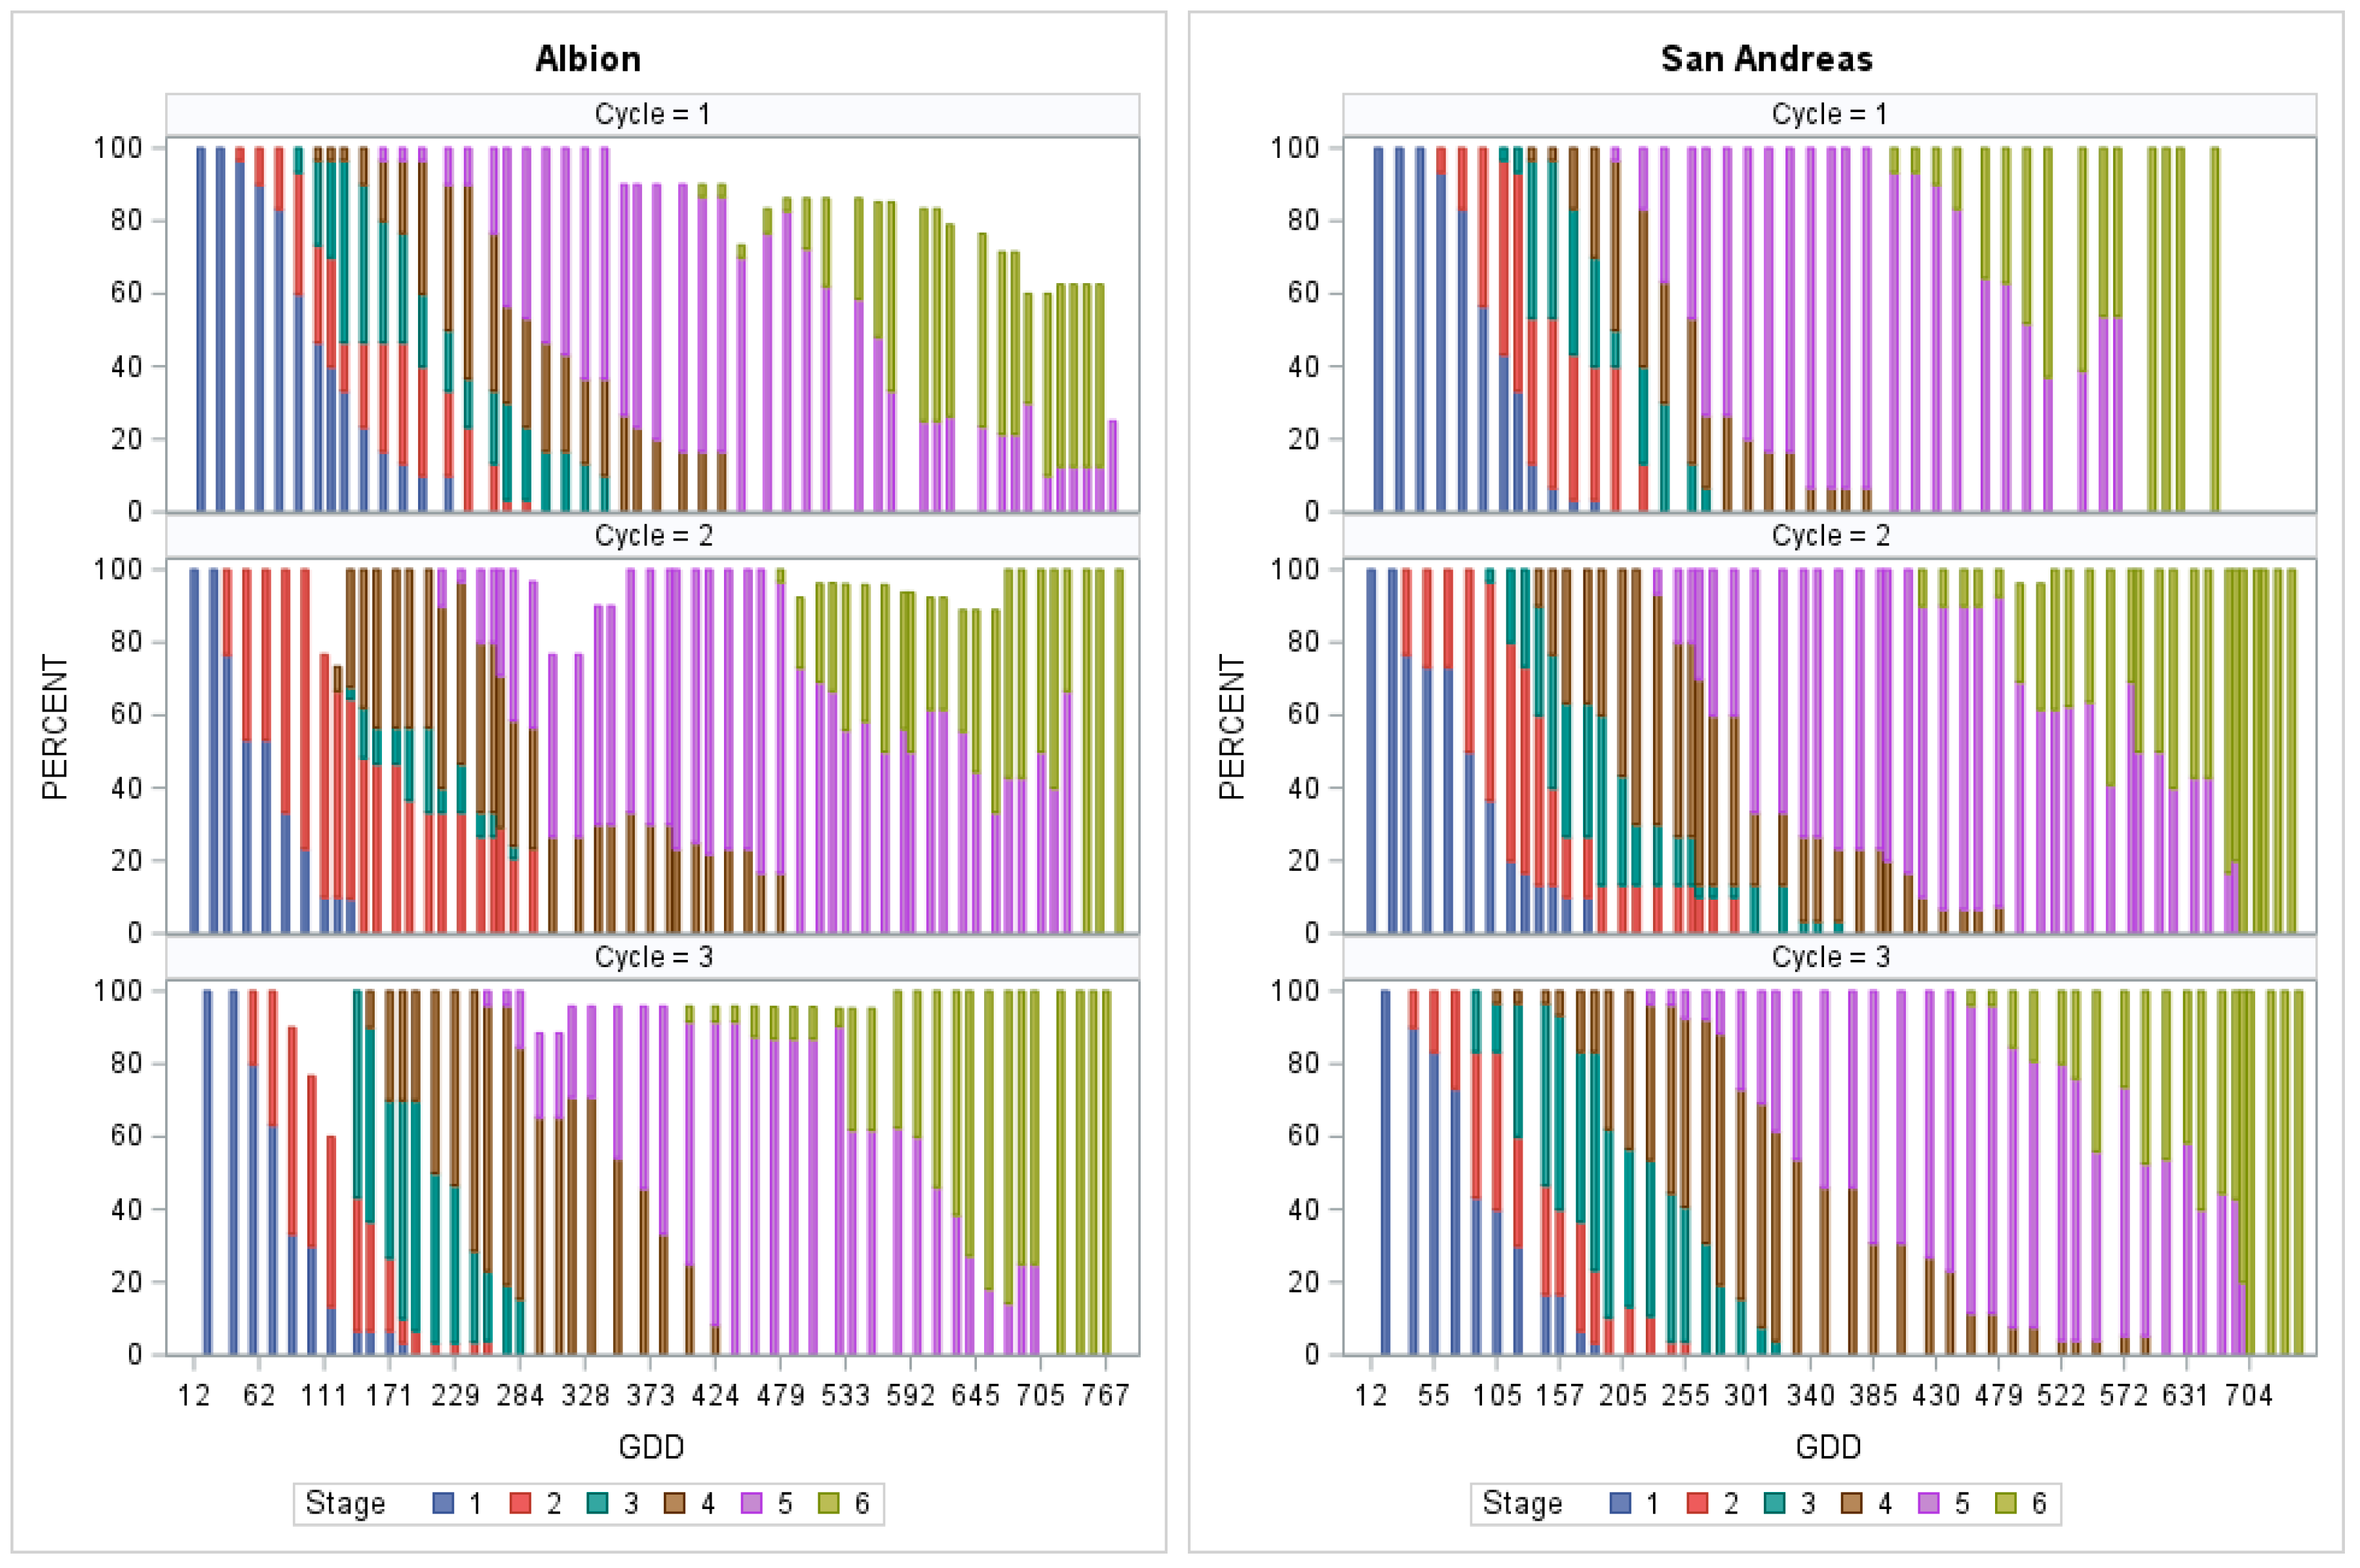
3.3. Duration of Stages

The duration of stages was calculated by subtracting the initial DAT/GDD from the final DAT/GDD, and the duration in both days and in GDD was obtained. The crop had already accumulated 819, 1699, and 2590 GDD for each cycle, respectively. For each cycle, the GDD accumulation started from day 1 of data collection to compare among cycles.
The longest stage observed was stage 5 in both cultivars, in ‘Albion’ with 36, 38, and 28 days for three cycles, and in ‘San Andreas’ with 26 and 33 days for cycles 1 and 2, respectively. In ‘San Andreas’, in cycle 3, stage 4 was the longest, with 31 days, followed by stage 5 with 29 days (Table 1). Overall, stage 5 was the longest for ‘Albion’ and ‘San Andreas’, despite the cycle and stage 4 for ‘San Andreas’ in cycle 3. While stage 1 in cycle 2 in ‘Albion’ was the shortest one, with 9 days, followed by stages 1, 2, and 3 in ‘San Andreas’ with 11, 10, and 10 days, respectively, in cycle 1. On average, of the three cycles, stage 1 was the shortest, with 11 days for both cultivars, and stage 5 was the longest, with an average of 34 and 29 days for ‘Albion’ and ‘San Andreas’, respectively (Table 1; Figure 4). A logistic regression was used to compare the percentage distribution of the phenological stages for each of the three cycles. For ‘Albion’, there was no significant difference between cycles (p-value = 0.1827), while for ‘San Andreas’, significant differences were found for cycles 1 and 3 (p-value = 0.0259) (Figure 5).

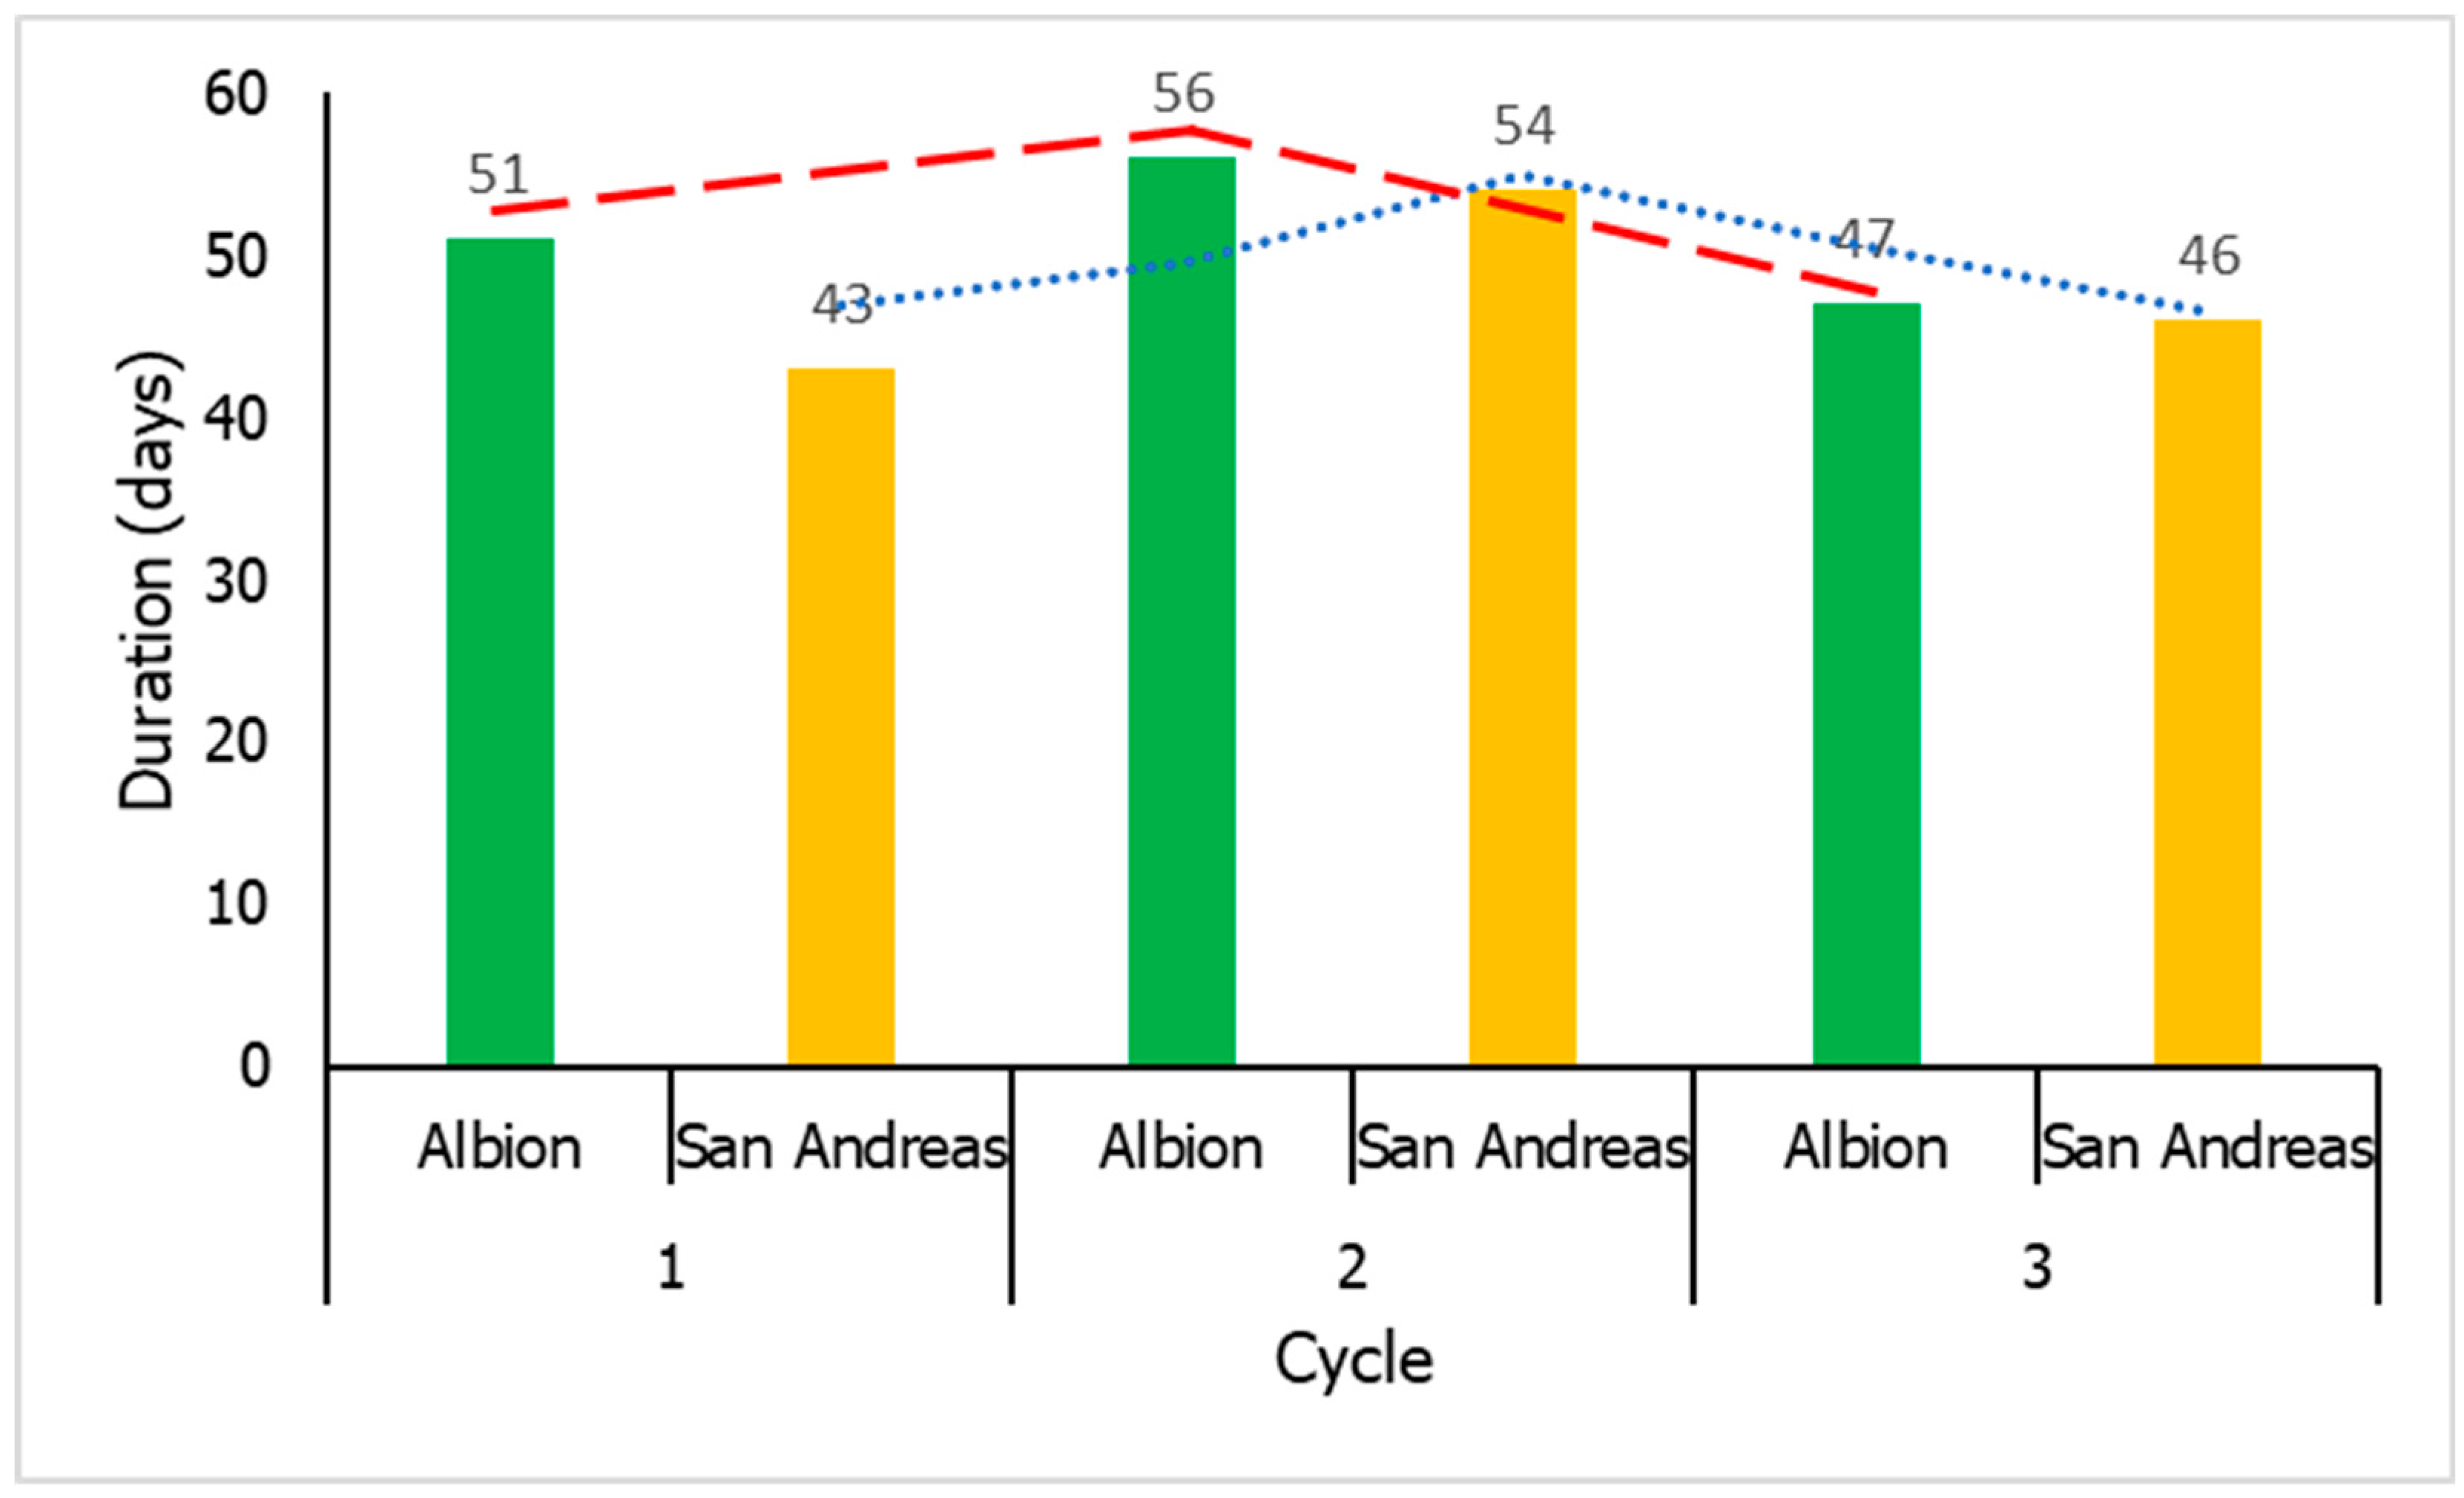
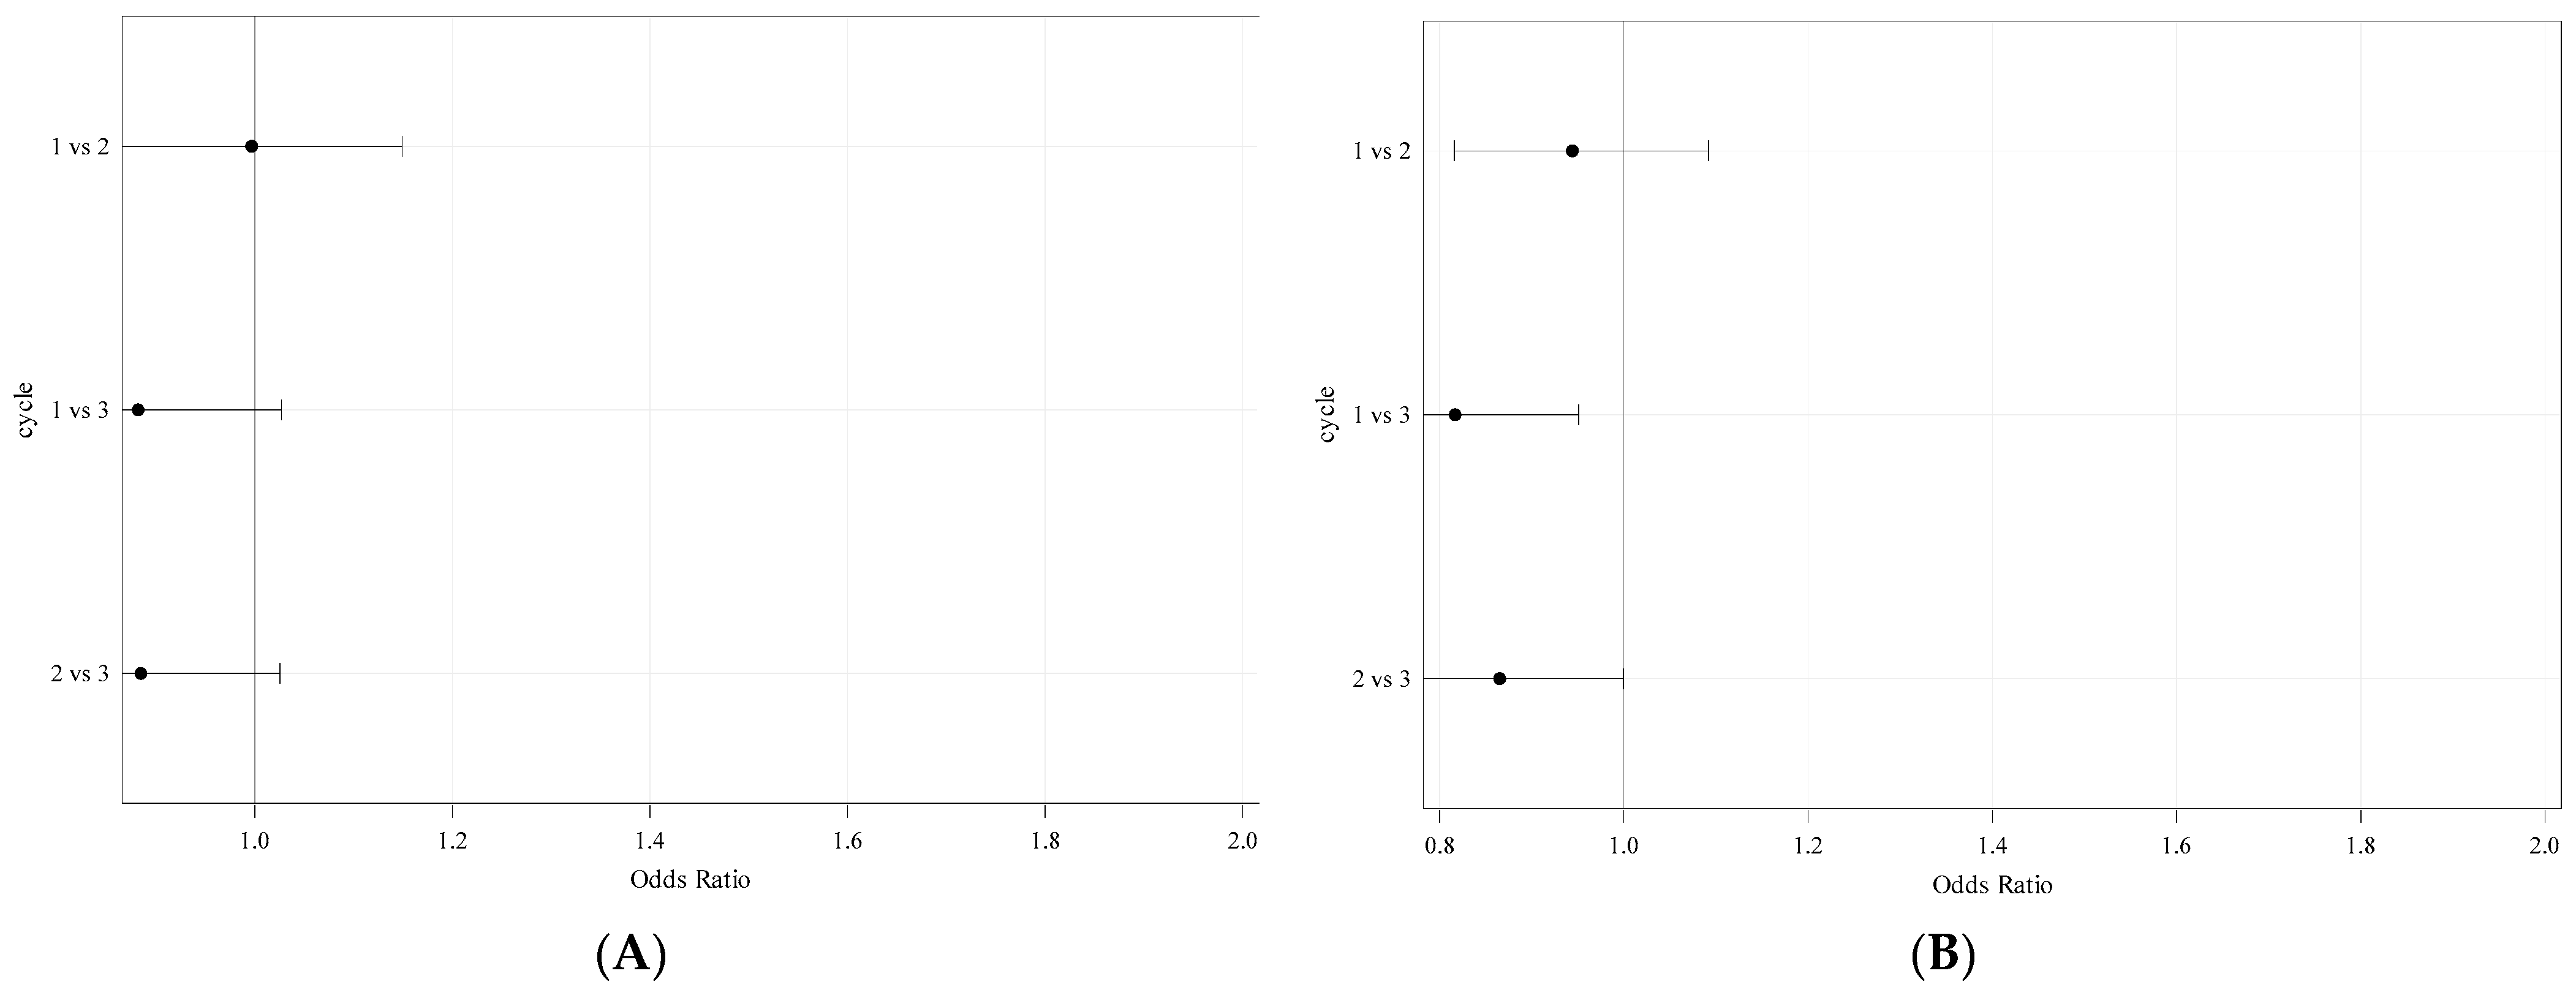
3.4. Duration of Cycle

In strawberry phenology, some of the stages happen at the same time, overlapping with each other. Therefore, the total duration from stage one to stage six in ‘Albion’ was 51, 56, and 47 days, and for ‘San Andreas’, it took 43, 54, and 46 days for cycles 1, 2, and 3, respectively (Figure 5). Cycle 2 was the longest period for both cultivars, with 56 and 54 days, which might be attributed to winter low temperatures during that period. The shortest period for ‘Albion’ was cycle 3, with 47 days, and for ‘San Andreas’, it was cycle 1, with 43 days. In general, the ‘Albion’ cultivar was the one that needed more time to reach maturity during the three cycles, with an average of 51 days; meanwhile, ‘San Andreas’ needed less time, with an average of 47 days. The comparison between cycles showed no significant differences among the three cycles for ‘Albion’, however, it showed significant differences between cycles 1 and 3 for ‘San Andreas’ (Figure 6).

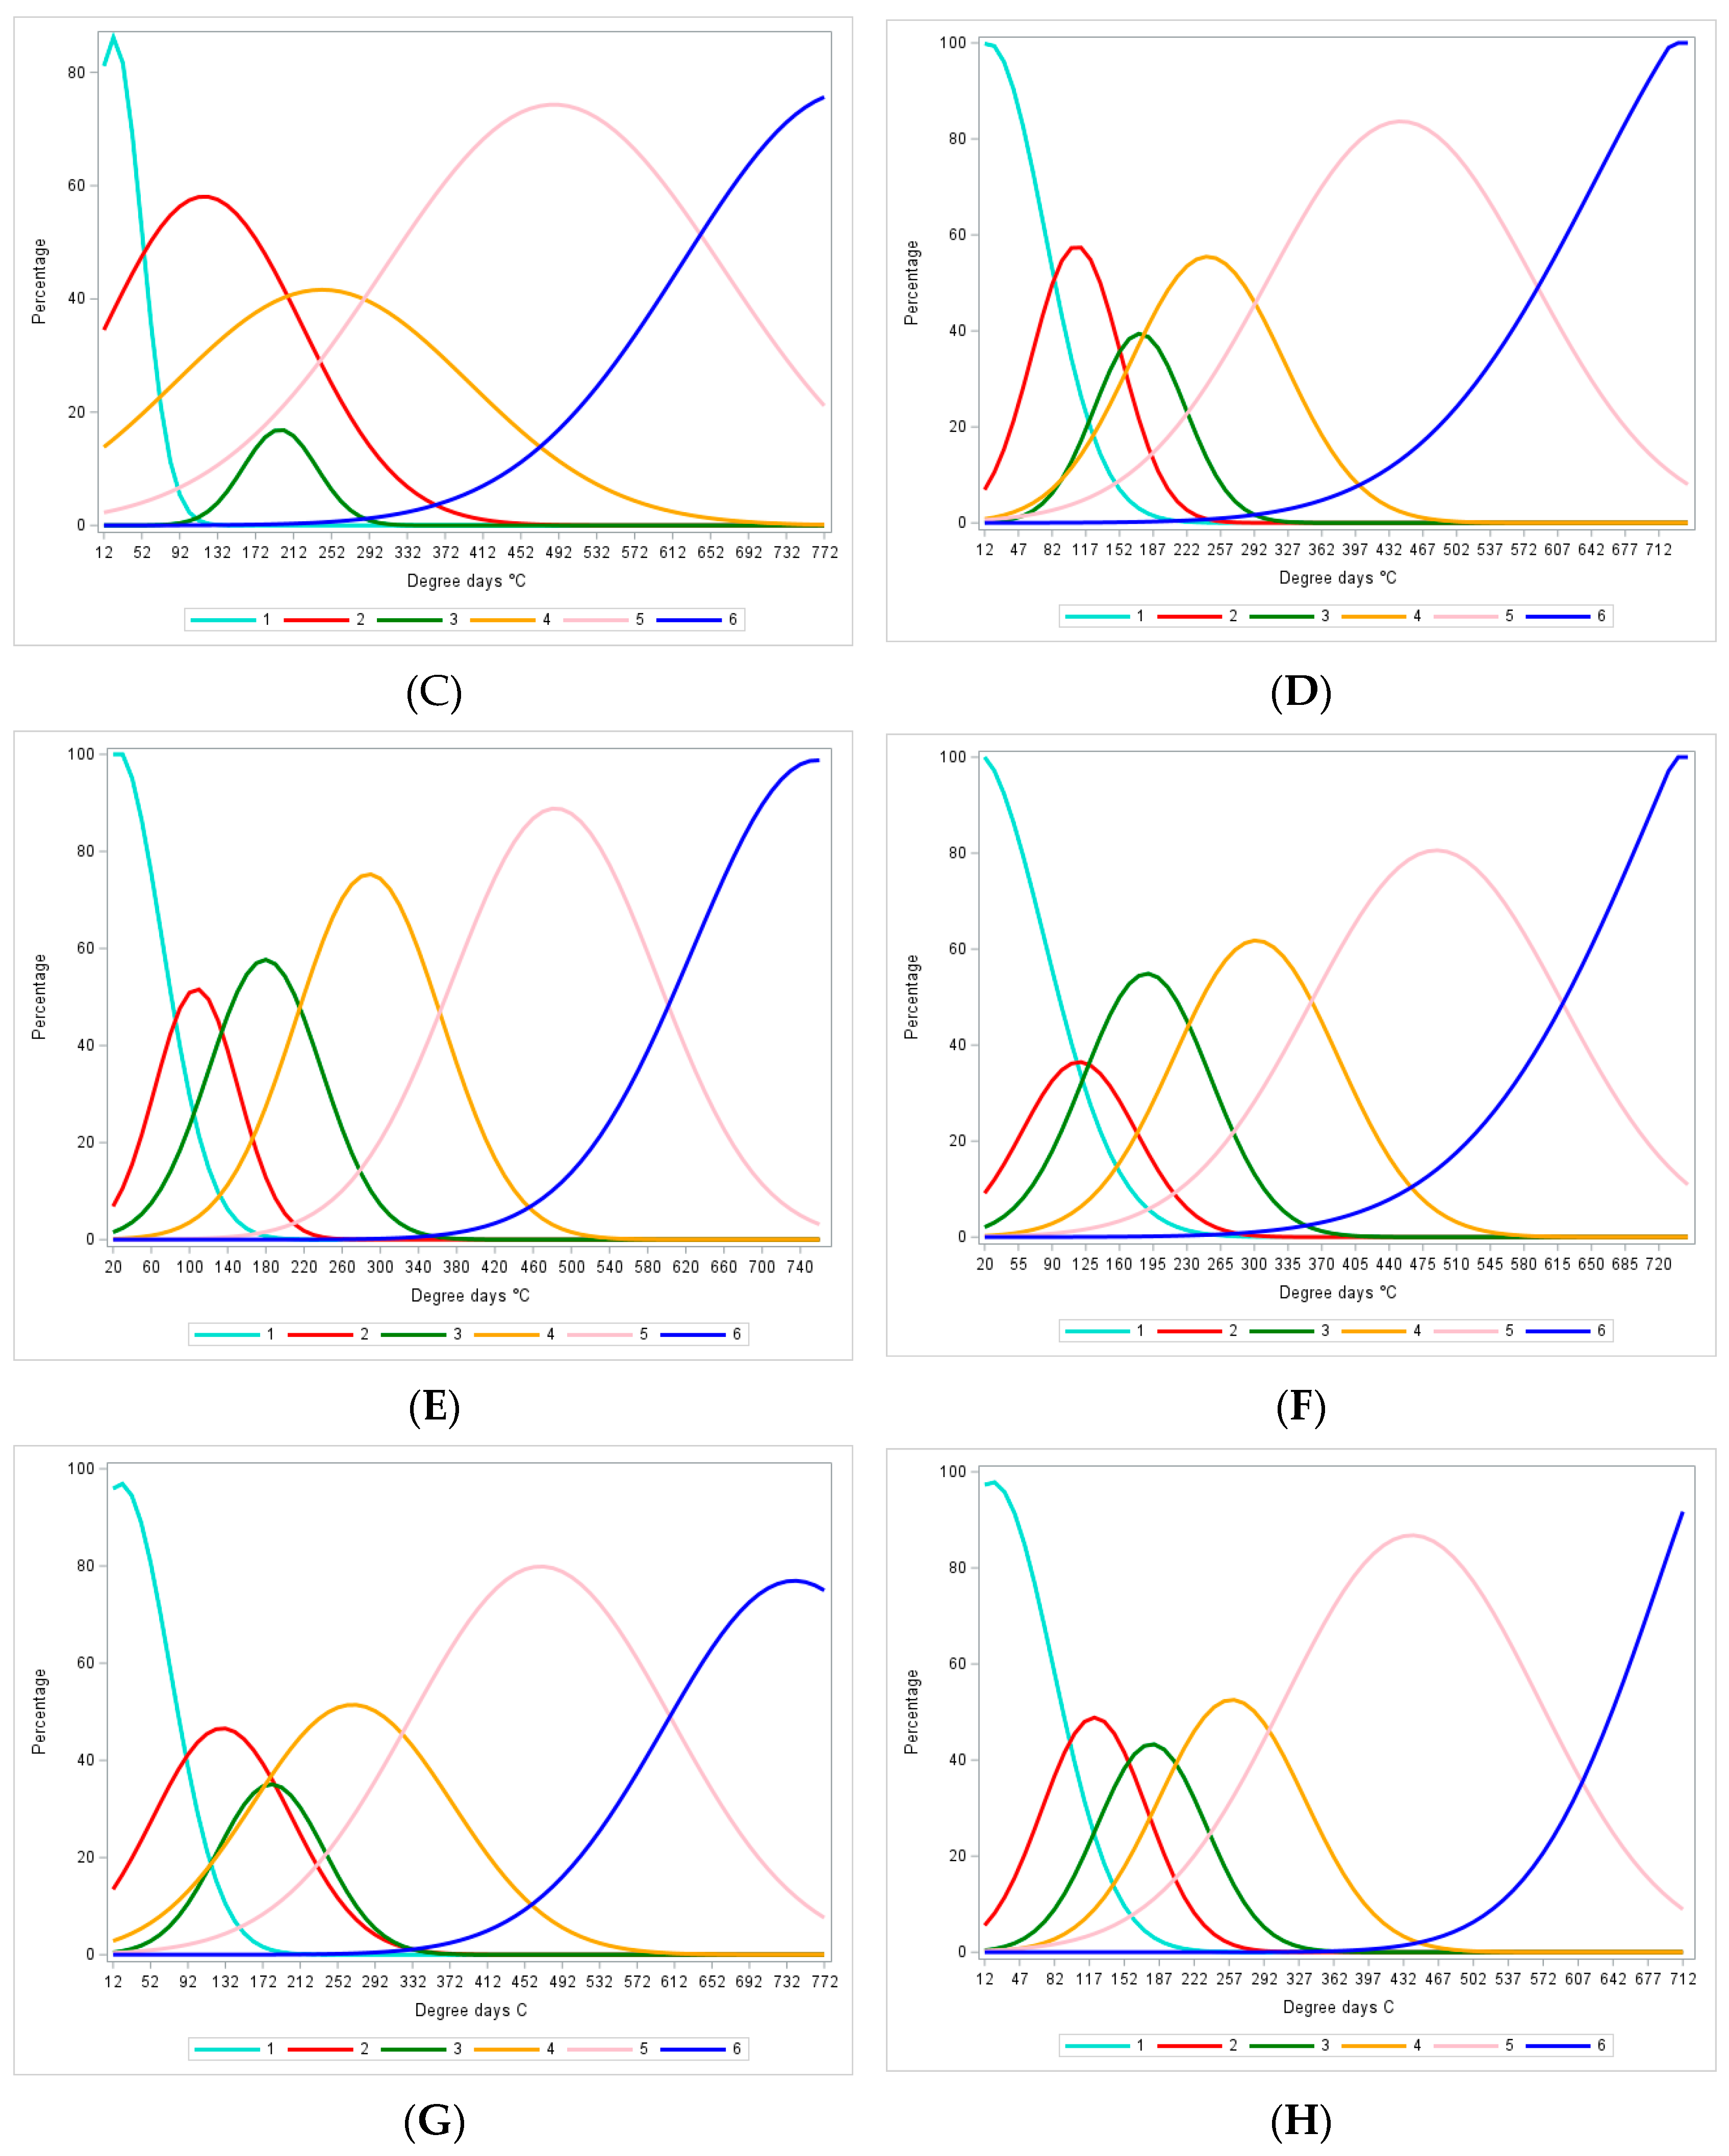
3.5. Estimating the Parameters of the Model

Parameters were estimated for the development of an individual phenological model for each cycle and cultivar. The GDD accumulation was different for each of the three cycles, being 17 (cycle 1), 12 (cycle 2), and 20 (cycle 3) GDD. Both cultivars reached around 700 GDD for the completion of the stages (Figure 7). Overlapping among all stages was observed. All the buds (100%) started in stage one, and each flower independently started to shift to the next stages. In both cultivars, stages 1 and 6 reached 100%, except for stage 6 in cycle 1 for ‘Albion’, where only 50% was reached (Figure 7A). Stage 5 was the one following, with 70–98% in all the cycles and in both cultivars. Stage 6 (blue) reaching 100% means that all floral buds reached maturity. This happened for ‘San Andreas’ for the three cycles (Figure 7B,D,F), but not for ‘Albion’ in cycles 1 and 2 (Figure 7A,C). There were eight buds that stopped their development in stages 3 and 4 for the ‘Albion’ cultivar, reducing the percentage in stage 6 for cycles 1 and 2 in ‘Albion’. To obtain a general model per cultivar (Figure 7G,H), parameters for the three cycles (Figure 8) were averaged since no significant differences (p-value <0.0001) in the stages’ parameters among cycles were found.

3.6. Sensitivity of the Model

To evaluate the sensitivity of the model to changing temperatures, the model was run two more times for each stage with a temperature modification, keeping the same date of appearance of the stages. Two scenarios were considered: (i) temperature increases by 1 °C and (ii) temperature decreases by 1 °C. The results of the variability of duration for each stage and cultivar are presented (Table 2). Assuming the GDD requirement per stage would be the same, the only changing factor would be the time in which those GDD requirements are reached depending on the temperature variations. The model results reflect that the duration of stages will not be affected but the starting day will be accelerated or delayed, except for stages for stages 1 and 2 depending on the cycle. This means that if the temperature increases or decreases by 1 °C, it will affect only the last stage’s starting day, which, in general, will change the dates for harvesting the crop (Figure 9). According to the simulations, if temperature increases, the GDD will be higher, and vice versa. This happens because with higher temperatures, the GDD increases, thus the accumulation will be higher than if the temperature decreases. Regarding the days, it will also be affected in opposition of this trend. When temperature increases, the beginning of a stage will be accelerated by days, and if the temperature decreases, the beginning of the stage will be delayed. Therefore, as the opposite of the function of calendar time, the temperature will be the determining factor for the beginning of each stage and cycle and probably its duration from anthesis to ripening in the strawberry flower.

3.7. Model Evaluation

The close agreement between observed and simulated values with the 1:1 line and the low RRMSE for ‘Albion’ (5.81) and ‘San Andreas’ (5.34) confirmed a satisfactory model fit for each of the cycles. Linear regression analysis was performed on the percent of predicted vs. observed for each phenological stage for each cycle to closely evaluate the possible bias of the model. The observed vs. the simulated values by each cycle and the mean of the three cycles for all the stages and cultivars evaluated are presented (Figure 10). Letters in Figure 10 are represented as cycle 1 (A and B), cycle 2 (C and D), and cycle 3 (E and F), and the means of the three cycles for all the stages (1–6) and cultivars are shown.
In general, there was a very good relationship between observed and simulated percentages in each phenological stage, with an RMSE ranging from 4.22 to 15.17 for ‘Albion’ and from 3.56 to 13.23 for ‘San Andreas’. The RMSE for the three different models for cycles ranges from 5.82 to 9.87 and from 6.07 to 8.97 for ‘Albion’ and ‘San Andreas’, respectively (Table 3). The RMSE for the mean of the models was 5.83 and 5.34 for ‘Albion’ and ‘San Andreas’, respectively (Figure 10G,H).

4. Discussion

4.1. Flowering Rate

Tracking the different phenological stages from floral bud to ripening demonstrates detailed morphological changes associated with phenology influenced directly by temperatures and other factors. In this study, temperature or DLI was correlated negatively with the percentage of flowers reaching flowering, which indicates that there were other factors influencing flowering initiation, such as photoperiod [44].

4.2. Identification and Duration of Stages

The development of the flower is preceded by vegetative development, which is why some researchers have focused on evaluating the whole plant phenology including leaves, stolons, and flowers [35,43,45]. Some others have taken the second step of evaluating specifically the flowering phenology, which is limited to inflorescence or flower development [46,47]. This study contemplates the flower–fruit development together and the different stages from floral bud to ripening. Three of the six stages of this study describe flower phenology, which were also identified before in a study of strawberry flower biology [47]. The same six stages were described in terms of GDD and DAP with an accumulation starting from the planting date, which considers the whole plant phenology including vegetative and reproductive stages [45]. Meanwhile, this study allows knowing the duration of each flower phenological stage in terms of DAT and GDD with different starting points for each cycle, and this would complement other research results [45].
By knowing the duration of each stage, we can predict the sensitivity of flower phenological stages to changing climatic factors to reliably know the duration of these stages under different scenarios. Complementing in this way, another study made for the strawberry plant phenology showed that phenological processes are expected to occur earlier in the future due to the changing climate conditions [48]. In the past, the strawberry phenological stages were determined based on calendar days; however, due to the temperature’s variability through time and location dependence, this method is not feasible. Thus, calculating the duration of stages in GDD can reliably predict the onset of all phenological stages [49].

4.3. Duration of Cycle

The complete cycle from floral bud to ripe strawberry has different durations; for both cultivars, cycle 2 took more days, and it might be attributed to low temperatures during that period (16.6 °C) since temperature triggers development but not growth [50]. Nevertheless, if compared to other studies that have evaluated the duration in days from anthesis to ripening, we found that the three cycles were longer. Different studies suggest that the duration of the flower–fruit cycle goes from 20–40 days [18,51,52]. We found that indoor hydroponic phenology needs more time for flower phenological processes to be completed. In terms of GDD from floral bud to ripening, the observed values ranged between 600 and 800 GDD in accordance with a study that reports 586–946 GDD for first and secondary flowers [51].
These results indicate that the ‘Albion’ cultivar, besides taking more time for flower–fruit development, also could be more susceptible to some possible factors, such as pollination [53], light, temperatures, and pests, that could interrupt the flower development. During the production season, there were some pest pressures, such as thrips that feed on pollen, reducing the pollen available for flower pollination. Besides that, indoor pollination was also an issue, and different methods were applied, such as bumblebees, hand pollination, and shaking bush. These might have been some of the factors affecting the performance of the ‘Albion’ cultivar.

4.4. Estimating the Parameters of the Model

The Gaussian model was used, and the curves were adjusted (Figure 6). Furthermore, the Gaussian model of the flower stages is novel to these types of studies, and the RMSE was 5.83% for ‘Albion’ and 5.34% for ‘San Andreas’, indicating that the models fit well with the data. The same phenological process has been investigated in the sour cherry by using the GDD accumulation but implementing non-linear logistic equations fitted as a percentage of the final fruit diameter in this case [38]. These models confirmed that the whole population of buds sampled spread through the different stages at the same time for both cultivars, causing an overlapping during the whole cycle for three consecutive cycles. The model showed that 100% of the buds reached stages 1 and 6 because all buds were chosen when they were in stage 1 and all of them reached stage 6 except for ‘Albion’ in cycles 1 and 2. For both cultivars, stage 5 was the one that needed more GDD to be completed, which makes sense since during that stage is when the fruit is gaining weight and the plant is working towards biomass allocation in the fruit.

4.5. Model Simulations

Observed and predicted values were compared for the starting days of all stages. Differences among cycles ranged from 1 to 3 days. Increases or decreases in temperature caused acceleration or delay in phenology by 3 days on average. The opposite happens with GDD; if the temperature rises, the observed GDD will be reached sooner, and later if the temperature drops. Different climate scenarios and their impact on the dates to reach the stages of sour cherry have been simulated. They found that some stages are delayed more than others, as occurred in our study for stages 3, 4, and 5 for both cultivars [38].
This model is specific for flower–fruit development but does not take into consideration plant phenology, which is a very important factor. The crop management recommendations can be done once the whole plant phenology is described and modeled. The rationale for this is that the strawberry plant has all the stages and cycles overlapping all the time, especially in the day-neutral plants, thus there will be open flowers at the beginning and the end of the production cycle. What growers need to know is when there will be the highest percentage of flowers to plan on introducing the pollinators and control pests more carefully, manage nutritional balance for fruit production, and some other decisions. Appropriate management recommendations can be made when the whole plant phenology is included [54]. This study’s results are complementary to other studies that have evaluated not only the flower–fruit phenology but also the crop growing and crop management components.
Regarding the model, other functions can be tested in the future to model the flower–fruit phenology, such as the gamma trend, and mathematical models can be applied by obtaining the daily increment rate for all stages to make iterative simulations. Models such as CROPGROW that consider the whole plant performance can be tested with certain limitations and assumptions [28].

5. Conclusions

Strawberry phenological stages overlap with each other from floral bud to ripe berry for both cultivars. Because of this asynchronism, different percentages were observed for each stage, and not all of them reached 100%. Some buds for ‘Albion’ stopped their development at stage 4 or 5, while in ‘San Andreas’, all buds reached maturity. This indicates that ‘Albion’ might be more sensitive than ‘San Andreas’ to biotic or abiotic conditions. The duration of the stages in days was longer for ‘Albion’ than for ‘San Andreas’. This might be caused by different factors such as pollination, temperature, genetics, and others, however, further research will be needed to know the reason. The stage that needed more days to be completed was stage 5 (fruit development), which makes complete sense since during this stage the fruit is gaining size for later ripening. Lower temperatures in December slowed the development of the flowers for both cultivars, needing more days to accomplish complete ripening. We were able to model the development of the phenological cycle from flower to fruit of strawberries. The sensitivity of the model indicates that when the temperature changed, the starting day was speeded or delayed.
Overall, a question that emerges with the results of this study is whether this is valid for outdoor temperatures or only for greenhouse conditions. This can be answered through a validation process that is recommended for future work. Then, validating temperature from outdoor conditions, running the model, and analyzing the similarities or differences can be performed with the new results. In addition, considering that the base temperature used is referenced in previous studies on flowering, it is assumed that the base temperature is cultivar-specific. Thus, further research is recommended to know the exact base temperature for these cultivars. It is important to conduct the same process of simulations and model sensitivity evaluation with the new base temperatures. Lastly, this study has generated a basis for a complete crop model, which will include growth and development for the prediction of yield. However, knowing the phenological responses and how the climate variables influence the stages will be helpful to the future prediction of harvest timing.

Author Contributions

Conceptualization, M.S.-G.; Methodology, N.H.-M., M.S.-G. and B.C.-C.; Formal analysis, N.H.-M., M.S.-G. and B.C.-C.; Investigation, N.H.-M.; Resources, M.S.-G.; Writing—original draft, N.H.-M.; Writing—review & editing, M.S.-G., B.C.-C., D.W., W.F. and A.M.; Visualization, N.H.-M., M.S.-G. and B.C.-C.; Supervision, M.S.-G.; Funding acquisition, M.S.-G. All authors have read and agreed to the published version of the manuscript.

Funding

AAES Awards for Production Agriculture Research (PAR), Seed grant Auburn University Grants # 370228-303927-2055; 103628-303927-2055, USDA grant #204857-1214011-2002 USDA-58-6010-1-006-MS United States Department of Agriculture.

Conflicts of Interest

The authors declare no conflict of interest.

References

  1. Darnell, R.; Cantliffe, D.; Kirschbaum, D.; Chandler, C. The physiology of flowering in strawberry. Hortic. Rev. 2003, 28, 325–349. [Google Scholar] [CrossRef]
  2. Sønsteby, A.; Roos, U.; Heide, O. Phenology, flowering, and yield performance of 13 diverse strawberry grown under Nordic field conditions. Acta Agric. Scand. Sect. B-Soil Plant Sci. 2016, 67, 278–283. [Google Scholar] [CrossRef]
  3. Heide, O.; Stavang, J.; Sonsteby, A. Physiology and genetics of flowering in cultivated and wild strawberries—A review. J. Hortic. Sci. Biotechnol. 2013, 88, 1–18. [Google Scholar] [CrossRef]
  4. Serce, S.; Hancock, J. The temperature and photoperiod regulation of flowering and runnering in the strawberries, Fragaria chiloensis, F. virginiana, and F. x ananassa. Sci. Hortic. 2005, 103, 167–177. [Google Scholar] [CrossRef]
  5. Sønsteby, A.; Heide, O. Long-day control of flowering in everbearing strawberries. J. Hortic. Sci. Biotechnol. 2007, 82, 875–884. [Google Scholar] [CrossRef]
  6. Manakasem, Y.; Goodwinm, P. Using the floral status of strawberry plants, as determined by stereomicroscopy and scanning electron microscopy to survey the phenology of commercial crops. J. Am. Soc. Hort. Sci. 1998, 123, 513–517. [Google Scholar] [CrossRef]
  7. Durner, E.F.; Poling, E.B. Early season yield response of selected strawberry cultivars to photoperiods and chilling in a Florida Winter production system. J. Am. Soc. Hort. Sci. 1986, 111, 53–56. [Google Scholar] [CrossRef]
  8. Durner, E.F.; Barden, J.A.; Himelrick, D.G.; Poling, E.B. Photoperiod and temperatura effects on flower and runner development in day-neutral, June bearing and everbearing strawberries. J. Am. Soc. Hortic. Sci. 1984, 109, 396–400. [Google Scholar] [CrossRef]
  9. Gude, K.; Stanley, H.; Rivard, C.L.; Cunningham, B.; Kang, Q.; Pliakoni, E.D. Quality of day-neutral strawberries grown in a high tunnel system. Sci. Hortic. 2021, 275, 109726. [Google Scholar] [CrossRef]
  10. Rowley, D.; Black, B.L.; Drost, D. Late-season strawberry production using day-neutral cultivars in hight-elevation hight tunnels. HortScience 2011, 46, 1480–1485. [Google Scholar] [CrossRef]
  11. Lopez, G.; Runkle, E. Growing your Crops above Their Base Temperature. The Basics and Beyond. Purdue University. Greenhouse Grower. 2014. Available online: https://www.purdue.edu/hla/sites/cea/wp-content/uploads/sites/15/2014/07/BasicsandBeyond-July.pdf (accessed on 21 August 2023).
  12. Rosa, H.T.; Walter, L.C.; Streck, N.A.; Andriolo, J.L.; da Silva, M.R.; Langner, J.A. Base temperature for leaf appearance and phyllochron of selected strawberry cultivars in a subtropical environment. Bragantia Camp. 2011, 70, 939–945. [Google Scholar] [CrossRef]
  13. Strand, L.L. Strawberry growth and development. In Integrated Pest Management for Strawberries; CAB International: Davis, CA, USA, 1994. [Google Scholar]
  14. Zeist, A.; Resende, J.; Lima, R.; Gabriel, A.; Henschel, J.; Silva, I. Phenology and agronomic components of first and second-cycle strawberry. Hortic. Bras. 2019, 37, 29–34. [Google Scholar] [CrossRef]
  15. Mendonca, H.; Oliveira, E.; Castoldi da Costa, R.; Nienow, A. Performance production of strawberry in environment cultivated with fig tree. Rev. Bras. Frutic. 2016, 39, e-615. [Google Scholar] [CrossRef]
  16. Menzel, C. No evidence of Excessive leaf production by strawberries grown in the subtropics. Agriculture 2019, 9, 197. [Google Scholar] [CrossRef]
  17. Doving, A.; Mage, F. Prediction of strawberry fruit yield. Acta Agric. Scand. Sect. B-Plant Soil Sci. 2010, 51, 35–42. [Google Scholar] [CrossRef]
  18. Krüger, E.; Josuttis, M.; Nestby, R.; Toldam-Andersen, T.; Carlen, C.; Mezzetti, B. Influence of growing conditions at different latitudes of Europe on strawberry growth performance, yield, and quality. J. Berry Res. 2012, 2, 143–157. [Google Scholar] [CrossRef]
  19. Geoffrey, T.; Bi, G.; Zhang, Q.; Harkess, R.; Li, T. High-tunnel production of strawberries using black and red plastic mulches. Horticulturae 2020, 6, 73. [Google Scholar] [CrossRef]
  20. Alavarado-Raya, H.; Vásquez-Rodríguez, J.; Ramírez-Arias, A.; Calderón-Zavala, G.; Rivera-del-Rio, R. Phenology and growing degree days of festival strawberry grown on red volcanic rock at two plant densities. Rev. Fitotec. Mex. 2021, 44, 349–356. [Google Scholar] [CrossRef]
  21. Martin, C.; Fountain, M.; Brown, M. Varietal and seasonal differences in the effects of commercial bumblebees on fruit quality in strawberry crops. Agric. Ecosyst. Environ. 2019, 281, 124–133. [Google Scholar] [CrossRef]
  22. Johnson, A.; Simpson, D. The effect of deficit irrigation on the flowering behavior of two day-neutral and one everbearing strawberry cultivar. Acta Hortic. 2014, 1049, 435–438. [Google Scholar] [CrossRef]
  23. Hajiboland, R.; Moradtalab, N.; Eshaghi, Z.; Feizy, J. Effect of silicon supplementation on growth and metabolism of strawberry plants at three developmental stages. N. Z. J. Crop Hortic. Sci.-Taylor Fr. 2018, 46, 144–161. [Google Scholar] [CrossRef]
  24. Trejo-Téllez, L.; Gómez-Merino, F. Nutrient management in strawberry: Effects on yield, quality, and plant health. In Strawberries: Cultivation, Antioxidant Properties and Health Benefits, 1st ed.; Malone, N., Ed.; Nova Science Publishers: Veracruz, Mexico, 2014; pp. 239–267. Available online: https://www.researchgate.net/publication/268037619 (accessed on 7 July 2023).
  25. Vervoort, M.; Meli, P.; Hanssens, J.; Craeye, S.; Pisman, M.; Smagghe, G.; Clymans, R.; Belien, T. Thrips control with predatory mites A. limonicus and A. swirskii in different strawberry cultivation systems. Acta Hortic. 2017, 1156, 833–841. [Google Scholar] [CrossRef]
  26. Wang, R.; Eguchi, M.; Gui, Y.; Iwasaki, Y. Evaluating the effect of light intensity on flower development uniformity in strawberry (Fragaria × ananassa) under early induction conditions in forcing culture. HortScience 2020, 55, 670–675. [Google Scholar] [CrossRef]
  27. Hummer, K.; Bassil, N.; Zurn, J.; Amyotte, V. Phenotypic characterization of strawberry (Fragaria × ananassa Duchesne ex Rosier) diversity collection. Plants People Planet 2022, 5, 209–224. [Google Scholar] [CrossRef]
  28. Hopf, A.; Boote, K.; Oh, J.; Guan, Z.; Agehara, S.; Shelia, V.; Whitaker, V.; Asseng, S.; Zhao, X.; Hoogenboom, G. Development and improvement of the CROPGRO-Strawberry model. Sci. Hortic. 2022, 291, 110538. [Google Scholar] [CrossRef]
  29. Whiting, M.D.; Salazar, M.R.; Hoogenboom, G. Development of bloom phenology models for tree fruits. Acta Hortic. 2015, 1068, 107–112. [Google Scholar] [CrossRef]
  30. Salazar, M.R.; Jones, J.W.; Chaves, B.; Cooman, A.; Fischer, G. Base temperature and simulation model for nodes appearance in Cape gooseberry (Physalis peruviana L.). Rev. Bras. Frutic. Jaboticabal 2008, 30, 862–867. [Google Scholar] [CrossRef]
  31. Lu, Y.; Gong, M.; Li, J.; Ma, J. Optimizing Controlled Environmental Agriculture for Strawberry Cultivation Using RL-Informer Model. Agronomy 2023, 13, 2057. [Google Scholar] [CrossRef]
  32. Oliveira, L.S.d.; Castoldi, R.; Martins, G.D.; Medeiros, M.H. Estimation of Strawberry Crop Productivity by Machine Learning Algorithms Using Data from Multispectral Images. Agronomy 2023, 13, 1229. [Google Scholar] [CrossRef]
  33. Basak, J.K.; Paudel, B.; Kim, N.E.; Deb, N.C.; Kaushalya Madhavi, B.G.; Kim, H.T. Non-Destructive Estimation of Fruit Weight of Strawberry Using Machine Learning Models. Agronomy 2022, 12, 2487. [Google Scholar] [CrossRef]
  34. Raj, R.; Cosgun, A.; Kuli’c, D. Strawberry Water Content Estimation and Ripeness Classification Using Hyperspectral Sensing. Agronomy 2022, 12, 425. [Google Scholar] [CrossRef]
  35. Labadie, M.; Denoyes, B.; Guédon, Y. Identifying phenological phases in strawberry using multiple change-point models. J. Exp. Bot. 2019, 70, 5687–5701. [Google Scholar] [CrossRef]
  36. Sønsteby, A.; Heide, O.M. Temperature responses, flowering and fruit yield of the June-bearing strawberry cultivars Florence, Frida and Korona. Sci. Hortic. 2008, 119, 49–54. [Google Scholar] [CrossRef]
  37. Opstad, N.; Sønsteby, A.; Myrheim, U.; Heide, O.M. Seasonal timing of floral initiation in strawberry: Effects of cultivar and geographic location. Sci. Hortic. 2011, 129, 127–134. [Google Scholar] [CrossRef]
  38. Zavalloni, C.; Andresen, J.A.; Flore, J.A. Phenological models of flower bud stages and fruit growth of ‘Montmorency’ sour cherry based on growing degree-day accumulation. J. Amer. Soc. Hort. Sci. 2006, 131, 601–607. [Google Scholar] [CrossRef]
  39. Meier, U.; Bleiholder, H.; Buhr, L.; Feller, C.; Hack, H.; Hess, M.; Lancashire, P.; Schnock, U.; Stoß, R.; Boom, T.; et al. The BBCH system to coding the phenological growth stages of plants. Nachrichtenbl. Deut. Pflanzenschutzd 1994, 46, 141–153. [Google Scholar]
  40. Willmott, C.J. On the validation of models. Phys. Geogr. 1981, 2, 184–194. [Google Scholar] [CrossRef]
  41. Willmott, C.J. Some comments on the evaluation of model performance. Bull. Am. Meteorol. Soc. 1982, 63, 1309–1313. [Google Scholar] [CrossRef]
  42. Willmott, C.J.; Ackleson, S.G.; Davis, R.E.; Feddema, J.J.; Klink, K.M.; Legates, D.R.; O’Donnell, J.; Rowe, C.M. Statistics for the evaluation and comparison of models. J. Geophys. Res. Ocean. 1985, 90, 8995–9005. [Google Scholar] [CrossRef]
  43. Janssen, P.H.; Heuberger, P.S. Calibration of process-oriented models. Ecol. Model. 1995, 83, 55–66. [Google Scholar] [CrossRef]
  44. Konsin, M.; Voipio, I.; Palonen, P. Influence of photoperiod and duration of short-day treatment on vegetative growth and flowering of strawberry (Fragaria × ananassa Duch.). J. Hortic. Sci. Biotechnol. 2015, 76, 77–82. [Google Scholar] [CrossRef]
  45. Alvarado-Raya, H.E.; Rivera-del-Rio, R.; Ramirez-Arias, A.; Calderon-Zavala, G. Phenological description of three Mexican new cultivars of strawberry (Fragaria × ananassa Dutch.) in vegetative propagation grown on volcanic gravel. Acta. Hortic. 2019, 1265, 281–285. [Google Scholar] [CrossRef]
  46. Krüger, E.; Woznicki, T.L.; Heide, O.M.; Kusnierek, K.; Rivero, R.; Masny, A.; Sowik, I.; Brauksiepe, B.; Eimert, K.; Mott, D.; et al. Flowering phenology of six seasonal-flowering strawberry cultivars in a coordinated European study. Horticulturae 2022, 8, 933. [Google Scholar] [CrossRef]
  47. Madhuri, K.; Manju; Nidhika, T. Studies on floral biology in strawberry (Fragaria x ananassa) under hilly conditions of Uttarakhand (bearing habit, time and duration of flowering, bud development, flower characters, antesis, and dehiscence). Int. J. Agric. Sci. 2016, 8, 3177–3180. Available online: http://www.bioinfopublication.org/jouarchive.php?opt=&jouid=BPJ0000217 (accessed on 25 January 2023).
  48. Bethere, L.; Sile, T.; Sennikovs, J.; Bethers, U. Impacto f climate change on the timing of strawberry phenological processes in the Baltic States. Est. J. Earth Sci. 2016, 65, 48–58. [Google Scholar] [CrossRef]
  49. Parra-Coronado, A.; Fischer, G.; Chaves-Cordoba, B. Thermal time for reproductive phenological stages of pineapple guava (Acca sellowiana (O. Berg) Burret). Acta Biol. Colomb. 2015, 20, 163–173. [Google Scholar] [CrossRef]
  50. Le Miere, P.; Hadley, P.; Darby, J.; Battley, H. The effect of termal environment, planting date and crown size on growth, development and yield of Fragaria × ananassa Dutch. Cv Elsanta. J. Hortic. Sci. Biotechnol. 1998, 73, 786–795. [Google Scholar] [CrossRef]
  51. Cao, Z.; Qu, H. Simulation-based modelling of growth and pollination of greenhouse strawberry. arXiv 2022, arXiv:2210.14522. [Google Scholar] [CrossRef]
  52. McWhirt, A. Part I|Annual Plasticulture Strawberry Basics & Crop Development. Southeastern Plasticulture Strawberry School, University of Arkansas. 2021. Available online: https://www.youtube.com/watch?v=TcfUYv5rSRc&t=37s (accessed on 21 August 2023).
  53. Cao, Z.; He, G.; Mu, S.; Qu, H. Effects of Bee Density and Hive Distribution on Pollination Efficiency for Greenhouse Strawberries: A Simulation Study. Agronomy 2023, 13, 731. [Google Scholar] [CrossRef]
  54. Salazar, M.R.; Chaves-Cordoba, B.; Jones, J.W.; Cooman, A. A simple phenological and potential production model for cape gooseberry (Physalis peruviana L.). In ISHS Acta Horticulturae 718, Proceedings of the III International Symposium on Models for Plant Growth, Environmental Control and Farm Management in Protected Cultivation (HortiModel 2006); Marcelis, L.F.M., van Straten, G., Stanghellini, C., Heuvelink, E., Eds.; ISHS: Wageningen, The Netherlands, 2006. [Google Scholar]
Figure 1. Maximum and minimum temperatures under hydroponic systems during the 2022–2023 production season. In red is the maximum and in blue is the minimum temperature.
Agronomy 13 02489 g001
Figure 2. Percentage of plants reaching reproductive stage by showing the first inflorescence starting at DAT 29 until DAT 112.
Agronomy 13 02489 g002
Figure 3. ‘Albion’ and ‘San Andreas’ scales of the phenological stages from floral bud to ripe berry. CB = close bud (stage 1), OF = open flower (stage 2), PF = petal fall (stage 3), GF = green fruit (stage 4), FD = fruit development (stage 5), and R = ripening–maturity (stage 6).
Agronomy 13 02489 g003
Figure 4. Percentage of stages per cycle by cultivar, expressed in GDD using a Tb of 3 °C.
Agronomy 13 02489 g004
Figure 5. Duration in number of days from flower bud to ripe strawberry for each cycle for both cultivars, ‘Albion’ and ‘San Andreas’.
Agronomy 13 02489 g005
Figure 6. Cycle comparison of the stages’ probability distribution by cultivar ‘Albion’ (A) and ‘San Andreas’ (B). Intervals reaching the 1 vertical line means no significant difference.
Agronomy 13 02489 g006
Figure 7. Models for ‘Albion’ on the left and ‘San Andreas’ on the right for all phenological stages (1 to 6) and the three cycles starting with 17 GDD (Cycle 1 (A,B)), 12 GDD (Cycle 2 (C,D)), and 20 GDD (Cycle 3 (E,F)). General model with the averaged parameters from the 3 cycles initiate from 12 to 772 for ‘Albion’ (G) and from 12 to 712 GDD for ‘San Andreas’ (H).
Agronomy 13 02489 g007aAgronomy 13 02489 g007b
Figure 8. Parameters estimated by stage for ‘Albion’ (top) and ‘San Andreas’ (bottom) for the three cycles (blue—cycle 1, red—cycle 2, and green—cycle 3).
Agronomy 13 02489 g008
Figure 9. Sensitivity of the model by stage with temperature variation by increasing 1 °C or decreasing 1 °C. Models for ‘Albion’ on the left and ‘San Andreas’ on the right for all phenological stages (1 to 6) and the three cycles. Cycle 1 (A,B), Cycle 2 (C,D), and Cycle 3 (E,F).
Agronomy 13 02489 g009
Figure 10. Model validation 1:1 curve observed vs. predicted. Models for ‘Albion’ on the left and ‘San Andreas’ on the right for all phenological stages and the three cycles. Cycle 1 (A,B), Cycle 2 (C,D), and Cycle 3 (E,F). General model with the averaged parameters from the three cycles for ‘Albion’ (G) and ‘San Andreas’ (H).
Agronomy 13 02489 g010aAgronomy 13 02489 g010b
Table 1. Initial and final DAT and GDD for each stage with respective duration in days and GDD for each cultivar cycle and stage.
CultivarCycleStageInitial DATFinal DATInitial GDDFinal GDDDuration in DATDuration in GDD
‘Albion’1142551722213205
1244594828715239
1347669237819286
14487310847125363
15528816969336524
16699341676024344
21105114121409128
221071263729419257
2311213011134918238
2411314512754732420
2512015814573238587
2614016147977621297
311681782018510165
321701835525513200
331721918836819280
3417619415742418267
3518321125570428449
3619321540576722362
‘San Andreas’1142531718511168
1245556222210160
13485810827010162
14506613837816240
15548020356926366
16688540364617243
211051171217912167
221071263729419257
231111319536020265
2411414214050628366
2512115414567333528
2613615941274623334
311681782018510165
321691833925514216
331721888832216234
3417320410559331488
3518121022968829459
3619621445775218295
Table 2. Starting DAT for each stage with temperature variation of plus and minus 1 °C assuming the GDD requirements per stage are constant.
CultivarCycleStageOriginal1 °C More1 °C Less
Initial DATInitial GDDInitial DATInitial GDDInitial DATInitial GDD
‘Albion’11421742174217
12444844484448
13479247924792
14481084810849108
15521695116953169
16694166141671416
21105121051210512
22107371073710737
23112111111111113111
24113127112127114127
25120145119145121145
26140479138479143479
31168201682016820
32170551705517055
33172881728817288
34176157175157177157
35183255182255184255
36193405192405194405
San Andreas11421742174217
12456245624562
13481084810849108
14501384913851138
15542035320355203
16684036640370403
21105121051210512
22107371073710737
23111951119511195
24114140113140115140
25121145120145123145
26136412134412139412
31168201682016820
32169391693916939
33172881728817288
34173105173105173105
35181229180229182229
36196457194457198457
Table 3. RMSE for each cycle and stage by cultivar.
CycleRMSE ‘Albion’%RMSE ‘San Andreas’
17.335428.97607
29.871647.88368
35.823056.07191
StageCycleCycle
123123
14.221317.264.74353.56338.42084.8128
27.25439.19324.423310.52148.70505.2892
39.71028.96697.743913.23356.00865.4331
47.71497.31926.14316.52118.96454.8997
58.699211.50656.935711.64479.41938.3894
68.815515.17566.808512.55388.76308.7679
Disclaimer/Publisher’s Note: The statements, opinions and data contained in all publications are solely those of the individual author(s) and contributor(s) and not of MDPI and/or the editor(s). MDPI and/or the editor(s) disclaim responsibility for any injury to people or property resulting from any ideas, methods, instructions or products referred to in the content.

