

The Study of Structural Optimization on Hydraulic Performance and Anti-Clogging Performance of Labyrinth Drip Irrigation Emitters

1
School of Hydraulic and Electric Power, Heilongjiang University, Harbin 150080, China
2
Heilongjiang Academy of Black Soil Conservation and Utilization, Harbin 150086, China
*
Authors to whom correspondence should be addressed.
Agronomy 2023, 13(10), 2496; https://doi.org/10.3390/agronomy13102496
Submission received: 28 August 2023
/
Revised: 23 September 2023
/
Accepted: 26 September 2023
/
Published: 27 September 2023
(This article belongs to the Special Issue Improving Irrigation Management Practices for Agricultural Production)
Abstract
:The core component of a properly functioning drip irrigation system is the drip irrigation emitter. Irrigation water containing impurities and sand particles can easily lead to clogging of the drip irrigation emitter, reducing the efficiency of the drip irrigation system. In this paper, orthogonal tests were used to optimize the flow channel structure, combined with the computational fluid dynamics–discrete element method (CFD-DEM) to analyze the flow index and sand particle motion characteristics. Clear water tests and short-cycle anticlogging tests were used to validate the results of the numerical simulation, and the relationship between the hydraulic performance and anti-clogging performance was revealed via linear regression. The results showed that the structural parameters of drip irrigation emitters were important factors affecting the flow index and sand movement characteristics. The order from largest to smallest was the turning angle, amount of interdental reference, flow channel depth, flow channel width, and width of the top base. The sand passage rate and the percentage decrease in velocity can be used as important indicators of anti-clogging performance, and there was a negative correlation between the two indicators. The flow channel with a 65° turning angle had the lowest flow index, and the sand passage rate can reach up to 91.48%; the reason was that the main flow region velocity was higher, the vortex region and the sand energy loss were small, which was not easy to clog. The equation for the relationship between flow index and sand passage rate was a negative correlation for drip irrigation emitters between a 65° and 75° turning angle. The drip irrigation emitter with a 65° turning angle had better hydraulic performance and anti-clogging performance.
1. Introduction
The drip irrigation emitter, as the core component of a drip irrigation system, utilizes the internal structure of the flow channel to fully dissipate the pressurized water flow and drip it into the field with a uniform and stable unpressurized water flow [1]. The fine and complex dimensions of the internal flow channel of a labyrinth-type drip irrigation emitter (only about 1 mm) lead to frequent clogging inside the flow channel [2]. It was shown that the types and structural parameters of the flow channel have the most influence on the hydraulic performance and anti-clogging performance of the drip irrigation emitter [3,4,5,6]. The optimization of the flow channel structure is the most effective method to improve the performance of drip irrigation emitters [7].
Yatish Kumar Baghel et al. [8] simulated four flow channel types of drip emitters using computational fluid dynamics (CFD) and obtained the conclusion that triangular flow channels had the lowest dissipation of energy, and the flow rates were lower than the other three. Li et al. [9] combined four structural parameters: turning angle, tooth spacing, tooth height, and flow channel depth in orthogonal tests, and found that tooth spacing had a significant effect on the flow index and the clogging resistance. Zhang et al. [10] designed thirteen flow channel structures and found that the flow index was positively correlated with the flow channel width and depth and negatively correlated with the flow channel length. Wu et al. [11] analyzed the flow characteristics of a drip irrigation emitter using the standard k-ε model and the large eddy simulation method (LES) to explain the energy dissipation mechanism; it is possible to analyze the probability of the occurrence of a blockage in the flow channel via the characteristics of velocity distributions of different cross sections. Zhou et al. [12] conducted clogging resistance tests using different types of drip irrigation emitters and found that the clogging resistance of drip irrigation emitters depended on the type of structure and size. Zhang et al. [13] proposed a new method using the sand passage rate as the evaluation index for the limitations of the anti-clogging performance evaluation of drip irrigation emitters, and selected four structural parameters for simulation analysis, which provided numerical choices for the structural design of drip irrigation emitter. Yu et al. [14] used the computational fluid dynamics–discrete element method (CFD-DEM) to simulate the flow field in labyrinth-type emitters with turning angles of 90°, 60°, 45°, and 30°. It was suggested that the anti-clogging performance was significantly improved by using drip emitters with turning angles between 90° and 60°.
At present, most of the research was conducted to increase the flow coefficient of drip irrigation emitters or to reduce its flow index by changing the structural parameters. There are fewer studies on the movement of sand particles inside the flow channel and the relationship between hydraulic performance and anti-clogging performance [15,16]. In this paper, the commonly used labyrinth-type emitter was selected for optimization and numerical simulation was used in the CFD-DEM coupling method, which illustrated the influence of structural parameters on the sand particle motion characteristics via the clear water test and the short-cycle anti-clogging test; the percentage of the sand velocity decrease was selected as a kind of index for evaluating the anti-clogging performance to reveal the connection between the hydraulic performance and the anti-clogging performance. It provides the theoretical basis for improving the performance of labyrinth-type emitter and selecting the best structural parameters.
2. Materials and Methods
2.1. Physical Model
Figure 1 shows the schematic diagram of the labyrinth-type emitter structure. In this paper, five main parameters were selected: turning angle α, flow channel width W, flow channel depth D, width of top base L, and the amount of interdental reference J. The upper bottom height H was 1.4 mm, the inlet width was 1 mm, and the upper and lower flow channels were 1 mm apart.
The orthogonal tests were designed by 5 factors and 4 levels L16(45), and a total of 16 types of drip irrigation emitters with different flow channel structures were obtained. The parameters of the flow channel structure are shown in Table 1.
2.2. Mesh Classification and Numerical Simulation Methods
In this paper, the CFD-DEM was used to analyze the flow characteristics in the flow channel of the drip irrigation emitter. The Ansys-Fluent was employed during this study. The mesh unit size of the fluid domain was 0.005 to 0.007 mm, and the number of mesh units was (6.0~6.7) × 105. The hexahedron was mainly used in the mesh division, the tetrahedron was used as a supplement, the average mesh mass was 0.8158, the maximum aspect ratio was 2.6, the maximum deviation was 0.28, and the minimum orthogonal mass was 0.91. In the labyrinth-shaped channel with an area of approximately 1.0 mm2, the flow of water will promote the transition to turbulence [17]. The simulation of the continuous phase adopted the standard k-ε turbulence model. The standard wall function method was used to process the flow channel wall. The smooth and non-displacement boundary conditions were adopted for the flow channel wall [18]. The maximum value of y+ on the wall of the mesh was 64. According to the wall function method, the maximum value of y+ is required to be between 30 and 300. It was reasonable to adopt the flow in labyrinth drip irrigation emitters. The control volume method was used to discretize the control equations, the SIMPLE algorithm was used to solve the pressure-velocity coupling, and the convergence accuracy of solving the discretized equations on the fluid domain was 10−4. The fluid domain was considered a viscous incompressible model, the effect of surface tension was neglected, and the gravity factor was taken into account [19]. When the flow index was calculated, the working pressures were 50, 75, 100, 125, 150, 175, 200, 225, and 250 kPa, respectively, the exit condition of the drip irrigation emitter was at atmospheric pressure, the profile update interval was 2, the number of iterations was 100, and the reporting interval was 0.02. When the sand passage rate was calculated, the working pressure was 50 kPa, the exit condition of the drip irrigation emitter was atmospheric pressure, the profile update interval was 10, the number of iterations was 5000, and the reporting interval was 0.002 [20]. The models were computed in double precision. When the number of iterations reached the last one and all the calculations of the fluid fields converged, the simulation data were exported.
The maximum particle volume fraction of sand was 1%, which meant that the mixture of water and sand was a dilute phase flow. The parameter settings for sand grains and water flow were summarized in Table 2 and Table 3 [21,22,23]. A discrete approach was used to simulate the sand particle motion and collisions between sand particles and flow channel walls. The effects of viscous drag and gravity were considered in the simulation analysis, and the effects of pressure gradient forces, virtual mass forces, and Saffman forces were not taken into account (small order of magnitude [24]). The CFD-DEM coupling is the process of composite calculation of mass, momentum, and energy transfer. The sand-bearing fluid traction force is obtained by solving the continuous phase with CFD, and the flow field information is converted into the fluid traction force. The latest position, velocity, and force information of the sand particles are obtained by DEM, and then the flow field state is further updated to calculate the most representative stress state. The detailed flow chart of this article is shown in Figure 2.
2.3. Hydraulic Performance and Anti-Clogging Performance
The relationship between flow rate and pressure will directly affect the hydraulic performance of the drip irrigation emitter [25], and the relationship between flow rate and pressure is expressed by Equation (1)
where q is the flow rate of the drip irrigation emitter, L/h; h is work pressure, kPa; kd is the flow coefficient; and x is the flow index, ranging in . The better the hydraulic performance of the drip irrigation emitter, the smaller the flow index [26]. In this paper, the sand passage rate and the percentage decrease in velocity were used to express the anti-clogging performance of the drip irrigation emitter. The higher the passage rate, the better the anti-clogging performance.
Among them, A was the sand passage rate; Nt was the total number of sand particles passing through the flow channel in the specified time; Nz was the total number of sand particles that appeared in the flow channel within a specified time; Tmin was the minimum time required for sand particles to pass through the flow channel; T was the total length of the calculation; V* was the percentage decrease in velocity; Vi was the initial velocity of sand particles entering the flow channel, m/s; and V0 was the average velocity of sand particles through the flow channel, m/s.
2.4. Model Test of Drip Irrigation Emitter
The drip irrigation emitters were engraved using high-precision engraving machines (engraving accuracy of 0.01 mm), and 3D equal-proportional models were made of plexiglass and tested on the test platform. Figure 3 shows the platform for conducting the clear water test and short-cycle anti-clogging test, which was mainly composed of the water tank (Yutian County Xiangsheng Plastic Products Co. Ltd., Tangshan, China), water pump (Changzhou Leifeng Electromechanical Co. Ltd., Changzhou, China), pressure-reducing valve (Shanghai Gaojin Fluid Technology Co. Ltd., Shanghai, China), pressure gauge (Shanghai Ruyi Instrument Co. Ltd., Shanghai, China), and several pipes (Shandong Shengjia Water-saving Irrigation Equipment Co. Ltd., Jinan, China). In the experiment, the inlet pressure of the clear water test was taken to be the same as the inlet pressure of the numerical simulation, and the time of each test was 10 min, which was repeated three times, and the flow rate of the last 5 min was read by a measuring cylinder, with the average value taken as the measured flow rate.
In the short-cycle anti-clogging test, the working pressure of the drip irrigation emitter was 50 kPa. An amount of 15 g/L of muddy water with sand content was manually prepared to accelerate the clogging. The muddy water was filtered through a 140-mesh screen so that the maximum particle size did not exceed 109 μm. The test was conducted every 24 h, and the flow rate of the drip irrigation emitter was read with a measuring cylinder within 5 min in all the tests. The test was stopped when the flow rate of the emitter was less than 75% of the clear water test flow rate.
2.5. Statistical Analysis of Flow Channel
Regression analysis was used to quantify the correlation between flow index and sand passage rate. The value of the correlation coefficient R2 was the standard for measuring the quality of model fitting, and a good fitting model should be greater than 0.6 [27].
The multicollinearity test was used to explain the high correlation between the variables and the variance inflation factor (VIF) method [28] was used to test the multiple regression model via Equation (4) as follows:
where denotes the coefficient of determination obtained by fitting the regression equation with the k-th variable as the dependent variable to the remaining m independent variables, with a maximum value of VIFm ≥ 10, which was severe covariance, and the accuracy of the model was poor. This process was statistically analyzed using IBM SPSS Statistics 26.
3. Results
3.1. Optimization of Structure Parameters of Drip Irrigation Emitter
The results of the orthogonal test and variance analysis of drip irrigation emitters are shown in Table 4 and Table 5. In the orthogonal test tables, the sand passage rate can reach more than 85% when the turning angle was 65°, such as No. 13, 14, and 16 emitters, while it showed the lowest passage rate when the turning angle was 75°, such as No. 7 emitter whose sand passage rate was only 39.26%. The sand passage rate of the drip irrigation emitter at the same turning angle varied less and did not show a linear relationship between the two parameters. The five parameters of the flow channel structure were analyzed via variance analysis and the turning angle had the most significant effect on the sand passage rate and flow index, followed by the amount of interdental reference, flow channel depth, flow channel width, and width of top base, respectively.
3.2. Verification of Hydraulic Performance and Anti-Clogging Performance
The highest (No. 16) and lowest (No. 7) sand passage rates of the drip irrigation emitter were selected for the test, and the flow–pressure curves of the drip irrigation emitter were obtained via regression analysis of the experimental results and numerical simulation results are shown in Figure 4. The dashed line represented the simulation results. The solid line represented the actual test results. The flow index (test values) calculated using Equation (1) for the two sets of test schemes were 0.4902 and 0.5242, indicating that the hydraulic performance of the drip irrigation emitter was good. The flow rate error of the No. 16 drip irrigation emitter was 2.4%~4.1%, and the flow rate error of the No. 7 drip irrigation emitter was 2.1%~5.8%, which had good accuracy and feasibility [29]. The flow rate error of the No. 7 drip irrigation emitter was greater than the No. 16 drip irrigation emitter at the working pressure of 100 and 125 kPa. The reason was that there were technique errors in the models produced by high-precision engraving machines; the hydraulic performance of the No. 7 drip irrigation emitter was lower than the No. 16 drip irrigation emitter and more sensitive to changes in working pressure. The actual working pressure range used was less than 100 kPa. The error of flow rate for two types of drip irrigation emitters below 100 kPa was 2.6% and 3.8%, respectively. The selected structural parameters had certain practical value for the design of drip irrigation emitters.
The relationship between the number of days tested and the flow rate for drip irrigation emitters (No. 16 and No. 7) is shown in Figure 5. The flow error of the No. 16 drip irrigation emitter was approximately between 2.2% and 3.7%, and the flow error of the No. 7 drip irrigation emitter was 2.9%~4.3%. The flow rate on day 0 was measured from the clear water test and it was considered the initial flow rate. An initial flow rate of 75% was set as the threshold (the flow rate of the drip irrigation emitter measured under the clear water test), and when the measured flow rate falls below 75% on a given day, the drip irrigation emitter is considered to be clogged, otherwise, it is unclogged. The flow rate of both drip irrigation emitters decreased as the test time increased, and both drip irrigation emitters (No. 16 and No. 7) were clogged when using muddy water. In the eighth test, the flow rate of the No. 16 drip irrigation emitter was not below the threshold, and it was not considered to have clogged. The No. 7 drip irrigation emitter was considered to have clogged. The structural parameters had a significant impact on the anti-clogging performance of the drip irrigation emitters.
3.3. Influence of Flow Channel Structure Parameters on Sand Passage Rate and Percentage Decrease in Velocity
The results of the flow channel structural parameters of the drip irrigation emitter on the sand passage rate and the percentage decrease in velocity are shown in Figure 6. The sand passage rate and percentage decrease in velocity trend line had the greatest degree of variation in E1, with a range of 39.26~91.48% for sand passage rate and 40.47~58.31% for percentage decrease in velocity. The degree of variation of the trend line for E2 to E4 was lesser. The maximum changes in the sand passage rate and the percent decrease in velocity were 5.75% and 10.38%. The change in the width of top base in E5 had no effective effect on the sand passage rate and the percentage decrease in velocity. The sand passage rate could be maximized with the 65° turning angle. When the amount of interdental reference was −0.4 mm, the flow channel depth was 0.8 mm, and the flow channel width was 1 mm, it is the most suitable parameter to improve the sand passage rate.
The orthogonal test and the short-cycle anti-clogging test indicated that the anti-clogging performance and sand passage rate of the No. 16 drip irrigation emitter were higher than the No. 7 drip irrigation emitter. The sand passage rate could effectively describe the anti-clogging performance. There was a good negative correlation between the sand passage rate and the percent decrease in velocity under certain structural parameters, which indicated that the percent decrease in velocity was a potential factor affecting the sand passage rate. It proved that the turning angle has the greatest influence on the sand passage rate and the percentage decrease in velocity, which changed the head loss and the energy dissipation effect of the flow channel.
3.4. Flow Field Variations and Sand Distribution in the Flow Channel
Figure 7a,b show the flow velocity vector diagrams of the flow channels of drip irrigation emitters No. 16 and No. 7, respectively, at a working pressure of 50 kPa. The flow velocity vector diagram divided the flow field into three regions: upper vortex region A, lower vortex region A*, and main flow region B. The flow velocity in the main flow region B of the drip irrigation emitter No. 16 was 7.53~10.7 m/s, and the flow velocity in the vortex regions A and A* was 0.164~3.24 m/s. The flow velocity in the main flow region B of the drip irrigation emitter No. 7 was 7.33~10.5 m/s, and the flow velocity in the vortex regions A and A* was 0.0698~2.1 m/s.
Figure 8a,b showed the distribution of sand particles in the flow channel of No. 16 and No. 7 drip irrigation emitters, respectively. The fastest time for sand particles to pass through the entire flow channel of the No. 16 and No. 7 drip irrigation emitter was 2.8 s and 3.98 s, respectively, and the maximum retention time was 6.56 s and 9.56 s, respectively. There were fewer sand particles in the vortex area of the No. 16 drip irrigation emitter, and the distribution of sand particles in each unit was more uniform. Most of the sand particles could flow stably in the main flow area.
The sand transportation in the flow channel mainly depended on the movement of the water flow in the main flow region. The sand distribution of the No. 7 flow channel was more disordered. The change in structural parameters led to larger flow velocity differences and vortex areas in the main flow region of the No. 7 channel, which promoted the relative movement of water flow between the main flow region and the non-main flow region. The low-velocity water flow would lag behind the main flow region and evolve as a vortex. The flow velocity in the main flow region was low, and the traction force of the water flow was insufficient to continue the movement of sand particles in the main flow region.
3.5. Turbulence Kinetic Energy and Turbulence Dissipation Rate in a Flow Channel
Figure 9 shows the distribution of turbulence kinetic energy of the flow channels of drip irrigation emitters No. 16 and No. 7, respectively, at a working pressure of 50 kPa. The turbulence kinetic energy variations in the two flow channels were similar, with higher and maximum turbulence kinetic energy near the interdental surface, and the turbulence kinetic energy variations in the main flow region B were all semicircular. The drip irrigation emitter No. 7 had a larger blue region (vortex region A) than that of drip irrigation emitter No. 16. The turbulence kinetic energy in the main flow region B of drip irrigation emitter No. 16 was 47.4~126.3 m2/s2, and most of the unit flow channel maintained turbulence kinetic energy at about 86.9 m2/s2. The turbulence kinetic energy in the main flow zone B of drip irrigation emitter No. 7 was 44.4~101.4 m2/s2, and most of the unit flow channel maintained turbulence kinetic energy at about 69.7 m2/s2. The minimum values of turbulence kinetic energy in the vortex regions A and A* of the flow channels of drip irrigation emitter No. 16 and No. 7 were 0.1701 m2/s2 and 0.1253 m2/s2, respectively.
Figure 10 shows the distribution of turbulence dissipation rates of the flow channels of drip irrigation emitters No. 16 and No. 7, respectively, at a working pressure of 50 kPa. The turbulence dissipation rates in the two flow channels were similar, with higher and maximum turbulence dissipation rates at the intertooth and left and right wall surfaces, and were 553.8 m2/s3 and 490.2 m2/s3, respectively. The drip irrigation emitter No. 7 had a larger red region (high turbulence dissipation rate) than that of drip irrigation emitter No. 16. The turbulence dissipation rate in the main flow zone B of drip irrigation emitter No. 16 was 333.6~433.7 m2/s3. The turbulence dissipation rate in the main flow zone B of drip irrigation emitter No. 7 was 398.3~490.2 m2/s3.
The turbulence kinetic energy was a measure of the development or decline in turbulence. The energy extracted from the time-averaged flow in this region increases with the turbulence kinetic energy. The turbulence dissipation rate is the rate of conversion from turbulence kinetic energy to kinetic energy of molecular thermal motion. There were two reasons that the sand particles in the No. 7 flow channel were easily clogged. Firstly, the turbulence dissipation rate in the main flow region was relatively high. The energy converted into turbulence kinetic energy decreases. This results in the inability of the water flow in the main flow region to carry sand particles for stable movement. Secondly, the turbulence kinetic energy in the vortex region is relatively small, the sand particles deviate and enter the vortex region, and the energy obtained is insufficient to support their entry into the main flow region.
3.6. Influence of Flow Index on Sand Passage Rate
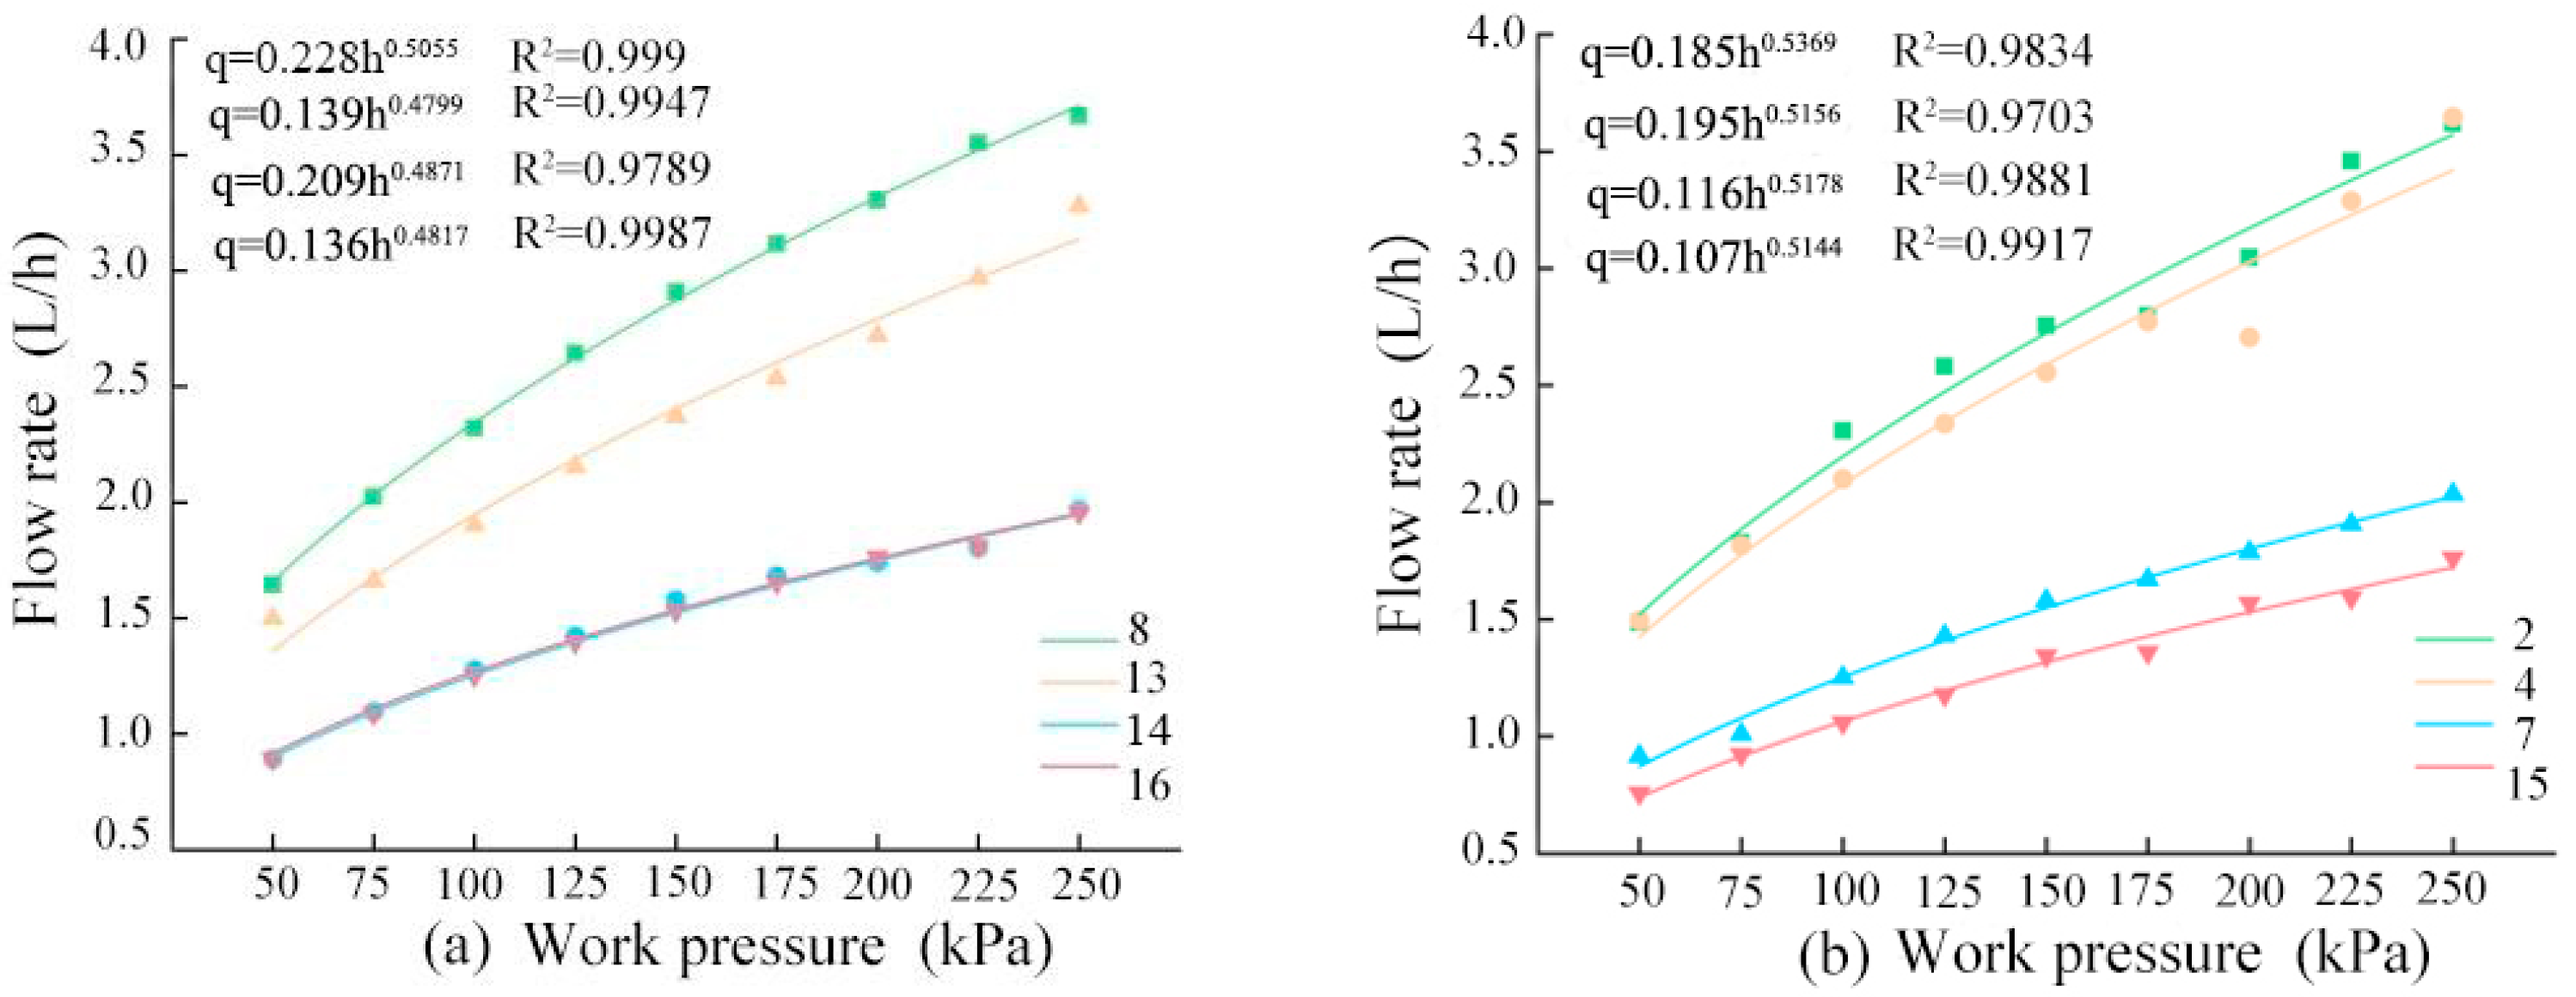
The hydraulic performances of the drip irrigation emitter with a 65° turning angle and 75° turning angle are shown in Figure 11. The flow index of the drip irrigation emitter with a 65° turning angle was all lower than that of the drip irrigation emitter with a 75° turning angle. The correlation coefficients were all greater than 0.97, and the eight fitted curves were well fitted.
In order to show the relationship between hydraulic performance and anti-clogging performance, the two kinds of drip irrigation emitters with 65° and 75° turning angles were selected for the regression analysis of flow index and sand passage rate. The results are shown in Table 6, which show that the flow index has a significant effect on the sand passage rate, and the relationship equation between the flow index and the sand passage rate was obtained from Table 6, as shown in Equation (5) as follows:
where A was the sand passage rate of the drip irrigation emitter; and x was the flow index. The correlation coefficient of the model R2 = 0.742, which was greater than 0.6, indicated that the model had good fitting quality, and the flow index was negatively correlated with the sand passage rate when the turning angle was in the range of 65°~75°.
4. Discussion
The sand particles in irrigation water will lead to different degrees of clogging, which will seriously affect the entire drip irrigation system and have a certain impact on water resource utilization and agricultural development [30]. The flow channel structure parameters have a significant effect on sand movement, and appropriate structural parameters can effectively improve the anti-clogging performance of the drip irrigation emitter [31]. The five structural parameters of labyrinth-type drip irrigation emitters were selected, and sixteen drip irrigation emitters with different structural parameters were obtained via orthogonal experiments. The sand passage rate, flow index, and flow field were analyzed.
Yu et al. [13] found that the drip irrigation emitters with turning angles between 60° and 90° had better anti-clogging performance. Zhang et al. [32] found the hydraulic performance of drip irrigation emitter could be improved by appropriately reducing the turning angle. However, a smaller turning angle also caused sand particles to move into the vortex zone, resulting in longer flow times, slower velocities, and an increased probability of clogging in the drip irrigation emitter. In order to confirm a turning angle that could better balance hydraulic performance and anti-clogging performance. The turning angles of 55°, 65°, 75° and 80° were selected. Via analysis of variance and significance, it was found that the turning angle had the greatest impact, and the drip irrigation emitter at a 65° turning angle had a lower flow index and higher sand passage rate. The reason why the width of the top base did not effectively change the sand passage rate is that the flow velocity state and energy distribution in the main flow region will not be significantly changed within 0.2~0.5 mm. In this study, it was found that the sand passage rate was not linearly related to the turning angle, the sand passage rate was almost at one level at a fixed turning angle, and the sand passage rate varied greatly in different turning angles. The average velocity drop ratio of sand particles showed a good negative correlation with the sand passage rate, and this result was consistent with that found by Yu et al. [33]. Therefore, the percentage decrease in velocity can be a sideways indication of the anti-clogging performance of the drip irrigation emitter.
It was found that the main flow region of the No. 7 flow channel was unevenly distributed, the vortex region was larger, but the velocity was lower, and the sand particles were easy to enter the vortex cyclic movement. The turbulence kinetic energy of the vortex region had an important effect on the sand grain movement [34]. The main reason was that the collision between the sand particles and the wall led to energy loss, and the sand particles’ centrifugal force was relatively reduced, so the vortex region had more sand particles to gather and precipitate [13]. The turning angle will affect the velocity and direction of water movement in the flow channel. It will change the degree of turbulence of the water flow, and form a vortex within the unit structure, which makes the energy loss more serious, and reduces the overall velocity of the water flow, which leads to a reduction in the possibility of the sand particles to be carried out of the flow channel, and thus exacerbated the blockage situation [35]. Therefore, the reduction in the vortex region can effectively improve the sand passage rate. However, Feng et al. [36] concluded that the vortex region improved the energy dissipation of the drip irrigation emitter and its rotational motion helped to wash away the clogging material adhering to the wall.
The changes in structural parameters could affect the flow field state and the turbulence kinetic energy. It is concluded that the flow index was lower for a 65° turning angle, which was due to the reduced head loss caused by the flow hitting the wall and the reduced sensitivity of the flow to pressure changes [26]. The turbulence kinetic energy distribution of the drip irrigation emitter with a 65° turning angle was more uniform, the difference value of energy consumption was lower, the sand particles changed less due to external force, and the motion state inside the whole flow channel was stable; the drip irrigation emitter with a 65° turning angle had the highest sand passage rate. The sand motion data obtained in this study were from numerical simulation, and in the future, the particle image velocimetry can be used to study the sand motion characteristics, which will provide more accurate data for the sand motion characteristics in the flow channel. In the subsequent optimization of the flow channel structure, the characteristics of the vortex region, the water flow, and the sand movement are balanced to obtain the best overall performance of the drip irrigation emitter.
5. Conclusions
- (1)
- The structural parameters of the labyrinth-type flow channel had an influence on the sand passage rate, and the order from large to small was as follows: turning angle, amount of interdental reference, flow channel depth, flow channel width, and width of the top base. The turning angle had the most significant effect on the sand passage rate and flow index, the drip irrigation emitter at a 65° turning angle had the highest sand passage rate.
- (2)
- The percentage decrease in velocity had a good negative correlation with the sand passage rate, and it can be a sideways indication of the anti-clogging performance of the drip irrigation emitter. The flow velocity, turbulence kinetic energy, and turbulence dissipation rate in the flow field had a significant impact on the movement of sand particles.
- (3)
- The hydraulic performance had a good linear relationship with the sand passage rate at the turning angle was 65°~75°. The equation for the relationship between flow index and sand passage rate was a negative correlation for drip irrigation emitter, which had better hydraulic performance and anti-clogging performance with a 65° turning angle.
Author Contributions
Q.Y. and E.Z. contributed most to the conception, guidance, and revision of the manuscript. The software analysis was conducted by Z.L. The manuscript was written by S.B. and T.X. All authors have read and agreed to the published version of the manuscript.
Funding
This work was supported by the Basic Scientific Research Fund of Heilongjiang Provincial Universities: (2021-KYYWF-0050).
Data Availability Statement
The data that support the findings of this study are available from the corresponding author upon reasonable request.
Acknowledgments
The authors acknowledge the co-operation and support of School of Hydraulic and Electric Power, Heilongjiang University, Harbin 150080, China for this research.
Conflicts of Interest
The authors declare no conflict of interest.
References
- Li, Y.K.; Zhou, B.; Yang, P. Research advances in drip irrigation emitter clogging mechanism and controlling methods. J. Hydraul. Eng. 2018, 49, 103–114. [Google Scholar] [CrossRef]
- Shi, K.; Lu, T.; Zheng, W.; Zhang, X.; Zhangzhong, L. A review of the category, mechanism, and controlling methods of chemical clogging in drip irrigation system. Agriculture 2022, 12, 202. [Google Scholar] [CrossRef]
- Yuan, W.; Wei, Z.; Chu, H.; Ma, S. Optimal design and experiment for divided-flow emitter in drip irrigation. Trans. Chin. Soc. Agric. Eng. 2014, 30, 117–124. [Google Scholar]
- Pei, Y.; Li, Y.; Liu, Y.; Zhou, B.; Shi, Z.; Jiang, Y. Eight emitters clogging characteristics and its suitability under on-site reclaimed water drip irrigation. Irrig. Sci. 2014, 32, 141–157. [Google Scholar] [CrossRef]
- Xu, T.; Zhang, L. Influence and analysis of structure design and optimization on the performance of a pit drip irrigation emitter. Irrig. Drain. 2020, 69, 633–645. [Google Scholar] [CrossRef]
- Qin, C.; Zhang, J.; Wang, Z.; Lyu, D.; Liu, N.; Xing, S.; Wang, F. Anti-Clogging Performance Optimization for Shunt-Hedging Drip Irrigation Emitters Based on Water–Sand Motion Characteristics. Water 2022, 14, 3901. [Google Scholar] [CrossRef]
- Wang, C.; Li, Z.; Ma, J. Influence of emitter structure on its hydraulic performance based on the vortex. Agriculture 2021, 11, 508. [Google Scholar] [CrossRef]
- Baghel, Y.K.; Kumar, J.; Patel, V.K. CFD analysis of the flow characteristics of in-line drip emitter with different labyrinth channels. J. Inst. Eng. India Ser. A 2021, 102, 111–119. [Google Scholar] [CrossRef]
- Li, G.Y.; Wang, J.D.; Alam, M.; Zhao, Y.F. Influence of geometrical parameters of labyrinth flow path of drip emitters on hydraulic and anti-clogging performance. Trans. ASABE 2006, 49, 637–643. [Google Scholar] [CrossRef]
- Zhangzhong, L.; Yang, P.; Li, Y.; Ren, S. Effects of flow path geometrical parameters on flow characteristics and hydraulic performance of drip irrigation emitters. Irrig. Drain. 2016, 65, 426–438. [Google Scholar] [CrossRef]
- Wu, D.; Li, Y.K.; Liu, H.S.; Yang, P.L.; Sun, H.S.; Liu, Y.Z. Simulation of the flow characteristics of a drip irrigation emitter with large eddy methods. Math. Comput. Model. 2013, 58, 497–506. [Google Scholar] [CrossRef]
- Zhou, B.; Li, Y.; Song, P.; Zhou, Y.; Yu, Y.; Bralts, V. Anti-clogging evaluation for drip irrigation emitters using reclaimed water. Irrig. Sci. 2017, 35, 181–192. [Google Scholar] [CrossRef]
- Zhang, J.; Zhao, W.; Tang, Y.; Lu, B. Anti-clogging performance evaluation and parameterized design of emitters with labyrinth channels. Comput. Electron. Agric. 2010, 74, 59–65. [Google Scholar] [CrossRef]
- Yu, L.; Li, N.; Liu, X.; Yang, Q.; Li, Z.; Long, J. Influence of Dentation Angle of Labyrinth Channel of Drip Emitters on Hydraulic and Anti-Clogging Performance. Irrig. Drain. 2019, 68, 256–267. [Google Scholar] [CrossRef]
- Xu, T.; Su, Y.; Su, Z.; Zhi, S.; Zheng, E.; Yan, C. Simulation of the hydraulic behavior of a bionic-structure drip irrigation emitter. Water Sav. Irrig. 2022, 10, 11. [Google Scholar] [CrossRef]
- Ma, Y.; Li, Z.; Jin, L.; Wang, C. Numerical analysis of hydraulic performance of single-tooth rectangular labyrinth emitter. Water Sav. Irrig. 2017, 20–24. [Google Scholar] [CrossRef]
- Wei, Q.; Shi, Y.; Dong, W.; Lu, G.; Huang, S. Study on hydraulic performance of drip emitters by computational fluid dynamics. Agric. Water Manag. 2006, 84, 130–136. [Google Scholar] [CrossRef]
- Li, Y.; Feng, X.; Liu, Y.; Han, X.; Liu, H.; Sun, Y.; Li, H.; Xie, Y. Research on hydraulic properties and energy dissipation mechanism of the novel water-retaining labyrinth channel emitters. Agronomy 2022, 12, 1708. [Google Scholar] [CrossRef]
- Nishimura, T.; Bian, Y.; Matsumoto, Y.; Kunitsugu, K. Fluid flow and mass transfer characteristics in a sinusoidal wavy-walled tube at moderate Reynolds numbers for steady flow. Heat Mass Transf. 2003, 39, 239–248. [Google Scholar] [CrossRef]
- Deng, J.; Han, D. Influence of Stress Relaxation on the Elastic Properties of Unconsolidated Sands. J. Jilin Univ. Earth Sci. Ed. 2011, 41, 283–291. [Google Scholar]
- Asakura, K.; Asari, T.; Nakajima, I. Simulation of solid—Liquid flows in a vertical pipe by a collision model. Powder Technol. 1977, 94, 201–206. [Google Scholar] [CrossRef]
- Tang, X.; Yu, X.; Ren, S. Solid-Liquid Two Phase Fluid Dynamics and Its Application in Hydraulic Machinery; The Yellow River Water Conservancy Press: Zhengzhou, China, 2006. [Google Scholar]
- Wang, G.; Hao, W.; Wang, J. Discrete Unit Method and Its Practice on EDEM; Northwestern Polytechnical University Press: Xi’an, China, 2010. [Google Scholar]
- Wang, F. Computational Fluid Dynamics Analysis CFD Software Principles and Applications; Tsinghua University Press: Beijing, China, 2004. [Google Scholar]
- Peng, H.; Shuqin, L.; Zeyuan, L.; Hongxu, Z.; Muhammd, T.; Ruonan, W.; Wenchao, L.; Yunkai, L. Water temperature effects on hydraulic performance of pressure-compensating emitter in a drip irrigation system. Irrig. Drain. 2021, 70, 332–341. [Google Scholar] [CrossRef]
- Xing, S.; Wang, Z.; Zhang, J.; Liu, N.; Zhou, B. Simulation and verification of hydraulic performance and energy dissipation mechanism of perforated drip irrigation emitters. Water 2021, 13, 171. [Google Scholar] [CrossRef]
- Quinino, R.C.; Reis, E.A.; Bessegato, L.F. Using the coefficient of determination R2 to test the significance of multiple linear regression. Teach. Stat. 2013, 35, 84–88. [Google Scholar] [CrossRef]
- Han, X.; Chang, L.; Wang, N.; Kong, W.; Wang, C. Effects of Meteorological Factors on Apple Yield Based on Multilinear Regression Analysis: A Case Study of Yantai Area, China. Atmosphere 2023, 14, 183. [Google Scholar] [CrossRef]
- Wei, Z.; Tang, Y.; Zhao, W.; Lu, B. Experimental study on the structure and hydraulic performance of maze runner of drip irrigation irrigator. Trans. Chin. Soc. Agric. Mach. 2005, 36, 51–55. [Google Scholar]
- Zhang, A.; Zhang, G.; Guo, H.; Chu, Y.; Han, X.; He, Q. Research advances in drip irrigation emitter clogging and anti-clogging measures. Agric. Eng. 2021, 11, 59–64. [Google Scholar]
- Sun, H.; Li, Y.; Feng, J.; Liu, H.; Liu, Y. Effects of flow path boundary optimizations on particle transport in drip irrigation emitters. Irrig. Drain. 2016, 65, 417–425. [Google Scholar] [CrossRef]
- Zhang, J.; Zhao, W.; Tang, Y.; Lu, B. Structural optimization of labyrinth-channel emitters based on hydraulic and anti-clogging performances. Irrig. Sci. 2011, 29, 351–357. [Google Scholar] [CrossRef]
- Yu, L.; Xu, X.; Yang, Q.; Wu, Y.; Bai, X. Influence of geometrical parameters of labyrinth passage of drip irrigation emitter on sand movement. Trans. CSAM 2017, 48, 255–261. [Google Scholar] [CrossRef]
- Cheng, C.; Fu, L. A scale-based study of the Reynolds number scaling for the near-wall streamwise turbulence intensity in wall turbulence. Int. J. Heat Fluid Flow 2023, 101, 109136. [Google Scholar] [CrossRef]
- Yang, B.; Wang, J.; Zhang, Y.; Wang, H.; Ma, X.; Mo, Y. Anti-clogging performance optimization for dentiform labyrinth emitters. Irrig. Sci. 2020, 38, 275–285. [Google Scholar] [CrossRef]
- Feng, J.; Li, Y.; Wang, W.; Xue, S. Effect of optimization forms of flow path on emitter hydraulic and anti-clogging performance in drip irrigation system. Irrig. Sci. 2018, 36, 37–47. [Google Scholar] [CrossRef]
Figure 1.
Schematic diagram of flow channel structure.
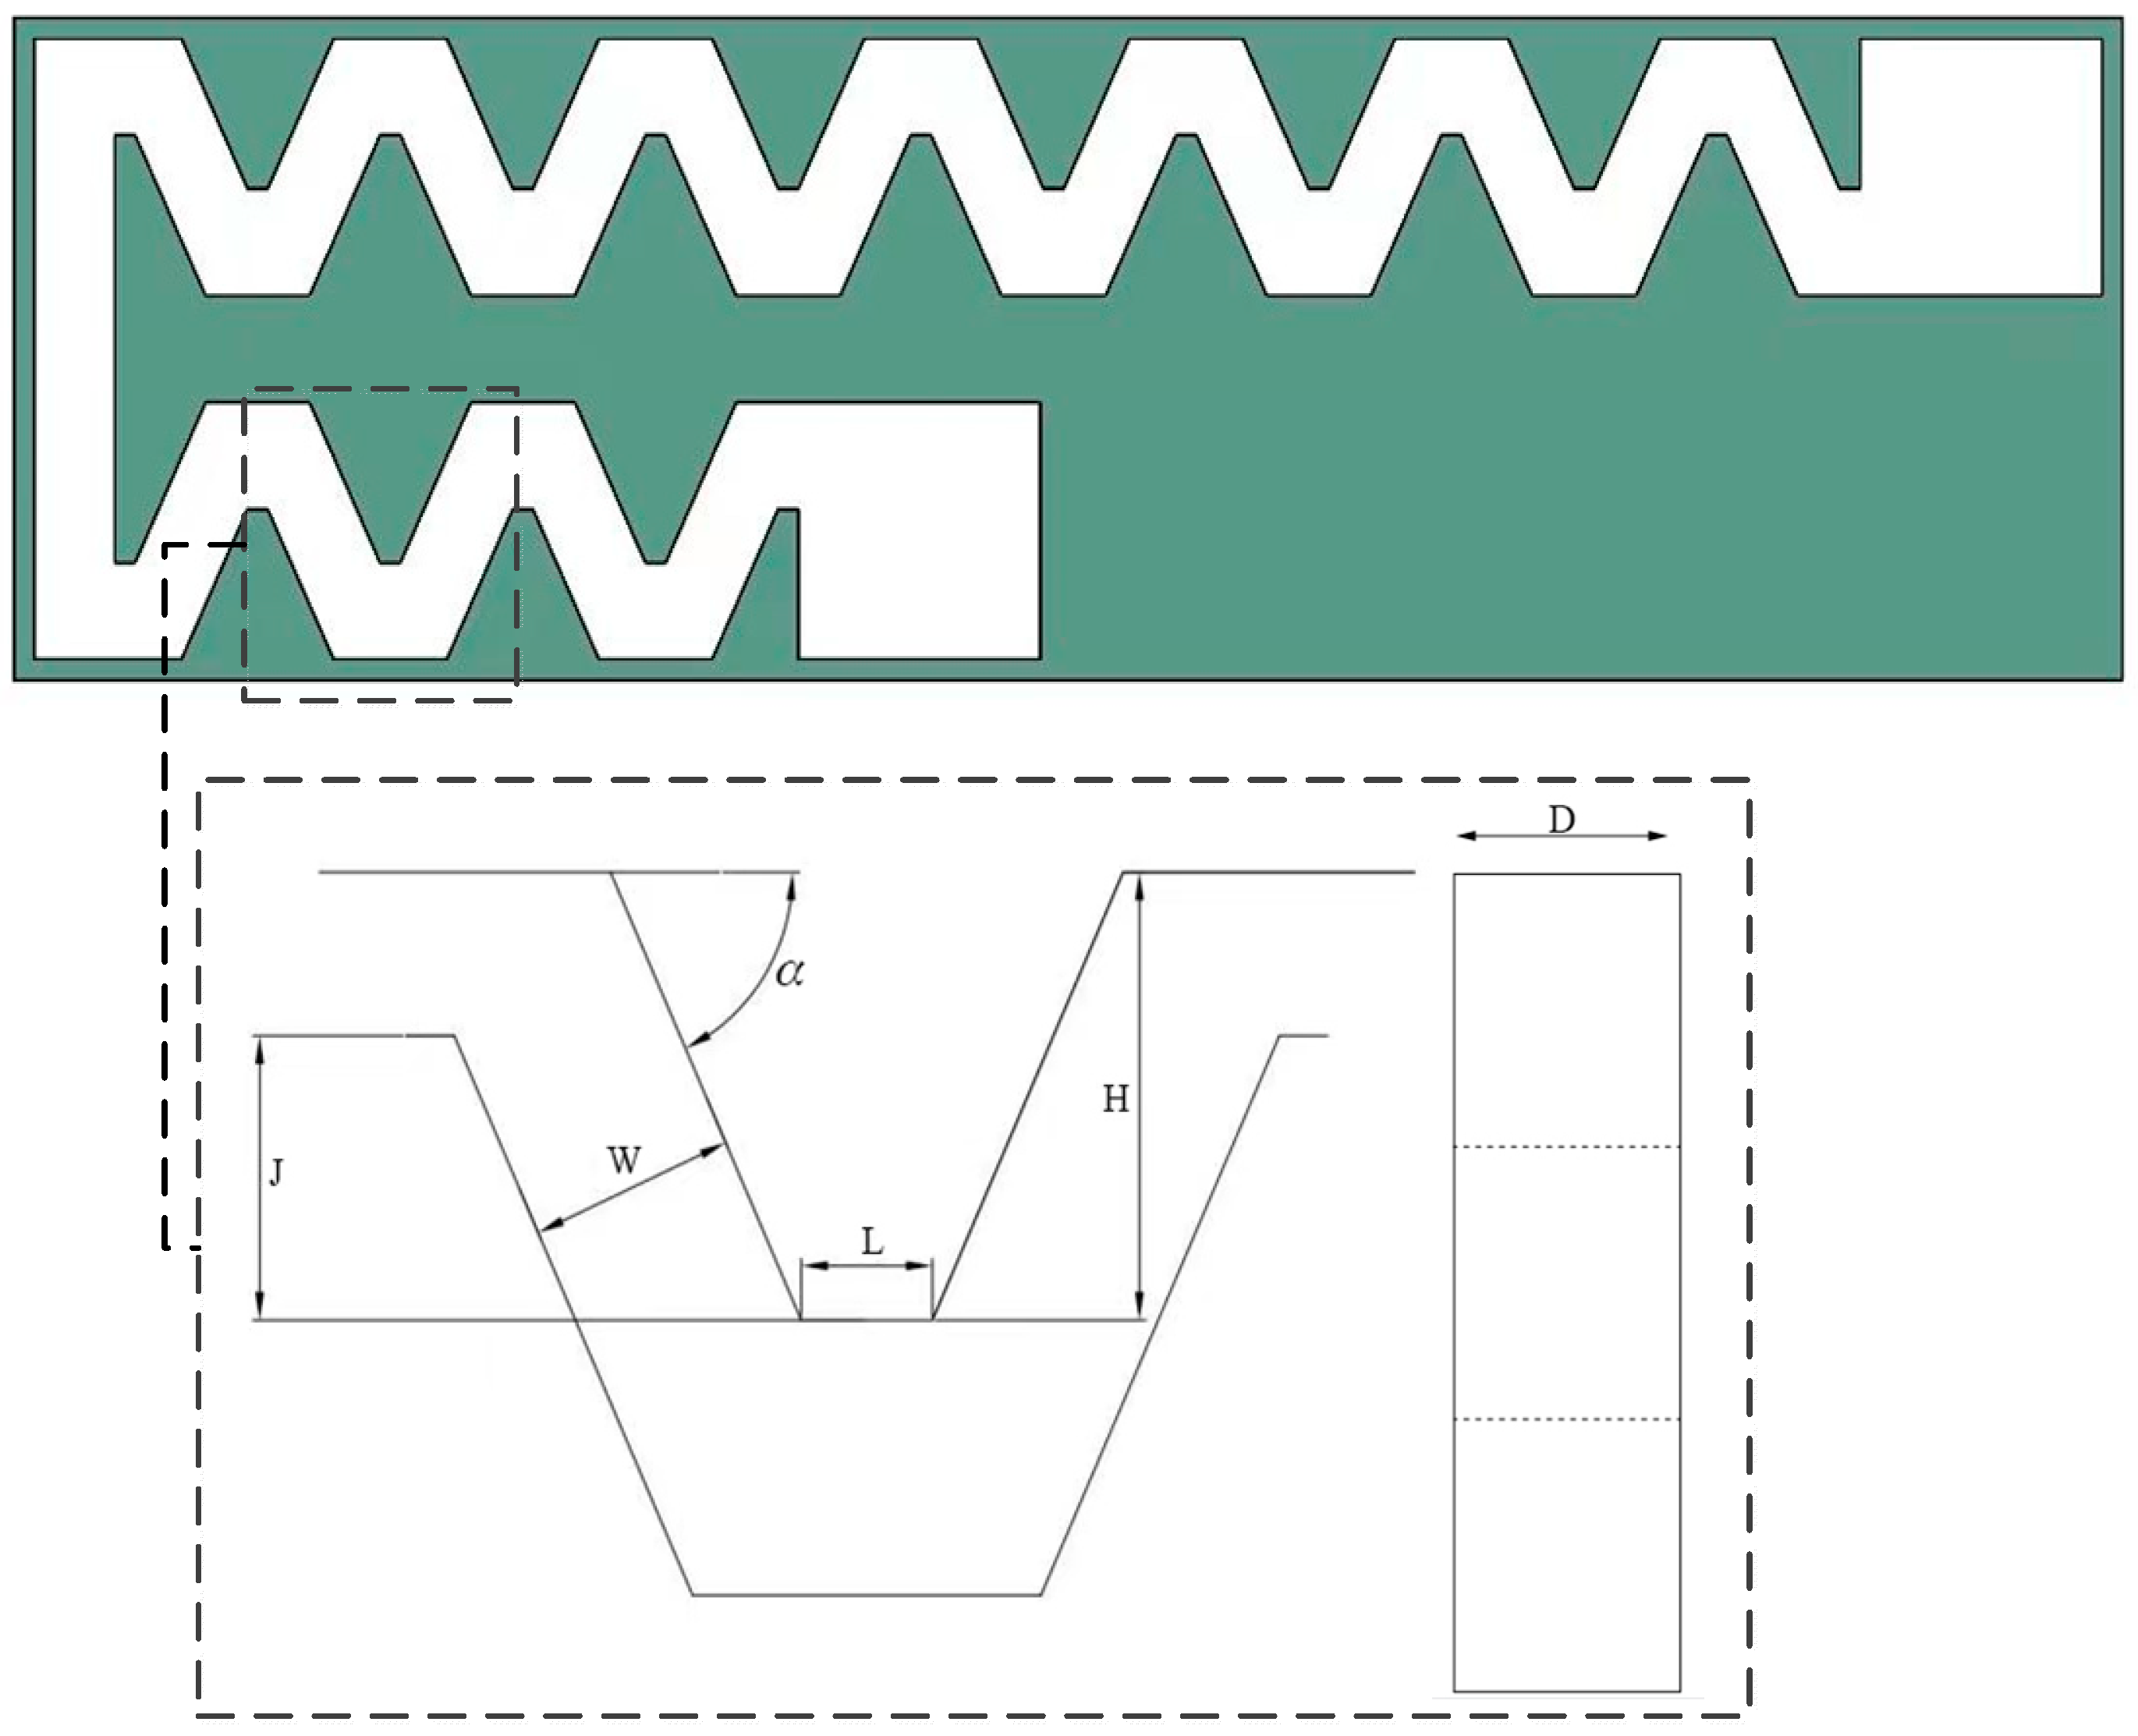
Figure 2.
Flow chart of solid–liquid two-phase flow simulation and experimental verification.

Figure 3.
Clear water test and short-cycle anti-clogging test platform.
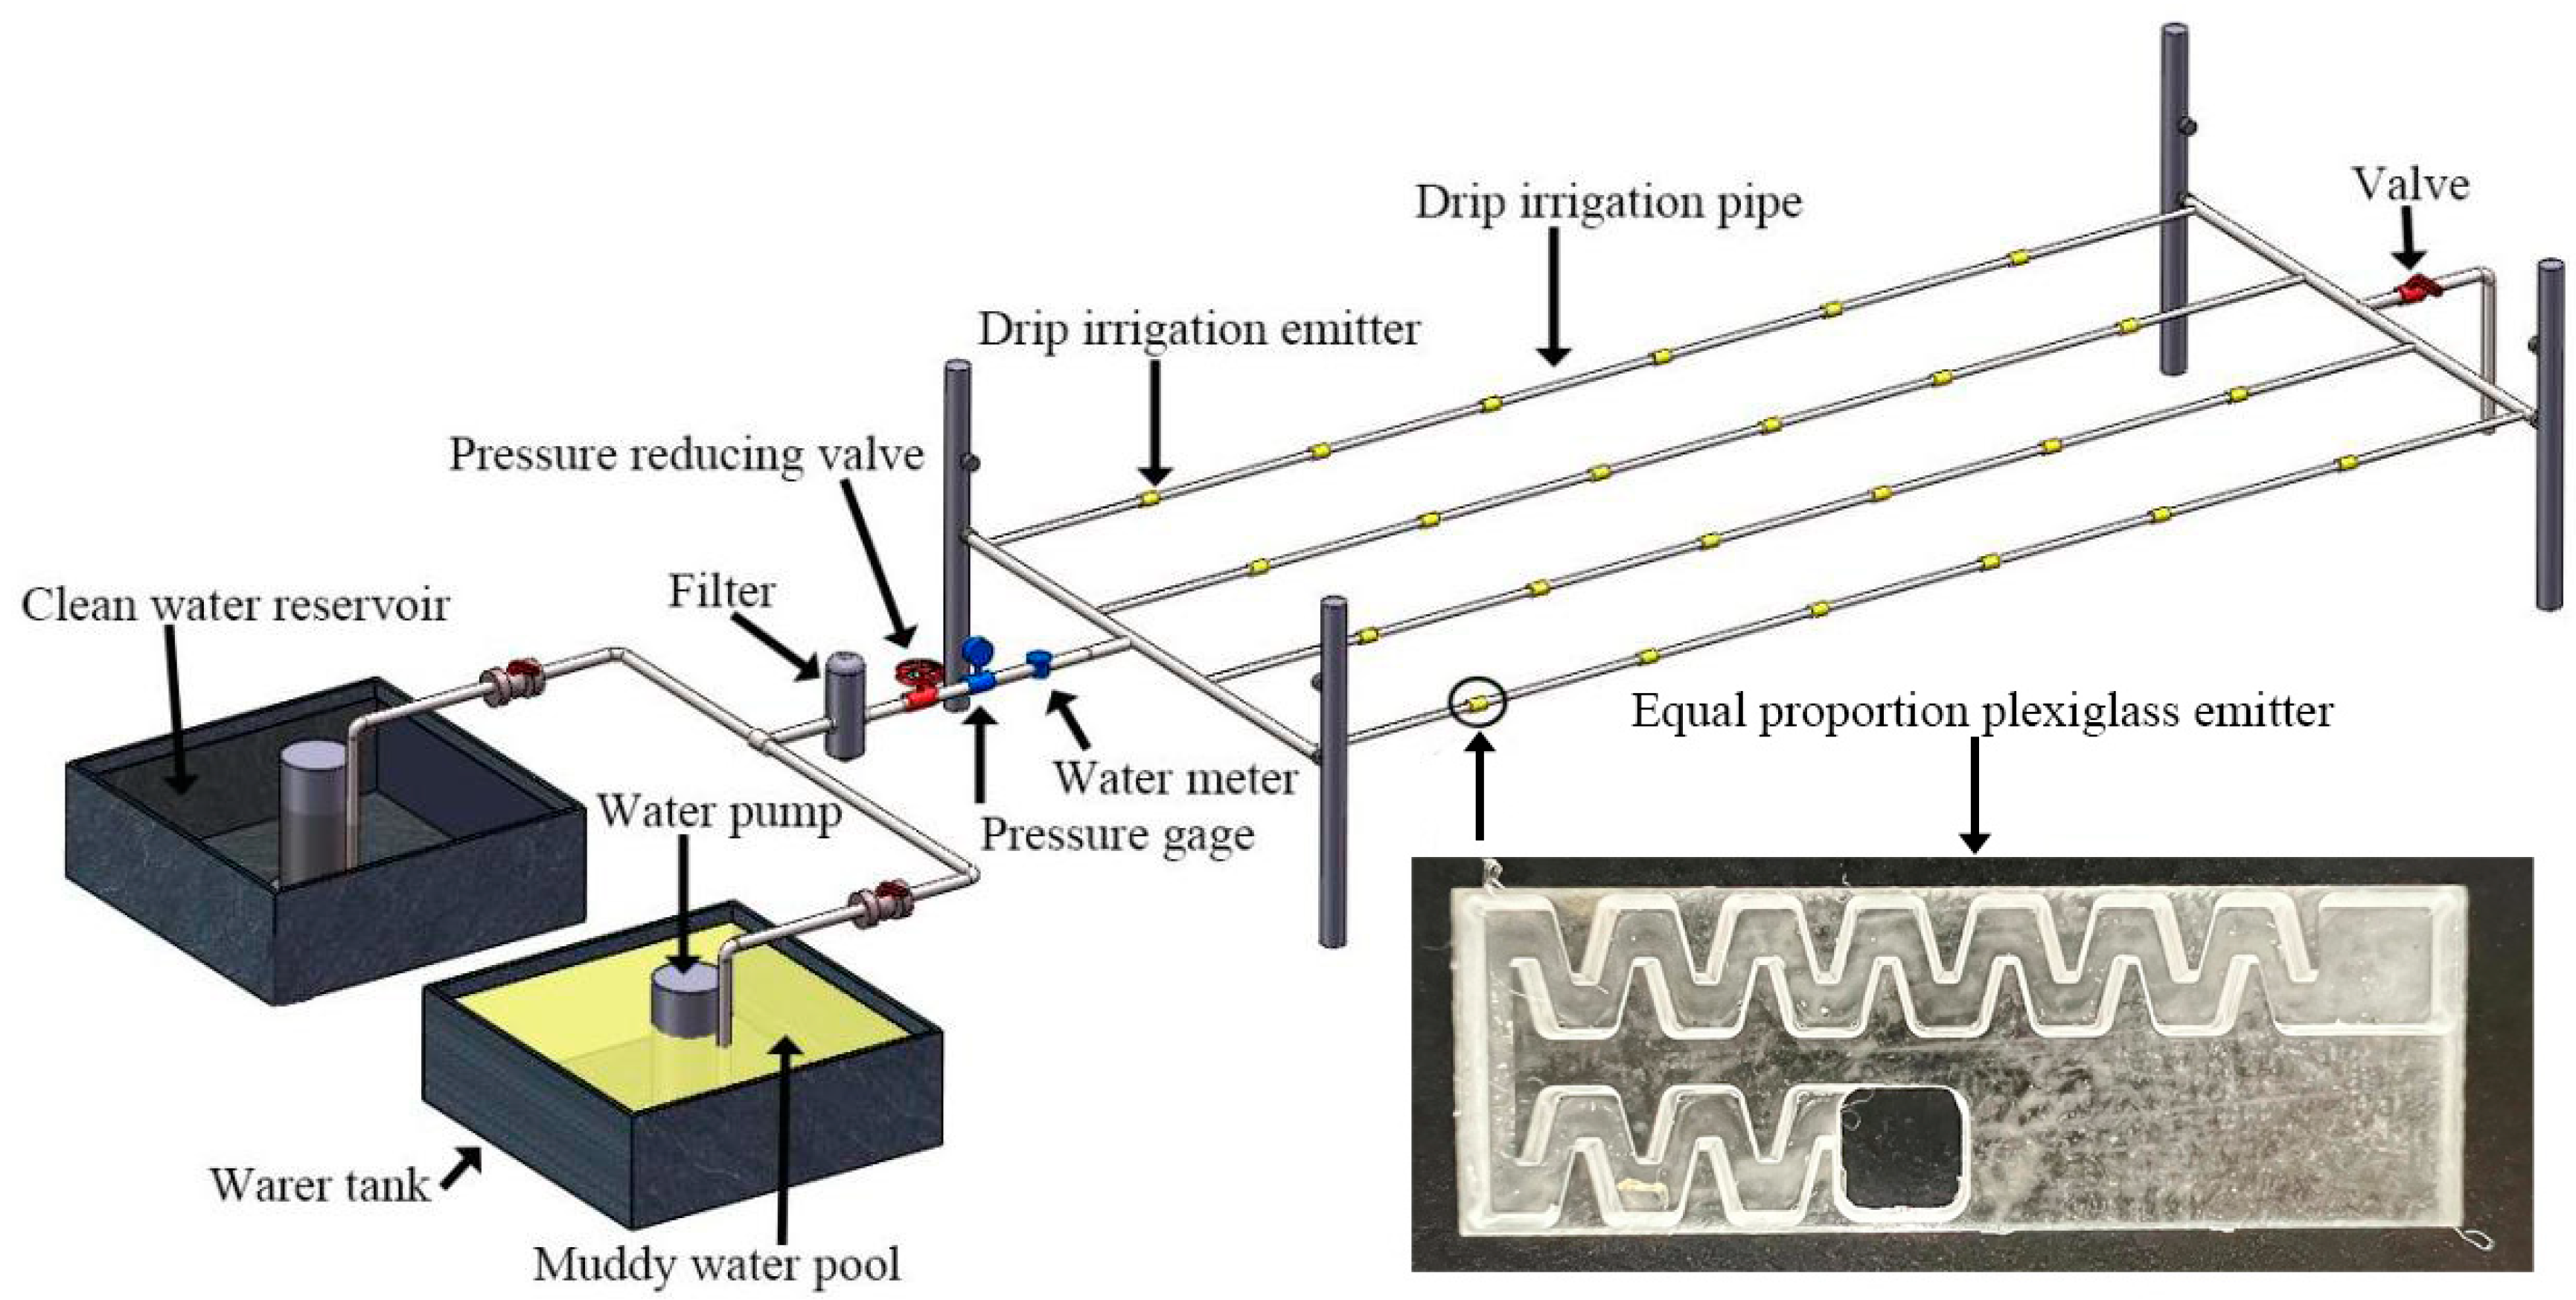
Figure 4.
Flow–pressure curve of emitter (a) No. 16 and (b) No. 7.
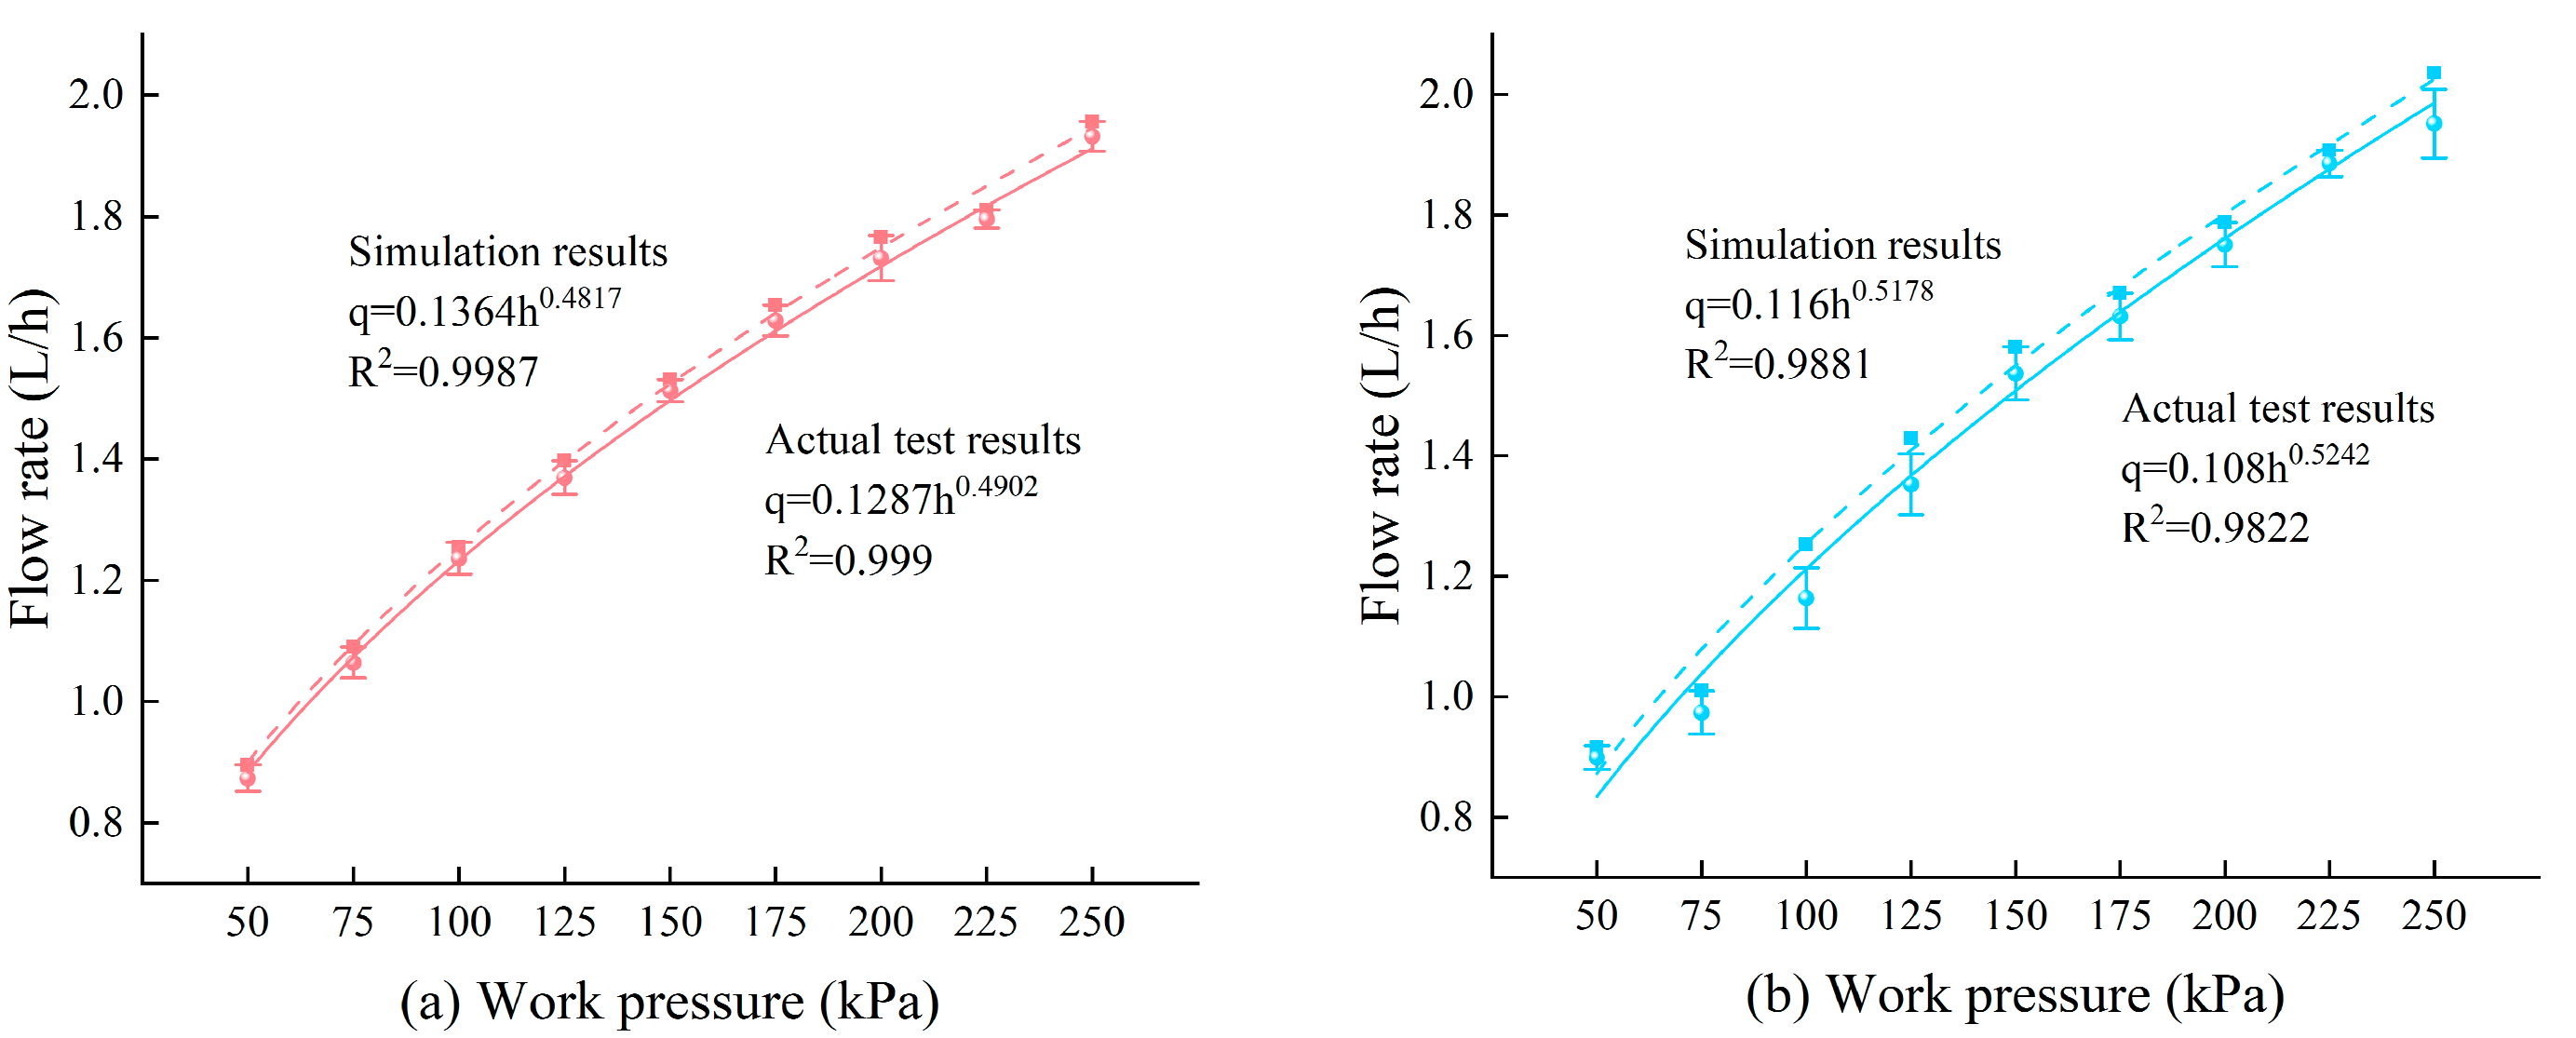
Figure 5.
Short-cycle anti-clogging test results.
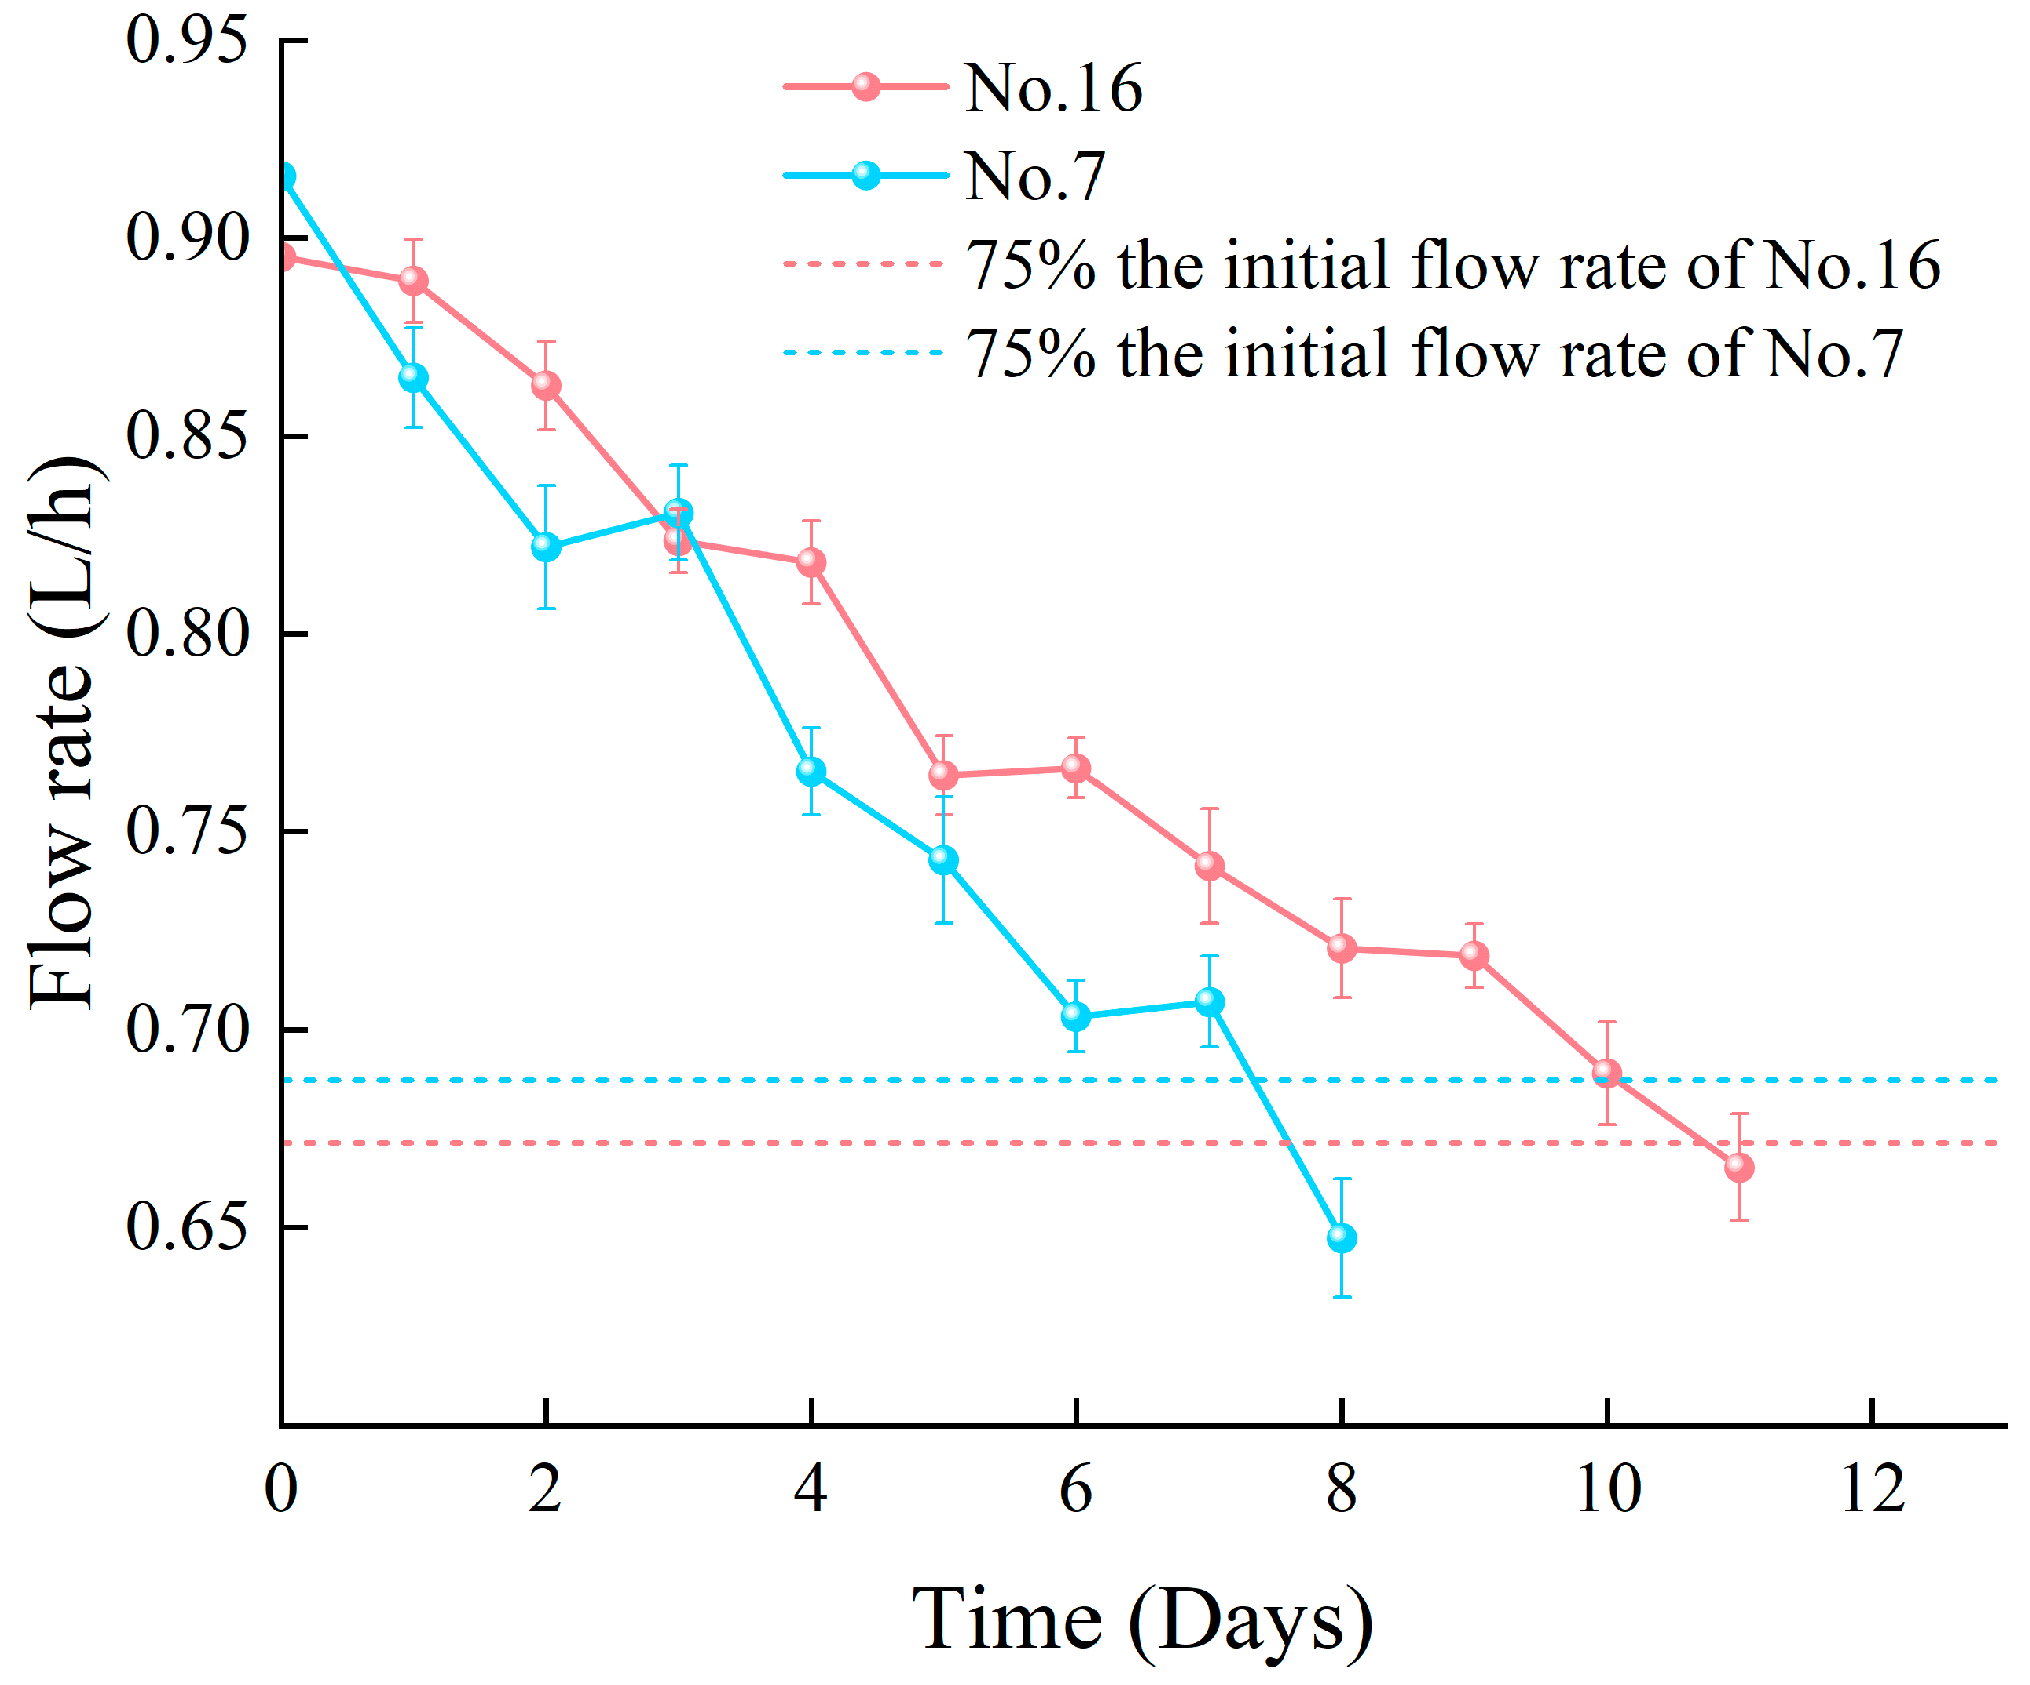
Figure 6.
Relationship between flow channel structure parameters and sand passage rate and percent decrease in velocity.
Figure 6.
Relationship between flow channel structure parameters and sand passage rate and percent decrease in velocity.
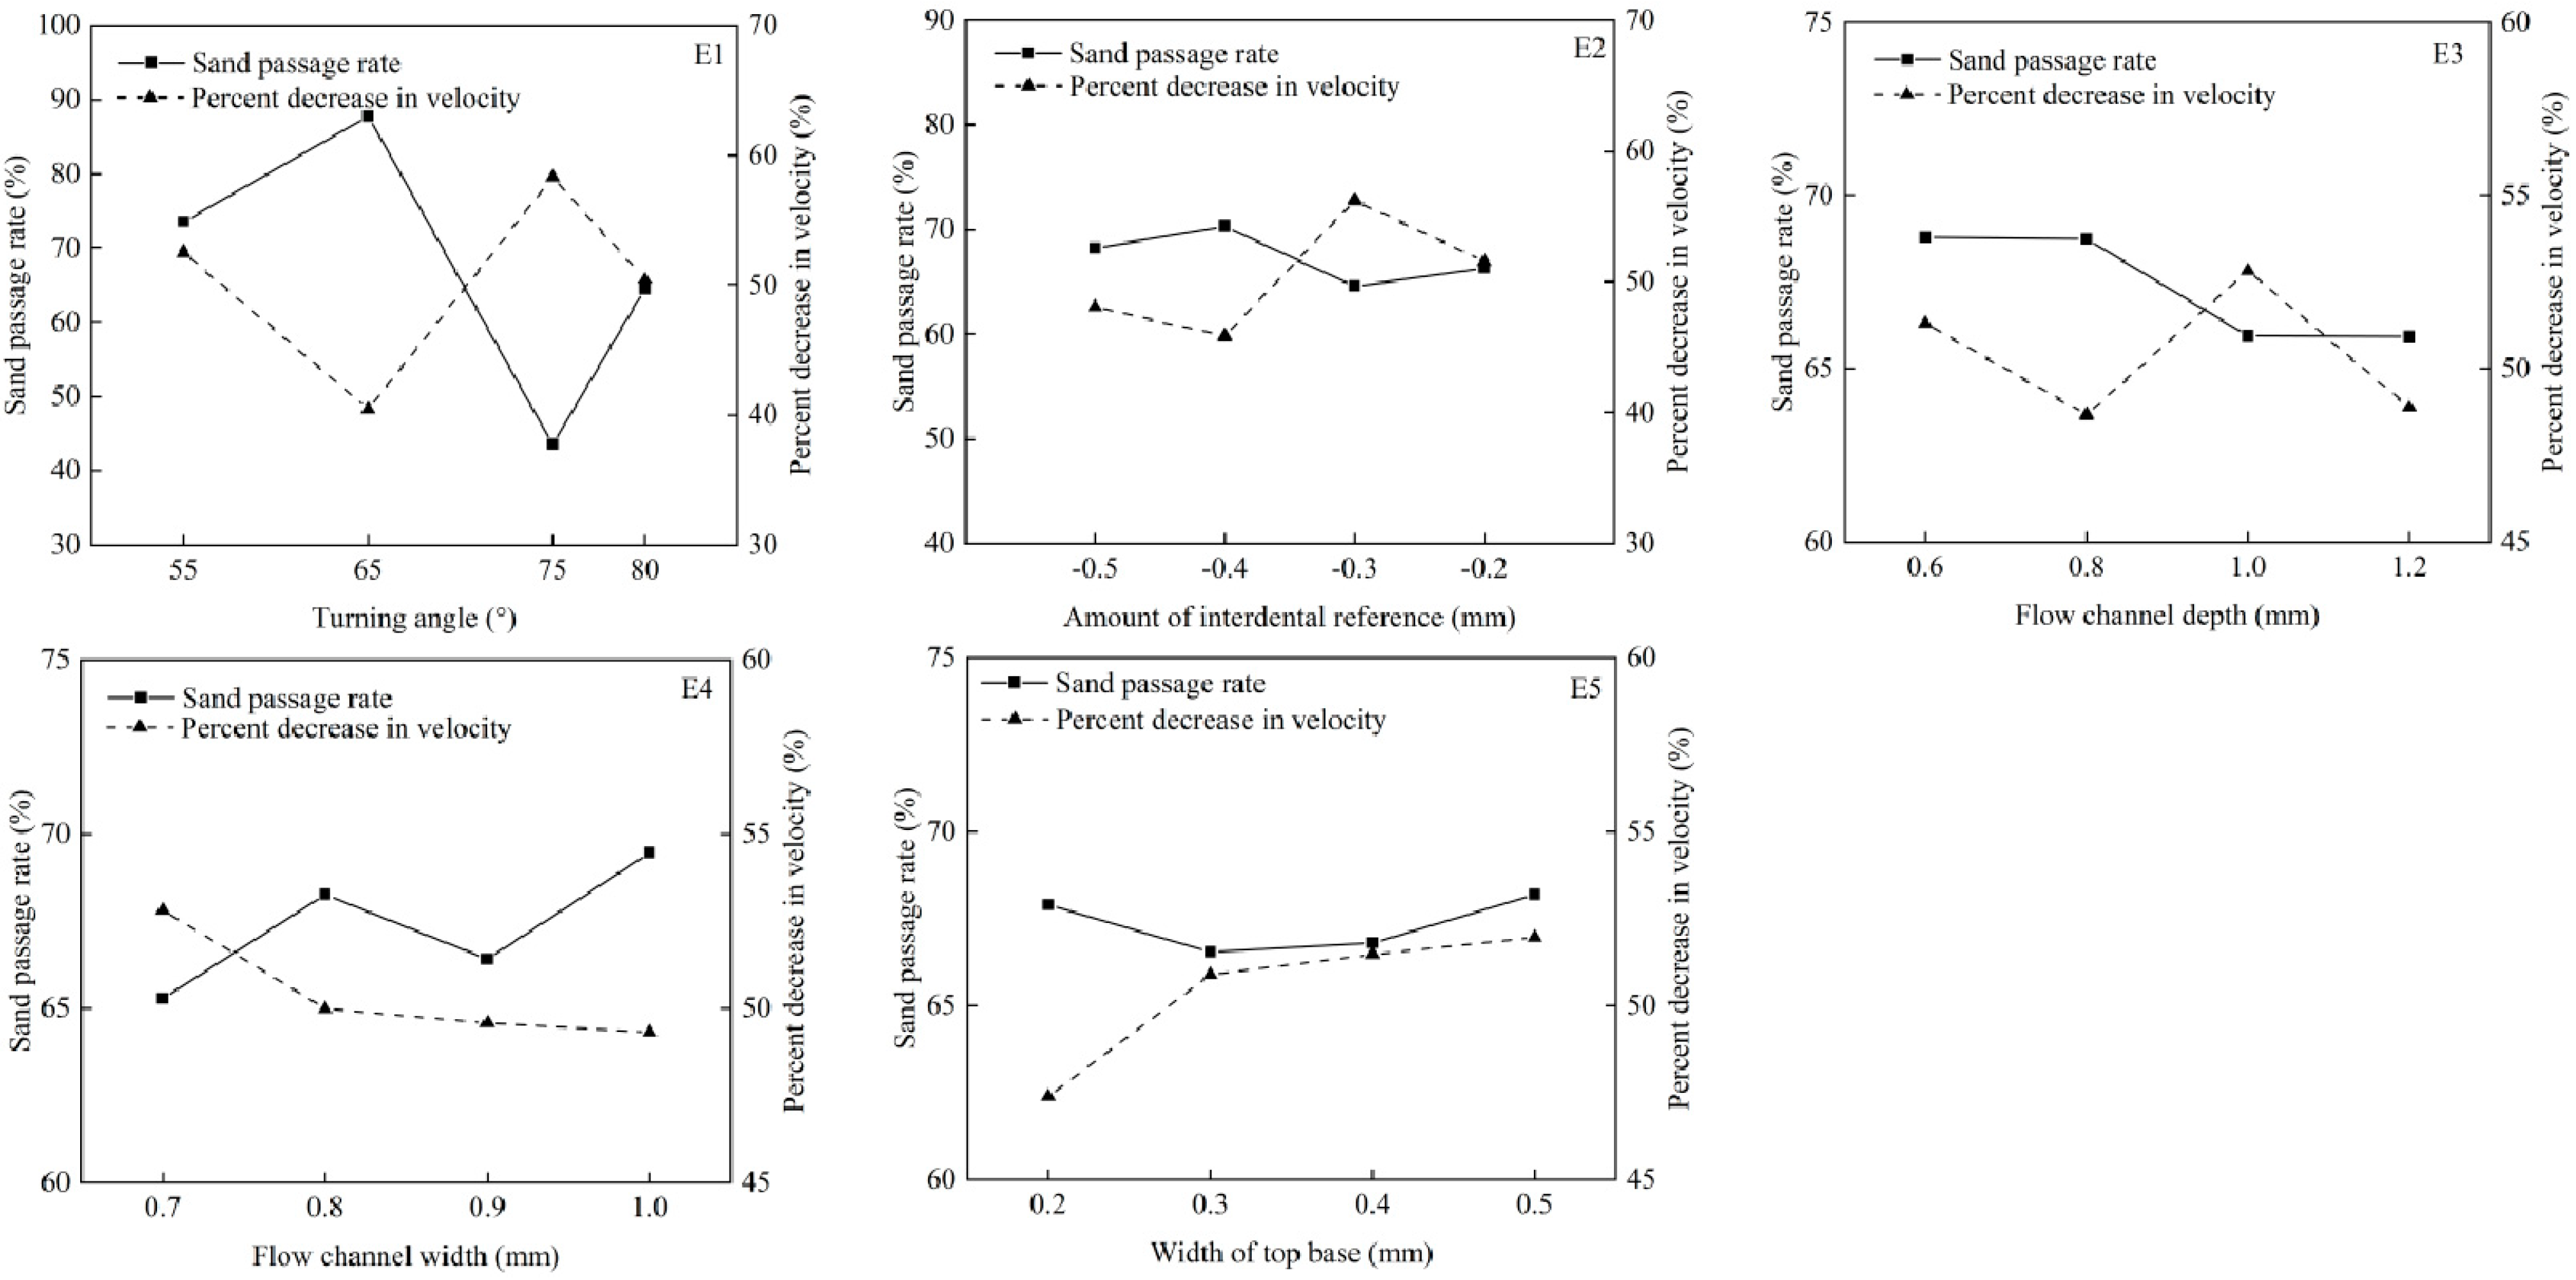
Figure 7.
Flow channel flow vector diagram. (a) No. 16 and (b) No. 7.
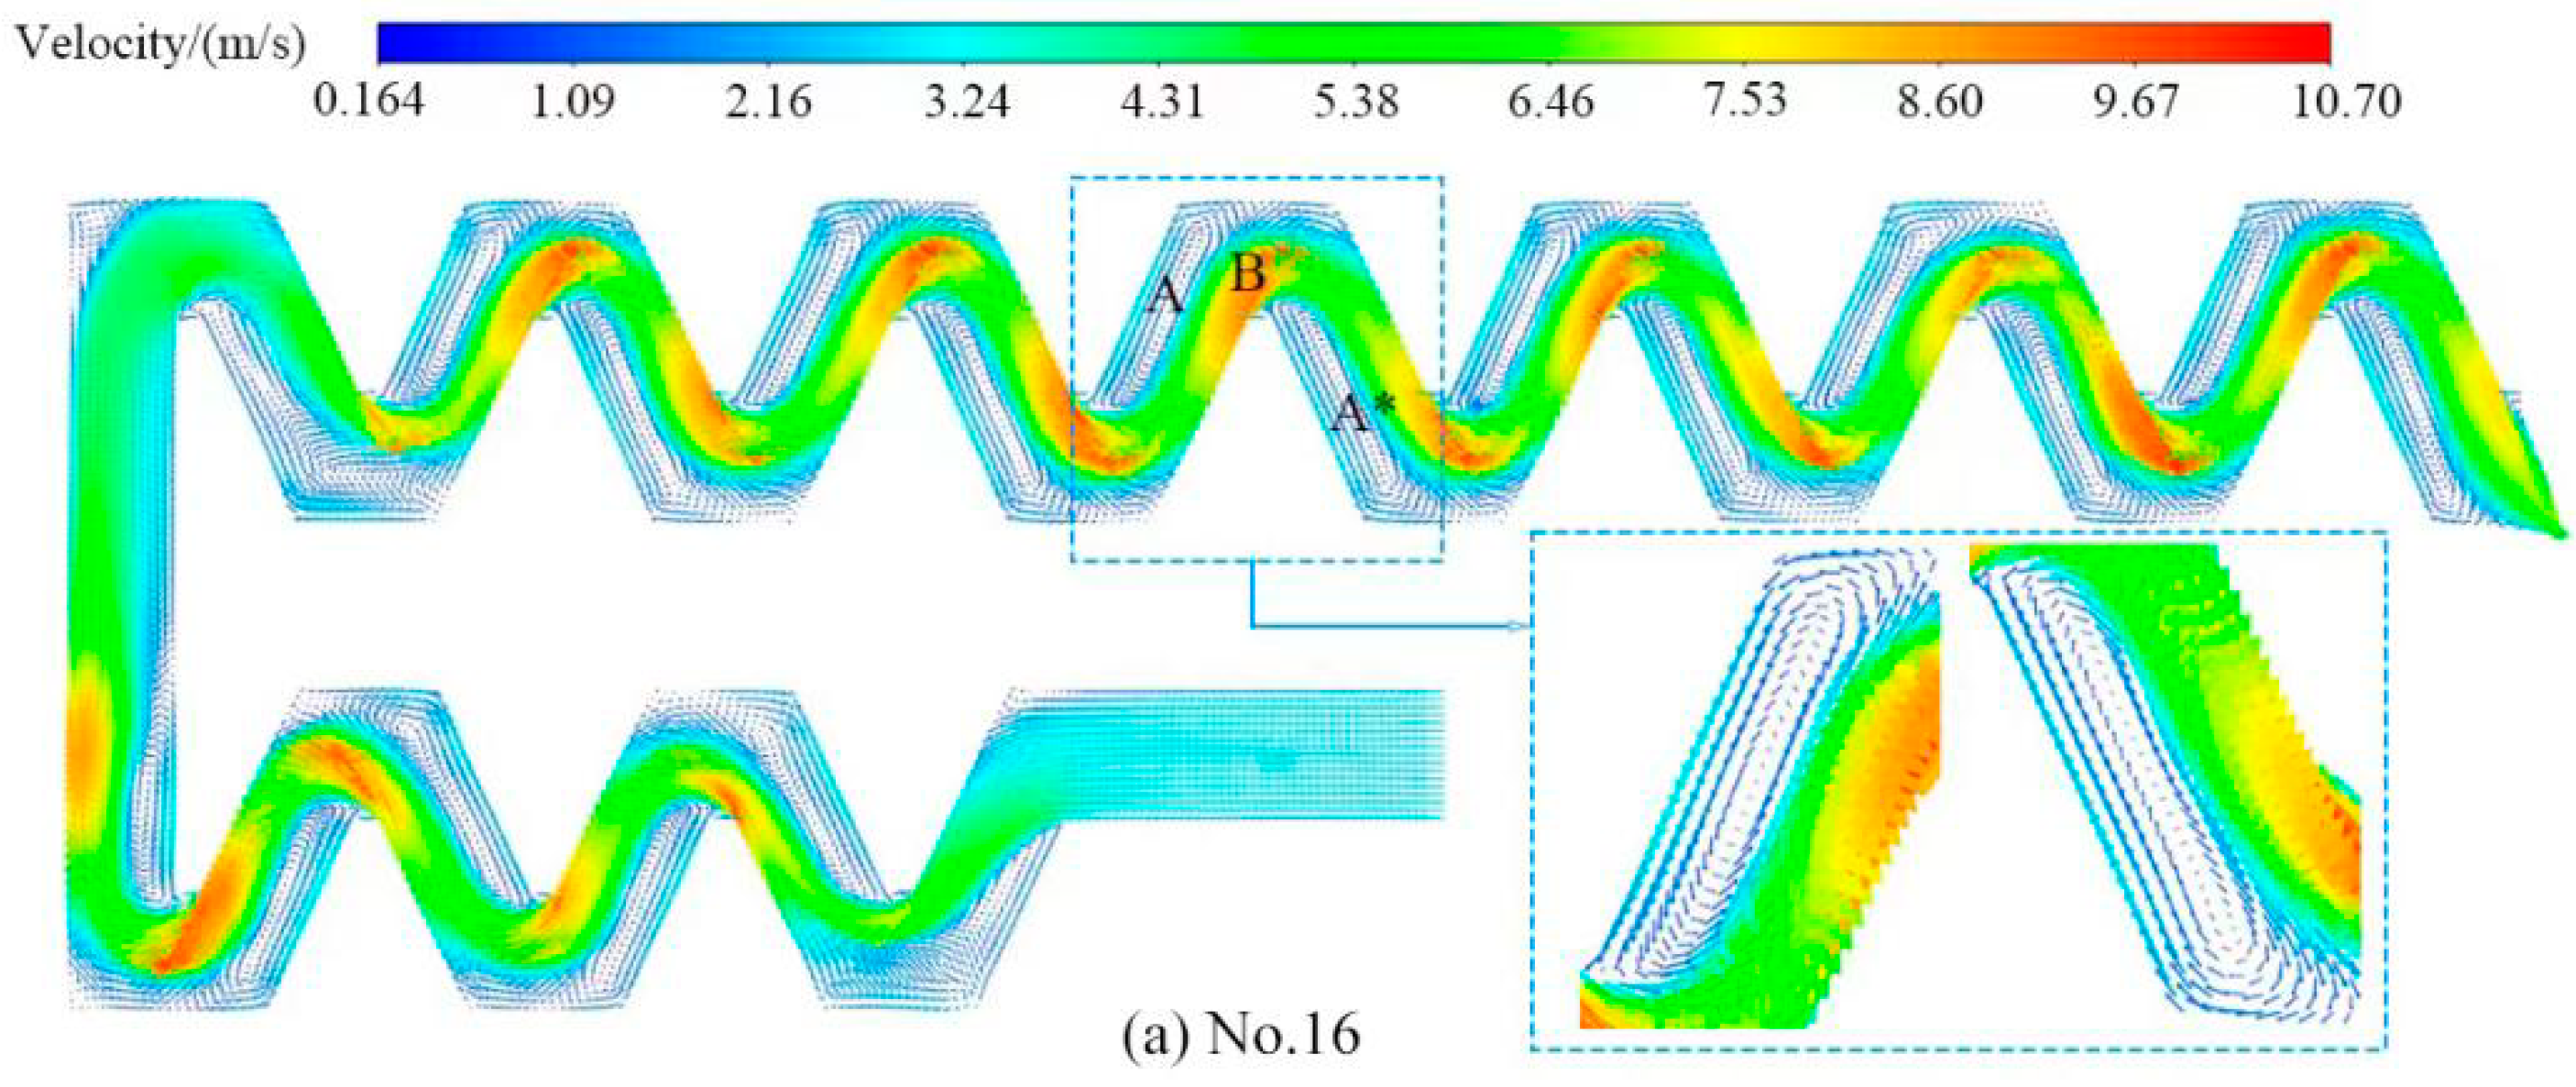
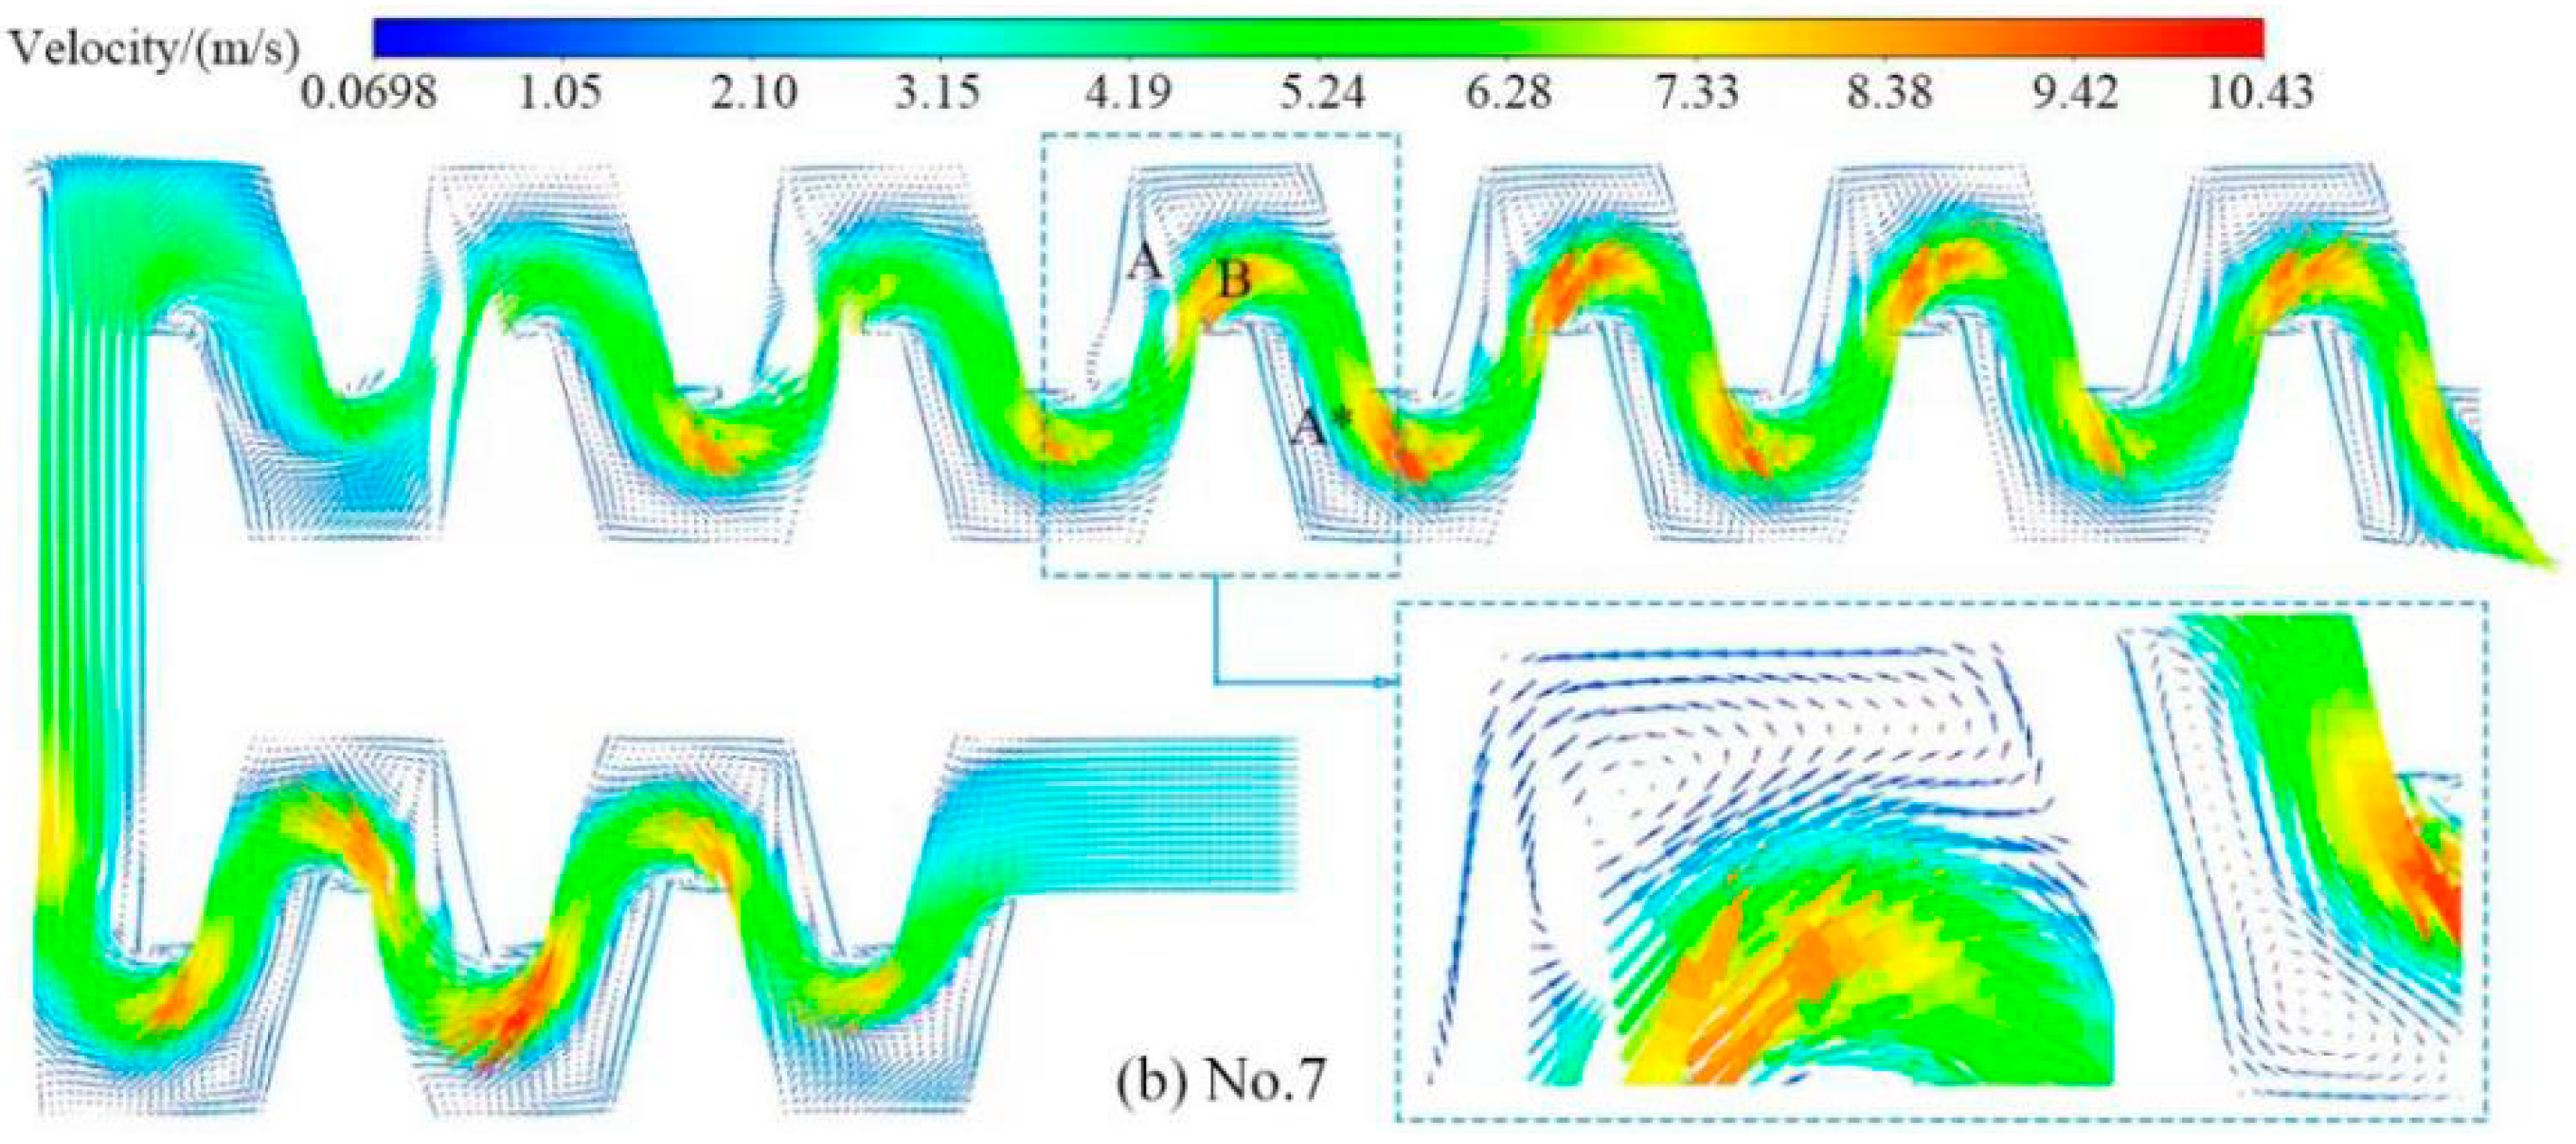
Figure 8.
Distribution of sand particles. (a) No. 16 and (b) No. 7.
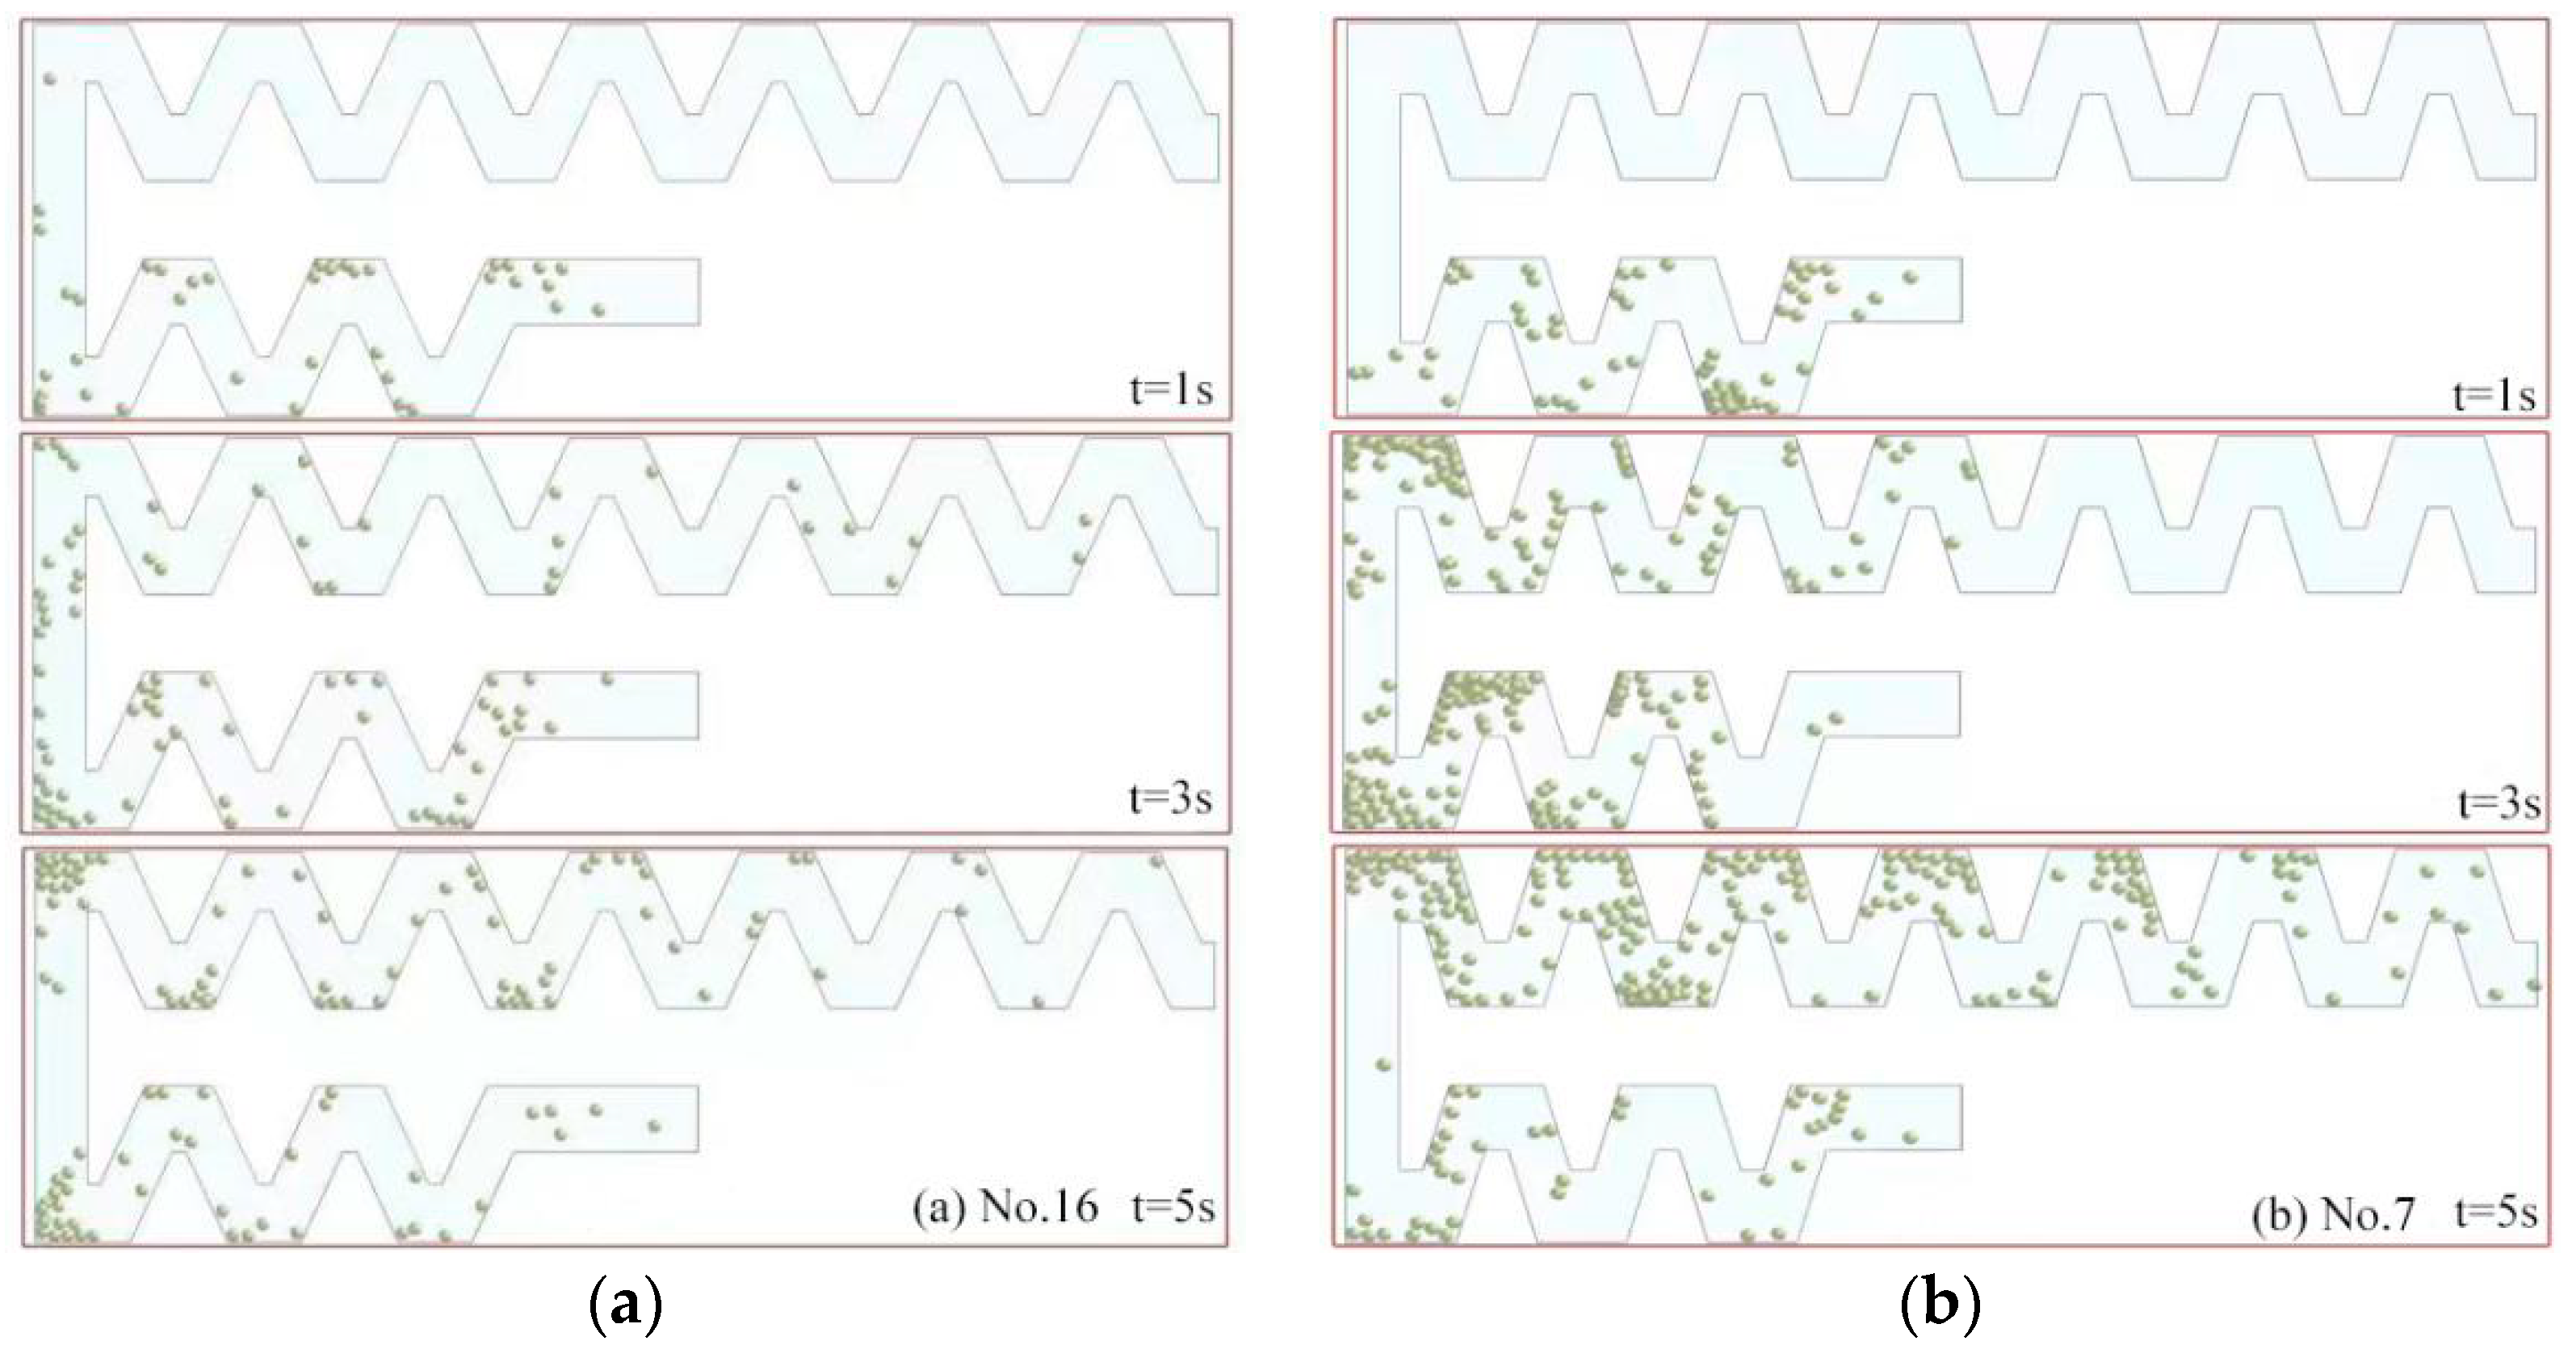
Figure 9.
Turbulence kinetic energy distribution in flow channels No. 16 and No. 7.
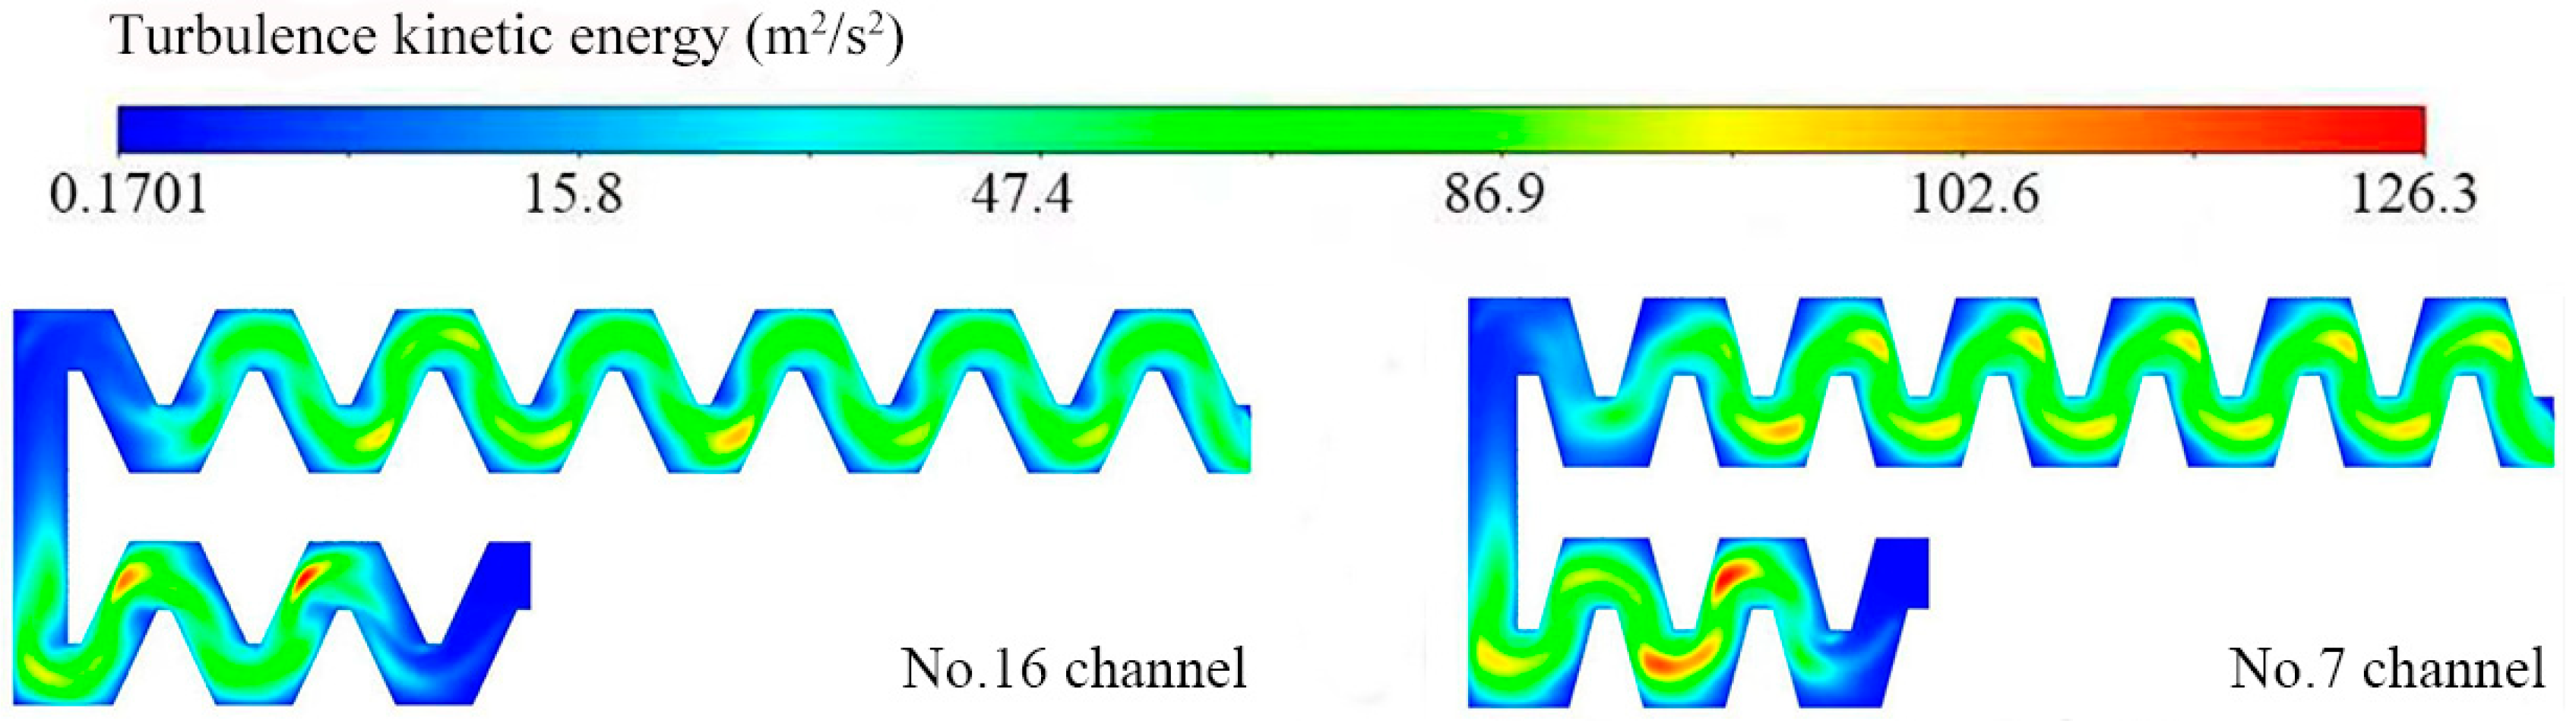
Figure 10.
Distribution of turbulence dissipation rate in flow channels No. 16 and No. 7.
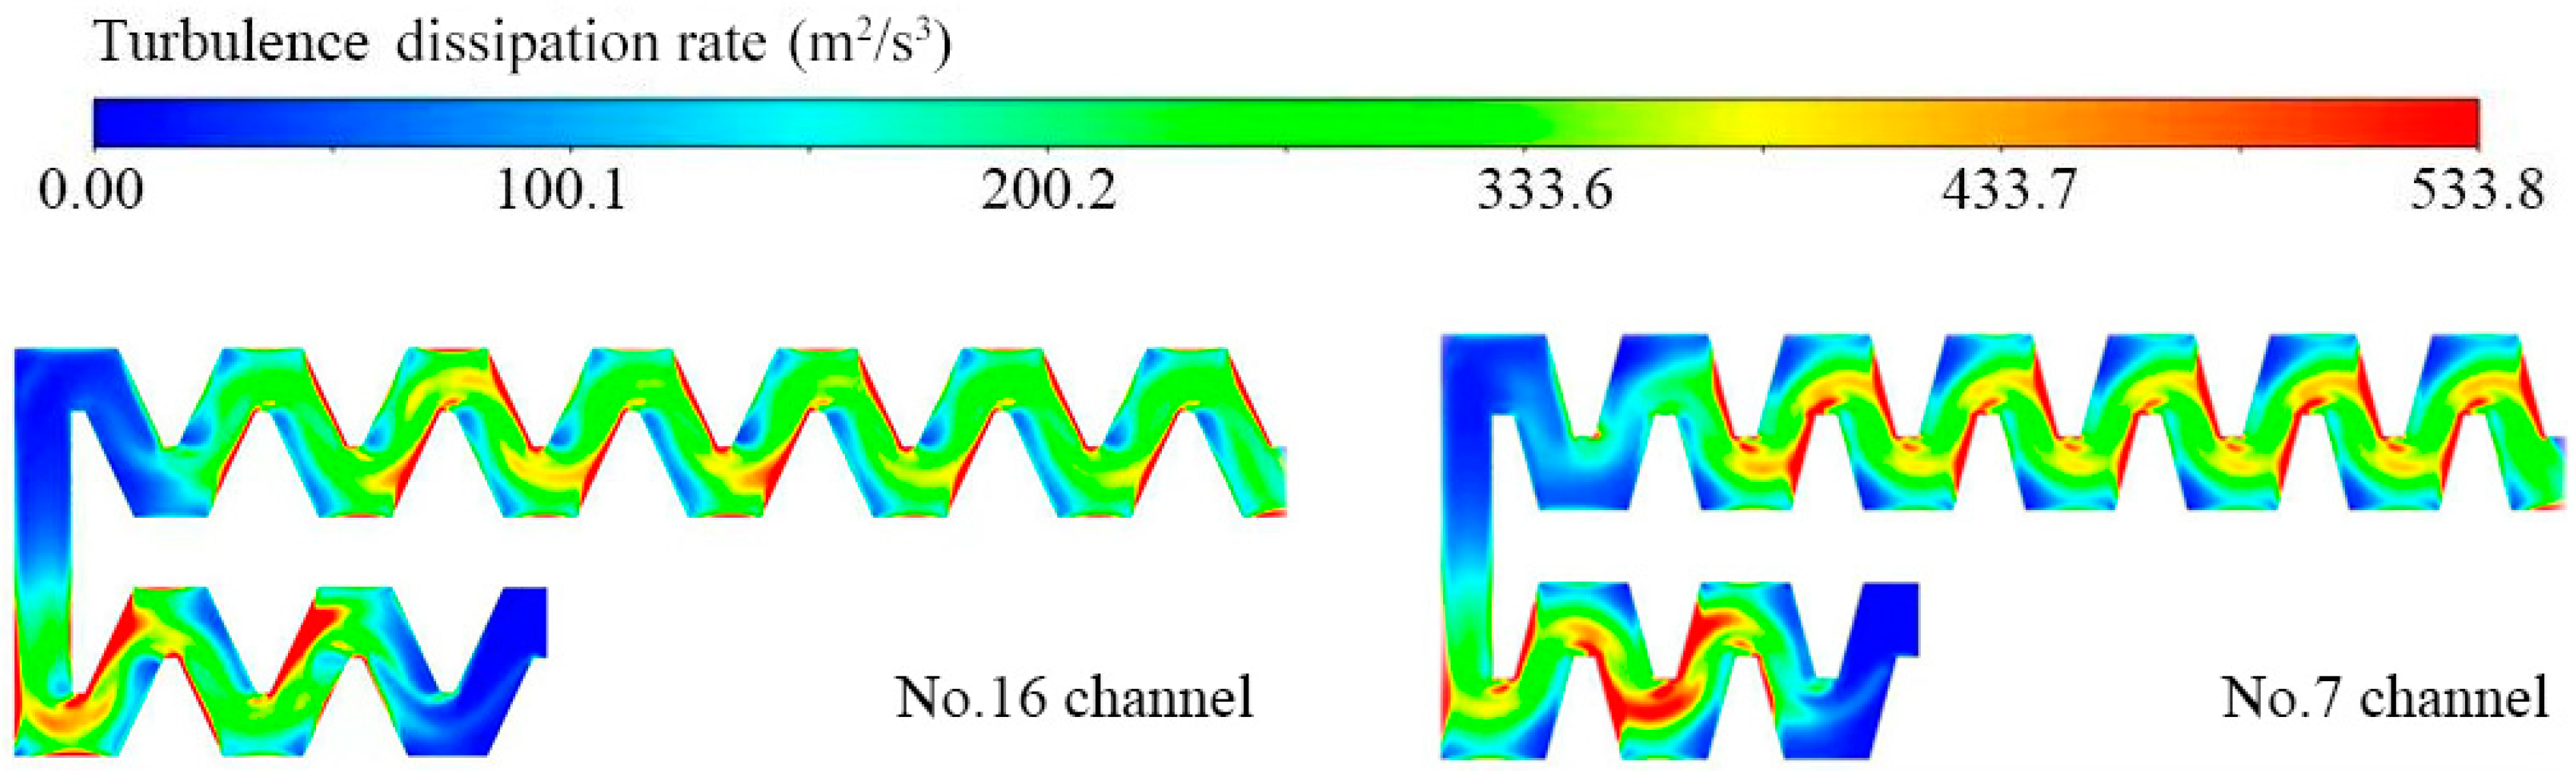
Figure 11.
Flow–pressure curves at different turning angles: (a) 65° and (b) 75°.

Table 1.
Structure parameter values.
| Level | Turning Angle α/(°) | Flow Channel Width W/(mm) | Flow Channel Depth D/(mm) | Width of Top Base L/(mm) | Amount of Interdental Reference J/(mm) |
|---|---|---|---|---|---|
| 1 | 80 | 0.7 | 0.6 | 0.2 | −0.2 |
| 2 | 75 | 0.8 | 0.8 | 0.3 | −0.3 |
| 3 | 65 | 0.9 | 1.0 | 0.4 | −0.4 |
| 4 | 55 | 1.0 | 1.2 | 0.5 | −0.5 |
Table 2.
Model parameters of sand particles and water flow.
| Research Subjects | Parameters | Symbol | Unit | Numerical Value |
|---|---|---|---|---|
| sand particles | Density of sand particles | ρ | kg/m3 | 2500 |
| Diameter | di | μm | 100 | |
| Poisson’s ratio | V | – | 0.4 | |
| Shear modulus | E | N/m2 | 7.143 × 10⁶ | |
| Young’s modulus | E | N/m2 | 2 × | |
| Recovery coefficient | c | – | 0.5 | |
| Rolling friction coefficient | – | 0.3 | ||
| Sliding frictioncoefficient | – | 0.01 | ||
| Initial velocity of the sand | – | m/s | 0.2 (80°, 75°), 0.3 (65°, 55°) | |
| Water | Density | ρ | kg/m3 | 998.20 |
| Viscosity | m | kg/m/s | 0.001 | |
| Inlet pressure | – | Pa | 50,000 | |
| outlet pressure | – | Pa | 0 |
Table 3.
Relevant equations and descriptions of the forces on the sand grain population.
| Designation | Formula | Instruction |
|---|---|---|
| Water phase continuity equation | ||
| Phase continuity equation of sand particles | ||
| Normal force between sand particles | ||
| Normal nylon resistance between sand grains | ||
| Tangential force between sand particles | ||
| Tangential nylon resistance between sand grains | ||
| Sliding friction |
Table 4.
Drip emitter structure parameters, pass rate, and flow index orthogonal test results.
| Test Serial Number | Turning Angle | Flow Channel Width | Flow Channel Depth | Width of Top Base | Amount of Interdental Reference | Average Speed of Sand Particles/(m/s) | Initial Velocity of Sand Particles/(m/s) | Percentage Decrease in Sand Velocity/% | Sand Passage Rate/% | Flow Index |
|---|---|---|---|---|---|---|---|---|---|---|
| 1 | 80 | 0.9 | 0.8 | 0.5 | −0.4 | 0.04474 | 0.08104 | 44.79% | 68.79% | 0.5044 |
| 2 | 75 | 0.8 | 1.0 | 0.5 | −0.2 | 0.04055 | 0.1094 | 62.93% | 42.84% | 0.5369 |
| 3 | 80 | 0.7 | 0.6 | 0.2 | −0.2 | 0.0266 | 0.0759 | 51.78% | 63.43% | 0.5061 |
| 4 | 75 | 1.0 | 1.2 | 0.2 | −0.4 | 0.04661 | 0.08972 | 48.05% | 47.77% | 0.5156 |
| 5 | 55 | 0.9 | 1.0 | 0.2 | −0.3 | 0.06478 | 0.1501 | 56.84% | 68.92% | 0.5011 |
| 6 | 80 | 0.8 | 1.2 | 0.4 | −0.3 | 0.04353 | 0.09738 | 55.30% | 60.72% | 0.5047 |
| 7 | 75 | 0.7 | 0.8 | 0.3 | −0.3 | 0.0299 | 0.08597 | 65.22% | 39.26% | 0.5178 |
| 8 | 65 | 0.9 | 1.2 | 0.3 | −0.2 | 0.073 | 0.121 | 39.67% | 83.53% | 0.5055 |
| 9 | 55 | 0.7 | 1.2 | 0.5 | −0.5 | 0.05442 | 0.1147 | 52.55% | 71.76% | 0.4958 |
| 10 | 80 | 1.0 | 1.0 | 0.3 | −0.5 | 0.04931 | 0.09827 | 49.82% | 65.31% | 0.4941 |
| 11 | 55 | 1.0 | 0.8 | 0.4 | −0.2 | 0.028 | 0.059 | 51.84% | 75.45% | 0.4917 |
| 12 | 55 | 0.8 | 0.6 | 0.3 | −0.4 | 0.04884 | 0.09548 | 48.85% | 78.04% | 0.4924 |
| 13 | 65 | 1.0 | 0.6 | 0.5 | −0.3 | 0.054 | 0.09334 | 47.58% | 89.35% | 0.4799 |
| 14 | 65 | 0.7 | 1.0 | 0.4 | −0.4 | 0.03287 | 0.05643 | 41.73% | 86.65% | 0.4871 |
| 15 | 75 | 0.9 | 0.6 | 0.4 | −0.5 | 0.0564 | 0.1312 | 57.02% | 44.38% | 0.5144 |
| 16 | 65 | 0.8 | 0.8 | 0.2 | −0.5 | 0.03632 | 0.0541 | 32.87% | 91.48% | 0.4817 |
Table 5.
ANOVA of the effect of structural parameters of drip emitters on sand passage rate and flow index.
Table 5.
ANOVA of the effect of structural parameters of drip emitters on sand passage rate and flow index.
| Structure Parameters | Sum of Squares of Partial Variances | Degree of Freedom | F | Significance (Sand Passage Rate) | Significance (Flow Index) |
|---|---|---|---|---|---|
| turning angle | 1266.444 | 4 | 5.906 | 0.064 * | 0.074 * |
| Flow channel width | 22.984 | 4 | 0.76 | 0.785 | 0.603 |
| Flow channel depth | 25.901 | 4 | 0.085 | 0.772 | 0.398 |
| Width of top base | 0.251 | 4 | 0.01 | 0.977 | 0.841 |
| Amount of interdental reference | 26.496 | 4 | 0.087 | 0.770 | 0.210 |
Note: * indicates a significant effect at p < 0.10.
Table 6.
Regression analysis of flow index and sand passage rate for turning angles of 65° and 75°.
| Structure Parameters | Non-Standardized Coefficient | Standardization Coefficient | Significance | Variance Expansion Coefficient |
|---|---|---|---|---|
| Constant term | 593.418 | — | 0.002 | — |
| Flow index | −1046.029 | −0.883 | 0.004 ** | 1.000 |
Note: ** indicates a significant effect at p < 0.01.
Disclaimer/Publisher’s Note: The statements, opinions and data contained in all publications are solely those of the individual author(s) and contributor(s) and not of MDPI and/or the editor(s). MDPI and/or the editor(s) disclaim responsibility for any injury to people or property resulting from any ideas, methods, instructions or products referred to in the content. |
© 2023 by the authors. Licensee MDPI, Basel, Switzerland. This article is an open access article distributed under the terms and conditions of the Creative Commons Attribution (CC BY) license (https://creativecommons.org/licenses/by/4.0/).
Share and Cite
MDPI and ACS Style
Xu, T.; Bao, S.; Li, Z.; Yu, Q.; Zheng, E. The Study of Structural Optimization on Hydraulic Performance and Anti-Clogging Performance of Labyrinth Drip Irrigation Emitters. Agronomy 2023, 13, 2496. https://doi.org/10.3390/agronomy13102496
AMA Style
Xu T, Bao S, Li Z, Yu Q, Zheng E. The Study of Structural Optimization on Hydraulic Performance and Anti-Clogging Performance of Labyrinth Drip Irrigation Emitters. Agronomy. 2023; 13(10):2496. https://doi.org/10.3390/agronomy13102496
Chicago/Turabian StyleXu, Tianyu, Sanlin Bao, Zonglei Li, Qiuyue Yu, and Ennan Zheng. 2023. "The Study of Structural Optimization on Hydraulic Performance and Anti-Clogging Performance of Labyrinth Drip Irrigation Emitters" Agronomy 13, no. 10: 2496. https://doi.org/10.3390/agronomy13102496
Note that from the first issue of 2016, this journal uses article numbers instead of page numbers. See further details here.