
Irrigation Water and Nitrogen Fertilizer Management in Potato (Solanum tuberosum L.): A Review
by
 ,
,
Bhimsen Shrestha
1,
Murali Darapuneni
2,
Blair L. Stringam
1,
Kevin Lombard
3 and
Koffi Djaman
3,*
1
Department of Plant and Environmental Sciences, New Mexico State University, 1780 E University Ave, Las Cruces, NM 88003, USA
2
Department of Plant and Environmental Sciences, New Mexico State University, Rex E. Kirksey Agricultural Science Center at Tucumcari, 6502 Quay Road Am.5, Tucumcari, NM 88401, USA
3
Department of Plant and Environmental Sciences, New Mexico State University, Agricultural Science Center at Farmington, Farmington, NM 87499, USA
*
Author to whom correspondence should be addressed.
Agronomy 2023, 13(10), 2566; https://doi.org/10.3390/agronomy13102566
Submission received: 14 September 2023
/
Revised: 2 October 2023
/
Accepted: 3 October 2023
/
Published: 6 October 2023
(This article belongs to the Special Issue The Effects of Irrigation and Fertilization Management on Cropping Systems)
Abstract
:Intensive irrigation and nutrient management practices in agriculture have given rise to serious issues in aquifer water depletion and groundwater quality. This review discusses the effects of irrigation and nitrogen management practices on potato growth, yield, and quality, and their impacts on water and nitrogen use efficiencies. This review also highlights the economics and consequences of applying deficit irrigation strategies in potato production. Many researchers have demonstrated that excessive irrigation and nitrogen application rates negatively impact potato tuber yield and quality while also increasing nitrate leaching, energy consumption, and the overall costs of production. An application of light-to-moderate deficit irrigation (10–30% of full irrigation) together with reduced nitrogen rates (60–170 kg/ha) has a great potential to improve water and nitrogen use efficiencies while obtaining optimum yield and quality in potato production, depending on the climate, variety, soil type, and water availability. There is an opportunity to reduce N application rates in potato production through deficit irrigation practices by minimizing nitrate leaching beyond the crop root zone. The best irrigation and nitrogen management techniques for potato production, as discussed in this review, include using sprinkle and drip irrigation techniques, irrigation scheduling based on local crop coefficients, soil moisture content, and crop modeling techniques, applying slow-release nitrogenous fertilizers, split nitrogen application, and applying water and nitrogenous fertilizers in accordance with crop growth stage requirements.
1. Introduction
1.1. Background Information
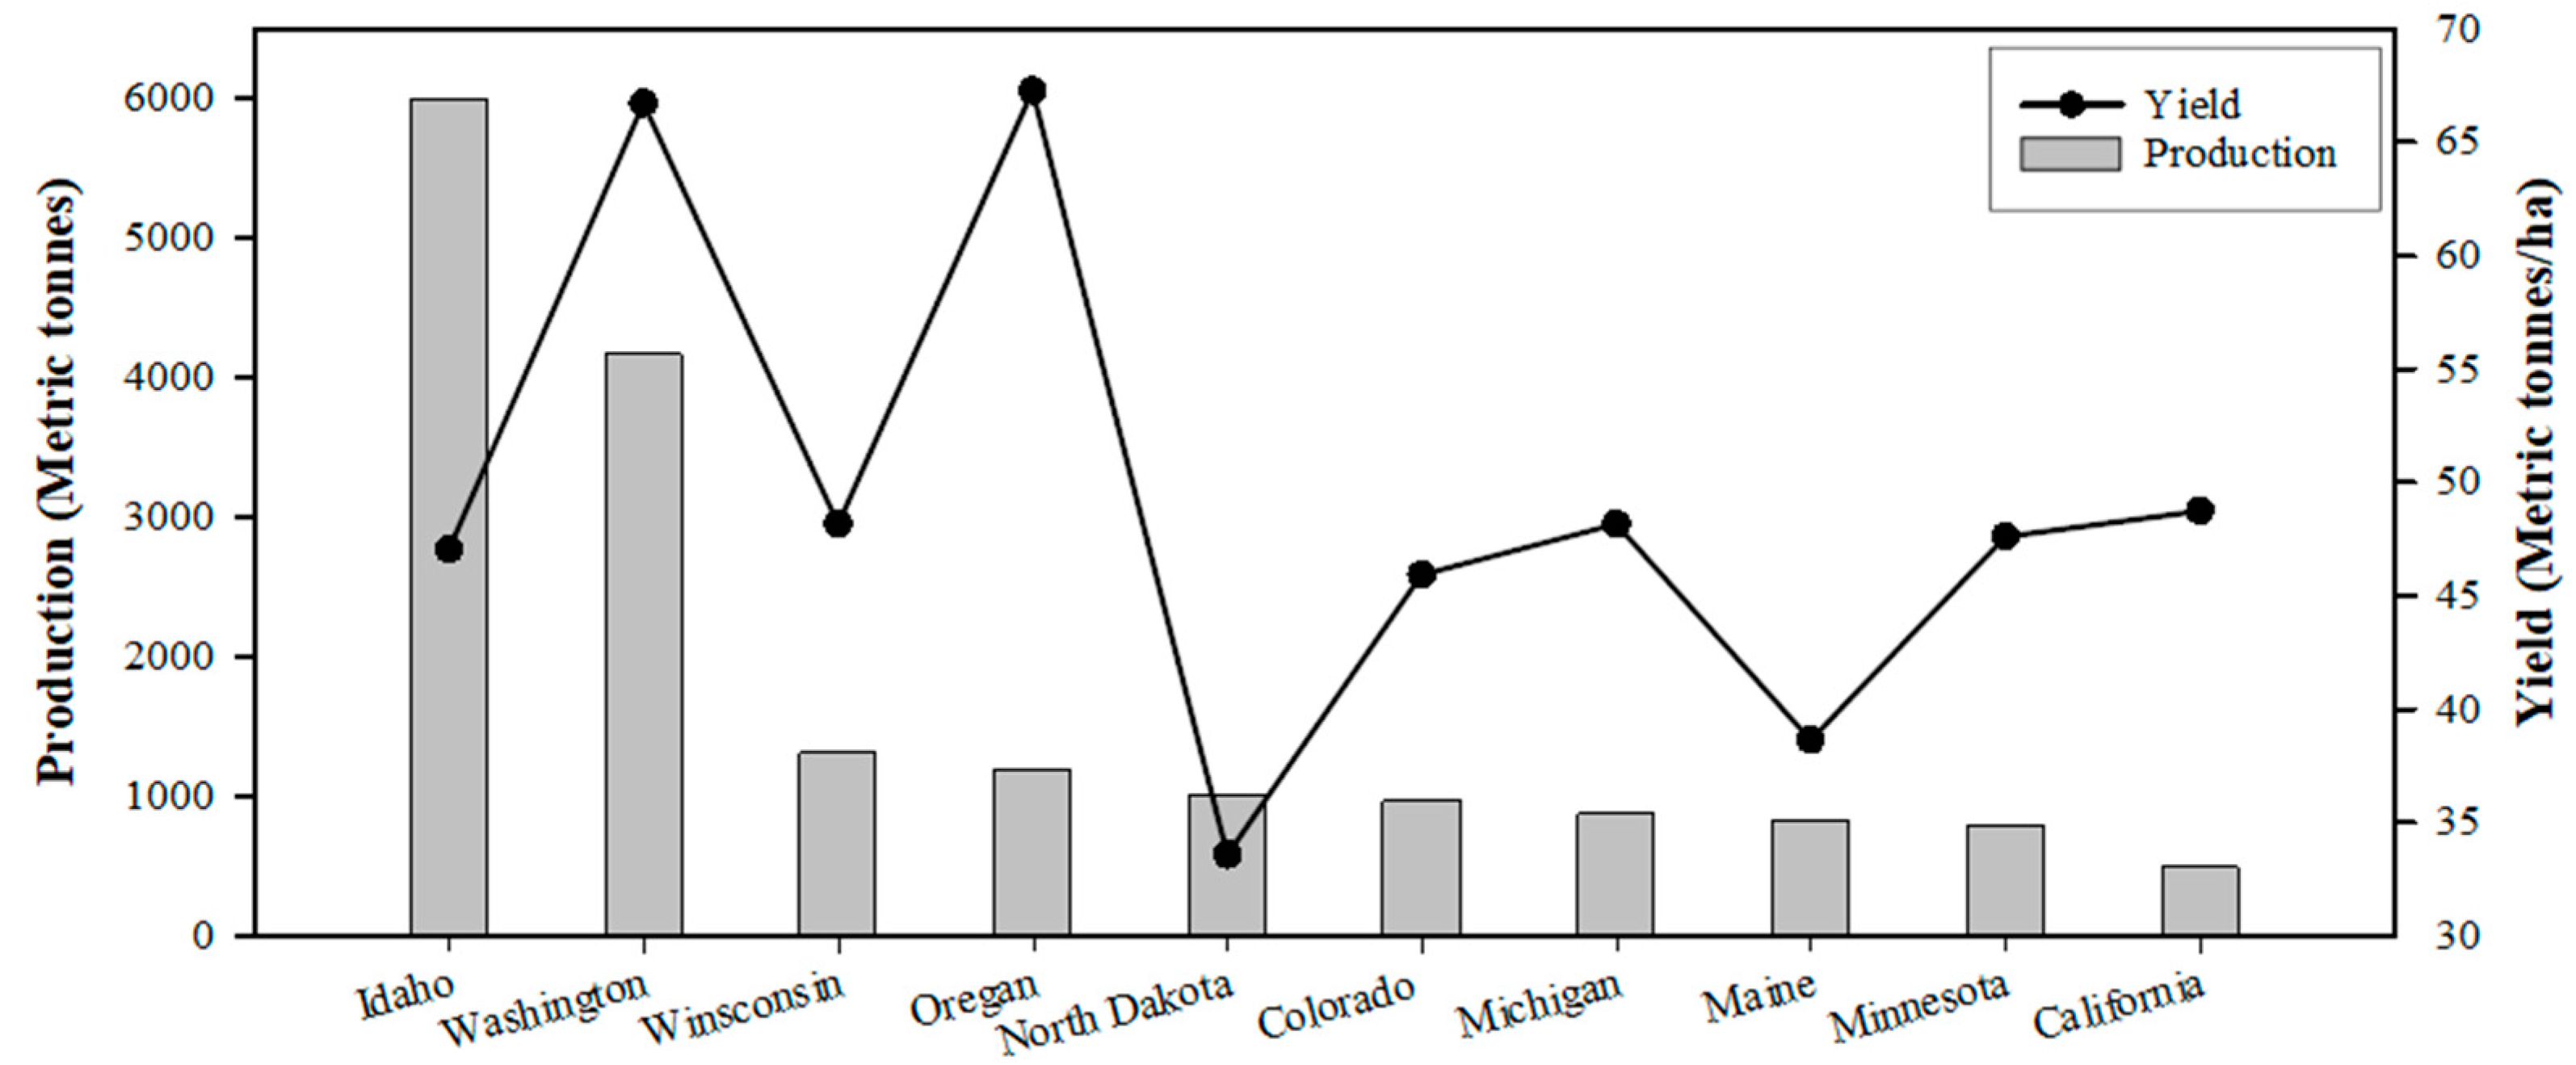
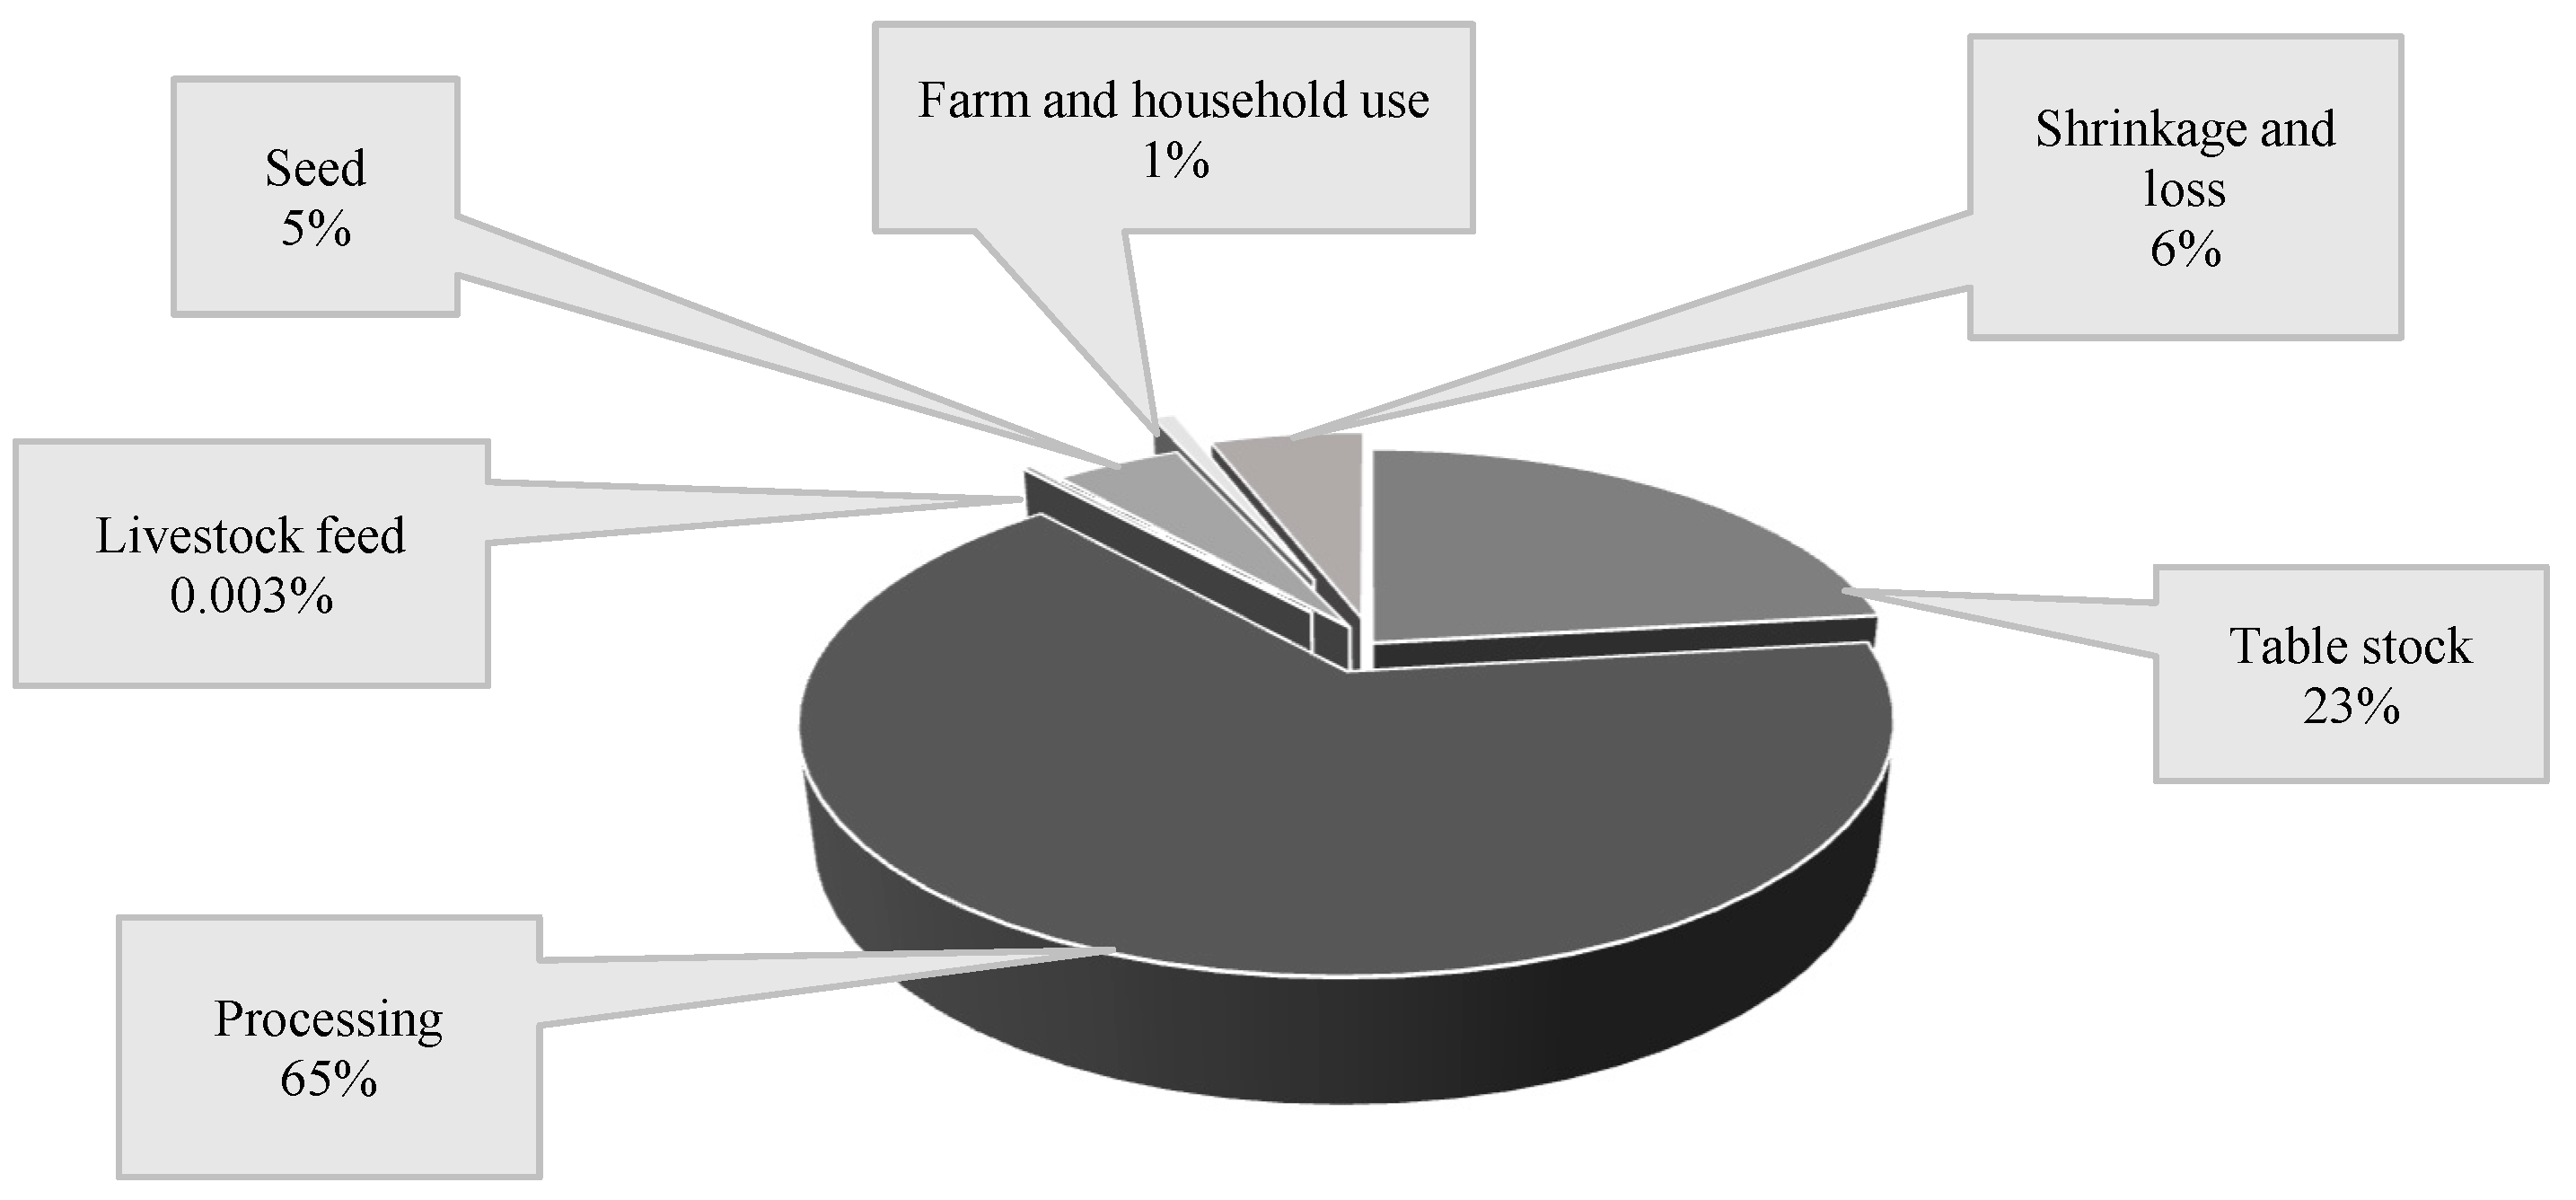
The potato (Solanum tuberosum L.) is the fourth most important food crop in the world in terms of production volume after corn, wheat, and rice, with China, India, Ukraine, and the United States of America (USA) being the top four potato-producing countries (Figure 1) [1]. In the USA, the annual potato production accounts for 18.5 million metric tons and is valued at $4.17 billion, with Idaho and Washington as the two leading potato-producing states (Figure 2) [2]. About 65% of the national potato production is used as processed food, while another 23% is utilized for tablestock consumption (Figure 3) [2]. The majority of processed potatoes are used in making fries, canned forms (whole or sliced, hash, stews, and soups), and chips. The potato is a nutritionally rich vegetable crop consumed worldwide. It is a good source of vitamins (C, B3, B6, and B9) and minerals, like potassium, iron, phosphorus, magnesium, calcium, zinc, etc. [3].
Irrigation and nutrient management are crucial for the optimum yield and quality of potato tubers [4,5]. Among various essential nutrients, nitrogen is a key macronutrient that significantly affects potato crop yield and quality [4]. Hence, farmers are likely to apply higher nitrogen doses intentionally to obtain a higher tuber yield. A recent study performed in Japan reported that about 50% of farmers in the study applied higher nitrogen rates than the recommended rates [6]. However, excessive nitrogen application rates reduce nitrogen recovery and nitrogen use efficiency and increase the cost of production in potato crops [7]. Hopkins et al. [8] demonstrated that potato production under a high-input-based maximum yield management scheme had 1.7–13.2% higher fertilizer and pesticide costs than research-based best management practices. Similarly, both over- and under-irrigation negatively affect crop growth and development [9]. Irrigation strategies that apply water below plant evapotranspiration (ET) requirements can be used efficiently without reducing the tuber yield and quality of chipping potatoes [10]. The application of water below full crop water requirements, i.e., crop evapotranspiration requirements, is termed as deficit irrigation practice. Thus, deficit irrigation (DI) can be used as an alternative water-saving irrigation strategy where the irrigation water is limited, similar to arid and semi-arid regions [11]. In addition, the processing quality of chipping potato tubers depends on their chemical composition, which is influenced by irrigation levels and nitrogen fertilization [10]. Thus, an understanding of the response of potatoes to nitrogen fertilizer and irrigation water is required to improve nitrogen and water use efficiencies in potato crops and the production system’s sustainability. This review paper investigates outcomes related to various irrigation and nitrogen management practices, as well as their interaction effects in the potato production system. The effects of variable irrigation and nitrogen rates on the water and nitrogen use efficiencies of potato crops have also been discussed in this study.
1.2. Need for Sustainable Use of Water and Nitrogen Resources
Nitrate-nitrogen (NO3−) is one of the potential nutrients that can deteriorate water quality, with the U.S. Environmental Protection Agency (EPA)’s maximum limit of 10 mg/L in drinking water [12]. There are public health concerns with NO3− leaching to drinking water (e.g., Methemoglobinemia or blue baby syndrome), which entails the need and importance to match N application with crop needs instead of over-application [13]. Irrigated potato production systems could become a significant potential source of nitrate contamination in underground water due to excessive irrigation water and chemical fertilizer applications [14]. Woli et al. [15] concluded that the N leaching increased with higher irrigation and nitrogen application rates. Potato growers can reduce water and nitrogen inputs by 10% and 30%, respectively, using simulation techniques to schedule irrigation and nitrogen fertilizer applications, ultimately reducing N leaching to underground water [14]. A predictive study conducted in Minnesota by Vashisht et al. [16] revealed that the current potato production level could be maintained by applying 390 mm of water and 450 kg N/ha during the years 2048–2057; however, by the years 2058–2067, the same yield could not be attained even with increased N and irrigation levels, while there would be a sharp increase in leaching losses by 41–67%. The NO3− leaching simulation study in Washington state revealed that the highest NO3− leaching was observed during potato growing season when nitrogen rates were applied above the recommended dose, concluding that fertilizer rates should be reduced to effectively minimize NO3− leaching [17]. Climate change could also be a major factor resulting in huge potato yield losses. In a simulation study using the SUBSTOR potato model, it is predicted that the worldwide potato tuber yield could be reduced by 2 to 26%, with potentially greater reductions occurring in high latitude regions (Eastern Europe and Northern America) and lowlands of Africa, compared to mid-latitude and tropical highland regions [18]. Also, there are concerns with potential climate change issues and global warming due to greenhouse gas (GHG) emissions from agricultural farming systems. Carbon dioxide (CO2), nitrous oxide (N2O), and methane (CH4) are the principal GHGs emitted from potato fields and must be assessed to mitigate the effects of climate change [19]. According to Pishgar-Komleh et al. [20], overall GHG emissions from potato fields were 992.88 kg CO2 equivalent ha−1, with chemical fertilizers, particularly N fertilizer, contributing the most (37.27%) and irrigation water contributing 20.46% of total GHG emissions. There is evidence that increased N fertilization rates resulted in increased N2O emissions [21,22]. Similarly, it could be possible to minimize CH4 emissions and net global warming potential through irrigation optimization, as irrigation practices affect GHG emissions by regulating microbial activity in soil [23]. In addition to environmental concerns, a rise in fertilizer prices and energy costs may contribute to an increase in the cost of potato production. Brunelle et al. [24] predicted that the rise in fertilizer prices could reduce crop production by 6 to 13% by 2050. Pishgar-Komleh et al. [20] revealed that chemical fertilizers (49%), particularly nitrogen (40%), were the most energy consuming inputs in the potato production system. According to Terrel et al. [25], it was predicted that the declining Ogallala aquifer, due to excessive irrigation pumping, could reduce available irrigation water, resulting in reduced crop acreage and a negative economic impact on the Great Plains States in the United States. McGuire [26] reported that some parts of Texas, New Mexico, and Kansas have experienced a more than 150 ft. water level decline in the High Plains Aquifer during the period of 1950–2013. As the Ogallala aquifer is declining, Steiner et al. [27] and Rhodes et al. [28] encourage using efficient irrigation and water management techniques for the sustainable production of crops and long-term use of the Ogallala aquifer. Rodriguez et al. [29] also focused on the need to develop sustainable irrigation and fertilizer management strategies as the water footprint of potatoes (volume of water required to produce a unit of potato) in the Pampean region of Argentina has a higher proportion of grey water footprint that represents a higher volume of polluted water resources due to fertilizer leaching. Also, case studies performed by Pulido-Bosch et al. [30] reported that there is evident groundwater depletion and salinization due to intensive irrigation and agricultural practices in the Murray Basin aquifer of Australia, Quaternary phreatic aquifer of Algeria, Costa de Hermosillo aquifer of Mexico, and Southeast Spain aquifers. Hence, possible strategies for increasing aquifer lifespan in vulnerable regions include deficit irrigation, sub-surface drip irrigation, and efficient irrigation scheduling using soil moisture sensors [31].
2. Crop Water Use and Evapotranspiration Requirements in Potato
Irrigation management for potatoes is critical because of its shallow root system and the underground economic part, called tubers [5]. The efficient management of water and nutrients in potato cultivation is highly dependent on the top 40 cm of the soil [32,33]. The crop coefficient (Kc) approach has been widely used to estimate the crop evapotranspiration requirements, where Kc is the ratio of actual crop evapotranspiration (ETc) to reference evapotranspiration (ETo). Table 1 shows that the potato crop coefficient (Kc) gradually increases from the sprout development phase to the tuber bulking phase and gradually decreases until crop maturation. The seasonal Kc for potato crops ranges from 0.53 to 0.99 across various places worldwide. According to FAO-56 guidelines, the Kc values for potato crops are 0.5 for the initial crop stage, 1.15 for the mid-season stage, and 0.75 for the late-season stage [34]. However, for long-season potato cultivars with vine kill, Allen et al. [34] recommended a Kc value of 0.4 for the late-season stage. A technical report by Allen and Wright [35] demonstrated that the mean Kc values for typical potato crops were 0.2 at planting, 0.8 at full effective cover, and 0.15 at harvest. The Kc values reported by the U.S. Bureau of Reclamation (USBR) for ‘Russet’ potato varieties are 0.3 at emergence, 0.93 when rows are closed, and 0.5 when vines are dead, while for ‘Shepody’ potato varieties, Kc values are 0.3 at emergence, 0.92 when rows are closed, and 0.2 when vines are dead [36]. The average Kc values reported by Gonzalez et al. [37] for ‘Russet’ potatoes in Washington State were 0.4, 0.95, and 0.57 for initial, mid-season, and late-season stages, respectively. Compared to these Kc values, the FAO Kc values are higher by 25% and 20% for the initial and mid-season stages, respectively, while 30% lower for the late-season stage. Parent and Anctil [38] found Kc values of 0.63, 0.91, 0.81, and 0.78 for the vegetative growth (VG), tuber initiation (TI), tuber bulking (TB), and crop maturation (MT) stages, respectively, in loamy sand soils and humid continental climates of Quebec, Canada. Machakaire et al. [39] reported 1, 1.2, 1, and 0.9 Kc values for VG, TI, TB, and MT, respectively, in sandy soils and the semi-arid tropical climate of Limpopo, South Africa. Carvalho et al. [40] found Kc values of 0.35, 0.45, 1.29, and 0.63 during the planting to emergence and emergence to TI, TI, TB, and MT stages, respectively, in tropical regions of Brazil. Similarly, Kadam et al. [41] reported Kc values of 0.55, 1.11, and 1.01 during initial, mid-season and late-season stages in India, which were slightly lower than those recommended by Allen et al. [34]. Considering the disparities in Kc values with FAO, the authors indicated the necessity to conduct local studies to develop local Kc values for specific potato cultivars, soil types, regions, and climatic environments.
Generally, the water requirement of potato crops depends upon climatic conditions and ranges from 500 to 700 mm [42]. The actual evapotranspiration in the ‘Bowren’ potato variety ranged from 357.3 to 511.4 mm in Iraq [43]. A simulation study by Woli et al. [15] reported that the optimum amount of seasonal irrigation water was 400 mm, with an N application rate of 336 kg/ha for obtaining the maximum potato tuber yield in the Columbia Basin, USA. The potato’s seasonal evapotranspiration was estimated at 580 and 645 mm in a fine sandy-loam soil based on the soil water balance method under soil moisture sensor-based irrigation scheduling, while satellite-retrieved potato evapotranspiration averaged 570 mm [33]. The potential water requirement for modern potatoes (recently developed) was about 491 to 550 mm, whereas heritage potatoes (old Southern America native potato cultivars called specialty potatoes) had a higher water requirement of 610 to 611 mm due to their longer maturity period than modern potatoes [44]. For processing potato cultivars, the maximum shoot growth stage (62–86 DAS) was most susceptible to water stress, with over 40% water consumed during that phase [45]. A pot experiment conducted in a greenhouse under a controlled environment showed that the potato crops were sensitive to water stress during the vegetative and tuberization stages, where supplemental irrigation would be highly beneficial [46]. Pavlista [47] also found that early water stress in the ‘Atlantic’ potato from emergence to 8 weeks after emergence resulted in poorer plant growth and reduced the tuber yield, compared to late water stress during 8–13 weeks after emergence, suggesting that the crop growth period between 2 and 8 weeks after emergence is the most critical period for water stress.

Table 1.
Crop coefficient (Kc) values for different stages of potato crop.
| Location | Climate Type | Soil Type | Estimation Method | Variety | Year | Crop Stage | Seasonal | Reference | ||||
|---|---|---|---|---|---|---|---|---|---|---|---|---|
| SD | VG | TI | TB | MT | ||||||||
| USA | Sub-humid climate | - | FAO Penman-Monteith | - | - | 0.5 | 1.2 | 0.8 | 0.83 | [34] | ||
| Idaho, USA | Cold winter temperate | - | ASCE Penman-Monteith | - | - | 0.31 | 0.64 | 0.77 | 0.72 | 0.34 | 0.51 | [35] |
| USA | Continental | - | ASCE Penman Monteith | Russet | - | 0.46 | 0.78 | 0.88 | 0.93 | 0.70 | 0.67 | [36] |
| USA | Continental | - | ASCE Penman Monteith | Shepody | - | 0.3 | 0.93 | 0.2 | 0.71 | |||
| Washington, USA | Arid steppe cold climate | Silt loam | ASCE Penman-Monteith | Alturas | 2018–2020 | 0.4 | 0.7 | 0.96 | 0.6 | 0.67 | [37] | |
| Clearwater Russet | 0.4 | 0.71 | 0.96 | 0.6 | 0.67 | |||||||
| Ranger Russet | 0.4 | 0.68 | 0.94 | 0.6 | 0.66 | |||||||
| Russet Burbank | 0.4 | 0.7 | 0.93 | - | ||||||||
| Umatilla Russet | 0.4 | 0.7 | 0.93 | 0.5 | 0.63 | |||||||
| Quebec, Canada | Humid Continental | Loamy sand | Eddy Covariance | Reba | 2007 | 0.63 | 0.91 | 0.81 | 0.78 | 0.73 | [38] | |
| India | Semi-arid, sub-tropical | Clay | Water balance Method | Kufri Pukraj | 2015–2016 | 0.69 | 1.2 | 0.9 | 0.91 | [41] | ||
| 2016–2017 | 0.51 | 1.1 | 1.1 | 0.88 | ||||||||
| India | Sub-humid | Lysimeter | Kufri Jyoti | 1998–1999 | 0.4 | 0.85 | 1.3 | 0.6 | 0.78 | [48] | ||
| Limpopo, South Africa | Semi-arid, tropical | Sandy | Eddy Covariance | Mondial | 2020 | - | 1 | 1.2 | 1 | 0.9 | 0.99 | [39] |
| North West, South Africa | - | 0.45 | 0.9 | 0.9 | - | 0.78 | ||||||
| Brazil | Tropical | Sandy, Ultisol | FAO Penman–Monteith | Opaline | 2010 | 0.35 | 0.45 | 1.29 | 0.63 | 0.68 | [40] | |
| Saudi Arabia | Arid | Lysimeter | 2012–2015 | 0.54 | 1.1 | 0.7 | 0.79 | [49] | ||||
| Italy | Mediterranean, warm temperate | Silty loam | SIMDualKc Modelling | Spunta | 2009–2010 | 0.15 | 1.1 | 0.4 | 0.53 | [50] | ||
3. Relationship of Irrigation Rates with Potato Growth, Yield, and Quality
The tuber yield, plant dry matter, and leaf area index of potato crops were significantly reduced under water-stressed conditions [51]. B.Z. Yuan et al. [52] found an increase in plant height, biomass, shoot water content, total yield, and marketable yield with increased applied irrigation amounts but there was a significant decrease in specific leaf weight, canopy temperature, and tuber specific gravity under higher irrigation applied rates. In a study conducted in Punjab, India, it was found that there was an increase in plant height, biomass, tuber yield, specific gravity, and starch accumulation in tubers with an increase in irrigation rates from 0.6 to 1.2 fraction of open pan evapotranspiration [53]. Similarly, the plant height, canopy dry weight, leaf area index, and tuber yield were reduced by 10–20%, 20–30%, 50–70%, and 13–25%, respectively, when the total water supplies were reduced by 25% as early, late, and outer stresses, compared to full irrigation [47]. Whereas Erdem et al. [54] found no significant differences in plant height, tuber size, tuber number per plant, and tuber yield among irrigation rates applied when 30%, 50%, and 70% of available water was consumed under semi-arid conditions in Turkey.
Badr et al. [55] reported the highest total tuber yield in full irrigation (100% ET) for all nitrogen rates, with only a 7.8% average reduction in total yield under 20% DI (80% ET), while the reduction averaged 27.3% and 44.6% under 40% and 60% water stress conditions, respectively. Similarly, the reduction in tuber yield averaged 21.3% for 40% DI and 46.75% for 70% DI for a two-year study, suggesting that the crop is not very sensitive to moderate water stress [56]. Alva et al. [57] also found that the tuber yields were reduced by 7–24% when potatoes were grown under 14–20% water deficit conditions. However, Crosby and Wang [10] found that the production of chipping potatoes in over-irrigation treatment at 125% ET was not beneficial and suggested the potential use of deficit irrigation at 75% ET and 50% ET during the late season for sustainable water use in potato production. Ramirez et al. [58] discovered that the water-stressed conditions due to partial root-zone drying (PRD) and deficit irrigation (DI) resulted in increased chlorophyll concentrations and, consequently, a reduced senescence rate, which was associated with a reduced tuber yield with increased water stress under greenhouse conditions. El-Abedin et al. [59] reported higher chlorophyll content in potato plants for DI and PRD treatments, which were not significantly different from full irrigation. They also reported a significant decrease in the net photosynthesis rate of potato plants under PRD and DI treatments, while the full irrigation treatment had a higher stomatal conductance and transpiration rate [59]. Applying water-saving irrigation strategies such as PRD and DI resulted in a root length density similar to full irrigation [32].
Among several water-saving irrigation strategies, Ahmadi et al. [60] found that static deficit irrigation (applying 75% of ET during whole crop growth period) and dynamic deficit irrigation (applying 90% of ET during first one-third, 75% of ET during second one-third, and 50% of ET during last one-third of the crop growth period) strategies resulted in a slight tuber yield reduction (4%, 7%) and a significant increase (28%, 34%) in water productivity, compared to full irrigation. Ierna and Mauromicale [61] also found that the tuber yield and average tuber weight were statistically similar under both irrigation strategies that supplied 100% ET along the whole crop cycle and 100% ET supplied from tuber initiation up to 50% for the tuber growth stage in southern Italy. Among different irrigation rates of water-saving irrigation strategies like PRD and DI, El-Abedin et al. [59] reported the highest tuber yield under DI with a 70% ETc strategy in arid regions of Saudi Arabia. Compared to DI with 70% ETc, the tuber yield under PRD with 70% ETc was reduced by 17.28% and 23.54% in 2014 and 2015, respectively [59]. Mokh et al. [62] found a statistically similar tuber number/m2, tuber weight, size, and yield under 40% DI and full irrigation, while the yield and yield components were lower under 70% DI. O’Shaughnessy et al. [63] also found that a moderate water deficit irrigation at 80% of full irrigation resulted in a similar potato tuber yield and tuber weight as compared to 100% full irrigation treatment in the Texas High Plains. Ramirez et al. [58] also found that a PRD treatment supplying 50% of crop water demand resulted in a similar tuber yield as full irrigation under field conditions. However, Ojala et al. [64] reported an increased tuber yield with increased seasonal water supplies up to nitrogen application rates of 250 kg N/ha.
The sugar and protein contents of potato tubers decreased with increased water stress, while the polyphenol and antioxidant contents increased with an increased level of deficit irrigation [65]. Ahmadi et al. [66] discovered that, compared to full irrigation and DI techniques, PRD irrigation treatments significantly increased the N content of tubers, which had a negative correlation with tuber yield. Xing et al. [67] found that applying 20% DI at 180 kg N/ha on potatoes resulted in a higher starch content, reducing the sugar content, vitamin C content, tuber yield, and crude protein content. Akkamis and Caliskan [68] also reported a lower tuber dry matter, specific gravity, and starch content under full irrigation than 34% and 67% DI treatments. However, Ojala et al. [64] reported the highest specific gravity of tubers under higher seasonal water supply to the crops. When potato crops were over-irrigated with 120% ETc and 140% ETc, the US No. 1 yields (tuber weight 114–284 g) were reduced by 7.1% and 22%, respectively, and the specific gravity was significantly reduced as compared to the full irrigation [69]. The excess irrigation rate beyond the full irrigation significantly reduced the specific gravity and increased the hollow heart and internal brown spot incidence in potato tubers [70].
4. Impacts of Irrigation Methods on Yield and Yield Components of Potato
Ahmadi et al. [60] reported a higher tuber number per ha and fresh tuber weight under DI strategies than PRD strategies. However, Al-Omran et al. [71] found that PRD with a 75% ETc irrigation strategy was more effective than the DI strategy in saving irrigation water, while maintaining the same yield as the full irrigation treatment. The potato yield and yield components were higher for the sub-surface drip irrigation method than the surface drip irrigation method under arid conditions [62]. Al-Omran et al. [71] also found that the tuber yield under sub-surface drip irrigation was higher than the surface drip irrigation. However, Onder et al. [72] did not find a significant impact of surface and sub-surface drip irrigation methods on potato tuber yield and yield parameters. Ati et al. [43] found no statistically significant differences in the yield or yield components of potatoes when comparing furrow and drip irrigation methods. The sprinkler irrigation method may result in a non-uniform distribution of irrigation water at the hills and furrows along with the potato canopy development. Under sprinkler irrigation, it was observed that the wetting depth of soil was higher at the hills during the early growth stage of potatoes, whereas the wetting depth was higher at the furrows during the later growth stages of potatoes due to interception by outer foliage and runoff from the sides of hills [73]. For N rates of 240 and 360 kg N/ha, the tuber yield under drip fertigation scheduling increased by 25.3 and 36.4%, respectively, compared to regular irrigation [74]. However, surface drip irrigation in potato cultivation interferes with intercultural operations like weeding, hilling, and tuber harvesting [75]. Zhou et al. [76] did not find any significant differences in tuber yield between gun irrigation and drip fertigation; however, there was higher nitrate leaching under gun irrigation. Silva et al. [77] found the highest total tuber yield under sub-irrigation with drain tiles (37.2 Mg/ha), followed by sub-surface drip irrigation (34.7 Mg/ha), sprinkler irrigation (33.3 Mg/ha), and seepage irrigation (32.2 Mg/ha), respectively. They also reported that the highest misshapen, decayed, internal heat necrosis, and brown-centered tuber yields were obtained under sub-irrigation, while growth cracked and green tuber yields were highest under seepage irrigation. The authors discussed that the highest tuber yield achieved under sub-irrigation was due to quick soil water drainage capacity; the highest green tubers under seepage irrigation were due to runoff caused by slow water drainage, and internal tuber defects were due to irregular tuber growth due to the stressful conditions after rainfall [77]. As compared to conventional uniform irrigation management strategies, the average gross income for potato production was $159/ha greater under a site-specific irrigation management strategy [78]. King et al. [78] concluded that for site-specific irrigation management to be economically viable in potato farming systems, it is essential to achieve economic benefits for other crops involved in the rotation. In an economic analysis study by Yuan et al. [79], the potato is identified as one of the most suitable and profitable crops for semi-arid regions when grown under rainwater harvesting and supplemental irrigation, compared to traditional rainfed and runoff farming systems. The authors also suggested using portable micro-irrigation and seepage prevention strategies to effectively use harvested rainwater [79]. There are smart irrigation technologies such as soil moisture sensors, evapotranspiration controllers, and rainfall sensors which can give real-time information about soil, water, crops, and weather conditions and have the potential to save 7–92% water without a significant reduction in crop yield [80]. Also, site- and crop-specific irrigation and nutrient management can be achieved using computer-based crop simulation models and decision support systems [81].
5. Water Use Efficiency (WUE) in Potatoes
WUE can be defined as the amount of crop yield per unit of water used by the crop [82]. It is also called water productivity. WUE can be calculated using crop actual evapotranspiration, total water supply, and the irrigation amount [83]:
(a) Crop water use efficiency (CWUE):
(b) Evapotranspiration water use efficiency (ETWUE):
(c) Irrigation water use efficiency (IWUE):
where CWUE, ETWUE, and IWUE are expressed in kg/m3 and yield in kg/ha, seasonal water supply is the sum of seasonal precipitation and seasonal irrigation amount (mm), crop seasonal ETa is the seasonal cumulative actual evapotranspiration (mm), and the seasonal irrigation amount is the sum of applied irrigation amounts throughout crop growing season (mm). It is difficult to estimate the exact amount of water used by the crops from field-based measurements; thus, these different methods of estimating WUE can be applied successfully in different agro-climatic regions with concerned parameters [84]. A higher WUE value is preferred over lower WUE values for any agricultural system because a higher WUE indicates a more efficient utilization of applied water by the crops to produce the crop yield. The estimation of WUE helps to manage irrigation water in the field and provides a platform to enhance the efficient use of water by crops in different environments.
Kassaye et al. [85] reported the highest WUE under 50% DI (21.8 kg/m3), followed by 25% DI (17.3 kg/m3) treatments and the lowest WUE under full irrigation (13.0 kg/m3). WUE also depends on the method of irrigation applied. The WUE increased by about 50% under alternate furrow irrigation as compared to conventional furrow irrigation [85]. Ati et al. [43] reported an increase in WUE from 5.13 to 7.38 kg/m3 for furrow-irrigated treatments and from 6.907 to 10.257 kg m−3 for drip-irrigated treatments. Compared to the furrow irrigation method, Erdem et al. [54] found a higher WUE under the drip irrigation method but did not find any significant differences in plant height, tuber size, and tuber yield. However, Reddy et al. [86] found better water use efficiency under farmers’ traditional practices and moderate water-deficit conditions than under extreme water-deficit conditions.
Alva [87] found that a full irrigation strategy that replenishes 100% ETc can lead to deep percolation below the root zone, while 30% DI maintained soil water content between the field capacity and management allowable depletion (MAD) level, reducing the loss of water through deep percolation. Ahmadi et al. [60] found that the water productivity under DI strategies was higher than PRD irrigation strategies and showed the potential to obtain a higher water productivity under a dynamic DI than static DI strategy. Ierna and Mauromicale [61] stated that irrigation water can be saved up to 77 mm year−1 by irrigating the crop with a 100% maximum evapotranspiration (ETm) supply from tuber initiation to 50% of tuber growth without reducing the tuber yield, compared to irrigating with a 100% ETm supply throughout the crop growth season. It was observed that the WUE at the DI with 70% ETc (4.28 kg/m3) and DI with 50% ETc (4.11 kg/m3) was higher than the PRD with 70% ETc (3.5 kg/m3) and PRD with 50% ETc (3.37 kg/m3) in arid regions of Saudi Arabia [59]. The highest IWUE and total water use efficiency (TWUE) were obtained under 70% DI during both Spring (19.28 kg/m3, 13.56 kg/m3) and Autumn (14.83 kg/m3, 8.24 kg/m3) seasons for both surface and sub-surface drip irrigation methods [62]. Irrigation rates significantly impacted irrigation efficiency (IE) and WUE in chipping potato varieties ([10]. Crosby and Wang [10] found lower WUE and IE under over-irrigated plots with 125% of ETc and full irrigation plots with 100% ETc, compared to DI plots. Ati et al. [43] found increased WUE values with an increased application of potassium rates under both furrow and drip irrigation methods. Kumar et al. [53] also reported the highest WUE (13.1 kg/m3) under irrigation at a 0.8 fraction of open pan evapotranspiration. However, O’Shaughnessy et al. [63] did not find any significant differences in crop water productivity (CWP) and irrigation water productivity (IWP) among irrigation rates of 60%, 80%, and 100% of full irrigation.
6. Nitrogen Requirement in Potato Crops
Nitrogen is a key plant macro-nutrient required for plant biomass, tuber development, and tuber quality. The nitrogen fertilizer requirement in potato crops differs by variety, soil type, location, and crop and water management practices. Based on the specific cultivar and location, the total N uptake for potato crops ranges between 168 and 448 kg N/ha, with about 60–65% of total N uptake accumulated in tubers and about 30% remaining in the vines at harvesting time [88]. The peak daily N uptake was obtained between 55 and 65 days after planting during the beginning of the tuber bulking stage of a chipping potato variety ‘FL 1867’ [89]. In the same study, it was observed that the whole plant and tuber N accumulation varied from 106 to 191 kg N/ha and 79–138 kg N/ha, respectively. For a 56 Mg/ha potato tuber yield, the whole plant N uptake was 235 kg/ha in the USA and Canada field conditions [12]. Love et al. [90] determined the N requirement rates (including both applied N and soil residual N) for the maximum potato yield in Idaho for four potato cultivars, Bannock Russet, Gem Russet, Summit Russet, and Russet Burbank, as 211, 263, 230, and 241 kg N/ha, respectively, when two-thirds of the applied N was applied pre-plant and the remaining one-third post plant. Makani et al. [91] discovered that the tuber yield for 112 and 224 kg/ha N rates were statistically similar for early maturing potato varieties. The authors also reported a non-significant yield increase, with N rates beyond 224 kg/ha [91]. A study by Wang et al. [92] determined the optimum rates of N, which ranged from 115 to 150 kg N/ha, for sustainable potato production in different regions of China. The soil type and soil organic matter content also affect the optimum nitrogen application rate and timing. Sandy soils with lower organic matter content have a higher tendency toward NO3− leaching than clay soils; thus, a frequent application of split N doses is required for better crop N utilization [93]. By incorporating organic poultry manure in potato production, it was possible to reduce the use of inorganic N fertilizer for optimum tuber yield [94]. There are also practices of intercropping legumes with potato crops to improve the soil nitrogen balance and reduce NO3− leaching [95,96]. Various techniques have been used for assessing a plant’s N status. Wang et al. [97] found that a petiole nitrate-N analysis is the most convenient and accurate method to determine the in-season N status of potato crops. Bohman et al. [98] found that the remote sensing-based nitrogen sufficiency index (NSI) technique was more effective than chlorophyll meter measurements in predicting crop N status. The authors used remote sensing tools like ground-based proximal CropScan sensors and unmanned aerial vehicle-based GEMS multi-spectral sensors to assess crop N Status [98]. The remote sensing-based NSI technique is a non-destructive method of determining the N status in plants that uses various multi-spectral sensors, reflectance sensors, and satellite images [99].
7. Relationship of Nitrogen Rates with Potato Growth, Yield, and Quality
Nitrogen is one of the most limiting nutrients for potato growth, yield, and quality. Hence, a deficiency of N may lead to complete crop failure, while an over-supply of N may also reduce the quality of tubers along with an increased cost of cultivation. An experiment using four N rates of 0, 55, 110, and 165 kg N/ha conducted by Zewide et al. [100] reported that the application of 165 kg N/ha significantly increased days to flowering, days to physiological maturity, above-ground biomass, underground biomass, tuber yield, marketable tuber number, total tuber number, and average tuber weight of a potato crop.
Depending on the cultivars and costs of fertilizer and potato tubers, the economic optimum N fertilization rates ranged from 147 to 201 kg/ha [101]. The tuber yields significantly increased with increasing nitrogen rates, only up to 280 kg N/ha, and a further increase in N application rates did not significantly increase potato tuber yield and N uptake [55]. Zotarelli et al. [7] reported a non-significant effect of applying nitrogen rates above 280 kg ha−1 on potato yield and N uptake. Tuber yield improved with increased nitrogen fertilization; however, the increase was insignificant with N treatment rates of more than 150 kg/ha in red soils prone to N leaching [102]. The researchers also found that the apparent nitrogen surplus, i.e., the nitrogen remaining in the soil after plant uptake (nitrogen input minus nitrogen uptake), increased with increasing nitrogen application rates [102]. Cambouris et al. [103] also reported no significant increase in marketable and total tuber yield beyond 200 kg N/ha applied N rates in the ‘Russet Burbank’ potato variety.
A three-year study conducted by Nyiraneza et al. [104] at five research sites in Canada determined no significant increase in the marketable tuber yield when the N application was over 120 kg N/ha, indicating that the recommended N doses in potatoes can be reduced. They also reported a reduction in the specific gravity of potato tubers with increasing N fertilizer rates beyond 60 kg N/ha [104]. In red soil, the yield of tubers increased with increasing levels of N fertilizer, but the increase was not statistically significant when the N application rates exceeded 150 kg/ha [102]. Clement et al. [105] also found no significant difference in the total yield and marketable yield among N application rates of 100, 150, and 200 kg N/ha with polymer coated urea (PCU) applied at planting under both irrigated and non-irrigated conditions. Bohman et al. [98] found that slight reductions in the N rate (by 44 kg N/ha) and irrigation rates (by 15%) did not result in significant differences in tuber yield and economic return, compared to the application of the recommended rate of N (270 kg N/ha) and full irrigation (100% field capacity) under sandy soils and the humid climatic zone of Minnesota. However, they reported a significant reduction in tuber yield and net income with the application of 180 kg N/ha, compared to 270 kg N/ha. When the nitrogen application rate was increased from 0 to 250 kg N/ha, there was an increase in average fresh tuber weight, tuber N content, and tuber nitrate concentration, but the specific gravity decreased [106].
The specific gravity and tuber dry matter content did not increase significantly with applied nitrogen rates beyond 90 kg/ha [53]. Nyiraneza et al. [104] reported a decrease in specific gravity with increasing N fertilizer rates. Ruža et al. [107] found that the starch concentration in tubers was reduced with increased nitrogen fertilizer rates. The marketable specific gravity, starch, and dry matter content were obtained under the application of 168 kg N/ha at sites with less than 3% soil organic matter and 112 kg N/ha at sites with greater than 3% soil organic matter content [108]. Reducing of both the sugar and starch contents decreased with increasing N application rates [109]. The total protein content and amino acids like alanine, glutamate, and histidine contents were obtained significantly lower at 200 kg N/ha than at 150 and 50 kg N/ha rates [109].
8. Impacts of N Fertilizer Application Methods on Yield and Yield Components of Potatoes
Potato growers can easily shift to polymer coated urea (PCU) instead of the conventional split N application without significantly reducing tuber yield [110]. Under irrigated conditions, the use of PCU and PCU + urea at the same N rate applied at planting led to a significant rise in seasonal NO3− leaching by 32% and 43%, respectively, when compared to the conventional split N treatment [105]. Clement et al. [105] concluded that the use of PCU alone is more environmentally sound and profitable than a PCU + urea mixture for potato production in sandy soils. They also recorded a higher N uptake, dry matter content, and apparent N recovery under PCU + urea as compared to PCU alone and the conventional split N application method [105]. Cambouris et al. [103] reported that a single application of PCU at planting resulted in a similar tuber yield, along with increased plant N uptake as compared to split N applications of ammonium nitrate and ammonium sulphate at planting (40%) and hilling (60%). Hyatt et al. [111] reported a significantly lower N2O release under PCU treatment as compared to conventional multiple splits of N application at an equivalent N rate of 270 kg N/ha. As compared to uncoated urea, it was observed that the application of PCU resulted in better tuber yields and reduced residual nitrate in soil [112]. A three-year study by Kelling et al. [113] demonstrated that the application of nitrogenous fertilizers along with nitrification inhibitors has the potential to improve tuber yield, tuber N accumulation, and apparent N recovery. The application of ammonium sulfate nitrate with the nitrification inhibitor (3,4-dimethylpyrazole phosphate) produced a higher tuber yield and agronomic efficiency as compared to the applications of ammonium sulphate and urea alone [114].
Rolbiecki et al. [115] discovered that using drip fertigation to apply N fertilizers increased the marketable yield and tuber number per plant by 11.8% and 24.2%, respectively, compared to the broadcasting method. The variable distribution of soil properties and nutrient content along the field may lead to variable tuber yield. Such variable soil properties in the field can be identified as management zones, and the application of precision agriculture techniques, such as site-specific nutrient management, could enhance soil fertility and achieve optimum tuber yield [116]. The timing and intervals of N fertilizer applications also impact crop growth and the yield of potato crops. US No.1 yields were higher, with three biweekly applications of 44 kg N/ha as compared to six weekly applications of 22 kg N/ha [69]. Badr et al. [74] found that weekly drip fertigation of N fertilizer through the crop stage-wise fertigation strategy (N supply partitioned as 12.5, 25, 50, and 12.5% of total N supply at initial, development, mid, and maturation stage, respectively) with 360 kg N/ha increased tuber yield by 13 and 22% as compared to weekly and biweekly equal fertigation strategy, respectively. Errebhi et al. [117] discovered that increasing the applied N rates at planting from 0 to 135 kg N/ha significantly increased culls and small-sized tubers while increasing average NO3− leaching beyond 140 cm soil depth by 91 kg N/ha for the ‘Russet Burbank’ potato. High N application rates at planting could prolong vegetative growth with delayed tuber development and result in a lower marketable yield (Errebhi et al. [117]).
9. Nitrogen use Efficiency in Potato
Nitrogen use efficiency (NUE) can be defined as the ratio of crop yield to the amount of nitrogen supplied to the crop [118]. It helps to understand how efficiently the plants uptake the applied nitrogen and convert it into plant biomass and crop yield. The NUE was found to have a strong positive correlation with canopy cover, relative maturity date, tuber number per plant, and tuber dry weight in potato crops [119]. The NUE of a crop is very important in managing nitrogen fertilizers and for determining the economic level of plant-required nitrogen rates. Nitrogen use efficiency is negatively correlated with the amount of nitrogen applied [55]. This negative correlation could be due to increased nitrogen leaching at high applied nitrogen rates [120]. However, variation in potato NUE could depend on variations in maturation days, photoperiod, adaptation to environmental conditions, and genetic variation among potato cultivars [119]. Makani et al. [121] showed the potentiality of improving water and nitrogen use efficiency with the application of a lower nitrogen rate (112 kg/ha) in early-maturing potato cultivars. Fontes et al. [101] found that the NUE decreased with an increase in N fertilization rate. Stefaniak et al. [122] also found that the NUE of eight red potato genotypes decreased with an increase in N application rate from 20.4 kg/ha to 81.6 kg/ha in loamy sand soils of Minnesota. Wang et al. [92] found that the recommended N rates increased the nitrogen use efficiency by 48.60–81.67% without any yield reductions, compared to higher applied N rates. The researchers also reported a corresponding increase in apparent nitrogen surplus (i.e., nitrogen input minus nitrogen uptake by plant) in the soil with increased N application rates [102].
The timing of fertilizer application was also found to affect the NUE in potato crops. The weekly fertigation of N fertilizer through crop stage-wise fertigation scheduling had a higher NUE as compared to biweekly crop stage-wise fertigation scheduling and both weekly and biweekly equal fertigation scheduling in ‘Cara’ potato cultivar [74]. However, Zebarth et al. [123] concluded that N fertilization, either at planting or hilling, had no significant impact on NUE during seasons of sufficient soil moisture, but a split application of N could result in reduced nitrogen uptake efficiency during dry seasons. Rens et al. [124] suggested applying a higher proportion of seasonal N during plant emergence or the tuber initiation stage as the N fertilizer use efficiency (FNUE) was found to be about 62% for N treatments during the emergence and tuber initiation stages, whereas FNUE was only 10.2% for pre-plant N applications performed 26–30 days before planting. The application of N fertilizers through drip fertigation on very light soils in Poland increased the NUE from 305 to 337 kg ha−1 per kg of N compared to the broadcasting of N fertilizers [115]. Though modern potatoes respond better to irrigation and nitrogen application, heritage potatoes are more tolerant to water and nitrogen-deficit conditions [44]. The effects of varying nitrogen rates and N application methods on potato tuber yield and NUE are presented in Table 2.
10. Interactive Effects of Irrigation and Nitrogen Rates on Potato Tuber Yield, WUE, NUE, Plant Nitrogen Uptake, and Nitrate Leaching
The best irrigation management practices are necessary for the effective utilization of applied nitrogen by crops, thereby reducing nitrate leaching into the groundwater [87,126]. Clement et al. [105] found increased NO3− leaching with increasing N application rates under irrigated conditions than non-irrigated conditions (Table 3). The authors reported the highest nitrate leaching (125 kg/ha) under irrigated plots with a N application rate of 200 kg/ha, while it was lowest (52.4 kg/ha) under irrigated plots with a 100 kg/ha N applied rate [105]. While the overall plant nitrogen uptake was statistically equivalent across the 60 kg N/ha and 240 kg N/ha application rates, nitrate leaching was significantly higher under the latter than the former [127]. Under over-irrigation with 150% of ETc, the lowest level of N content (about 2.4 mg/L) was found in the surface layer (0–15 cm), and the highest concentration (20.5 mg/L) was found at a depth of 65–100 cm [71]. In contrast, deficit irrigation reduces nitrogen uptake and increases nitrogen use efficiency in crops [128,129]. The tendency to leach N at deeper depths of soil is also influenced by the irrigation methods. The average cumulative residual nitrogen measured at a depth of 40–120 cm of soil was recorded as 94.13 kg N/ha under furrow irrigation and 22.4 kg N/ha for the sprinkler irrigation method [130]. Yang et al. [130] estimated average apparent N losses (which accounted for N leaching, volatilization, mineralization, crop uptake, and residual N after harvest) of 249.6 kg N/ha for furrow irrigation and 147.6 kg N/ha for sprinkler irrigation systems. Similarly, Waddell et al. [131] found lower N leaching under drip irrigation systems compared to the sprinkler irrigation method. Drip irrigation facilitates the precise application of irrigation water throughout the crop root zone, meeting crop needs and reducing runoff. Zhou et al. [76] also reported that drip fertigation significantly improved the nitrogen use efficiency and reduced nitrate leaching as compared to gun irrigation.
Marsh [132] reported the highest NUE (317.6 kg yield/kg N) value with 170 kg N/ha under target irrigation that maintained soil moisture between FC and 65% of FC when compared to similar irrigation schemes with N rates of 225 and 280 kg N/ha. The researcher also found deeper movement of soil nitrate under an irrigation scheme that provided 20% excess irrigation water than target irrigation [132]. Badr et al. [55] reported the highest NUE (176 kg yield/kg N) under 160 kg N/ha rate with 100% ETc irrigation, which reduced to 136 at 340 kg N/ha. They also indicated that moderate deficit irrigation rates and lowered N rates might be used in arid potato farming systems with acceptable tuber yields. The petiole NO3− N concentration during potato growing season was found to be higher under DI treatments as compared to full irrigation [57]. There was a significant reduction in tuber N content from 1.9% to 1.54% when the irrigation rate was reduced from 100% ET to 80% ET [45]. A lower canopy cover under deficit-irrigated conditions may accelerate water loss through soil water evaporation, resulting in reduced N recovery and water use efficiency [45]. Li et al. [133] concluded that the interaction between irrigation and nitrogen levels can influence the source capacity of potato plants by affecting their net photosynthetic rate and total leaf area, which can directly impact the tuber yield and N content of tubers. Essah et al. [134] demonstrated the possibility of increasing the potato tuber yield and quality under cover cropping systems with limiting irrigation rates. On the other hand, cover crops planted during winter help to reduce nitrate leaching by extracting nitrate from the root zone and then enhance nitrogen availability to subsequent potato crops when the cover crops are incorporated into the soil [135]. The previous studies on the interactive effects of irrigation and nitrogen application rates on potato tuber yield, WUE, and NUE are reported in Table 4.
Table 3.
Previous studies on the effects of irrigation and nitrogen management on nitrate leaching and nitrogen uptake by potato plants.
Table 3.
Previous studies on the effects of irrigation and nitrogen management on nitrate leaching and nitrogen uptake by potato plants.
| Location | Potato Cultivar | Soil Type | N Source | N Application Method | Irrigation | Applied N Rates (kg/ha) | Nitrate N Leaching (kg/ha) | TNUp and TPNUp (kg/ha) | Reference | |||
|---|---|---|---|---|---|---|---|---|---|---|---|---|
| Method | Amount (mm) | |||||||||||
| Wisconsin, USA | Russet Burbank | Loamy sand | Starter dose = 34 kg/ha; 33% and 67% Supplemenal N as AS and AN, respectively | Sprinkler irrigation | 2001 | 2002 | Average TNUp | [136] | ||||
| No SF | 34 | 39.7 | 75.8 | 76.3 | ||||||||
| SF @9.35 L/ha | 34 | 42 | 68 | 74.1 | ||||||||
| No SF | 168 | 50 | 90.4 | 120.1 | ||||||||
| SF @9.35 L/ha | 168 | 47 | 86.2 | 131.4 | ||||||||
| No SF | 303 | 120.2 | 105.3 | 135.7 | ||||||||
| SF @9.35 L/ha | 303 | 64.1 | 83.9 | 148.2 | ||||||||
| Minnesota, USA | Russet Burbank | Loamy sand | DAP; Urea; PCU | Solid-set overhead sprinkler irrigation | - | 2016–17 | Average TPNUp | [137] | ||||
| Control | 0 | 25 | 110 | |||||||||
| Split | 180 | 32 | 204 | |||||||||
| Control release | 180 | 31 | 202 | |||||||||
| Split | 270 | 40 | 260 | |||||||||
| Control release | 270 | 35 | 253 | |||||||||
| Conventional | - | 36 a | 209 | |||||||||
| Reduced (15% less) | - | 30 b | 212 | |||||||||
| Columbia Basin, USA | Russet Burbank | Quincy fine sand and Taunton sandy loam | 1/3rd of total N applied at planting and remaining 2/3rd in six equal splits | - | Hermiston | Richland | [15] | |||||
| 168 | 91 e | 82 e | - | - | ||||||||
| 252 | 120 d | 110 d | - | - | ||||||||
| 336 | 153 c | 142 c | - | - | ||||||||
| 420 | 192 b | 180 b | - | - | ||||||||
| 504 | 232 a | 220 a | - | - | ||||||||
| 1 day interval | 400 | - | 150 b | 142 b | - | - | ||||||
| 2 day interval | 500 | - | 150 b | 142 b | - | - | ||||||
| 3 day interval | 600 | - | 156 ab | 146 ab | - | - | ||||||
| 4 day interval | 700 | - | 162 a | 151 a | - | - | ||||||
| 5 day interval | 800 | - | 162 a | 151 a | - | - | ||||||
| Quebec, Canada | Russet Burbank | Sandy loam | PCU and Urea | Band application at planting | Irrigated | 100 | 52.4 | - | - | [105] | ||
| Irrigated | 150 | 90 | - | - | ||||||||
| Irrigated | 200 | 125.7 | - | - | ||||||||
| Non-irrigated | 100 | 58.9 | - | - | ||||||||
| Non-irrigated | 150 | 53.4 | - | - | ||||||||
| Non-irrigated | 200 | 65.6 | - | - | ||||||||
| Prince Edward Island, Canada | Russet Burbank | Sandy loam | AN | Band application at planting | - | 2016 | TPNUp | [127] | ||||
| 0 | 83.6 bc | 111.0 b | ||||||||||
| 60 | 110.2 bc | 141.9 a | ||||||||||
| 120 | 177.8 ab | 175.4 a | ||||||||||
| 180 | 198.2 ab | 160.2 a | ||||||||||
| 240 | 219.3 a | 153.9 a | ||||||||||
| Chayouzho-ngqi, China | Kexin-1 | Sandy loam | Urea | 30% of total N broadcasted at planting; remaining 70% N drip fertigated during plant growth | T1: 8 equal drip irrigations of 22.5 mm; T2: drip irrigation based on plant root distribution | TPNUp at harvest | [138] | |||||
| 2020 | 2021 | |||||||||||
| T1: 180 | 300 | - | - | 152.78 b | 160.85 b | |||||||
| T2: 180 | 300 | - | - | 188.61 a | 193.26 a | |||||||
| Hohhot, China | Favorita | Sandy loam | Urea and PN | Broadcasting, sprinkler fertigation, ridge placement by hand | Apparent N loss | TPNUp | [130] | |||||
| 2016 (y1) | 2017 (y2) | 2016 | 2017 | |||||||||
| Sprinkler fertigation | y1: 200.7 y2: 205 | 273 | 132.1 b | 148.9 a | 345.0 a | 246.0 a | ||||||
| Furrow irrigation | y1: 601.8 y2: 593.7 | 273 | 237.5 a | 276.7 b | 162.0 b | 126.0 b | ||||||
TNUp: Tuber Nitrogen Uptake; TPNUp: Total Plant Nitrogen Uptake; SF: Surfactant; AN: Ammonium Nitrate; AS: Ammonium Sulphate; DAP: Diammonium Phosphate; PCU: Polymer Coated Urea; PN: Potassium Nitrate; L/ha: liters/hectare; Means within a column in each references followed by a different letter are significantly different at p < 0.05.
Table 4.
Interactive effects of irrigation and nitrogen rates on potato yield, WUE, and NUE.
| Location | Irrigation Method | N Application Method | N Source | Irrigation Rate | N Rate (kg/ha) | Tuber Yield (Mg/ha) | WUE (kg/m3) | NUE (kg Yield/kg N) | Reference | |||
|---|---|---|---|---|---|---|---|---|---|---|---|---|
| California, USA | Line source sprinkle irrigation, target irrigation maintained soil moisture between FC and 65% of FC, High = 120% of target, Low = 80% of target | 170 kg/ha was applied before planting in all N treatments | AN fused with AS (26-0-0-14S) | Target | 170 | 54 | - | - | 317.6 | [132] | ||
| Target | 225 | 55.9 | - | - | 248.4 | |||||||
| Target | 280 | 66.2 | - | - | 236.4 | |||||||
| High | 170 | 55.3 | - | - | 325.3 | |||||||
| High | 225 | 57.5 | - | - | 255.6 | |||||||
| High | 280 | 69 | - | - | 246.4 | |||||||
| Low | 170 | 40.5 | - | - | 238.2 | |||||||
| Low | 225 | 41.9 | - | - | 186.2 | |||||||
| Low | 280 | 37.6 | - | - | 134.3 | |||||||
| Ningxia, China (arid region) | Film drip irrigation, FI, 20% DI and 40% DI provided 2100, 1680, and 1260 m3/ha of water, respectively | Fertigation (split doses at seedling stage, tuber formation stage, tuber growth stage, and starch accumulation stage @1:2:2:1) | 46% urea | 2021 | 2022 | 2021 | 2022 | 2021 | 2022 | [139] | ||
| FI | 270 | 52.49 | 51.42 | 25 | 24.4 | 194.4 | 190.3 | |||||
| FI | 190 | 46.86 | 49.74 | 22.3 | 23.6 | 246.6 | 261.8 | |||||
| FI | 110 | 54.53 | 53.64 | 25.9 | 25.5 | 495.7 | 487.6 | |||||
| 20% DI | 270 | 50.18 | 50.11 | 32.1 | 32.1 | 185.8 | 185.6 | |||||
| 20% DI | 190 | 48 | 49.5 | 30.7 | 31.7 | 252.6 | 260.5 | |||||
| 20% DI | 110 | 46.12 | 46.95 | 29.5 | 30.1 | 419.3 | 426.8 | |||||
| 40% DI | 270 | 49.42 | 49.45 | 41.1 | 41.2 | 183 | 183.1 | |||||
| 40% DI | 190 | 43.84 | 44.43 | 36.5 | 37 | 230.7 | 233.8 | |||||
| 40% DI | 110 | 39.96 | 39.89 | 33.3 | 33.2 | 363.3 | 362.6 | |||||
| control | control | 35.79 | 39.79 | 17 | 18.9 | 238.6 | 265.3 | |||||
| Médenine, South-Eastern Tunisia | Drip irrigation method | Fertigation | AN | 2010 | 2011 | 2010 | 2011 | 2010 | 2011 | [56] | ||
| FI | 0 | 13.15 | 14.99 | 4.89 | 5.9 | - | - | |||||
| FI | 100 | 15.07 | 17.83 | 5.6 | 7.02 | 19.2 | 28.4 | |||||
| FI | 200 | 18.89 | 21.4 | 7.02 | 8.43 | 28.7 | 32.04 | |||||
| FI | 300 | 22.72 | 25.12 | 8.45 | 9.89 | 31.9 | 33.7 | |||||
| 40% DI | 0 | 11.39 | 12.45 | 7.07 | 8.14 | - | - | |||||
| 40% DI | 100 | 12.05 | 14.15 | 7.48 | 9.25 | 6.6 | 17 | |||||
| 40% DI | 200 | 14.78 | 16.95 | 9.18 | 11.08 | 16.9 | 22.5 | |||||
| 40% DI | 300 | 15.94 | 19.7 | 9.9 | 12.88 | 15.1 | 24.1 | |||||
| 70% DI | 0 | 7.42 | 9.48 | 9.16 | 12.31 | - | - | |||||
| 70% DI | 100 | 8.53 | 11.53 | 10.53 | 14.97 | 11.1 | 14.2 | |||||
| 70% DI | 200 | 9.68 | 12.01 | 11.95 | 15.6 | 11.3 | 12.6 | |||||
| 70% DI | 300 | 9.24 | 11.91 | 11.41 | 15.47 | 6.0 | 8.1 | |||||
| Nubaria region, Egypt | Drip irrigation method | Fertigation (applied at 6 day intervals in 15 equal doses starting two weeks after planting) | AN | 2010 | 2010 | 2010 | [55] | |||||
| 100% ETc | 160 | 29.68 | 9 | 176 | ||||||||
| 100% ETc | 220 | 37.87 | 11.6 | 165 | ||||||||
| 100% ETc | 280 | 43.76 | 13.3 | 151 | ||||||||
| 100% ETc | 340 | 47.84 | 14.6 | 136 | ||||||||
| 80% ETc | 160 | 27.32 | 10.4 | 162 | ||||||||
| 80% ETc | 220 | 35.25 | 13.5 | 154 | ||||||||
| 80% ETc | 280 | 39.53 | 15.1 | 136 | ||||||||
| 80% ETc | 340 | 44.56 | 17 | 127 | ||||||||
| 60% ETc | 160 | 22.53 | 11.4 | 132 | ||||||||
| 60% ETc | 220 | 27.92 | 14.2 | 120 | ||||||||
| 60% ETc | 280 | 33.95 | 17.2 | 116 | ||||||||
| 60% ETc | 340 | 31.32 | 15.9 | 88 | ||||||||
| 40% ETc | 160 | 19.37 | 14.8 | 112 | ||||||||
| 40% ETc | 220 | 25.52 | 19.5 | 109 | ||||||||
| 40% ETc | 280 | 23.18 | 17.7 | 78 | ||||||||
| 40% ETc | 340 | 20.16 | 15.4 | 55 | ||||||||
AN: Ammonium Nitrate, AS: Ammonium Sulphate; FC: Field capacity; FI: Full irrigation; DI: Deficit irrigation; ETc: Crop evapotranspiration.
11. Economics of Deficit Irrigation
The potato is recognized as one of the potential crops suitable for deficit irrigation [140]. Deficit irrigation can be used successfully for vegetable production in water-limited environments, conserving significant amounts of irrigation water and maintaining crop yield and quality [141]. The potential benefits of deficit irrigation could be achieved through either increasing irrigation efficiency or reducing production costs [142,143]. Reducing annual irrigation rates and minimizing groundwater withdrawals have the potential to achieve long-term economic benefits [98]. However, deficit irrigation should be carried out in a careful way because severe water stress due to deficit irrigation may lead to a heavy loss of crop yield. Chai et al. [144] concluded that a regulated DI strategy can save 20–30% of irrigation water in crop production under favorable conditions. Jensen et al. [145] also discovered that DI and PRD strategies have the potential to save 20–30% of the water needed in fully irrigated potato and tomato crops without significant yield losses. Nagaz et al. [146] reported that the application of 30% DI (70% ETc) resulted in average losses of 16.1% and 25.8% in tuber yield and net income, respectively, when compared with full irrigation (100% ETc) for three years of potato production under surface drip irrigation systems. There were higher economic benefits (3.1%) and lower carbon footprints (14%) under furrow-irrigated PRD as compared to drip irrigation, which incurred extra costs related to pipelines, filter systems, machinery, and installation [147]. Bohman et al. [98] did not find any significant reduction in the net economic return of potato production with a reduced irrigation rate (15% less than the conventional rate). Onder et al. [72] reported that irrigating potatoes at 66% ETc was more economically profitable than full irrigation and 33% ETc irrigation. Apart from the possible economic and environmental benefits of deficit irrigation, Shock and Feibert [148] revealed that the production cost saving due to reduced water application was minimal, which could pose a greater threat to potato growers and processors because of the lower tuber yield under DI practices. The researchers also proposed that deficit irrigation could be significantly profitable in areas where the cost of irrigation water or water pumping is high. According to Trifonov et al. [149], it is economically viable to produce higher tuber yields with reduced irrigation doses in areas where agricultural land is not a constraint; however, the long-term effects of using saline water in irrigation should be considered. To understand decision making for profitable deficit irrigation in potatoes, Karam et al. [150] performed an analytical methodology describing five terms, namely: Wm (water level at which crop yield per unit area is maximum), Wl (water level at which net income per unit of land is maximum), Ww (water level at which net income per unit of water is maximum), Wel (deficit irrigation level at which net income is equal to that of full irrigation when land is limited), and Wew (deficit irrigation level at which net income is equal to that of full irrigation when water is limited). The authors concluded that when water is the limiting factor, irrigating with Ww and Wew can save 6.1 and 11.8% of water with 2.2 and 11.8% yield reductions, compared to Wm, respectively, and when land is limited but water has no limitation, the application of Wel deficit irrigation gives same yield as full irrigation, conserving 402.8 m3 water per year [150].
12. Impacts of Deficit Irrigation on Soil Salinity in Potato Fields
The potato is classified as a moderately sensitive crop to soil salinity with a threshold soil salinity ECe (soil electrical conductivity) level of 1.7 dS/m [151,152]. Irrigation water with varying levels of salinity is commonly used in potato crops in many places around the world [153]. The relative yield potentials of potato for 0.8, 2.6, and 4.7 dS/m ECe of soil salinity were 100, 81, and 73%, respectively [152]. The deficit irrigation strategies resulted in a higher level of soil salinity (ranging from 3.5 to 6.5 dS/m) as compared to full irrigation treatment (ranging from 2.7 to 5.4 dS/m) under the arid conditions of Southern Tunisia [62]. Mokh et al. [56] also reported a low level of soil salinity in full irrigation (100% ET) and 40% DI (60% ET) as compared to 70% DI (30% ET). The increased soil salinity observed in deficit irrigation treatments is due to the lack of significant salt leaching that occurs under water-deficit conditions. Ghazouani et al. [154] suggested that deficit irrigation should be avoided when saline water is the only water source accessible to a farm because of excessive salt accumulation in the root zone, which negatively impacts crop growth and yield. In comparison to full irrigation, the researchers found higher levels of soil electrical conductivity under about 50% DI at all growth stages and seasons of potato crop irrigated with EC (Electrical conductivity) 4.1 dS/m water [154]. They also reported that a 1.0 dS/m increase in irrigation water EC resulted in about a 10% yield reduction. However, lower ECe values statistically similar to that of full irrigation were obtained under 30% DI as compared to 60% DI and farmers’ irrigation practice of applying 16 mm of water every four days from planting to harvest [146]. Even though farmers’ irrigation practices used 15–22% more irrigation water than full irrigation treatment, the authors explained that the higher soil salinity under farmers’ practices was due to reduced salt leaching caused by over-watering during early stages of growth and under-watering during mid and late seasons [146].
13. Conclusions
Water and nitrogen are two major inputs highly discussed and prioritized in potato production. Considering evident climate change impacts, water level declines in major aquifers, and soil and environmental health issues, there is a dire need to develop sustainable irrigation and nitrogen management practices in potato production systems. Numerous studies have shown that excessive irrigation water and nitrogen application rates in potato fields increase nitrate leaching from soil and degrade the groundwater quality. Depending on the climate, crop varieties, soil characteristics, and water availability, the application of slight/moderate deficit irrigation (10–30%) practices along with lower N rates (60–170 kg N/ha) possesses a great opportunity to enhance water and nitrogen use efficiencies while maintaining optimum yield and quality in potato production. However, deficit irrigation strategies should be practiced carefully considering salinity levels in irrigation water, soil salinity, and soil N accumulation. Researchers have demonstrated increased N leaching when over-irrigating the potato field; at the same time, more salts are likely to accumulate in upper layers of the soil, leading to salinity issues when under-irrigating the potatoes. In the trade-off between these, this review suggests conducting more research to determine the best water-saving irrigation strategies for potato production in water-limited regions, which could employ reduced N application rates by minimizing nitrate leaching beyond the crop root zone. Irrigation scheduling using local crop coefficients (Kc), using sprinkle and drip irrigation methods, slow-release nitrogenous fertilizer application, split N application, and applying water and nitrogenous fertilizers as per the crop growth stage requirements are the best irrigation and nitrogen management practices for potato production, as discussed in this review.
Author Contributions
Conceptualization, K.D. and B.S.; methodology, B.L.S. and K.D.; writing—original draft preparation, B.S. and K.D., writing—review and editing, B.S., K.D., M.D., K.L. and B.L.S. All authors have read and agreed to the published version of the manuscript.
Funding
This research received no external funding.
Conflicts of Interest
The authors declare no conflict of interest.
References
- Food and Agriculture Organization of the United Nations. FAOSTAT. 2021. Available online: https://www.fao.org/faostat/en/#data/QCL (accessed on 28 June 2023).
- United States Department of Agriculture (USDA). Potatoes 2021 Summary; United States Department of Agriculture (USDA): Washington, DC, USA, 2022.
- Navarre, D.A.; Goyer, A.; Shakya, R. Nutritional value of potatoes: Vitamin, phytonutrient, and mineral content. In Advances in Potato Chemistry and Technology; Singh, J., Kaur, L., Eds.; Academic Press: Cambridge, MA, USA, 2009; pp. 395–424. [Google Scholar]
- Koch, M.; Naumann, M.; Pawelzik, E.; Gransee, A.; Thiel, H. The importance of nutrient management for potato production Part I: Plant nutrition and yield. Potato Res. 2020, 63, 97–119. [Google Scholar] [CrossRef]
- Djaman, K.; Irmak, S.; Koudahe, K.; Allen, S. Irrigation management in potato (Solanum tuberosum L.) production: A review. Sustainability 2021, 13, 1504. [Google Scholar] [CrossRef]
- Gondwe, R.L.; Kinoshita, R.; Suminoe, T.; Aiuchi, D.; Palta, J.P. Available soil nutrients NPK application impacts on yield quality nutrient composition of potatoes growing during the main season in Japan. Am. J. Potato Res. 2020, 97, 234–245. [Google Scholar] [CrossRef]
- Zotarelli, L.; Rens, L.R.; Cantliffe, D.J.; Stoffella, P.J.; Gergela, D.; Fourman, D. Nitrogen fertilizer rate and application timing for chipping potato cultivar Atlantic. Agron. J. 2014, 106, 2215–2226. [Google Scholar] [CrossRef]
- Hopkins, B.G.; Horneck, D.A.; Pavek, M.J.; Geary, B.D.; Olsen, N.L.; Ellsworth, J.W.; Newberry, G.D.; Miller, J.S.; Thornton, R.E.; Harding, G.W. Evaluation of potato production best management practices. Am. J. Potato Res. 2007, 84, 19–27. [Google Scholar] [CrossRef]
- Shock, C.C.; Pereira, A.B.; Eldredge, E.P. Irrigation best management practices for potato. Am. J. Potato Res. 2007, 84, 29–37. [Google Scholar] [CrossRef]
- Crosby, T.W.; Wang, Y. Effects of irrigation management on chipping potato (Solanum tuberosum L.) production in the upper Midwest of the U.S. Agronomy 2021, 11, 768. [Google Scholar] [CrossRef]
- Fereres, E.; Soriano, M.A. Deficit irrigation for reducing agricultural water use. J. Exp. Bot. 2007, 58, 147–159. [Google Scholar] [CrossRef] [PubMed]
- Westermann, D.T. Nutritional requirements of potatoes. Am. J. Potato Res. 2005, 82, 301–307. [Google Scholar] [CrossRef]
- Majumdar, D. The Blue Baby Syndrome. Resonance 2003, 8, 20–30. [Google Scholar] [CrossRef]
- Hodges, T. Water nitrogen applications for potato: Commercial experimental rates compared to a simulation model. J. Sustain. Agric. 1999, 13, 79–90. [Google Scholar] [CrossRef]
- Woli, P.; Hoogenboom, G.; Alva, A. Simulation of potato yield, nitrate leaching, and profit margins as influenced by irrigation and nitrogen management in different soils and production regions. Agric. Water Manag. 2016, 171, 120–130. [Google Scholar] [CrossRef]
- Vashisht, B.B.; Nigon, T.; Mulla, D.J.; Rosen, C.; Xu, H.; Twine, T.; Jalota, S.K. Adaptation of water and nitrogen management to future climates for sustaining potato yield in Minnesota: Field and simulation study. Agric. Water Manag. 2015, 152, 198–206. [Google Scholar] [CrossRef]
- Peralta, J.M.; Stockle, C.O. Dynamics of nitrate leaching under irrigated potato rotation in Washington State: A long-term simulation study. Agric. Ecosyst. Environ. 2002, 88, 23–34. [Google Scholar] [CrossRef]
- Raymundo, R.; Asseng, S.; Robertson, R.; Petsakos, A.; Hoogenboom, G.; Quiroz, R.; Hareau, G.; Wolf, J. Climate change impacts on global potato production. Eur. J. Agron. 2018, 100, 87–98. [Google Scholar] [CrossRef]
- Quan, N.; Lee, S.-C.; Chopra, C.; Nesic, Z.; Porto, P.; Pow, P.; Jassal, R.S.; Smukler, S.; Krzic, M.; Knox, S.H.; et al. Estimating net carbon and greenhouse gas balances of potato and pea crops on a conventional farm in western Canada. J. Geophys. Res. Biogeosciences 2023, 128, e2022JG007113. [Google Scholar] [CrossRef]
- Pishgar-Komleh, S.H.; Ghahderijani, M.; Sefeedpari, P. Energy consumption CO2 emissions analysis of potato production based on different farm size levels in Iran. J. Clean. Prod. 2012, 33, 183–191. [Google Scholar] [CrossRef]
- Burton, D.L.; Zebarth, B.J.; Gillam, K.M.; MacLeod, J.A. Effect of split application of fertilizer nitrogen on N2O emissions from potatoes. Can. J. Soil Sci. 2008, 88, 229–239. [Google Scholar] [CrossRef]
- Huang, Y.; Gao, B.; Huang, W.; Wang, L.; Fang, X.; Xu, S.; Cui, S. Producing more potatoes with lower inputs greenhouse gases emissions by regionalized cooperation in China. J. Clean. Prod. 2021, 299, 126883. [Google Scholar] [CrossRef]
- Sapkota, A.; Haghverdi, A.; Avila, C.C.E.; Ying, S.C. Irrigation and greenhouse gas emissions: A review of field-based studies. Soil Syst. 2020, 4, 20. [Google Scholar] [CrossRef]
- Brunelle, T.; Dumas, P.; Souty, F.; Dorin, B.; Nadaud, F. Evaluating the impact of rising fertilizer prices on crop yields. Ag. Econ. 2015, 46, 653–666. [Google Scholar] [CrossRef]
- Terrell, B.L.; Johnson, P.N.; Segarra, E. Ogallala aquifer depletion: Economic impact on the Texas high plains. Water Policy 2002, 4, 33–46. [Google Scholar] [CrossRef]
- McGuire, V.L. Water-Level Changes Change in Water in Storage in the High Plains Aquifer Predevelopment to 2013; 2011-13; U.S. Geological Survey Scientific Investigations Report 2014–5218; U.S. Geological Survey: Reston, VI, USA, 2014; p. 14. [Google Scholar] [CrossRef]
- Steiner, J.L.; Devlin, D.L.; Perkins, S.; Aguilar, J.P.; Golden, B.; Santos, E.A.; Unruh, M. Policy technology management options for water conservation in the Ogallala aquifer in Kansas, U.S.A. Water 2021, 13, 3406. [Google Scholar] [CrossRef]
- Rhodes, E.C.; Perotto-Baldivieso, H.L.; Tanner, E.P.; Angerer, J.P.; Fox, W.E. The declining Ogallala aquifer and the future role of rangeland science on the North American High Plains. Rangel. Ecol. Manag. 2023, 87, 83–96. [Google Scholar] [CrossRef]
- Rodriguez, C.I.; Ruiz de Galarreta, V.A.; Kruse, E.E. Analysis of water footprint of potato production in the pampean region of Argentina. J. Clean. Prod. 2015, 90, 91–96. [Google Scholar] [CrossRef]
- Pulido-Bosch, A.; Rigol-Sanchez, J.P.; Vallejos, A.; Andreu, J.M.; Ceron, J.C.; Molina-Sanchez, L.; Sola, F. Impacts of agricultural irrigation on groundwater salinity. Environ. Earth Sci. 2018, 77, 197. [Google Scholar] [CrossRef]
- Ajaz, A.; Datta, S.; Stoodley, S. High Plains aquifer–state of affairs of irrigated agriculture and role of irrigation in the sustainability paradigm. Sustainability 2020, 12, 3714. [Google Scholar] [CrossRef]
- Ahmadi, S.H.; Plauborg, F.; Andersen, M.N.; Sepaskhah, A.R.; Jensen, C.R.; Hansen, S. Effects of irrigation strategies and soils on field grown potatoes: Root distribution. Agric. Water Manag. 2011, 98, 1280–1290. [Google Scholar] [CrossRef]
- Djaman, K.; Koudahe, K.; Saibou, A.; Darapuneni, M.; Higgins, C.; Irmak, S. Soil water dynamics, effective rooting zone, and evapotranspiration of sprinkler irrigated potato in a sandy loam soil. Agronomy 2022, 12, 864. [Google Scholar] [CrossRef]
- Allen, R.G.; Pereira, L.S.; Raes, D.; Smith, M.; Ab, W. Crop Evapotranspiration: Guidelines for Computing Reference Crop Evapotranspiration; FAO Irrigation and Drainage Paper 56; UN-FAO: Rome, Italy, 1998. [Google Scholar]
- Allen, R.G.; Wright, J.L. Conversion of Wright (1981) and Wright (1982) Alfalfa-Based Crop Coefficients for Use with the ASCE Standardized Penman-Monteith Reference Evapotranspiration Equation. Technical Note in ASCE Manual 2002, 70. p. 38. Available online: https://www.uidaho.edu/-/media/UIdaho-Responsive/Files/cals/centers/Kimberly/water-resources/Conversion-of-Wright-Kcs-2c.pdf?la=en&hash=EE59D20A6F6F36B8F013AE932E2005E1258B4B97 (accessed on 23 June 2023).
- United States Bureau of Reclamation (USBR). Agrimet Crop Coefficients: Potatoes. 2016. Available online: https://www.usbr.gov/pn/agrimet/cropcurves/crop_curves.html (accessed on 18 July 2023).
- Gonzalez, T.F.; Pavek, M.J.; Holden, Z.J.; Garza, R. Evaluating potato evapotranspiration and crop coefficients in the Columbia Basin of Washington state. Agric. Water Manag. 2023, 286, 108371. [Google Scholar] [CrossRef]
- Parent, A.-C.; Anctil, F. Quantifying evapotranspiration of a rainfed potato crop in South-eastern Canada using eddy covariance techniques. Agric. Water Manag. 2012, 113, 45–56. [Google Scholar] [CrossRef]
- Machakaire, A.T.B.; Steyn, J.M.; Franke, A.C. Assessing evapotranspiration and crop coefficients of potato in a semi-arid climate using Eddy Covariance techniques. Agric. Water Manag. 2021, 255, 107029. [Google Scholar] [CrossRef]
- Carvalho, D.F.; de Silva, D.G.; da Rocha, H.S.; da Almeida, W.S.; de Sousa, E.d.S. Evapotranspiration and crop coefficient for potato in organic farming. Eng. Agric. 2013, 33, 201–211. [Google Scholar] [CrossRef]
- Kadam, S.A.; Gorantiwar, S.D.; Mandre, N.P.; Tale, D.P. Crop coefficient for potato crop evapotranspiration estimation by field water balance method in semi-arid region, Maharashtra, India. Potato Res. 2021, 64, 421–433. [Google Scholar] [CrossRef]
- Doorenbos, J.; Kassam, A.H. Yield Response to Water; Irrigation and Drainage Paper 33; FAO: Rome, Italy, 1979; p. 192. [Google Scholar]
- Ati, A.S.; Iyada, A.D.; Najim, S.M. Water use efficiency of potato (Solanum tuberosum L.) under different irrigation methods and potassium fertilizer rates. Ann. Agric. Sci. 2012, 57, 99–103. [Google Scholar] [CrossRef]
- Fandika, I.R.; Kemp, P.D.; Millner, J.P.; Horne, D.; Roskruge, N. Irrigation and nitrogen effects on tuber yield and water use efficiency of heritage and modern potato cultivars. Agric. Water Manag. 2016, 170, 148–157. [Google Scholar] [CrossRef]
- Darwish, T.M.; Atallah, T.W.; Hajhasan, S.; Haidar, A. Nitrogen and water use efficiency of fertigated processing potato. Agric. Water Manag. 2006, 85, 95–104. [Google Scholar] [CrossRef]
- Wagg, C.; Hann, S.; Kupriyanovich, Y.; Li, S. Timing of short period water stress determines potato plant growth, yield and tuber quality. Agric. Water Manag. 2021, 247, 106731. [Google Scholar] [CrossRef]
- Pavlista, A.D. Scheduling reduced irrigation on ‘Atlantic’ potato for minimal effect. Am. J. Potato Res. 2015, 92, 673–683. [Google Scholar] [CrossRef]
- Kashyap, P.S.; Panda, R.K. Evaluation of evapotranspiration estimation methods and development of crop-coefficients for potato crop in a sub-humid region. Agric. Water Manag. 2001, 50, 9–25. [Google Scholar] [CrossRef]
- Alataway, A.; Al-Ghobari, H.; Mohammad, F.; Dewidar, A. Lysimeter-based water use and crop coefficient of drip-irrigated potato in an arid environment. Agronomy 2019, 9, 756. [Google Scholar] [CrossRef]
- Paredes, P.; D’Agostino, D.; Assif, M.; Todorovic, M.; Pereira, L.S. Assessing potato transpiration, yield and water productivity under various water regimes and planting dates using the FAO dual Kc approach. Agric. Water Manag. 2018, 195, 11–24. [Google Scholar] [CrossRef]
- Kashyap, P.S.; Panda, R.K. Effect of irrigation scheduling on potato crop parameters under water stressed conditions. Agric. Water Manag. 2003, 59, 49–66. [Google Scholar] [CrossRef]
- Yuan, B.Z.; Nishiyama, S.; Kang, Y. Effects of different irrigation regimes on the growth and yield of drip-irrigated potato. Agric. Water Manag. 2003, 63, 153–167. [Google Scholar] [CrossRef]
- Kumar, P.; Pandey, S.K.; Singh, B.P.; Singh, S.V.; Kumar, D. Effect of nitrogen rate on growth, yield, economics and crisps quality of Indian potato processing cultivars. Potato Res. 2007, 50, 143–155. [Google Scholar] [CrossRef]
- Erdem, T.; Erdem, Y.; Orta, H.; Okursoy, H. Water-yield relationships of potato under different irrigation methods and regimens. Sci. Agric. 2006, 63, 226–231. [Google Scholar] [CrossRef]
- Badr, M.A.; El-Tohamy, W.A.; Zaghloul, A.M. Yield and water use efficiency of potato grown under different irrigation and nitrogen levels in an arid region. Agric. Water Manag. 2012, 110, 9–15. [Google Scholar] [CrossRef]
- Mokh, F.E.; Nagaz, K.; Masmoudi, M.M.; Mechlia, N.B. Yield water productivity of drip-irrigated potato under different nitrogen levels irrigation regime with saline water in arid Tunisia. Am. J. Plant Sci. 2015, 6, 501–510. [Google Scholar] [CrossRef]
- Alva, A.K.; Ren, H.; Moore, A.D. Water nitrogen management effects biomass accumulation partitioning in two potato cultivars. Am. J. Plant Sci. 2012, 3, 164–170. [Google Scholar] [CrossRef]
- Ramírez, D.A.; Yactayo, W.; Gutiérrez, R.; Mares, V.; De Mendiburu, F.; Posadas, A.; Quiroz, R. Chlorophyll concentration in leaves is an indicator of potato tuber yield in water-shortage conditions. Sci. Hort. 2014, 168, 202–209. [Google Scholar] [CrossRef]
- El-Abedin, T.K.Z.; Mattar, M.A.; Al-Ghobari, H.M.; Alazba, A.A. Water-saving irrigation strategies in potato fields: Effects on physiological characteristics and water use in arid region. Agronomy 2019, 9, 172. [Google Scholar] [CrossRef]
- Ahmadi, S.H.; Agharezaee, M.; Kamgar-Haghighi, A.A.; Sepaskhah, A.R. Effects of dynamic and static deficit and partial root zone drying irrigation strategies on yield, tuber sizes distribution, and water productivity of two field grown potato cultivars. Agric. Water Manag. 2014, 134, 126–136. [Google Scholar] [CrossRef]
- Ierna, A.; Mauromicale, G. Tuber yield and irrigation water productivity in early potatoes as affected by irrigation regime. Agric. Water Manag. 2012, 115, 276–284. [Google Scholar] [CrossRef]
- Mokh, F.E.; Nagaz, K.; Masmoudi, M.M.; Mechlia, N.B. Effects of surface subsurface drip irrigation regimes with saline water on yield water use efficiency of potato in arid conditions of Tunisia. J. Agric. Environ. Intern. Dev. 2014, 108, 227–246. [Google Scholar]
- O’Shaughnessy, S.A.; Andrade, M.A.; Colaizzi, P.D.; Workneh, F.; Rush, C.M.; Evett, S.R.; Kim, M. Irrigation management of potatoes using sensor feedback: Texas high plains. Trans. ASABE 2020, 63, 1259–1276. [Google Scholar] [CrossRef]
- Ojala, J.C.; Stark, J.C.; Kleinkopf, G.E. Influence of irrigation and nitrogen management on potato yield and quality. Am. Potato J. 1990, 67, 29–43. [Google Scholar] [CrossRef]
- Elhani, S.; Haddadi, M.; Csákvári, E.; Zantar, S.; Hamim, A.; Villányi, V.; Douaik, A.; Bánfalvi, Z. Effects of partial root-zone drying and deficit irrigation on yield, irrigation water-use efficiency and some potato (Solanum tuberosum L.) quality traits under glasshouse conditions. Agric. Water Manag. 2019, 224, 105745. [Google Scholar] [CrossRef]
- Ahmadi, S.H.; Agharezaee, M.; Kamgar-Haghighi, A.A.; Sepaskhah, A.R. Water-saving irrigation strategies affect tuber water relations nitrogen content of potatoes. Int. J. Plant Prod. 2016, 10, 275–288. [Google Scholar]
- Xing, Y.; Zhang, T.; Jiang, W.; Li, P.; Shi, P.; Xu, G.; Cheng, S.; Cheng, Y.; Zhang, F.; Wang, X. Effects of irrigation and fertilization on different potato varieties growth, yield and resources use efficiency in the Northwest China. Agric. Water Manag. 2022, 261, 107351. [Google Scholar] [CrossRef]
- Akkamis, M.; Caliskan, S. Responses of yield, quality and water use efficiency of potato grown under different drip irrigation and nitrogen levels. Sci. Rep. 2023, 13, 9911. [Google Scholar] [CrossRef] [PubMed]
- Stark, J.C.; McCann, I.R.; Westermann, D.T.; Izadi, B.; Tindall, T.A. Potato response to split nitrogen timing with varying amounts of excessive irrigation. Am. Potato J. 1993, 70, 765–777. [Google Scholar] [CrossRef]
- Silva, G.H.; Chase, R.W.; Hammerschmidt, R.; Vitosh, M.L.; Kitchen, R.B. Irrigation, nitrogen and gypsum effects on specific gravity and internal defects of Atlantic potatoes. Am. Potato J. 1991, 68, 751–765. [Google Scholar] [CrossRef]
- Al-Omran, A.; Louki, I.; Alkhasha, A.; Abd El-Wahed, M.H.; Obadi, A. Water saving and yield of potatoes under partial root-zone drying drip irrigation technique: Field and modelling study using SALTMED omdel in Saudi Arabia. Agronomy 2020, 10, 1997. [Google Scholar] [CrossRef]
- Onder, S.; Caliskan, M.E.; Onder, D.; Caliskan, S. Different irrigation methods and water stress effects potato yield and yield components. Agric. Water Manag. 2005, 73, 73–86. [Google Scholar] [CrossRef]
- Saffigna, P.G.; Tanner, C.B.; Keeney, D.R. Non-uniform infiltration under potato canopies caused by interception, stemflow, and hilling. Agron. J. 1976, 68, 337–342. [Google Scholar] [CrossRef]
- Badr, M.A.; Ali, E.; Salman, S.R. Effect of nitrogen application and fertigation scheduling on potato yield performance under drip irrigation system. Gesunde Pflanz 2023. [Google Scholar] [CrossRef]
- Starr, G.C.; Rowland, D.; Griffin, T.S.; Olanya, O.M. Soil water in relation to irrigation, water uptake and potato yield in a humid climate. Agric. Water Manag. 2008, 95, 292–300. [Google Scholar] [CrossRef]
- Zhou, Z.; Plauborg, F.; Parsons, D.; Andersen, M.N. Potato canopy growth, yield and soil water dynamics under different irrigation systems. Agric. Water Manag. 2018, 202, 9–18. [Google Scholar] [CrossRef]
- Silva, A.L.B.R.; Zotarelli, L.; Dukes, M.D.; van Santen, E.; Asseng, S. Nitrogen fertilizer rate and timing of application for potato under different irrigation methods. Agric. Water Manag. 2023, 283, 108312. [Google Scholar] [CrossRef]
- King, B.A.; Stark, J.C.; Wall, R.W. Comparison of site-specific and conventional uniform irrigation management for potatoes. App. Eng. Agric. 2006, 22, 677–688. [Google Scholar] [CrossRef]
- Yuan, T.; Fengmin, L.; Puhai, L. Economic analysis of rainwater harvesting and irrigation methods, with an example from China. Agric. Water Manag. 2003, 60, 217–226. [Google Scholar] [CrossRef]
- Touil, S.; Richa, A.; Fizir, M.; Argente García, J.E.; Skarmeta Gómez, A.F. A review on smart irrigation management strategies and their effect on water savings and crop yield. Irrig. Drain. 2022, 71, 1396–1416. [Google Scholar] [CrossRef]
- Gallardo, M.; Elia, A.; Thompson, R.B. Decision support systems and models for aiding irrigation and nutrient management of vegetable crops. Agric. Water Manag. 2020, 240, 106209. [Google Scholar] [CrossRef]
- Hatfield, J.L.; Dold, C. Water-use efficiency: Advances and challenges in a changing climate. Front. Plant Sci. 2019, 10, 103. [Google Scholar] [CrossRef] [PubMed]
- Djaman, K.; O’Neill, M.; Owen, C.K.; Smeal, D.; Koudahe, K.; West, M.; Allen, S.; Lombard, K.; Irmak, S. Crop evapotranspiration, irrigation water requirement and water productivity of maize from meteorological data under semiarid climate. Water 2018, 10, 405. [Google Scholar] [CrossRef]
- Howell, T.A. Enhancing water use efficiency in irrigated agriculture. Agron. J. 2001, 93, 281–289. [Google Scholar] [CrossRef]
- Kassaye, K.T.; Yilma, W.A.; Fisha, M.H.; Haile, D.H. Yield water use efficiency of potato under alternate furrows deficit irrigation. Int. J. Agron. 2020, 2020, e8869098. [Google Scholar] [CrossRef]
- Reddy, J.M.; Jumaboev, K.; Bobojonov, I.; Carli, C.; Eshmuratov, D. Yield and water use efficiency of potato varieties under different soil-moisture stress conditions in the Fergana Valley of Central Asia. Agroecol. Sustain. Food Syst. 2016, 40, 407–431. [Google Scholar] [CrossRef]
- Alva, A.K. Enhancing sustainable nutrient irrigation management for potatoes. J. Crop Improv. 2010, 24, 281–297. [Google Scholar] [CrossRef]
- Hopkins, B.G.; Stark, J.C.; Kelling, K.A. Nutrient Management. In Potato Production Systems; Stark, J.C., Thornton, M., Nolte, P., Eds.; Springer International Publishing: Cham, Switzerland, 2020; pp. 155–202. [Google Scholar]
- Zotarelli, L.; Rens, L.R.; Cantliffe, D.J.; Stoffella, P.J.; Gergela, D.; Burhans, D. Rate and timing of nitrogen fertilizer application on potato ‘FL1867’. Part I: Plant nitrogen uptake and soil nitrogen availability. Field Crops Res. 2015, 183, 246–256. [Google Scholar] [CrossRef]
- Love, S.L.; Stark, J.C.; Salaiz, T. Response of four potato cultivars to rate timing of nitrogen fertilizer. Am. J. Potato Res. 2005, 82, 21–30. [Google Scholar] [CrossRef]
- Makani, M.N.; Zotarelli, L.; Sargent, S.A.; Huber, D.J.; Sims, C.A. Nitrogen fertilizer rate affects yield and tuber quality of drip-irrigated tablestock potatoes (Solanum tuberosum L.) grown under subtropical conditions. Am. J. Potato Res. 2020, 97, 605–614. [Google Scholar] [CrossRef]
- Wang, C.; Zang, H.; Liu, J.; Shi, X.; Li, S.; Chen, F.; Chu, Q. Optimum nitrogen rate to maintain sustainable potato production and improve nitrogen use efficiency at a regional scale in China. A meta-analysis. Agron. Sustain. Dev. 2020, 40, 37. [Google Scholar] [CrossRef]
- Alva, L. Potato Nitrogen Management. J. Veg. Crop Prod. 2004, 10, 97–132. [Google Scholar] [CrossRef]
- Ninh, H.T.; Grandy, A.S.; Wickings, K.; Snapp, S.S.; Kirk, W.; Hao, J. Organic amendment effects on potato productivity and quality are related to soil microbial activity. Plant Soil 2015, 386, 223–236. [Google Scholar] [CrossRef]
- Nyawade, S.O.; Karanja, N.N.; Gachene, C.K.K.; Gitari, H.I.; Schulte-Geldermann, E.; Parker, M. Optimizing soil nitrogen balance in a potato cropping system through legume intercropping. Nutr. Cycl. Agroecosyst. 2020, 117, 43–59. [Google Scholar] [CrossRef]
- Whittaker, J.; Nyiraneza, J.; Zebarth, B.J.; Jiang, Y.; Burton, D.L. The effects of forage grasses and legumes on subsequent potato yield, nitrogen cycling, and soil properties. Field Crops Res. 2023, 290, 108747. [Google Scholar] [CrossRef]
- Wang, Y.; Naber, M.; Crosby, T.; Liang, G. Evaluating multiple diagnostic tools for monitoring in-season nitrogen status of chipping potatoes in the Upper Midwest of the U.S.A. Potato Res. 2022, 65, 31–50. [Google Scholar] [CrossRef]
- Bohman, B.J.; Rosen, C.J.; Mulla, D.J. Evaluation of variable rate nitrogen and reduced irrigation management for potato production. Agron. J. 2019, 111, 2005–2017. [Google Scholar] [CrossRef]
- Muñoz-Huerta, R.F.; Guevara-Gonzalez, R.G.; Contreras-Medina, L.M.; Torres-Pacheco, I.; Prado-Olivarez, J.; Ocampo-Velazquez, R.V. A Review of Methods for Sensing the Nitrogen Status in Plants: Advantages, Disadvantages and Recent Advances. Sensors 2013, 13, 10823–10843. [Google Scholar] [CrossRef] [PubMed]
- Zewide, I.; Mohammed, A.; Solomon, T. Effect of different rates of nitrogen and phosphorus on yield and yield components of potato (Solanum tuberosum L.) at Masha district, Southwestern Ethiopia. Int. J. Soil Sci. 2012, 7, 146–156. [Google Scholar] [CrossRef]
- Fontes, P.C.R.; Braun, H.; Busato, C.; Cecon, P.R. Economic optimum nitrogen fertilization rates and nitrogen fertilization rate effects on tuber characteristics of potato cultivars. Potato Res. 2010, 53, 167–179. [Google Scholar] [CrossRef]
- Liu, K.; Du, J.; Zhong, Y.; Shen, Z.; Yu, X. The response of potato tuber yield, nitrogen uptake, soil nitrate nitrogen to different nitrogen rates in red soil. Sci. Rep. 2021, 11, 22506. [Google Scholar] [CrossRef] [PubMed]
- Cambouris, A.N.; Luce, M.S.; Zebarth, B.J.; Ziadi, N.; Grant, C.A.; Perron, I. Potato response to nitrogen sources and rates in an irrigated sandy soil. Agron. J. 2016, 108, 391–401. [Google Scholar] [CrossRef]
- Nyiraneza, J.; Cambouris, A.N.; Nelson, A.; Khakbazan, M.; Mesbah, M.; Perron, I.; Ziadi, N.; Lafond, J. Potato yield, net revenue and specific gravity responses to nitrogen fertilizer under different canadian agroecozones. Agronomy 2021, 11, 1392. [Google Scholar] [CrossRef]
- Clément, C.-C.; Cambouris, A.N.; Ziadi, N.; Zebarth, B.J.; Karam, A. Potato yield response and seasonal nitrate leaching as influenced by nitrogen management. Agronomy 2021, 11, 2055. [Google Scholar] [CrossRef]
- Bélanger, G.; Walsh, J.R.; Richards, J.E.; Milburn, P.H.; Ziadi, N. Nitrogen fertilization irrigation affects tuber characteristics of two potato cultivars. Am. J. Potato Res. 2002, 79, 269–279. [Google Scholar] [CrossRef]
- Ruža, A.; Skrabule, I.; Vaivode, A. Influence of nitrogen on potato productivity and nutrient use efficiency. Proc. Latvian Acad. Sci. 2013, 67, 247–253. [Google Scholar] [CrossRef]
- Zaeen, A.A.; Sharma, L.K.; Jasim, A.; Bali, S.; Buzza, A.; Alyokhin, A. Yield and quality of three potato cultivars under series of nitrogen rates. Agrosyst. Geosci. Environ. 2020, 3, e20062. [Google Scholar] [CrossRef]
- Maggio, A.; Carillo, P.; Bulmetti, G.S.; Fuggi, A.; Barbieri, G.; De Pascale, S. Potato yield metabolic profiling under conventional organic farming. Eur. J. Agron. 2008, 28, 343–350. [Google Scholar] [CrossRef]
- Gao, X.; Shaw, W.S.; Tenuta, M.; Gibson, D. Yield nitrogen use of irrigated processing potato in response to placement timing source of nitrogen fertilizer in Manitoba. Am. J. Potato Res. 2018, 95, 513–525. [Google Scholar] [CrossRef]
- Hyatt, C.R.; Venterea, R.T.; Rosen, C.J.; McNearney, M.; Wilson, M.L.; Dolan, M.S. Polymer-coated urea maintains potato yields and reduces nitrous oxide emissions in a Minnesota loamy sand. Soil Sci. Soc. Am. J. 2010, 74, 419–428. [Google Scholar] [CrossRef]
- LeMonte, J.L.; Taysom, T.W.; Hopkins, B.G.; Jolley, V.D.; Webb, B.L. Residual soil nitrate and potato yield with polymer coated urea. Western Nutr. Manag. Conf. 2009, 8, 77–81. [Google Scholar]
- Kelling, K.A.; Wolkowski, R.P.; Ruark, M.D. Potato Response to Nitrogen Form and Nitrification Inhibitors. Am. J. Potato Res. 2011, 88, 459–469. [Google Scholar] [CrossRef]
- Souza, E.F.C.; Soratto, R.P.; Fernandes, A.M.; Rosen, C.J. Nitrogen Source and Rate Effects on Irrigated Potato in Tropical Sandy Soils. Agron. J. 2019, 111, 378–389. [Google Scholar] [CrossRef]
- Rolbiecki, R.; Rolbiecki, S.; Figas, A.; Jagosz, B.; Stachowski, P.; Sadan, H.A.; Prus, P.; Pal-Fam, F. Requirements and effects of surface drip irrigation of mid-early potato cultivar courage on a very light soil in central Poland. Agronomy 2021, 11, 33. [Google Scholar] [CrossRef]
- Khan, H.; Acharya, B.; Farooque, A.A.; Abbas, F.; Zaman, Q.U.; Esau, T. Soil and crop variability induced management zones to optimize potato tuber yield. App. Eng. Agric. 2020, 36, 499–510. [Google Scholar] [CrossRef]
- Errebhi, M.; Rosen, C.J.; Gupta, S.C.; Birong, D.E. Potato yield response and nitrate leaching as influenced by nitrogen management. Agron. J. 1998, 90, 10–15. [Google Scholar] [CrossRef]
- Moll, R.H.; Kamprath, E.J.; Jackson, W.A. Analysis and interpretation of factors which contribute to efficiency of nitrogen utilization. Agron. J. 1982, 74, 562–564. [Google Scholar] [CrossRef]
- Getahun, B.B.; Kassie, M.M.; Visser, R.G.F.; van der Linden, C.G. Genetic diversity of potato cultivars for nitrogen use efficiency under contrasting nitrogen regimes. Potato Res. 2020, 63, 267–290. [Google Scholar] [CrossRef]
- Liang, K.; Jiang, Y.; Nyiraneza, J.; Fuller, K.; Murnaghan, D.; Meng, F.-R. Nitrogen dynamics and leaching potential under conventional and alternative potato rotations in Atlantic Canada. Field Crops Res. 2019, 242, 107603. [Google Scholar] [CrossRef]
- Makani, M.N.; Sargent, S.A.; Zotarelli, L.; Huber, D.J.; Sims, C. Harvest Interval Has Greater Effect on Periderm Maturity and Storage Quality of Early-maturing, Tablestock Potato than Nitrogen Rate. HortScience 2017, 52, 1390–1395. [Google Scholar] [CrossRef]
- Stefaniak, T.R.; Fitzcollins, S.; Figueroa, R.; Thompson, A.L.; Carley, C.S.; Shannon, L.M. Genotype and variable nitrogen effects on tuber yield and quality for red fresh market potatoes in Minnesota. Agronomy 2021, 11, 255. [Google Scholar] [CrossRef]
- Zebarth, B.J.; Leclerc, Y.; Moreau, G. Rate timing of nitrogen fertilization of Russet Burbank potato: Nitrogen use efficiency. Can. J. Plant Sci. 2004, 84, 845–854. [Google Scholar] [CrossRef]
- Rens, L.; Zotarelli, L.; Alva, A.; Rowland, D.; Liu, G.; Morgan, K. Fertilizer nitrogen uptake efficiencies for potato as influenced by application timing. Nutr. Cycl. Agroecosyst. 2016, 104, 175–185. [Google Scholar] [CrossRef]
- Ierna, A.; Mauromicale, G. Sustainable and profitable nitrogen fertilization management of potato. Agronomy 2019, 9, 582. [Google Scholar] [CrossRef]
- Shrestha, R.K.; Cooperband, L.R.; MacGuidwin, A.E. Strategies to reduce nitrate leaching into groundwater in potato grown in sandy soils: Case study from North Central, U.S.A. Am. J. Potato. Res 2010, 87, 229–244. [Google Scholar] [CrossRef]
- Jiang, Y.; Nyiraneza, J.; Khakbazan, M.; Geng, X.; Murray, B.J. Nitrate leaching and potato yield under varying plow timing and nitrogen rate. Agrosyst. Geosci. Environ. 2019, 2, 190032. [Google Scholar] [CrossRef]
- El-Sayed, M.M.; El-Desoky, A.I.; El-Monem, A.M.A.A.; Gameh, M.A. Deficit irrigation and nitrogen fertilizers effects on crop production and environment hazardous of nitrate leaching in Upper Egypt. Int. J. Environ. 2014, 3, 245–255. [Google Scholar]
- Eltarabily, M.G.; Burke, J.M.; Bali, K.M. Effect of deficit irrigation on nitrogen uptake of sunflower in the low desert region of California. Water 2019, 11, 2340. [Google Scholar] [CrossRef]
- Yang, W.; Jiao, Y.; Yang, M.; Wen, H.; Gu, P.; Yang, J.; Liu, L.; Yu, J. Minimizing soil nitrogen leaching by changing furrow irrigation into sprinkler fertigation in potato fields in the northwestern China plain. Water 2020, 12, 2229. [Google Scholar] [CrossRef]
- Waddell, J.T.; Gupta, S.C.; Moncrief, J.F.; Rosen, C.J.; Steele, D.D. Irrigation-; nitrogen-management impacts on nitrate leaching under potato. J. Environ. Qual. 2000, 29, 251–261. [Google Scholar] [CrossRef]
- Marsh, B. Irrigation and nitrogen fertilizer rate impacts on soil nitrate in potato production. Commun. Soil Sci. Plant Anal. 2019, 50, 1811–1820. [Google Scholar] [CrossRef]
- Li, W.; Xiong, B.; Wang, S.; Deng, X.; Yin, L.; Li, H. Regulation effects of water and nitrogen on the source-sink relationship in potato during the tuber bulking stage. PLoS ONE 2016, 11, e0146877. [Google Scholar] [CrossRef]
- Essah, S.Y.C.; Delgado, J.A.; Dillon, M.; Sparks, R. Cover crops can improve potato tuber yield and quality. HortTechnology 2012, 22, 185–190. [Google Scholar] [CrossRef]
- Stark, J.C.; Porter, G.A. Potato nutrient management in sustainable cropping systems. Am. J. Potato Res. 2005, 82, 329–338. [Google Scholar] [CrossRef]
- Arriaga, F.J.; Lowery, B.; Kelling, K.A. Surfactant impact on nitrogen utilization leaching in potatoes. Am. J. Pot. Res. 2009, 86, 383–390. [Google Scholar] [CrossRef]
- Bohman, B.J.; Rosen, C.J.; Mulla, D.J. Impact of variable rate nitrogen reduced irrigation management on nitrate leaching for potato. J. Environ. Qual. 2020, 49, 281–291. [Google Scholar] [CrossRef]
- Wu, L.; Li, L.; Ma, Z.; Fan, M. Improving potato yield, water productivity and nitrogen use efficiency by managing irrigation based on potato root distribution. Int. J. Plant Prod. 2022, 16, 547–555. [Google Scholar] [CrossRef]
- Yang, Y.; Yin, J.; Ma, Z.; Wei, X.; Sun, F.; Yang, Z. Water and nitrogen regulation effects and system optimization for potato (Solanum tuberosum L.) under film drip irrigation in the dry zone of Ningxia China. Agronomy 2023, 13, 308. [Google Scholar] [CrossRef]
- Kirda, C.R. Deficit irrigation scheduling based on plant growth stages showing water stress tolerance. In Deficit Irrigation Practices; Water Reports 22; Food and Agriculture Organization of the United Nations: Rome, Italy, 2002; pp. 3–10. Available online: https://www.fao.org/3/y3655e/y3655e03.htm (accessed on 8 August 2023).
- Leskovar, D.I.; Xu, C.; Agehara, S.; Sharma, S.P.; Crosby, K. Irrigation strategies for vegetable crops in water-limited environments. J. Arid Land Stud. 2014, 24, 133–136. [Google Scholar]
- English, M.J.; Musich, J.T.; Murty, V.V.N. Deficit irrigation. In Management of Farm Irrigation Systems; Hoffman, G.J., Howell, T.A., Soloman, K.H., Eds.; ASAE: St. Joseph, MI, USA, 1990; pp. 631–663. [Google Scholar]
- English, M.; Raja, S.N. Perspectives on deficit irrigation. Agric. Water Manag. 1996, 32, 1–14. [Google Scholar] [CrossRef]
- Chai, Q.; Gan, Y.; Zhao, C.; Xu, H.L.; Waskom, R.M.; Niu, Y.; Siddique, K.H.M. Regulated deficit irrigation for crop production under drought stress. A review. Agron. Sustain. Dev. 2015, 36, 3. [Google Scholar] [CrossRef]
- Jensen, C.R.; Battilani, A.; Plauborg, F.; Psarras, G.; Chartzoulakis, K.; Janowiak, F.; Stikic, R.; Jovanovic, Z.; Li, G.; Qi, X.; et al. Deficit irrigation based on drought tolerance and root signalling in potatoes and tomatoes. Agric. Water Manag. 2010, 98, 403–413. [Google Scholar] [CrossRef]
- Nagaz, K.; El Mokh, F.; Alva, A.K.; Masmoudi, M.M.; Mechlia, N.B. Potato response to different irrigation regimes using saline water. Irrig. Drain. 2016, 65, 654–663. [Google Scholar] [CrossRef]
- Qin, J.; Ramírez, D.A.; Xie, K.; Li, W.; Yactayo, W.; Jin, L.; Quiroz, R. Is partial root-zone drying more appropriate than drip irrigation to save water in China? A preliminary comparative analysis for potato cultivation. Potato Res. 2018, 61, 391–406. [Google Scholar] [CrossRef]
- Shock, C.C.; Feibert, E.B.G. Deficit irrigation of potato. In Deficit Irrigation Practices; Water Reports 22; Food and Agriculture Organization of the United Nations: Rome, Italy, 2002; pp. 47–55. [Google Scholar]
- Trifonov, P.; Lazarovitch, N.; Arye, G. Increasing water productivity in arid regions using low-discharge drip irrigation: A case study on potato growth. Irrig. Sci. 2017, 35, 287–295. [Google Scholar] [CrossRef]
- Karam, F.; Amacha, N.; Fahed, S.; El Asmar, T.; Domínguez, A. Response of potato to full and deficit irrigation under semiarid climate: Agronomic and economic implications. Agric. Water Manag. 2014, 142, 144–151. [Google Scholar] [CrossRef]
- Maas, E.V.; Hoffman, G.J. Crop salt tolerance-current assessment. J. Irrig. Drain. Div. 1977, 103, 115–134. [Google Scholar] [CrossRef]
- Katerji, N.; van Hoorn, J.W.; Hamdy, A.; Mastrorilli, M. Salinity effect on crop development and yield, analysis of salt tolerance according to several classification methods. Agric. Water Manag. 2003, 62, 37–66. [Google Scholar] [CrossRef]
- Levy, D.; Coleman, W.K.; Veilleux, R.E. Adaptation of Potato to Water Shortage: Irrigation Management and Enhancement of Tolerance to Drought and Salinity. Am. J. Potato Res. 2013, 90, 186–206. [Google Scholar] [CrossRef]
- Ghazouani, H.; Rallo, G.; Mguidiche, A.; Latrech, B.; Douh, B.; Boujelben, A.; Provenzano, G. Effects of saline and deficit irrigation on soil-plant water status and potato crop yield under the semiarid climate of Tunisia. Sustainability 2019, 11, 2706. [Google Scholar] [CrossRef]
Figure 1.
Potato production volume, yield, and harvested area in top 10 potato producing countries [1].
Figure 1.
Potato production volume, yield, and harvested area in top 10 potato producing countries [1].
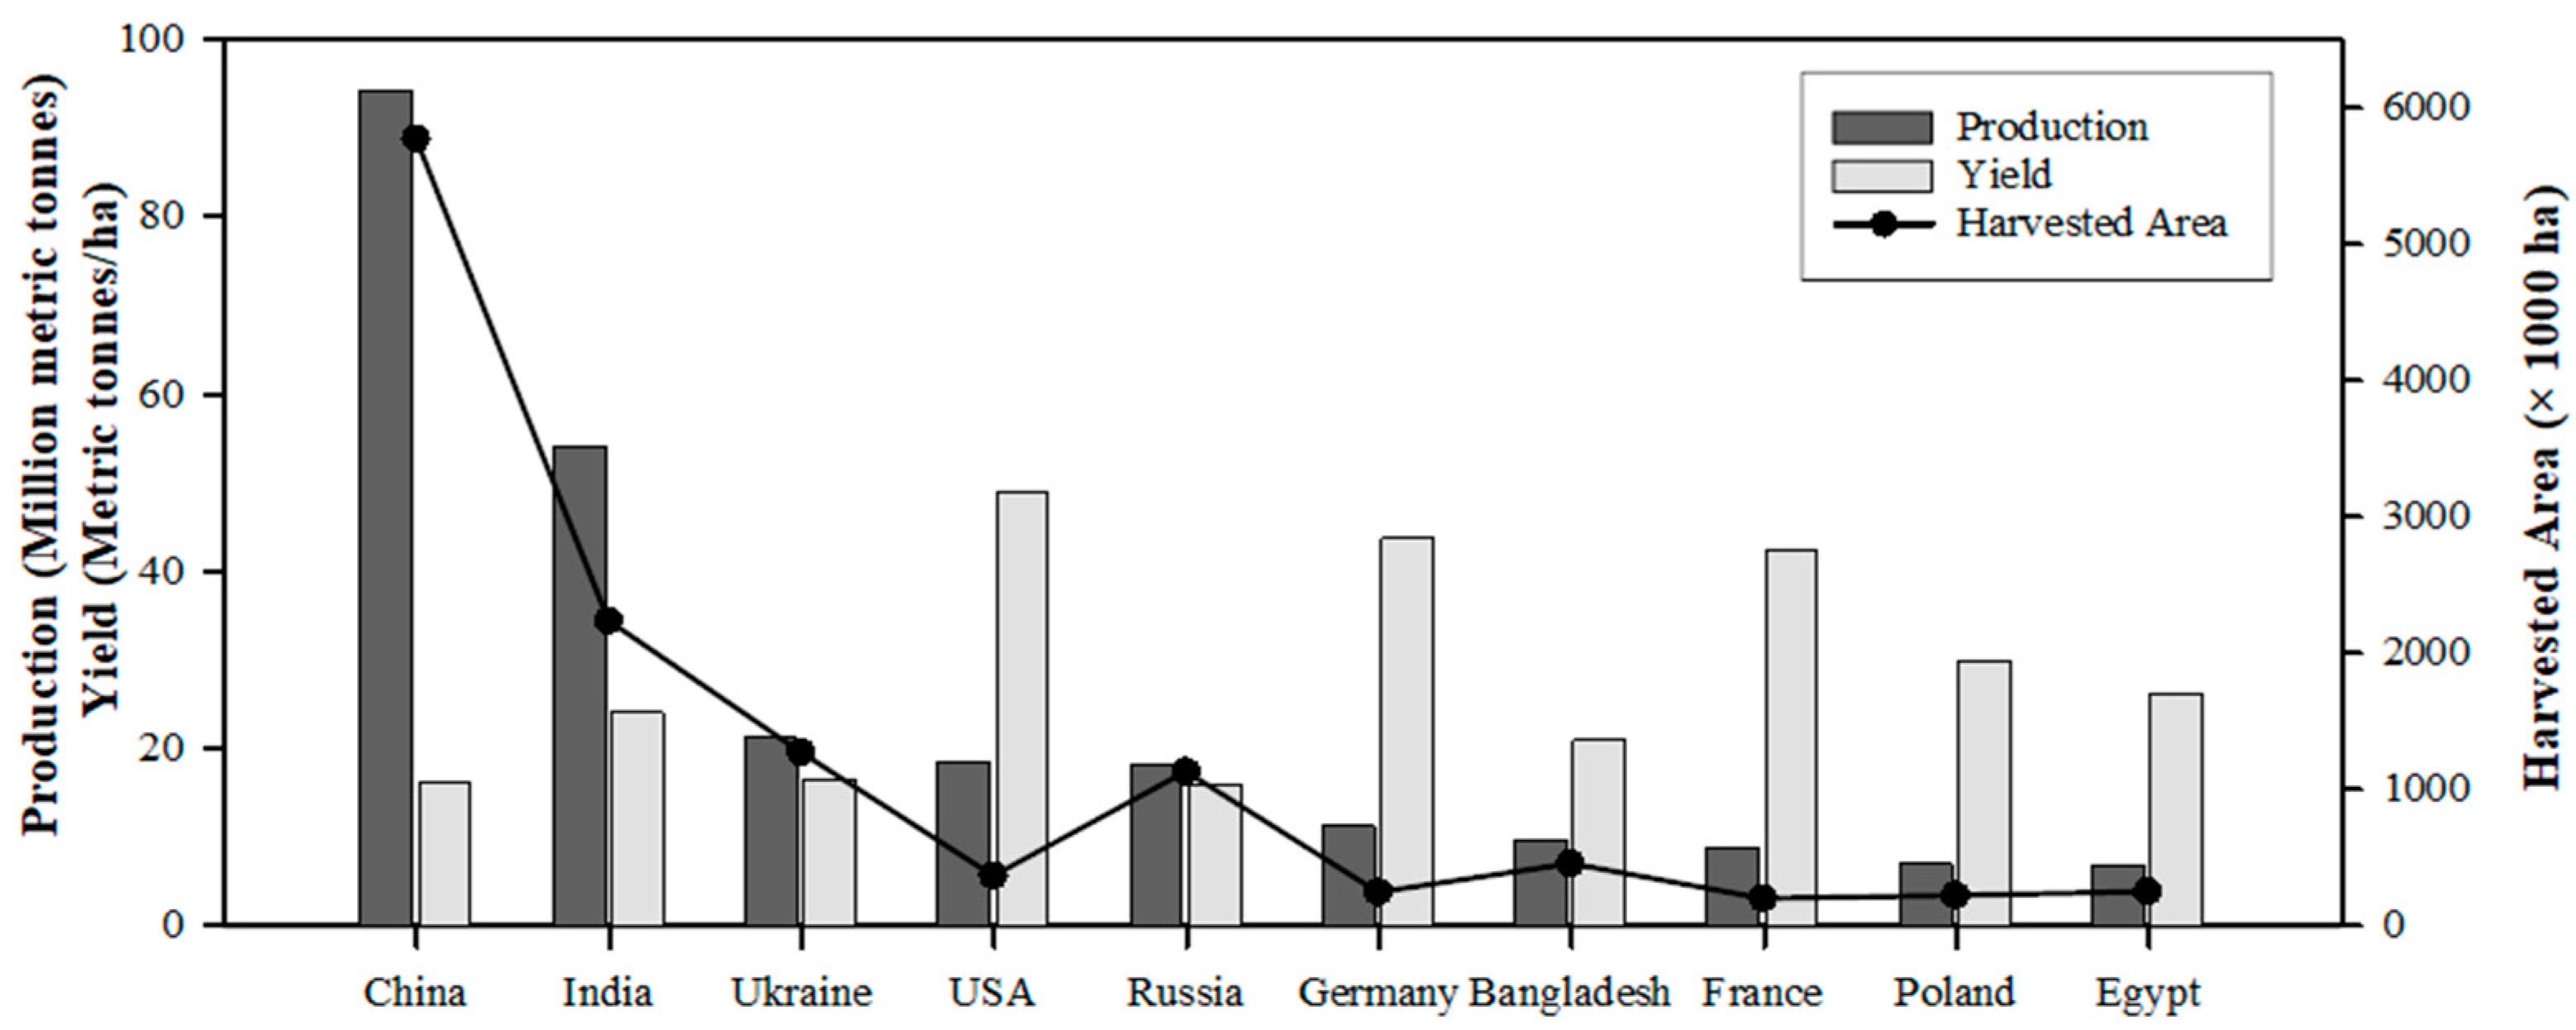
Figure 2.
Top 10 potato-producing states of USA in 2021 [2].
Figure 2.
Top 10 potato-producing states of USA in 2021 [2].

Figure 3.
Potato utilization in USA [2].
Figure 3.
Potato utilization in USA [2].

Table 2.
Effects of N application rates and methods on potato tuber yield and NUE.
| Location | Soil Type | Variety | N Source | N Application Method | Timing | N Rates (kg/ha) | Total N Rate (kg/ha) | Tuber Yield (Mg/ha) | NUE | Reference | Remarks | ||
|---|---|---|---|---|---|---|---|---|---|---|---|---|---|
| North Eastern Florida (Farm 1) | Alaquod Spodosol | FL 1867 (Chipping type) | Granular AN (34%N) for Pre-pl and Liquid UAN (32% N) for PE and TI | Band application | 2011 | 2012 | 2011 | 2012 | [89] | NUE is in kg plant biomass/kgN) and tuber yield is the total tuber yield | |||
| Pre-pl:E:TI | 56:0:56 | 112 | 39.6 | 42 | 58 | 58.8 | |||||||
| Pre-pl:E:TI | 56:0:112 | 168 | 47 | 45.7 | |||||||||
| Pre-pl:E:TI | 56:56:56 | 168 | 43.1 | 44.8 | 39 | 43.1 | |||||||
| Pre-pl:E:TI | 56:56:112 | 224 | 34.2 | 32.2 | |||||||||
| Pre-pl:E:TI | 56:112:56 | 224 | 47.2 | 46 | 31.8 | 34.6 | |||||||
| Pre-pl:E:TI | 56:112:112 | 280 | 28.6 | 28.7 | |||||||||
| Pre-pl:E:TI | 56:168:56 | 280 | 44.1 | 43.3 | 27.3 | 28.5 | |||||||
| Pre-pl:E:TI | 56:168:112 | 336 | 24.3 | 23.9 | |||||||||
| Becker, Minnesota | Hubbard loamy sand (Frigid Entic Hapludolls) | Russet Burbank | 2016/17 | 2016/17 | [98] | Total tuber yield | |||||||
| DAP | All DAP were band applied, all urea were applied via fertigation, UAN was applied in 4 equal splits | PL:E:PE | 45:0:0 | 45 | 54.3 | - | |||||||
| DAP:Urea:UAN | PL:E:PE | 45:67:68 | 180 | 69.8 | - | ||||||||
| DAP:PCU | PL:E:PE | 45:135:0 | 180 | 69.4 | - | ||||||||
| DAP:Urea:UAN | PL:E:PE | 45:135:88 | 270 | 73.4 | - | ||||||||
| DAP: PCU | PL:E:PE | 45:225:0 | 270 | 71.6 | - | ||||||||
| DAP:Urea | PL:E:PE | 45:135: RES | 180+ RES | 72.3 | - | ||||||||
| Prince Edward Island, Canada | Humid Haplorthods | Russet Burbank | AN (34% N) | Band application | Planting | 2014 | 2015 | 2014 | 2015 | [104] | Marketable yield | ||
| 0 | 0 | 24.3 | 44 | - | - | ||||||||
| 60 | 60 | 33.9 | 49.5 | - | - | ||||||||
| 120 | 120 | 36.9 | 53.5 | - | - | ||||||||
| 180 | 180 | 34.5 | 58.7 | - | - | ||||||||
| 240 | 240 | 33.5 | 53.1 | - | - | ||||||||
| Sicily, Italy | Clay loam, Calcixerollic Xerochrepts | Spunta | AN | 2010 | 2011 | 2010 | 2011 | [125] | Marketable yield Agronomic NUE (kg tuber DW/kg N) | ||||
| 0 | 0 | 14.3 | 35.7 | - | - | ||||||||
| E: 21 DAE | 50:50 | 100 | 35.9 | 47.7 | 73.3 | 95.8 | |||||||
| E: 21 DAE | 100:100 | 200 | 46.7 | 47.6 | 43.7 | 47.1 | |||||||
| E: 21 DAE | 150:150 | 300 | 48.7 | 53.3 | 28.7 | 35.1 | |||||||
| E: 21 DAE | 200:200 | 400 | 48.5 | 54.6 | 23 | 27.6 | |||||||
| South Sinai, Egypt | Sandy, Entisol-Typic Torripsamments | Cara | AS was soil applied for control, AN was drip fertigated for Equal and Wise; Total N ratio at ini, dev, mid, and late stages are 12.5, 25, 50, 12.5% | 2021 | 2021 | [74] | NUE is in kg yield/kg N | ||||||
| Control | PL: 28 DAP | 120:120 | 240 | 23.1 | 96 | ||||||||
| Equal | Weekly | 20 | 240 | 27.8 | 116 | ||||||||
| Equal | Biweekly | 40 | 240 | 25.2 | 105 | ||||||||
| Wise, weekly | ini:dev:mid:late | 7.5:15:30:7.5 | 240 | 32.4 | 135 | ||||||||
| Wise, biweekly | ini:dev:mid:late | 15:30:60:15 | 240 | 30.3 | 126 | ||||||||
| Control | PL: 28 DAP | 180:180 | 360 | 28.5 | 79 | ||||||||
| Equal | Weekly | 30 | 360 | 37.8 | 105 | ||||||||
| Equal | Biweekly | 60 | 360 | 35.1 | 98 | ||||||||
| Wise, weekly | ini:dev:mid:late | 11.5:23:46:11.5 | 360 | 42.7 | 119 | ||||||||
| Wise, biweekly | ini:dev:mid:late | 23:46:92:23 | 360 | 40.1 | 111 | ||||||||
AN: Ammonium Nitrate, UAN: Urea Ammonium Nitrate, PCU: Polymer Coated Urea, AS: Ammonium Sulphate, DAP: Di-ammonium Phosphate, Pre-pl: pre-planting, PL: planting, E; emergence, PE: post-emergence, TI: tuber initiation, RES: remote sensing based experimental procedure, DAE: days after emergence, DAP: days after planting, ini: initial stage, dev: developmental stage, mid: mid-season stage.
Disclaimer/Publisher’s Note: The statements, opinions and data contained in all publications are solely those of the individual author(s) and contributor(s) and not of MDPI and/or the editor(s). MDPI and/or the editor(s) disclaim responsibility for any injury to people or property resulting from any ideas, methods, instructions or products referred to in the content. |
© 2023 by the authors. Licensee MDPI, Basel, Switzerland. This article is an open access article distributed under the terms and conditions of the Creative Commons Attribution (CC BY) license (https://creativecommons.org/licenses/by/4.0/).
Share and Cite
MDPI and ACS Style
Shrestha, B.; Darapuneni, M.; Stringam, B.L.; Lombard, K.; Djaman, K. Irrigation Water and Nitrogen Fertilizer Management in Potato (Solanum tuberosum L.): A Review. Agronomy 2023, 13, 2566. https://doi.org/10.3390/agronomy13102566
AMA Style
Shrestha B, Darapuneni M, Stringam BL, Lombard K, Djaman K. Irrigation Water and Nitrogen Fertilizer Management in Potato (Solanum tuberosum L.): A Review. Agronomy. 2023; 13(10):2566. https://doi.org/10.3390/agronomy13102566
Chicago/Turabian StyleShrestha, Bhimsen, Murali Darapuneni, Blair L. Stringam, Kevin Lombard, and Koffi Djaman. 2023. "Irrigation Water and Nitrogen Fertilizer Management in Potato (Solanum tuberosum L.): A Review" Agronomy 13, no. 10: 2566. https://doi.org/10.3390/agronomy13102566
Note that from the first issue of 2016, this journal uses article numbers instead of page numbers. See further details here.