Article

Heavy Metals Can Affect Plant Morphology and Limit Plant Growth and Photosynthesis Processes

Nanjing Institute of Environmental Science, Ministry of Ecology and Environment, Nanjing 210042, China
*
Author to whom correspondence should be addressed.
Agronomy 2023, 13(10), 2601; https://doi.org/10.3390/agronomy13102601
Submission received: 28 July 2023 / Revised: 21 September 2023 / Accepted: 25 September 2023 / Published: 12 October 2023

Abstract

:
Soil heavy metal pollution caused by human activities has become one of the most critical environmental issues with a global concern. Phytoremediation is widely used due to its low cost and environmental friendliness. However, the impact of heavy metals on plant growth remains unclear. This study investigated the effects on the growth and photosynthetic activity of Picris divaricata Vant. under different cadmium concentrations using a hydroponics cultivation system. The results showed that the growth and photosynthetic processes of P. divaricata exhibited a phenomenon of promotion in low Cd concentrations and inhibition in high Cd concentrations. Under a low to medium Cd concentration (≤25 μM), there was no Cd toxicity in terms of plant growth, but high concentrations of Cd inhibited plant growth. The Fe content of leaves gradually increased as the Cd concentration increased; it reached 201.8 mg kg−1 in 75 μM Cd. However, there was no significant difference in Mn between the 75 μM Cd treatment and the control (p > 0.05). The contents of carotenoid ranged between 3.06 and 3.26 mg/g across the different Cd treatments, showing no significant differences. The treatment with 5–75 μM Cd did not directly affect the photosynthesis of P. divaricata. Higher Cd concentrations reduced the stomatal density on the of P. divaricata leaves, resulting in stomatal and mesophyll conductance limitations, indirectly affecting P. divaricata photosynthesis. These research results provide a reference for evaluating and selecting heavy metal tolerant plants and provide environmentally friendly approaches to remediate heavy metal pollution.

1. Introduction

With industrial development, human activities have led to an enormous increase in the content of heavy metals in soil [1]. In the early 1990s, the average amount of cadmium (Cd) entering the soil through various sources reached 22,000 tons per year [2]. However, Cd is a non-essential and toxic trace element in plants, and it is easily absorbed by plant roots and transported to the leaves and the fruits [3]. After Cd enters the plant, it may impact plant growth and photosynthesis. The photosynthetic reaction sites of plants are most susceptible to heavy metal ions, and Cd is considered the most effective inhibitor of photosynthesis [4]. Cd has been shown to affect the net photosynthetic rate of many plants, such as tomatoes, rice, corn, and Indian mustard. Although only a small proportion of Cd2+ can enter the chloroplast, it can strongly inhibit pigment functions, chloroplast structure, and photosynthesis’s light and dark reactions. In addition, Cd disrupts the integrity of the chloroplast membrane system [5], leading to a significant increase in osmolytes. It was reported that low-concentration Cd treatment resulted in a sparse structure of the thylakoids in maize chloroplasts [6]. As Cd concentration increased, the thylakoids and grana disappeared, and the chloroplasts became spherical and shrunk. However, studies have also shown that increasing the concentration of Mn ions in the culture medium under Cd stress can partially restore the damaged structure of chloroplasts [7]. The inhibition of chlorophyll synthesis by Cd is considered the initial mechanism by which Cd affects photosynthesis [8]. The total chlorophyll content of P. australis decreased by 30% and 60% compared to the control, under 50 and 100 μM Cd, respectively [9]. In addition to reducing the total chlorophyll content, Cd directly affects the photon capture by chlorophyll molecules, leading to the reduction and eventual shutdown of photosynthesis. Certain studies have demonstrated that Cd can replace the carotenoid binding in PSII [10], thus affecting carotenoids that play an important role in plant absorption of light energy and chlorophyll protection.
Presently, research on plants that have metal hyperaccumulator properties mainly focuses on heavy metal absorption, transportation, storage, and detoxification mechanisms by different super-enriched plants at the physiological and molecular levels [11,12]. Moreover, the inhibitory effect of heavy metal stress on photosynthesis has been extensively demonstrated [13]. However, Cd can also promote growth and increase photosynthetic rates in certain species. Picris divaricata Vant. is a Zn/Cd polymetallic-tolerant and hyperaccumulator plant that is able to grow in Lanping County, Yunnan Province, where China’s largest lead and zinc mine is located. It has high heavy metal tolerance, enrichment ability, and relatively large biomass [14]. In this study, we compared and analyzed the growth and photosynthetic response of P. divaricata under Cd stress using a hydroponics-based cultivation system and investigated the mechanisms underlying photosynthesis maintenance under these conditions. The research results provide a basis for heavy metal phytoextraction approaches using hyperaccumulator plants and insights into the physiological adaptation mechanisms of plants in extreme environments.

2. Materials and Methods

2.1. Experimental Design

Seedlings of P. divaricata were collected from the Jinding lead–zinc mining area in Lanping County, Nujiang Prefecture, Yunnan Province. Seedlings with similar growth were transferred to plastic pots containing 500 mL of 20% Hoagland nutrient solution for pre-cultivation. After 14 days of plant pre-cultivation, five Cd concentrations were applied in the above nutrient solution, namely 0 (CK), 5, 10, 25, 50, and 75 μM (added as CdCl2·2.5 H2O). Each treatment has 3 replicates, with three plants per replicate (Figure 1). The nutrient solution was changed every 3 days, and continuous aeration was maintained. The greenhouse growth conditions were day/night temperature of 25/18 °C, relative humidity of 70–75%, and light intensity of 100 μmol·m−2·s−1, with 14 h of light and 10 h of darkness per day.

2.2. Biomass Measurements and Root Growth Analyses of P. divaricata under Cd Stress

After 14 days of plant pre-cultivation, the entire P. divaricata seedlings were removed from the medium, and the plant roots were soaked in 5 mM CaCl2 for 5 min to remove heavy metal ions adsorbed on the surface of the roots. The samples were collected from 3 plants in each pot and pooled for the analyses. Then, the samples were washed with deionized water, and, after separating the above-ground parts and the roots, their fresh weight was measured separately. The plants were then dried at 105 °C for 30 min and at 75 °C for 48 h to a constant weight, and then the dry weight was measured.
The P. divaricata root morphological characteristics were measured using the WinRHIZO root analysis system manufactured by Regent Instruments in Canada. The root sample was placed in a 30 cm × 40 cm transparent glass tray, and water was added, forming a 3–4 mm layer to disperse the root system fully. The root system was scanned with a double-sided light source and analyzed by dedicated digital software (WinRHIZO 2008a). Morphological indicators such as root length, root surface area, root volume, and average root diameter were obtained.

2.3. Determination of Photosynthetic Parameters

A total of 1~2 fully expanded leaves were selected from the plants in each pot for the determination of photosynthetic parameters with a photosynthesis meter (LI-6400XT, LI-COR, Lincoln, NE, USA). Using a combined red and blue light source leaf chamber, the net photosynthetic rate (AN), stomatal conductance (gs), intercellular CO2 concentration (Ci), and other gas exchange parameters were measured under different light density flux (PPFD) settings (2000, 1800, 1500, 1200, 1000, 800, 700, 600, 500, 400, 200, 100, 50, 20, and 0 μmol·m−2·s−1). The measurement conditions were leaf temperature of 25 °C, CO2 concentration 380 ± 5 μmol/mol, and airflow rate of 500 μmol·s−1.

2.4. Determination of Chlorophyll Fluorescence Parameters

The chlorophyll of leaves was determined by 80% acetone extraction spectrophotometry. Remove the weighed leaves from the refrigerator at −80 °C and place them in a mortar. Then add a small amount of calcium carbonate and 2–3 mL of 80% acetone to grind into a homogenate. Filter the extract into a 25 mL colorimetric tube wrapped in tin foil, rinse the mortar, grinding rod, and residue several times with a small amount of 80% acetone, pour into a funnel, and filter together. Dilute to 25 ml with 80% acetone and shake well. Measure the extinction of the extraction solution at wavelengths 663, 646, and 470 nm using 80% acetone as the blank.
The chlorophyll fluorescence parameters of the plants were measured with the LI-6400XT photosynthesis meter. The measured leaf position was the same as those selected for photosynthetic gas exchange parameter measurements. The specific steps followed were:
(1)
After dark adaptation of the selected leaf for 30 min, a light with a wavelength of 630 nm was flashed on the leaf to measure the initial fluorescence (Fo). Then, light with a wavelength of 630 nm and an intensity of approximately 6000 μmol·m−2·s−1 was used to saturate the reaction centers of photosystem II (Duration 0.8 s, Intensity 7, Blue 10%, Modulation 20 KHz, Filter 50 KHz) to determine the maximum fluorescence (Fm).
(2)
The leaves sampled for the measurements were exposed to continuous photochemical active light (constant light in a greenhouse with a light intensity of 80 μmol·m−2·s−1 for 30 min at steady-state fluorescence (Fs)). Then, the light intensity was increased to 6000 μmol·m−2·s−1 to measure the maximum fluorescence (Fm′) after adaptation under saturated light irradiation. Then, the photochemically active light was stopped, and far-red light with a wavelength of 740 nm was applied (Duration 6 s, Intensity 8, Modulation 0.25 KHz, Filter 1 KHz) to measure the minimal fluorescence, Fo′.
(3)
Other chlorophyll fluorescence parameters of PSII, such as the maximum photochemical efficiency (Fv/Fm), actual photochemical efficiency of PSII (ΦPSII), the photochemical quenching (qP), non-photochemical quenching (NPQ), and electron transfer rate (ETR) of PSII were calculated according to the following formulas:
Fv/Fm = (FmFo)/Fm
Fv′/Fm′ = (Fm′ − Fo′)/Fm
ΦPSII= (Fm′ − Fs′)/Fm
qP = (FmFs)/(Fm′ − Fo′)
NPQ = (FmFm′)/Fm′ = Fm/Fm′ − l
ETR = ΦPSII × PPFD × 0.5 × 0.84

2.5. Stomatal Pore Observation by Scanning Electron Microscopy

Samples with a width of 2–3 mm were excised from the middle transverse section of a plant leaf. The samples were washed with deionized water and immersed in a 1% Na2S aqueous solution. They were then subjected to vacuum infiltration for 5 min to appropriately soak with the solution. After soaking at room temperature for another 25 min, they were rinsed twice with 0.1 mmol L−1 phosphate buffer (pH 7.2). A single-sided blade pre-cooled with liquid nitrogen was used to cut the sample and obtain an undisturbed transverse section, which was then quickly transferred to a freeze-drying machine (JFD-320, JEOL, Tokyo, Japan) for drying. The dried samples were mounted on the plastic platform, sprayed with carbon, and observed under the scanning electron microscope (SEM, Model Quanta 400, FEI, Eindhoven, The Netherlands) under thermal field emission.

2.6. Fluorescence CO2 Response Curve

The chlorophyll fluorescence CO2 response curves of plants were measured by the LI-6400XT photosynthesis analyzer and a fluorescence leaf chamber (LI-COR, Lincoln, NE, USA). Please refer to annex 1 for specific measurement methods (File S1).

2.7. Statistical Analysis

Statistical analyses were performed using SPSS 16.0 (IBM, New York, NY, USA). Descriptive statistics were used to calculate the means and standard deviations for each set of replicates. One-way ANOVA with LSD-t test was performed to test the differences in the biomass, root growth, and metals of different Cd treatments. A one-way ANOVA was also used to analyze the effect of Cd treatments on PSII, chlorophyll a, chlorophyll b, and carotenoid contents. All data were tested for normal distribution and homogeneity of variance.

3. Results

3.1. Effects of Cd Stress on the Biomass, Root Growth, and Metals Content of P. divaricata

Low to medium Cd concentrations had a beneficial effect on the total biomass and root growth of P. divaricata, which were gradually reduced as the Cd concentration increased to high levels (Figure 2). The FW of P. divaricata was the highest in the 5 μM Cd treatment, 1.27-fold higher than that of the CK, but gradually decreased with the increase in Cd concentration. There was no significant difference between the 10 and 25 μM Cd treatments (p > 0.05). The FWs of P. divaricata under 5, 10, and 25 μM Cd were 2-, 1.33-, and 1.24-fold higher than the CK, respectively. The FW of P. divaricata under the 50 and 75 μM Cd treatments was significantly lower compared to 25 μM Cd. The DW of P. divaricate followed the same patterns as the FW under the different Cd treatments. However, the DW of P. divaricata exhibited a more pronounced Cd concentration response. In the 5–25 μM Cd treatment, the DW was 1.85–2.19-fold higher than that of the CK. The length, average diameter, total surface area, and total volume of the roots increased with the increase in Cd concentration (Table 1). In the 5–25 μM Cd treatments, they were significantly higher than those of CK (p < 0.05). However, they decreased significantly in the 50 and 75 μM Cd treatments (p < 0.05).
There were no significant changes in the Mg, Ca, and Cu in leaves of P. divaricata under Cd treatment (Table 2). The Fe content of leaves were 144.1 and 153.9 mg kg−1 in the 5–10 μM Cd treatment, showing a significant difference from the control (p < 0.05). However, the Fe content of leaves gradually increased as the Cd concentration increased, and it reached 201.8 mg kg−1 in 75 μM Cd. Similarly, the content of Mn in the 5–25 μM Cd treatment was lower than the control; they were 60.4%, 78.2%, and 52.3% of the control, respectively. There was no significant difference in Mn between 75 μM Cd treatment and control (p > 0.05).

3.2. Effects of Cadmium on Leaf Pigment Content of P. divaricata

The chlorophyll a, chlorophyll b, and carotenoid contents in the leaves of P. divaricata were increased as the Cd treatment concentration increased, and then they decreased under higher Cd concentrations (Figure 3). They were significantly higher in the 25 μM Cd concentration compared to the CK (p < 0.05). Whereas, under 50 and 75 μM of Cd, they were significantly lower compared to CK (p > 0.05). There was no significant difference in chlorophyll a/b between the 5 and 10 μM Cd treatments (p > 0.05). Similarly, there were also no differences in chlorophyll a/b between the 50 and 75 μM Cd treatments (p > 0.05). The contents of carotenoid ranged between 3.06 and 3.26 mg/g across the different Cd treatments, showing no significant differences (p > 0.05).

3.3. Distribution Pattern of Blade Cross-Section

Compared to the control, the 5 and 10 μM Cd treatments resulted in a thickening of the P. divaricata leaf cross-section, with thicknesses of 147.3 and 142.0 μM, respectively (Figure 4 and Figure 5). As the concentration of Cd applied increased, the thickness of cross-section of the leaves became compact, and the intercellular spaces became smaller. The lowest value was observed at 75 μM Cd at 103.3 μm, which was 22.3% lower than that of CK, at 133.0 μM.

3.4. Effects of Cadmium on the Photochemical Reactions of P. divaricata

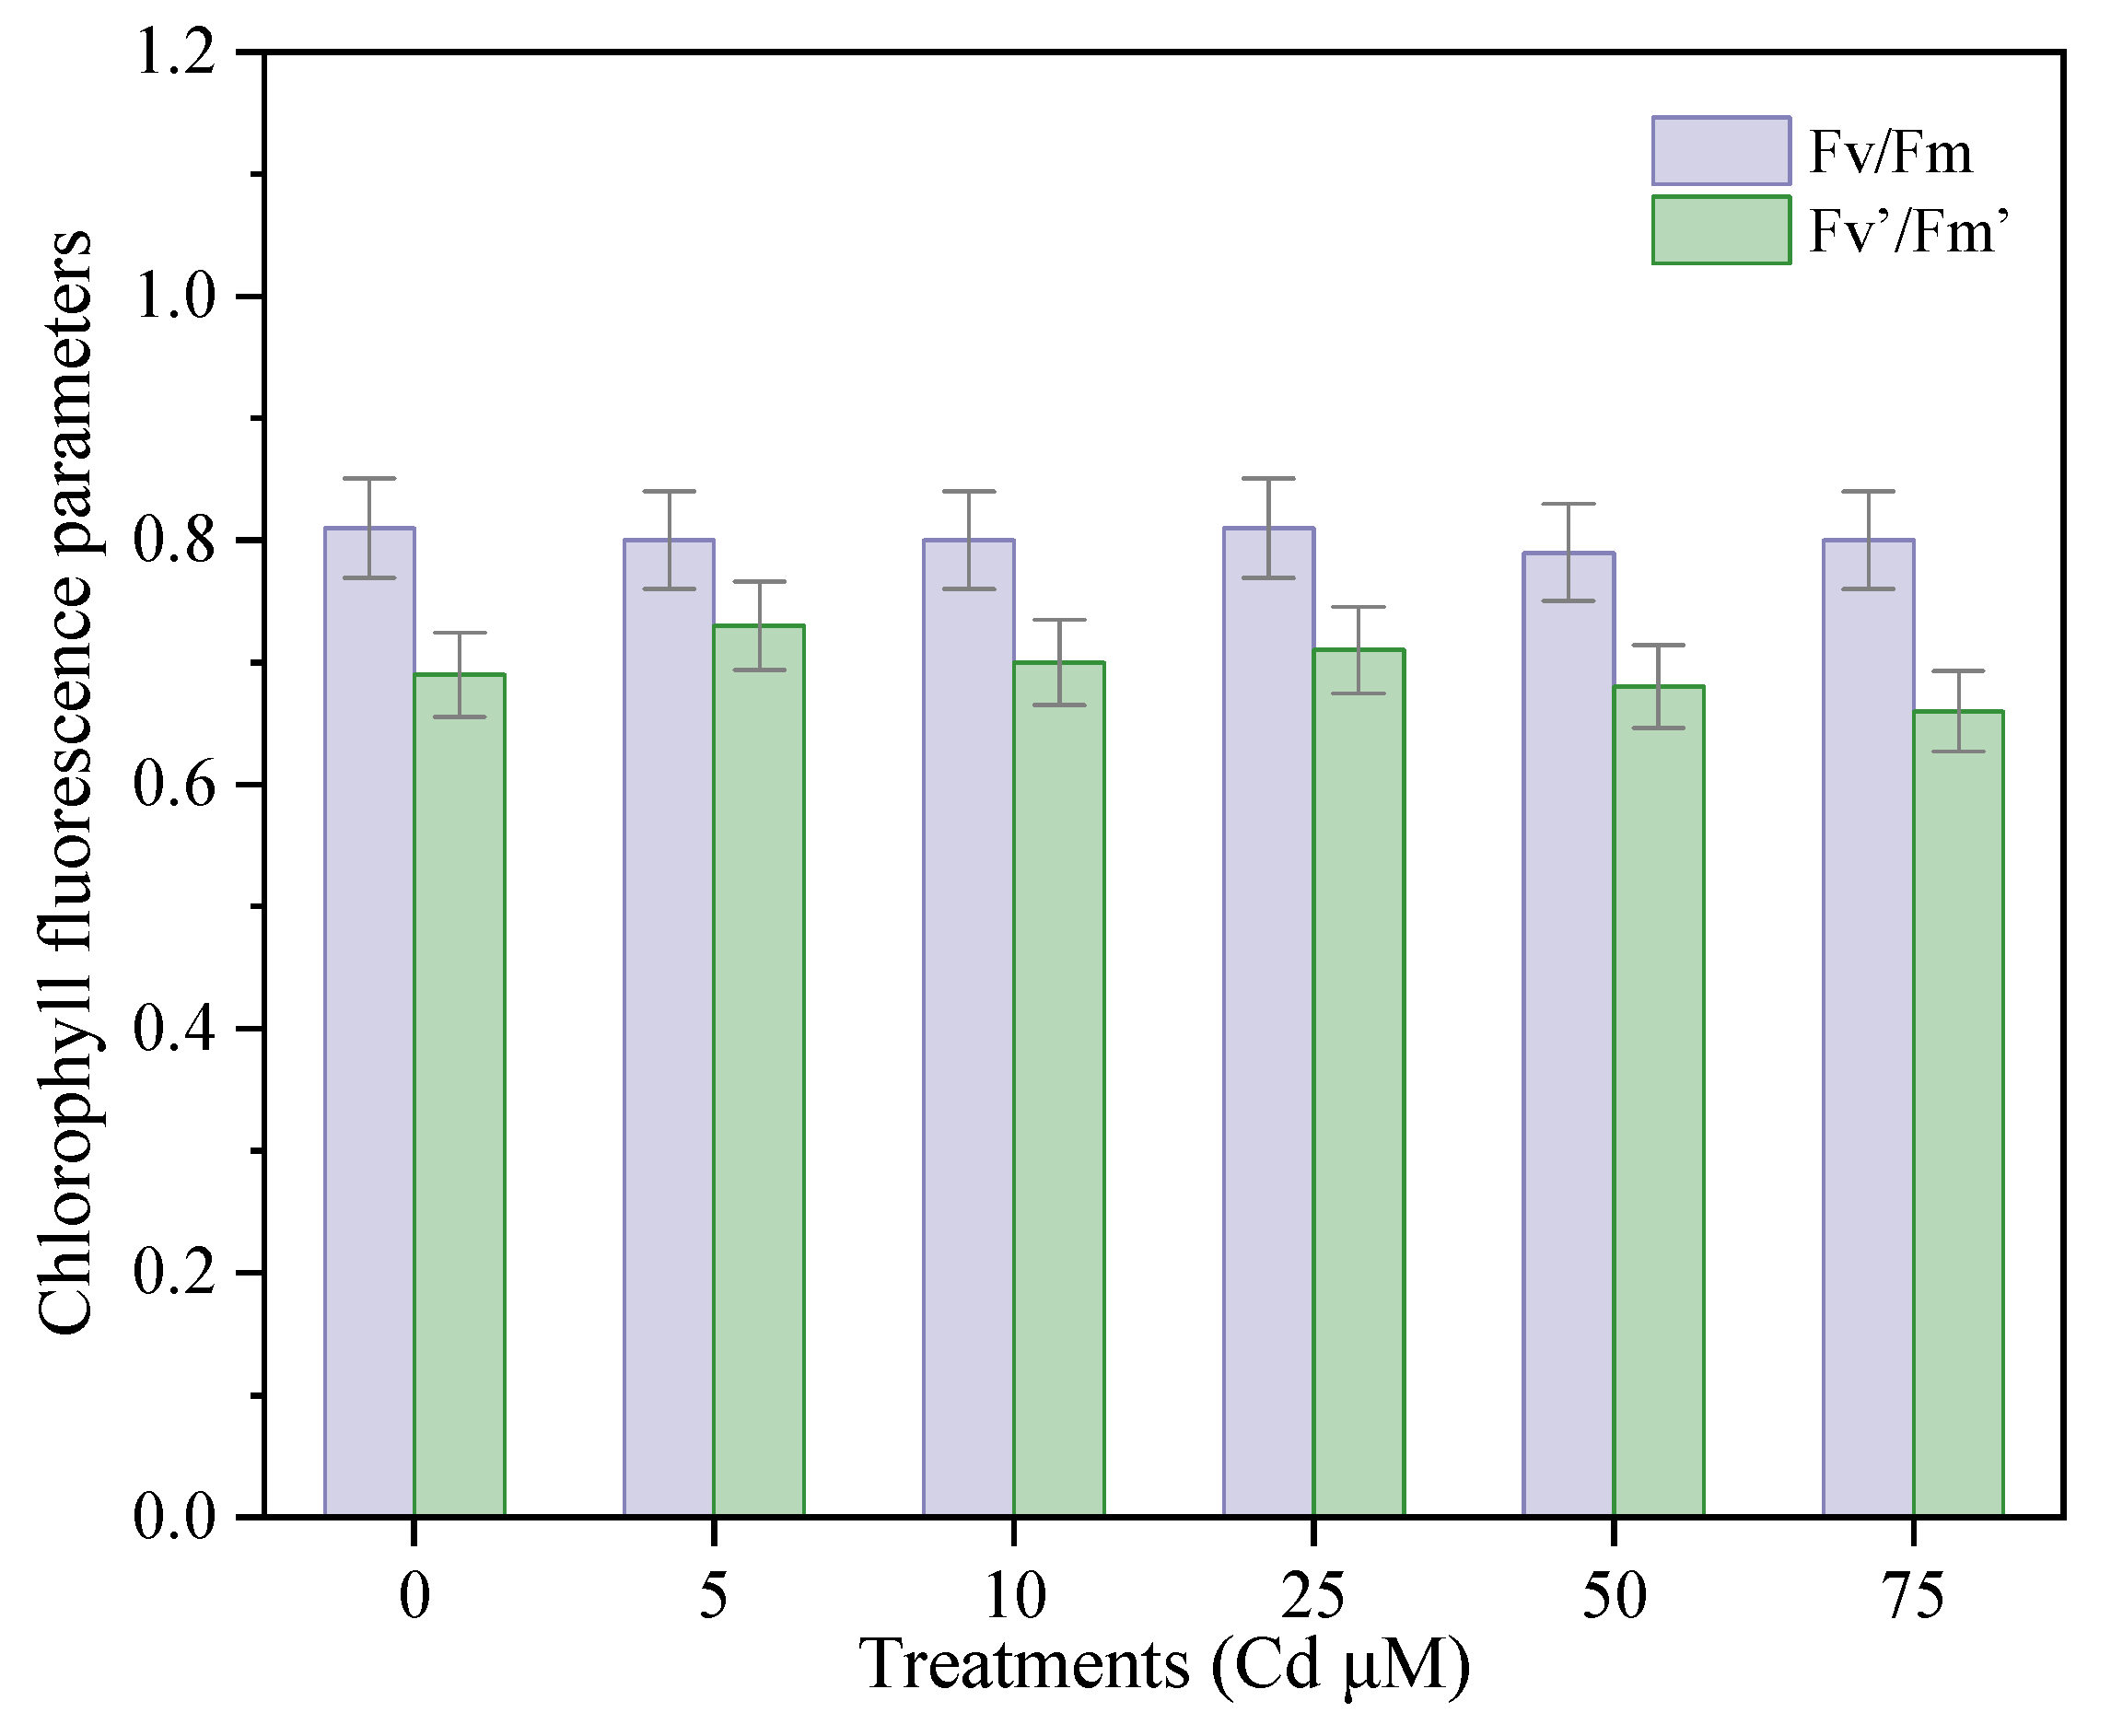
3.4.1. Effects of Cadmium on the Chlorophyll Fluorescence Parameters of P. divaricata

The Fv/Fm increased with the increase in Cd treatment concentrations (Figure 6). The maximum photochemical quantum yield (Fv/Fm) remained around 0.8 across all treatments. The Fm′, and Fv′ increased with increasing Cd concentration up to 10 μM Cd, while they decreased under 25–75 μM Cd, showing an inverted “U”-shaped trend under Cd treatment. Compared with the control, there were no significant differences in Fv′/Fm′ between each Cd treatment and the CK.
The ΦPSII of the plants in the Cd treatments ranged between 0.5 and 0.6, and there were no significant differences between each Cd treatment and the CK (Figure 7). No significant differences could be identified in the ETR between the Cd treatments and the CK. Similarly, no significant differences were observed in qP between the Cd treatments and CK, except for the 10 μM Cd concentration. The NPQ was also unaffected by Cd, showing no significant differences among the Cd treatments.

3.4.2. Effects of Cadmium on the Excited-State Energy Distribution and the Photoreaction Quantum Yield in P. divaricata

The P used for the photochemical reactions did not exhibit significant changes under different Cd treatments, and the p value remained between 0.53 and 0.59 (Figure 8). The heat dissipation D of the antenna pigment–protein complex showed no significant difference between Cd treatments and CK. However, the D values in the leaves under 75 and 5 μM Cd were 0.34 and 0.27, showing significant differences (p < 0.05). The excess excitation energy Ex absorbed by PSII was the lowest at 10 and 50 μM Cd, significantly different compared to CK. On the other hand, there was no difference in Ex between the 5 and 75 μM Cd treatments.

3.5. Effects of Cadmium on the Photosynthetic Parameters of P. divaricata

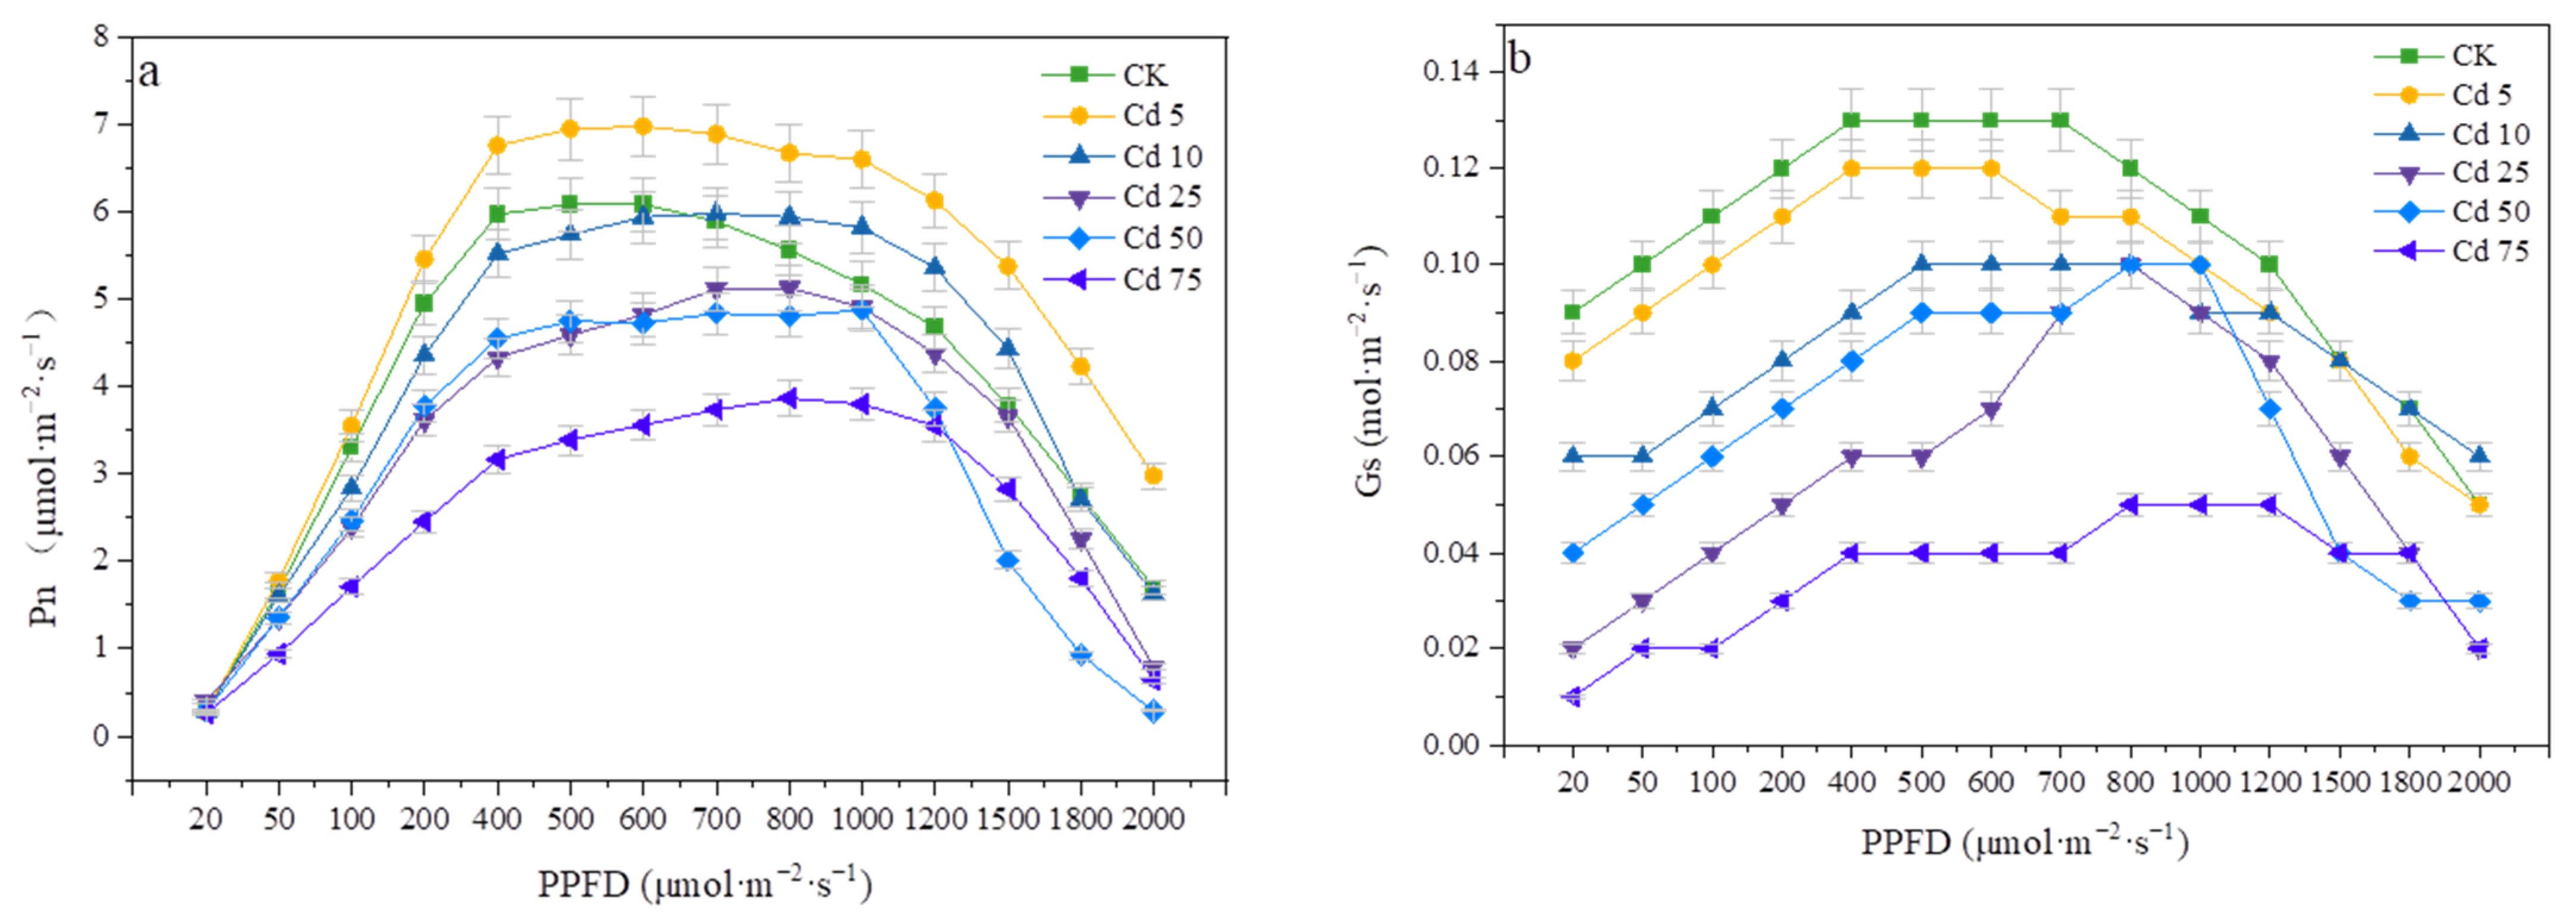
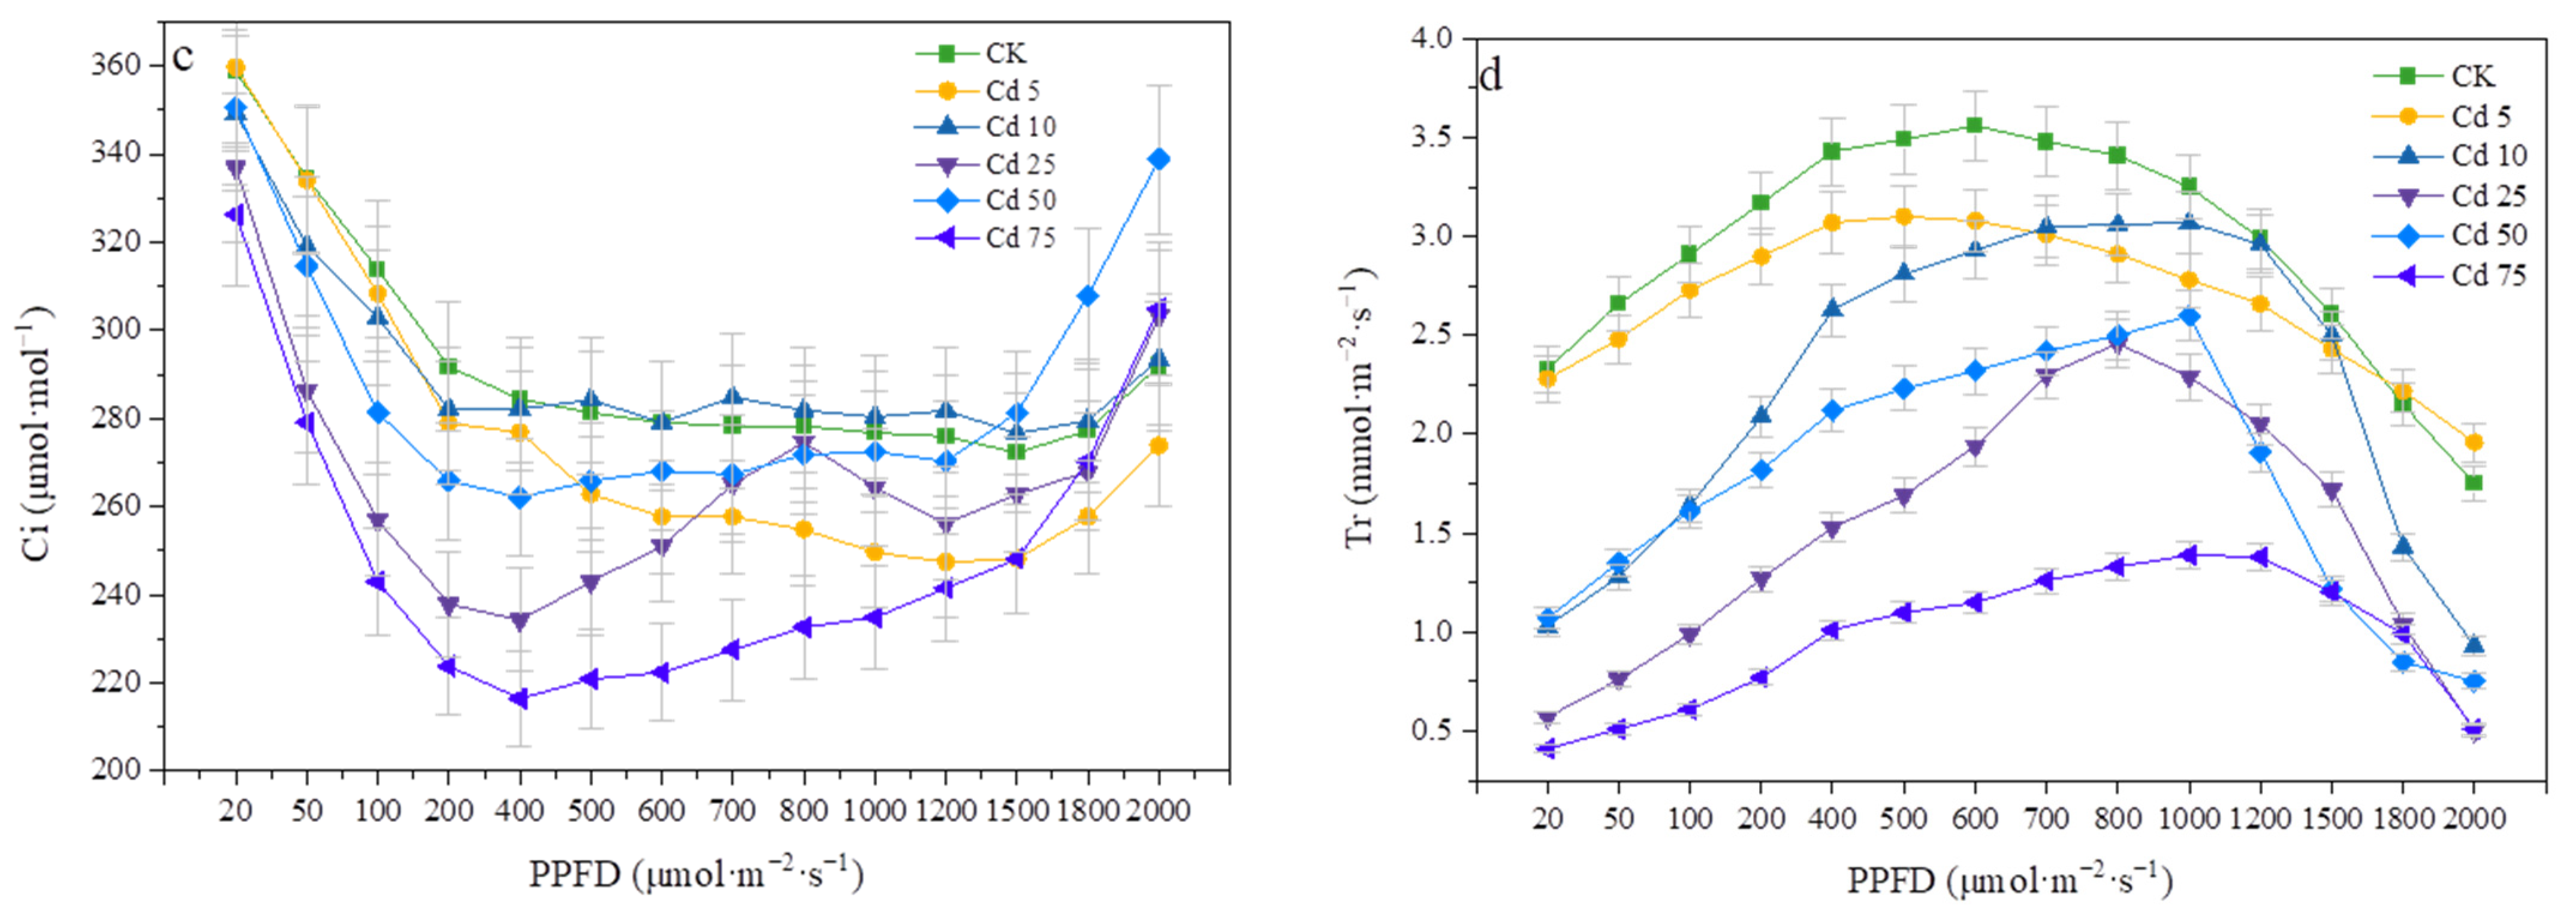
3.5.1. Effects of Cadmium on Photosynthetic Parameters and the Light Response Curve of P. divaricata

The net photosynthetic rate (Pn) of P. divaricata under different Cd treatments showed a consistent trend. It initially increased with the increase in photon flux density (PPFD) and gradually decreased after being suppressed by light (Figure 9). The maximum Pn value decreased with increased Cd concentration. The maximum Pn value was reached under 5 μM Cd at 7.00 μmol·m−2·s−1 and was significantly higher compared to that of CK at 6.07 μmol·m−2·s−1. The maximum Pn values under the 10, 25, 50, and 75 μM Cd treatments decreased significantly with the increase in Cd concentration, reaching 5.99, 5.13, 4.93, and 3.86 μmol·m−2·s−1, respectively. This indicates that the photosynthesis of P. divaricata was inhibited as the Cd concentration increased.
Similar to Pn, the stomatal conductance (gs) and transpiration rate (Tr) showed a trend of initially increasing and then decreasing with the increase in PPFD. There was an inhibition of gs and Tr at 800 μmol·m−2·s−1. The trend in the intercellular CO2 concentration (Ci) with increasing PPFD was opposite to that of AN, gs, and Tr, initially decreasing and then gradually increasing.

3.5.2. Analysis of the Factors Affected by Cadmium That Influence the Photosynthesis of P. divaricata

Using the fluorescence CO2 response curve, the corresponding limiting values of the photosynthetic limiting factors of P. divaricata were calculated under different Cd concentrations (Table 3). The 5 μM Cd concentration was set as the reference, and, as a result, its various limit values were all 0. Because diffusion limitation (DL = SL + MCL) accounted for the majority of the total limitation value (TL) (73–96%), both DL and TL increased with the Cd treatment concentration increase. Their values and trends were similar to that of Pn. There were no significant differences between 10 μM Cd and the CK. The biochemical limitation (BL) accounted for a small percentage of the total photosynthesis limitation, at only 4–27%. The mesophyll conductance limitation (MCL) accounted for most of the non-stomatal limitation factors (NL; NL = MCL + BL).

4. Discussion

4.1. Cadmium Resulted in Growth Promotion in Low Concentrations and Growth Inhibition in High Concentrations in P. divaricata

The root system is an important plant organ that absorbs mineral nutrients and water. Under abiotic stress conditions, the plant root system is the first organ to be under stress. Plant roots have certain developmental plasticity [15], and plants can alter the morphology and distribution of their roots to adapt to environmental stress [16]. Cadmium exerts a strong toxicity to plants, and its toxicity symptoms are first expressed in plant roots [17]. Root length is an indicator of the potential for plants to absorb nutrients or water [18], while root area is an indicator of root absorption efficiency [19]. The heavy metal absorption efficiency by plant roots directly affects their metal enrichment ability. The metal hyperaccumulator model plant T. caerulescens, when compared to non-metal hyperaccumulator plants such as T. arvense, has more lateral roots, denser and longer root hairs (>2.1 mm), and longer effective root length [20], which enhance the ability of T. caerulescens to absorb and utilize metals faster and more efficiently for normal growth. Similarly, compared with the CK, the root length and the root surface area of the metal hyperaccumulator Sedum alfredii significantly increased under Cd treatment (≥50 μM). However, Cd did not affect root diameter and volume [21]. The study showed that low to medium concentrations of Cd (5, 10, 25 μM) promoted root growth of P. divaricata. However, at higher concentrations (50 and 75 μM), the root system growth was inhibited to a certain extent, indicating that P. divaricata, as a metal hyperaccumulator plant, has strong adaptability to Cd.
The apparent growth status and biomass of P. divaricata also showed that Cd had “growth promotion in low concentrations and growth inhibition in high concentrations” effects in P. divaricata, consistent with previous experimental results [22]. In toxicology, the phenomenon where chemicals exhibit beneficial effects on organisms at low doses (such as stimulating growth and development) but exhibit negative effects at high doses is known as hormesis [23]. However, in general, the stimulus–response amplitude and the stimulus–dose range for a hormesis response are very small [24]. The maximum stimulus–response amplitude generally does not exceed twice that of the control and is usually only 30% to 60% higher than the control; the dose range of the stimulus is generally around one percent to one-fifth of the no-observed-adverse-effect level [25]. In this study, P. divaricata exhibited toxicity symptoms under the 50 μM Cd treatment; however, 5–25 μM Cd stimulated growth, which is higher than the normal stimulus dose range to induce hormesis. Moreover, the fresh and dry weights of the below-ground parts of P. divaricata treated with Cd were 2.2- and 2.6-fold higher than the control, respectively, and the dry weight of the above-ground part was 1.5-fold higher than the control. Moreover, the root length and root surface area under Cd treatment were up to 63% and 84% higher than the control, respectively. The maximum stimulus response amplitude in P. divaricata was also greater than what is commonly observed in hormesis responses. The effect of Cd resulting in growth promotion in low concentrations and growth inhibition in high concentration in P. divaricata is likely not a hormesis effect as described in toxicology, and an overcompensation mechanism cannot explain the growth-promoting effects of Cd in P. divaricata. This phenomenon observed in metal hyperaccumulator plants may be related to their long-term biological evolution in environments with extremely heavy metal concentrations. A certain concentration of heavy metals may have become a necessary condition for the normal growth of metal hyperaccumulator plants, and this hypothesis also needs to be further investigated in the future.

4.2. Effects of Cadmium on P. divaricata Photosynthesis

The photosynthetic organs of plants are very sensitive to heavy metal stress [26]. Cd can affect various processes of photosynthesis. Zhu et al. concluded that Cd affects photosynthesis in two different ways: (1) directly, by affecting the chloroplast structure, photosynthetic pigments, fluorescence parameters, electron transfer, and the Calvin cycle enzyme activities [27,28]; and (2) indirectly, through factors such as water status, stomatal opening and closing, and other factors that can affect intercellular and intracellular CO2 contents [29]. In this study, Pn was inhibited at high Cd levels, indicating that Cd did not directly affect the photosynthesis of P. divaricata. At the same time, deficiencies in different nutrient elements can affect chlorophyll and fluorescence parameters. In this study, the element content was similar to the leaf pigment content; therefore, Cd did not significantly reduce it. This also indicates that Cd did not affect photosynthesis indirectly through nutrient element deficiencies.
Stomatal density was positively correlated with stomatal conductance gs, net photosynthetic rate Pn, and water use efficiency [30]. Stomatal closure is an important factor controlling biological carbon fixation [31]. In this study, the plant water content was altered under 50–75 μM Cd. This significant decrease is directly related to stomatal conductance, mesophyll conductance, stomatal density, stomatal opening and closure, and leaf density. Tang et al. suggested that when SL increases, Ci decreases [32]. We can conclude that stomatal closure is the main reason for the photosynthetic rate decrease. In this study, we can conclude that stomatal limitations were one of the reasons for the reduction of the photosynthetic rate of P. divaricata. Our research results are consistent with those of many studies under different stress conditions [33]. However, certain studies have demonstrated that Cd could reduce AN, GS, and E in rice [34] and peanut [35] but could increase stomatal density and Ci. These differences may be related to the different plants studied. The mesophyll conductance (gm) is considered to play a more important role than stomatal conductance in leaf photosynthesis [36]. Many studies have shown that mesophyll conductance gm is relatively very low in high Cd concentration, which results in the chloroplast matrix CO2 concentration (Cc) being relatively lower compared to the intercellular CO2 (Ci) concentration, further confirming its limiting effect on photosynthesis [37]. In this study, gm decreased due to the reduction of mesophyll and chloroplast surfaces and changes in leaf morphology caused by Cd, consistent with the research results under water, salt, and Zn stress [38,39].

5. Conclusions

This study demonstrated that P. divaricata has strong Cd tolerance and Cd accumulation capacity. P. divaricata showed a phenomenon of “growth promotion in low concentrations and growth inhibition in high concentrations” under Cd treatment. At Cd concentrations below 25 μM, there was no Cd toxicity in plant growth and photosynthesis, but high concentrations of Cd inhibited plant growth and photosynthetic physiological processes. The above-ground and below-ground parts of P. divaricata differed in their response to Cd stress. In the above-ground tissues, membrane lipid peroxidation were mainly eliminated through the action of various antioxidants. At the same time, in the roots, mainly Cd stress tolerance was exerted by reduced enzyme production. Diffusion limitations (stomatal limitation and mesophyll conductance limitation) mainly contributed to the total photosynthetic limitations under Cd treatment. To conclude, 5–75 μM Cd did not directly affect the photosynthesis of P. divaricata. The inhibition of the photosynthetic efficiency of P. divaricata under high Cd concentrations was indirectly caused by the impact of Cd on leaf morphology.

Supplementary Materials

The following supporting information can be downloaded at: https://www.mdpi.com/article/10.3390/agronomy13102601/s1. Refs. [40,41,42,43] are listed in File S1.

Author Contributions

C.Z. and Z.H. wrote the paper; Q.L. and Y.F. conceived and designed the experiments; X.Z. and Y.L. analyzed the data; R.Y., A.Y., Z.H. and W.J. performed the experiments and collected the data. All authors have read and agreed to the published version of the manuscript.

Funding

This research was funded by the Baishanzu National Park scientific research project, grant number 2021ZDLY01; and the National Natural Science Foundation of China, grant number 42007182.

Institutional Review Board Statement

Not applicable.

Informed Consent Statement

Not applicable.

Data Availability Statement

The data that support the findings of this study are available from the authors upon reasonable request.

Conflicts of Interest

The authors declare no conflict of interest.

References

  1. Pouresmaieli, M.; Ataei, M.; Forouzandeh, P.; Azizollahi, P.; Mahmoudifard, M. Recent progress on sustainable phytoremediation of heavy metals from soil. J. Environ. Chem. Eng. 2022, 10, 108482. [Google Scholar] [CrossRef]
  2. Wang, L.; Yang, D.; Ma, F. How a functional soil animal-earthworm affect arbuscular mycorrhizae-assisted phytoremediation in metals contaminated soil? J. Hazard. Mater. 2022, 435, 128991. [Google Scholar] [CrossRef] [PubMed]
  3. Tavarez, M.; Macri, A.; Sankaran, R.P. Cadmium and zinc partitioning and accumulation during grain filling in two near isogenic lines of durum wheat. Plant Physiol. Biochem. 2015, 97, 461–469. [Google Scholar] [CrossRef] [PubMed]
  4. Sigfridsson, K.G.V.; Bernat, G.; Mamedov, F.; Styring, S. Molecular interference of Cd2+ with photosystem ii. Biochim. Biophys. Acta-Bioenerg. 2004, 1659, 19–31. [Google Scholar] [CrossRef]
  5. Bora, M.S.; Sarma, K.P. Anatomical and ultrastructural alterations in Ceratopteris pteridoides under cadmium stress: A mechanism of cadmium tolerance. Ecotoxicol. Environ. Saf. 2021, 218, 112285. [Google Scholar] [CrossRef]
  6. Waheed, A.; Haxim, Y.; Islam, W.; Ahmad, M.; Ali, S.; Wen, X. Impact of cadmium stress on growth and physio-biochemical attributes of Eruca sativa mill. Plants 2022, 11, 2981. [Google Scholar] [CrossRef]
  7. Sebastian, A.; Prasad, M.N.V. Iron and manganese-assisted cadmium tolerance in Oryza sativa L.: Lowering of rhizotoxicity next to functional photosynthesis. Planta 2015, 241, 1519–1528. [Google Scholar] [CrossRef]
  8. Chen, X.J.; Tao, H.F.; Wu, Y.Z.; Xu, X.M. Effects of cadmium on metabolism of photosynthetic pigment and photosynthetic system in Lactuca sativa L. revealed by physiological and proteomics analysis. Sci. Hortic. 2022, 305, 111371. [Google Scholar] [CrossRef]
  9. Abidli, A.; Huang, Y.; Rejeb, Z.B. Sustainable and efficient technologies for removal and recovery of toxic and valuable metals from wastewater: Recent progress, challenges, and future perspectives. Chemosphere 2022, 292, 133102. [Google Scholar]
  10. Raheem, A.; Prinsen, P.; Vuppaladadiyam, A.K. A review on sustainable microalgae based biofuel and bioenergy production: Recent developments. J. Clean. Prod. 2018, 181, 42–59. [Google Scholar]
  11. Seth, C.S. A review on mechanisms of plant tolerance and role of transgenic plants in environmental clean-up. Bot. Rev. 2012, 78, 32–62. [Google Scholar]
  12. Sharma, P.; Ngo, H.H.; Khanal, S.; Larroche, C.; Kim, S.H.; Pandey, A. Efficiency of transporter genes and proteins in hyperaccumulator plants for metals tolerance in wastewater treatment: Sustainable technique for metal detoxification. Environ. Technol. Innov. 2021, 23, 101725. [Google Scholar] [CrossRef]
  13. Sharma, A.; Kapoor, D.; Gautam, S.; Landi, M.; Kandhol, N.; Araniti, F. Heavy metal induced regulation of plant biology: Recent insights. Physiol. Plant. 2022, 174, e13688. [Google Scholar] [CrossRef] [PubMed]
  14. Broadhurst, C.L.; Bauchan, G.R.; Murphy, C.A.; Tang, Y.T.; Pooley, C.; Davis, A.P. Accumulation of zinc and cadmium and localization of zinc in Picris divaricata Vant. Environ. Exp. Bot. 2013, 87, 1–9. [Google Scholar] [CrossRef]
  15. Mohd-Radzman, N.A.; Drapek, C. Compartmentalisation: A strategy for optimising symbiosis and tradeoff management. Plant Cell Environ. 2023, 46, 2998–3011. [Google Scholar] [CrossRef]
  16. Ru, C.; Hu, X.; Chen, D.; Wang, W.; Song, T. Heat and drought priming induce tolerance to subsequent heat and drought stress by regulating leaf photosynthesis, root morphology, and antioxidant defense in maize seedlings. Environ. Exp. Bot. 2022, 202, 105010. [Google Scholar] [CrossRef]
  17. Li, Y.; Rahman, S.U.; Qiu, Z.; Shahzad, S.M.; Nawaz, M.F.; Huang, J. Toxic effects of cadmium on the physiological and biochemical attributes of plants, and phytoremediation strategies: A review. Environ. Pollut. 2023, 325, 121433. [Google Scholar]
  18. Liu, Y.; Wiren, N. Integration of nutrient and water availabilities via auxin into the root developmental program. Curr. Opin. Plant Biol. 2022, 65, 102117. [Google Scholar] [CrossRef]
  19. Zhu, S.; Luo, L.; Zhang, X.; Zhao, M.; Wang, X.; Zhang, J. Study on the relationship of root morphology and phosphorus absorption efficiency with phosphorus uptake capacity in 235 peanut (Arachis hypogaea L.) germplasms. Front. Environ. Sci. 2022, 10, 855815. [Google Scholar] [CrossRef]
  20. Abdullah, A.; Abdullah, A.Z.; Ahmed, M. A review on recent developments and progress in sustainable acrolein production through catalytic dehydration of bio-renewable glycerol. J. Clean. Prod. 2022, 341, 130876. [Google Scholar]
  21. Li, T.; Yang, X.; Lu, L.; Islam, E.; He, Z. Effects of zinc and cadmium interactions on root morphology and metal translocation in a hyperaccumulating species under hydroponic conditions. J. Hazard. Mater. 2009, 169, 734–741. [Google Scholar] [CrossRef]
  22. Liu, S.; Tang, Y.; Qiu, R.; Ying, R.; Ge, R.; Ji, X. Responses of carbonic anhydrase to cadmium in the zinc/cadmium hyperaccumulator Picris divaricata vant. Pedosphere 2016, 26, 709–716. [Google Scholar] [CrossRef]
  23. Xu, N.; Sun, Y.; Wang, Y.; Cui, Y.; Jiang, Y.; Zhang, C. Hormesis effects in tomato plant growth and photosynthesis due to acephate exposure based on physiology and transcriptomic analysis. Pest Manag. Sci. 2023, 79, 2029–2039. [Google Scholar] [CrossRef]
  24. Calabrese, E.J. Hormesis mediates acquired resilience: Using plant-derived chemicals to enhance health. Annu. Rev. Food Sci. Technol. 2021, 12, 355–381. [Google Scholar] [CrossRef] [PubMed]
  25. Ray, A.; Nayak, M.; Ghosh, A. A review on co-culturing of microalgae: A greener strategy towards sustainable biofuels production. Sci. Total Environ. 2022, 802, 149765. [Google Scholar] [PubMed]
  26. Zhou, W.; Xin, J.; Tian, R. Photosynthetic response, antioxidase activity, and cadmium uptake and translocation in monochoria korsakowii with cadmium exposure. Water Sci. Technol. 2022, 86, 2974–2986. [Google Scholar] [CrossRef] [PubMed]
  27. Zhu, T.T.; Li, L.Y.; Duan, Q.X.; Liu, X.L.; Chen, M. Progress in our understanding of plant responses to the stress of heavy metal cadmium. Plant Signal. Behav. 2021, 16, 1836884. [Google Scholar] [CrossRef]
  28. Parmar, P.; Kumari, N.; Sharma, V. Structural and functional alterations in photosynthetic apparatus of plants under cadmium stress. Bot. Stud. 2013, 54, 45. [Google Scholar] [CrossRef]
  29. She, W.; Cui, G.X.; Li, X.L.; Su, X.H.; Jie, Y.C.; Yang, R.F. Characterization of cadmium concentration and translocation among ramie cultivars as affected by zinc and iron deficiency. Acta Physiol. Plant. 2018, 40, 104. [Google Scholar] [CrossRef]
  30. Xu, Z.; Zhou, G. Responses of leaf stomatal density to water status and its relationship with photosynthesis in a grass. J. Exp. Bot. 2008, 59, 3317–3325. [Google Scholar] [CrossRef]
  31. Hoshika, Y.; Fares, S.; Pellegrini, E.; Conte, A.; Paoletti, E. Water use strategy affects avoidance of ozone stress by stomatal closure in mediterranean trees—A modelling analysis. Plant Cell Environ. 2020, 43, 611–623. [Google Scholar] [CrossRef] [PubMed]
  32. Ha, D.V.D.; Bundervoet, B.; Verstraete, W. A sustainable, carbon neutral methane oxidation by a partnership of methane oxidizing communities and microalgae. Water Res. 2011, 45, 2845–2854. [Google Scholar] [PubMed]
  33. Tang, L.; Ying, R.R.; Jiang, D.; Zeng, X.W.; Morel, J.L.; Tang, Y.T. Impaired leaf CO2 diffusion mediates cd-induced inhibition of photosynthesis in the Zn/Cd hyperaccumulator Picris divaricata. Plant Physiol. Biochem. 2013, 73, 70–76. [Google Scholar] [CrossRef]
  34. Lee, H.J.; Abdula, S.E.; Jang, D.W.; Park, S.H.; Yoon, U.H.; Jung, Y.J. Over expression of the glutamine synthetase gene modulates oxidative stress response in rice after exposure to cadmium stress. Plant Cell Rep. 2013, 32, 1521–1529. [Google Scholar] [CrossRef] [PubMed]
  35. Shi, G.R.; Cai, Q.S. Photosynthetic and anatomic responses of peanut leaves to cadmium stress. Photosynthetica 2008, 46, 627–630. [Google Scholar] [CrossRef]
  36. Niinemets, U.; Diaz-Espejo, A.; Flexas, J.; Galmes, J.; Warren, C.R. Role of mesophyll diffusion conductance in constraining potential photosynthetic productivity in the field. J. Exp. Bot. 2009, 60, 2249–2270. [Google Scholar]
  37. Okcu, G.D.; Eustance, E.; Lai, Y.J.S. Evaluation of co-culturing a diatom and a coccolithophore using different silicate concentrations. Sci. Total Environ. 2021, 769, 145217. [Google Scholar] [CrossRef]
  38. Bunce, J.A. Use of the response of photosynthesis to oxygen to estimate mesophyll conductance to carbon dioxide in water-stressed soybean leaves. Plant Cell Environ. 2009, 32, 875–881. [Google Scholar] [CrossRef]
  39. Sagardoy, R.; Vazquez, S.; Florez-Sarasa, I.D.; Albacete, A.; Ribas-Carbo, M.; Flexas, J. Stomatal and mesophyll conductances to CO2 are the main limitations to photosynthesis in sugar beet (Beta vulgaris L.) plants grown with excess zinc. New Phytol. 2010, 187, 145–158. [Google Scholar] [CrossRef]
  40. Harley, P.C.; Loreto, F.; Di Marco, G.; Sharkey, T.D. Theoretical Considerations when Estimating the Mesophyll Conductance to CO2 Flux by Analysis of the Response of Photosynthesis to CO2. Plant Physiol. 1992, 98, 1429–1436. [Google Scholar] [CrossRef]
  41. Bernacchi, C.J.; Portis, A.R.; Nakano, H.; Von Caemmerer, S.; Long, S.P. Temperature Response of Mesophyll Conductance. Implications for the Determination of Rubisco Enzyme Kinetics and for Limitations to Photosynthesis in Vivo. Plant Physiol. 2002, 130, 1992–1998. [Google Scholar] [CrossRef] [PubMed]
  42. Grassi, G.; Magnani, F. Stomatal, mesophyll conductance and biochemical limitations to photosynthesis as affected by drought and leaf ontogeny in ash and oak trees. Plant Cell Environ. 2005, 28, 834–849. [Google Scholar] [CrossRef]
  43. Farquhar, G.D.; Firth, P.M.; Wetselaar, R.; Weir, B. On the Gaseous Exchange of Ammonia between Leaves and the Environment: Determination of the Ammonia Compensation Point. Plant Physiol. 1980, 66, 710–714. [Google Scholar] [CrossRef] [PubMed]
Figure 1. Growth of P. divaricata in different levels of Cd. The (a, b, c, d, e, and f) correspond to the 0, 1, 5, 10, 25, 50, and 75 μM Cd treatments, respectively.
Agronomy 13 02601 g001
Figure 2. Biomass of P. divaricata under different Cd concentrations.
Agronomy 13 02601 g002
Figure 3. The effect of different cadmium concentrations on the leaf pigment content of P. divaricata. Significant differences (p < 0.05) among different Cd treatments are indicated with different lower-case letters.
Agronomy 13 02601 g003
Figure 4. Scanning electron microscopy micrographs of the upper and lower epidermis and stomata of control and 75 µM Cd treated P. divaricata (magnification ×250 and 3000). (a) The upper epidermis of control (magnification ×250); (b) the lower epidermis of control (magnification ×250); (c) the stomata in the lower epidermis of control (magnification ×250); (d) the upper epidermis of 75 µM Cd (magnification ×250); (e) the lower epidermis of 75 µM Cd (magnification ×3000); (f) stomata in lower epidermis of 75 µM Cd (magnification ×3000). White arrows, stoma. Bars (a,b,d,e) = 100 µm.
Agronomy 13 02601 g004aAgronomy 13 02601 g004b
Figure 5. The thickness of mesophyll cross-sections of leaves in control and Cd-treated P. divaricata plants. The n is the number of samples.
Agronomy 13 02601 g005
Figure 6. Chlorophyll fluorescence parameters (Fv/Fm, Fv′/Fm′, ΦPSII) in P. divaricata under different Cd concentrations.
Agronomy 13 02601 g006
Figure 7. Effects of cadmium on fluorescence parameters (ΦPSII, ETR, qP, NPQ) of P. divaricata under different Cd concentrations.
Agronomy 13 02601 g007
Figure 8. Energy distribution of PSII in P. divaricata under different Cd concentrations. Significant differences (p < 0.05) among different Cd treatments are indicated with different lower-case letters.
Agronomy 13 02601 g008
Figure 9. Gas exchange parameters of P. divaricata leaves under different Cd treatments and different photosynthetic photon flux densities (PPFD). (a, b, c, and d) correspond to the net photosynthetic rate (Pn), stomatal conductance (gs), intercellular CO2 concentration (Ci), and transpiration rate (Tr), respectively.
Agronomy 13 02601 g009aAgronomy 13 02601 g009b
Table 1. Root system growth of P. divaricata in different Cd treatments. Values represent the mean and the variance of three independent replicates. Different letters in the same column indicate values which significantly differ according to one-way ANOVA at p < 0.05.
Treatment (Cd μM)Root Length (cm)Average Root Diameter (mm)Total Surface Area of Root System (cm2)Total Volume of Root System (cm3)
01681.8 ± 154.3 b0.30 ± 0.03 a156.46 ± 5.80 b1.17 ± 0.17 c
52555.4 ± 356.8 a0.31 ± 0.02 a252.92 ± 52.91 a2.00 ± 0.56 ab
102429.2 ± 139.2 a0.35 ± 0.02 a262.90 ± 23.20 a2.27 ± 0.33 a
252741.0 ± 196.8 a0.34 ± 0.01 a288.28 ± 10.03 a2.43 ± 0.07 a
501501.3 ± 385.8 b0.33 ± 0.00 a155.79 ± 38.02 b1.27 ± 0.30 bc
751678.0 ± 473.5 b0.31 ± 0.03 a165.18 ± 57.93 b1.30 ± 0.55 bc
Table 2. Metals contents in P. divaricata. Values represent the mean and the variance of three independent replicates. Different letters in the same column indicate values which significantly differ according to one-way ANOVA at p < 0.05.
Treatment (Cd μM)Fe (mg kg−1)Mg (g kg−1)Mn (mg kg−1)Ca (g kg−1)Cu (mg kg−1)Zn (mg kg−1)
0227.4 ± 52.8 a6.58 ± 0.47 a234.5 ± 123.1 a22.9 ± 2.59 a3.11 ± 0.50 a37.2 ± 10.2 a
5144.1 ± 13.0 b6.57 ± 0.62 a307.7 ± 164.9 a22.0 ± 1.83 a2.09 ± 1.62 a30.8 ± 2.57 a
10153.9 ± 45.8 b5.77 ± 0.44 a222.1 ± 45.6 a20.1 ± 0.33 a3.27 ± 0.15 a35.0 ± 7.04 a
25164.7 ± 14.6 ab5.28 ± 1.12 a259.1 ± 76.1 a17.8 ± 0.73 a2.95 ± 1.14 a22.9 ± 8.50 a
50173.8 ± 40.6 ab5.06 ± 0.26 a449.3 ± 174.1 a20.2 ± 4.62 a4.62 ± 0.85 a22.1 ± 14.3 a
75201.8 ± 21.8 ab5.81 ± 1.47 a281.7 ± 132.1 a20.4 ± 5.66 a4.40 ± 2.57 a26.7 ± 11.4 a
Table 3. Photosynthesis limitation parameters (%) of P. divaricata under different Cd concentrations.
Treatment (Cd μM)SLMCLBLNLDLTL
09.0 ± 1.3 c4.2 ± 3.3 c5.1 ± 1.2 a9.7 ± 2.7 c13.6 ± 2.3 c18.7 ± 2.4 c
1012.1 ± 0.3 c2.6 ± 0.4 c0.6 ± 0.0 c3.1 ± 0.4 c14.7 ± 0.1 c15.3 ± 0.2 c
2517.0 ± 1.9 b11.7 ± 2.1 b0.5 ± 0.2 c12.2 ± 2.0 c28.7 ± 1.8 b39.2 ± 2.0 b
5023.0 ± 1.5 b18.5 ± 3.0 b2.9 ± 0.8 b21.4 ± 4.0 b41.5 ± 3.3 b44.4 ± 3.7 b
7528.8 ± 2.0 a36.8 ± 7.2 a3.1 ± 0.4 b40.0 ± 7.2 a65.7 ± 6.2 a68.8 ± 6.3 a
The 5 μM Cd treatment was used as a reference, for which all limitations were set to 0. SL, stomatal limitations; MCL, mesophyll conductance limitations; BL, biochemical limitations; NL, non-stomatal limitations; DL, diffusional limitations; TL, total limitations. Data are the mean ± SE of three replicates. Different letters in the same column indicate values that are significantly different according to one-way ANOVA at p < 0.05.
Disclaimer/Publisher’s Note: The statements, opinions and data contained in all publications are solely those of the individual author(s) and contributor(s) and not of MDPI and/or the editor(s). MDPI and/or the editor(s) disclaim responsibility for any injury to people or property resulting from any ideas, methods, instructions or products referred to in the content.

