Article

Comparative Analysis of Phospholipase D (PLD) Gene Family in Camelina sativa and Brassica napus and Its Responses in Camelina Seedlings under Salt Stress

1
Faculty of Agriculture, Shahrood University of Technology, Shahrood 3619995161, Iran
2
Department of Horticultural Sciences, Faculty of Agriculture, University of Kurdistan, Sanandaj 6617715175, Iran
3
Minab Higher Education Center, University of Hormozgan, Bandar Abbas 7916193145, Iran
*
Author to whom correspondence should be addressed.
Agronomy 2023, 13(10), 2616; https://doi.org/10.3390/agronomy13102616
Submission received: 11 September 2023 / Revised: 7 October 2023 / Accepted: 12 October 2023 / Published: 14 October 2023
(This article belongs to the Special Issue Advances in the Industrial Crops)

Abstract

:
Phospholipases are among the important elements involved in lipid-dependent cell signaling that lead to the induction of downstream pathways. In the current study, phospholipases D (PLDs) gene family was characterized and compared in two important oilseed crops, Brassica napus and Camelina sativa. The results revealed that PLD has 33 members in Camelina sativa (CsPLD) and 41 members in Brassica napus (BnPLD). All studied PLDs showed a negative GRAVY value, indicating that PLDs are probably hydrophilic proteins. Phylogenetic analysis classified PLDs into five main subfamilies, including gamma, delta, beta, alpha, and zeta. According to evolution analysis, a different evolution process was observed between CsPLD and BnPLD. In addition, the results disclosed that most of the PLD genes have been segmentally duplicated under purifying selection. Cis-regulatory elements related to ABA and auxin responsiveness were found more in the upstream region of CsPLDs, while elements linked with MeJA responsiveness were observed more in the promoter region of BnPLDs. Analysis of the expression data showed that PLD alpha genes have a wide expression in most tissues. Quantitative expression analysis (qPCR) of CsPLD genes under salt stress, 200 mM of NaCl, was conducted in different time series. The results revealed that the CsPLD genes are involved in the response to salinity stress and their expression levels enhance with increasing salinity stress period. The outcomes of this research will be useful for future molecular works related to lipid signaling in oilseed plants.

1. Introduction

Plants exploit lipid signaling to regulate a variety of cellular processes in response to external stimuli [1]. In this regard, phospholipids, which are the main components of biological membranes, can act as intracellular signaling molecules [2,3,4]. As part of maintaining membrane stability and homeostasis, as well as biotic and abiotic stress alleviation mechanisms, these molecules are released directly and transiently by the activity of phospholipases or lipid kinases [5,6,7]. Mediating different types of catalytic reactions, plant phospholipases are divided into A, C, and D classes. In both prokaryotes and eukaryotes, phospholipases D (PLDs) are the main enzymes that break the terminal phosphodiester bonds of phospholipids in plasmalemma and organellar membranes, yielding phosphatidic acid (PA) and free soluble head groups (e.g., ethanolamine or choline) [8,9]. It has been shown that PLDs can modulate various process in plants at the cell scale, including programmed cell death [10], interaction with cytoskeleton [11], pollen tube growth [12], vesicular transport [13], and stomata closure [14], or at the whole plant level, including seed germination [15], wounding [16], and hair root growth and patterning [17]. There are three PLD subfamilies including SP-PLD, PX/PH-PLD, and C2-PLD, in which the SP-PLD subfamily is classified into α, β, γ, δ, ε, and ζ classes on the basis of their physicochemical catalytic and structural features and sequence homology [2,8]. While each PLD appears to have a different physiological function, all classes have a phospholipid-binding region at their N-terminus and two highly conserved C-terminus domains that are catalytically involved in lipase activity through the interactions of two catalytic HxKxxxxD (HKD) motifs [18,19].
The PLD enzyme is found in both plant and animal cells, and its activity is regulated by various signaling pathways and cellular factors. Several PLD cDNAs have been cloned from higher plant species since the cloning of the first eukaryotic PLD cDNA from castor bean (Ricinus sativus L.) [20]. The members of the PLD gene family can now be studied and discussed at the genomic level in many plant species thanks to advances in genome sequencing technologies. Du et al. [21] studied the phospholipase D gene family in three Rosaceae species and identified three pairs of segmental PLD gene duplications in Malus × domestica and Prunus mume and four pairs in Fragaria vesca L. Out of 40 identified PLD genes, 33 genes represented conserved synteny and the authors suggested that PLD genes in the Rosacea family could have a common ancestor and purifying selection could be the primary driving force behind PLD gene evolution. Using genome-wide analysis, 17 PLDs were discovered in rice across four chromosomes. In addition to the C2-PLDs and PXPH-PLDs, the SP-PLDs have also been identified as a novel PLD subfamily in rice (which contains a signal peptide sequence rather than the PXPH or C2 domains) based on the protein domain structural analyses [15]. Liu et al. [19] identified 18 and 11 PLD members in grape and poplar, respectively. PLD genes were clustered into φ, ζ, ε, δ, β/γ, and α subgroups, where they have evolved from four preliminary ancestors as a result of gene duplications. They also found that most of the PLD gene family members in grape (10 out of 11) and poplar (13 out of 17) showed closer phylogenetically relationship together than with rice and Arabidopsis PLD gene members. Genome-wide in silico analysis of PLD genes from Corchorus olitorius and C. capsularis resulted in the identification of 20 different motifs where β1 and γ1, and all members of δ1 classes in both Corchorus species, represented the highest number of motifs [1]. Tissue-specific analysis of δ2, α2, and β1 subclasses revealed their roles involved in drought and salinity stresses. Genome-wide analysis of PLD gene family members in tree cotton (Gossypium arboretum) revealed 19 non-redundant genes with similar exon–intron architecture and motifs with highly conserved structures. There are 59 PLD gene members in alfalfa (Medicago sativa L.), grouped into ε, δ, γ, β, α, and ζ subclasses [3]. It has been demonstrated that cis-acting elements are different in PLD members within common subfamilies, but they represent similar physicochemical characteristics, sequence features, and domains. The PLD protein family has, however, not been bioinformatically analyzed in important crops within the Brassicaceae family, including rapeseed (Barssica rapa L.) [22] and Camelina (Camelina sativa L.), and to date, no genome-wide comparative analysis of the PLD gene family has been carried out in these oilseed crops. In the present study, we identified and compared PLD gene members from the whole genome of Brassica rapa and Camelina sativa. The available bioinformatics tools were applied to analyze various characteristics of PLD genes and their expression levels were analyzed in response to salinity stress. Our findings provide a better understanding of the evolution and structure of the sequence and function of PLDs, which will be useful in future functional studies.

2. Materials and Methods

2.1. Identification and Characterization of PLD Family Members

In order to identify the members of the PLD gene family, the known sequence of these genes in Arabidopsis was run as queries against the genome of Brassica napus and Camelina sativa, using BLASTp tool of Ensembl Plants database (accessed on 4 August 2023) [23]. The peptide sequences of the PLDs in Brassica napus (BnPLDs) and Camelina sativa (CsPLDs) were checked by CDD database (accessed on 4 August 2023) [24] for confirmation. In addition, PLDs were identified in Glycine max and Oryza sativa, similar to the previous method. In this study, the physicochemical properties, including the number of amino acids, isoelectric point (pI), grand average of hydropathicity (GRAVY), molecular weight (MW), and instability index, were enumerated for the candidate PLDs using the ProtParam tools (accessed on 4 August 2023) [25].

2.2. Phylogenetic Analysis of PLDs and Prediction of Phosphorylation Sites

To investigate the evolution of the PLD gene family, peptide sequences of CsPLDs and BnPLDs with the PLD characterized in Oryza sativa, Glycine max, and Arabidopsis thaliana were aligned using an online tool, the Clustal Omega (accessed on 5 August 2023) [26]. In the next step, the aligned sequences were introduced to IQ-TREE web server (V 2.2.2.6; accessed on 5 August 2023) [27] to construct a phylogeny tree based on the maximum likelihood (ML) method with 1000 bootstrap. Besides, the JTT+G4 was selected as the best-fit model, using jModelTest 2 [28]. Finally, the phylogeny tree of PLDs was visualized by Interactive Tree Of Life (iTOL) v6.3 (accessed on 7 August 2023) [29]. In addition, the strong potential phosphorylation sites (potential value ≥ 0.90) of CsPLDs and BnPLDs were identified using the NetPhos 3.1 server (accessed on 8 August 2023) [30].

2.3. Duplication Analysis of CsPLD and BnPLD Genes

In the present study, the coding sequence (CDS) of pairs of CsPLD and BnPLD genes were aligned, and pairs with an identity ≥0.85 were selected as duplicated genes [31,32]. In addition, the synonymous (Ks) and non-synonymous (Ka) indexes were calculated for duplicated pairs using the TBtools software v1.132 [33]. In addition, the time of divergence for each duplicated pair was estimated using the following equation: T = (Ks/2λ) × 10−6. (λ = 6.5 × 10⁻⁹).

2.4. Conserved Motifs and Promoter Analysis

To recognize the conserved protein motifs, CsPLDs and BnPLDs were analyzed using the MEME (version 5.0.5) (accessed on 8 August 2023) [34], based on the default settings. Moreover, an upstream region (1500 bp) of the start codon in each CsPLD and BnPLD was screened as a promoter site to identify the putative cis-regulatory elements using the PlantCARE database (accessed on 8 August 2023) [35].

2.5. Interaction Networks and Structure Analysis of CsPLD and BnPLD

In the current study, the interaction networks for CsPLDs and BnPLDs were constructed using the STRING database (v11.5) (accessed on 10 August 2023) [36]. To better understand direct and indirect interactions, the first and second shell were adjusted to ≤20 and ≤5, respectively. Finally, the interaction networks were visualized using Cytoscape v3.8.2 [37]. In order to draw the three-dimensional structure, five CsPLDs and BnPLD proteins (one candidate from each subfamily) were selected and their structures were predicted using the Phyre2 server (accessed on 10 August 2023) [38].

2.6. Expression Analysis of CsPLD and BnPLD in Different Tissues

In the current study, the available transcriptome data (RNA-seq information) related to different stages of growth and development for B. napus and C. sativa were used to screen the expression profile of the BnPLD and CsPLD genes. The Camelina eFP Browser (https://bar.utoronto.ca/efp_camelina/cgi-bin/efpWeb.cgi) (accessed on 11 August 2023), which included SRP038024, SRS558774, SRS559344, and SRS566487 datasets, was used for CsPLD genes and the BrassicaEDB (https://brassica.biodb.org/) (accessed on 13 August 2023) was used for BnPLD genes to extract expression data in terms of a FPKM (fragments per kilobase of exon model per million mapped reads) value. Finally, data were illustrated in heatmaps based on the log2-transformed method using the TBtools software v1.132.

2.7. Plant Materials and Treatment

In this study, expression patterns of candidate CsPLD genes were evaluated in Camelina seedlings under salt stress. In the first step, the sterilized seeds were planted in pots containing peat moss and perlite (2:1) and were kept under a temperature of 24 ± 2 °C and 16 h of light, and pots were irrigated every three days. Then, after five weeks, seedlings were irrigated with a salt solution (200 mM of NaCl), and this was repeated after 24 h. Finally, the leaves were harvested at different time points (6, 24, and 72 h after salinity treatment). The experiment was carried out in three biological replicates.

2.8. Expression Analysis Using qPCR

The total RNA samples from the leaves were extracted by an RNX kit (Sinaclon, Tehran, Iran) according to manufacturer protocols, and the cDNA was produced by a reverse transcriptase kit (Roche, Mannheim, Germany) based on manufacturer protocols. In this study, six CsPLD genes were selected for qPCR analysis based on phylogenetic analysis, one member from the delta, beta, zeta, and gamma subfamily and two members from the alpha subfamily. In addition, actin-2 gene (Csa15g026420) was selected as a housekeeping gene for normalizing the raw expression data. The Primer3 online tool (version 4.1.0) (accessed on 14 August 2023) [39] was applied to design the specific primers of the candidate CsPLDs (Table S1). Maxima SYBR Green/ROX qPCR Master Mix kit (Thermo Fisher, Illkirch-Graffenstaden, France) was used to analyze the expression levels of the CsPLDs by the ABI Step One, according to manufacturer protocols. Finally, the raw data were analyzed by the delta-delta Ct method [40].

3. Results

3.1. Physiochemical Properties of PLDs

In this study, 33 CsPLDs and 41 BnPLDs were recognized in the genome of Camelina sativa and Brassica napus, respectively (Table S2). Diverse physiochemical properties were observed between PLDs compared in five plant species (Table 1). For instance, 33% of CsPLDs were predicted to be stable proteins, while 61% of BnPLDs were stable. All studied PLDs showed a negative GRAVY value, indicating that PLDs are probably hydrophilic proteins. Regarding the exon number, a lower exon number was recognized in alpha subfamily members.

3.2. Phylogenetic Analysis and Prediction of Post-Translational Modifications of PLD Gene Family

Phylogenetic analysis of the PLD gene family in five plant species, including C. sativa, Arabidopsis, B. napus, O. sativa, and G. max, could separate the five PLD subfamilies, including gamma, delta, beta, alpha, and zeta (Figure 1). According to phylogeny, subfamilies gamma, delta, and beta are more closely related. In addition, most of the PLDs were in the alpha subfamily group. CsPLDs showed closer relationships to Arabidopsis PLDs than oilseed crops. The potential phosphorylation modifications, as an important post-translational modification, were predicted in PLD proteins (Figure 1). Alpha subfamily members showed fewer potential sites than other subfamilies. It seems that alpha proteins are less influenced by post-translational modifications.

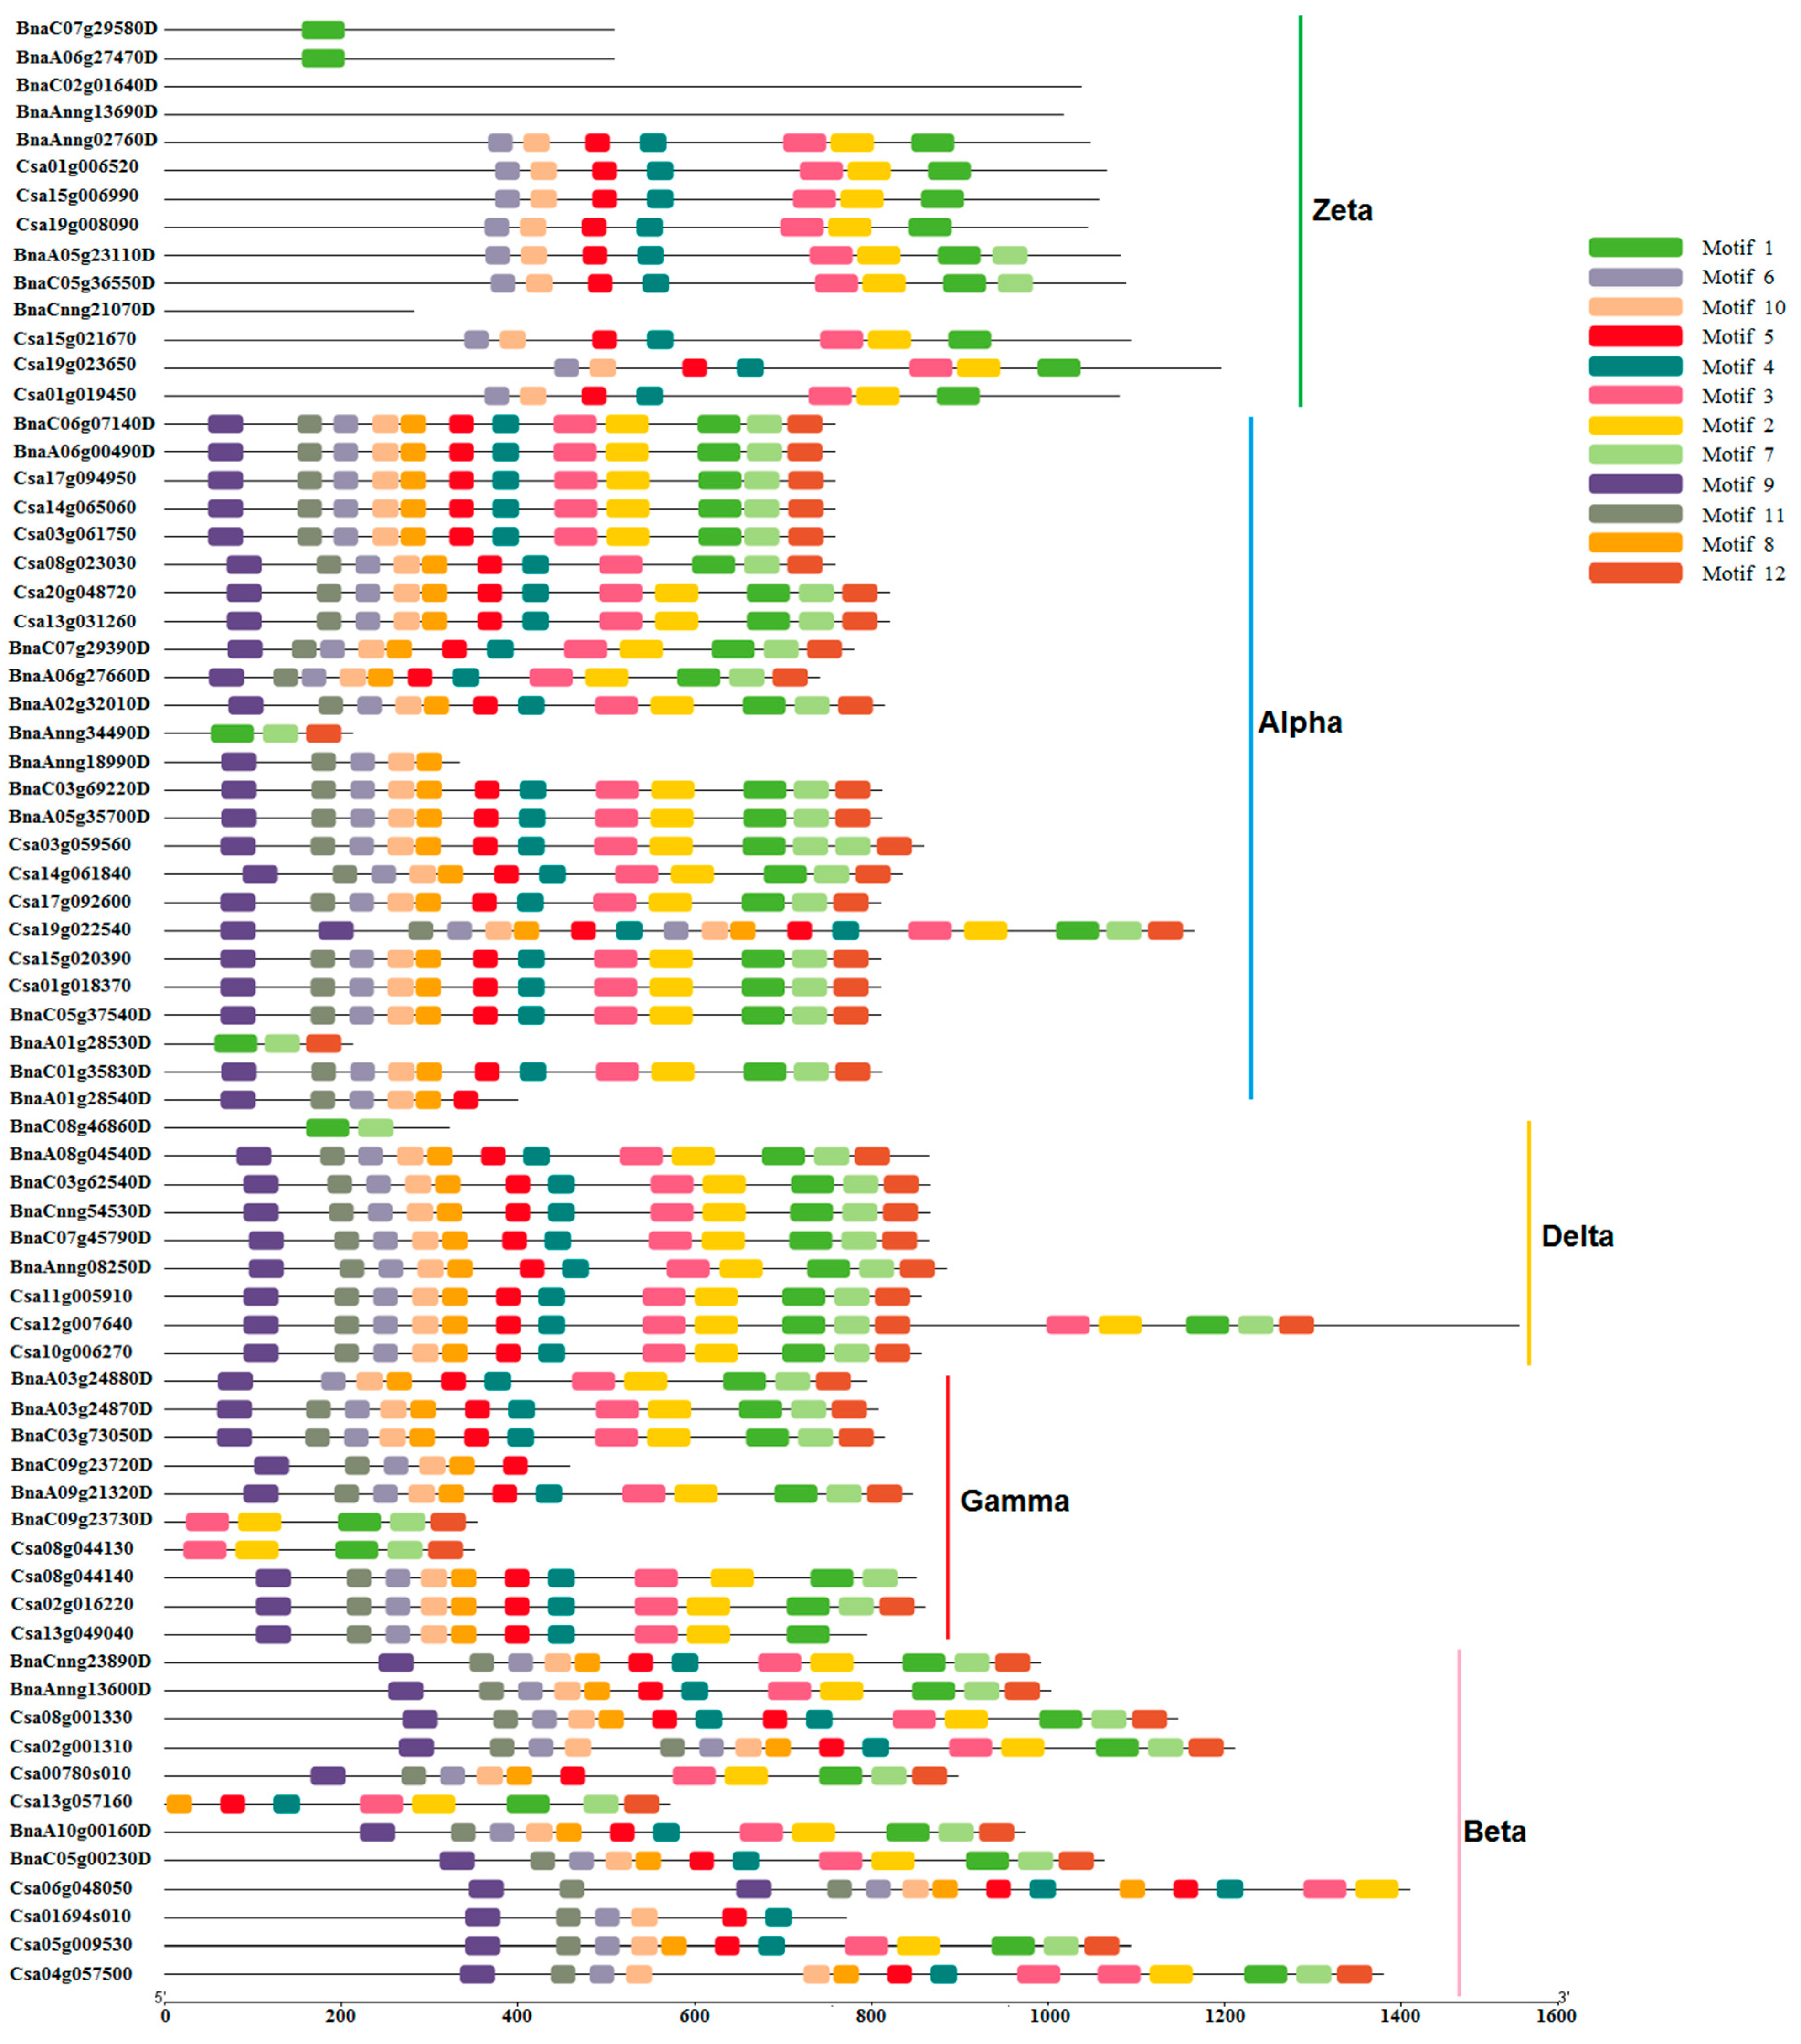
3.3. Conserved Motifs in PLDs

In this study investigating the structure of PLDs, the conserved motifs of the CsPLDs and BnPLDs were identified. A total of 12 motifs were detected and motifs 1, 6, 10, 5, 4, 3, and 2 were observed in almost all of the PLDs (Figure 2). However, the members of the zeta subfamily were different from other PLD subfamilies based on the distribution of conserved motifs. For instance, motifs 8, 9, 11, and 12 were observed in subfamilies alpha, beta, delta, and gamma. Structural differences between PLDs reveal the functional specificity between different subfamilies. On the other hand, the PLD members that have the same pattern of motif distribution probably had a similar evolutionary process and have a common ancestor.

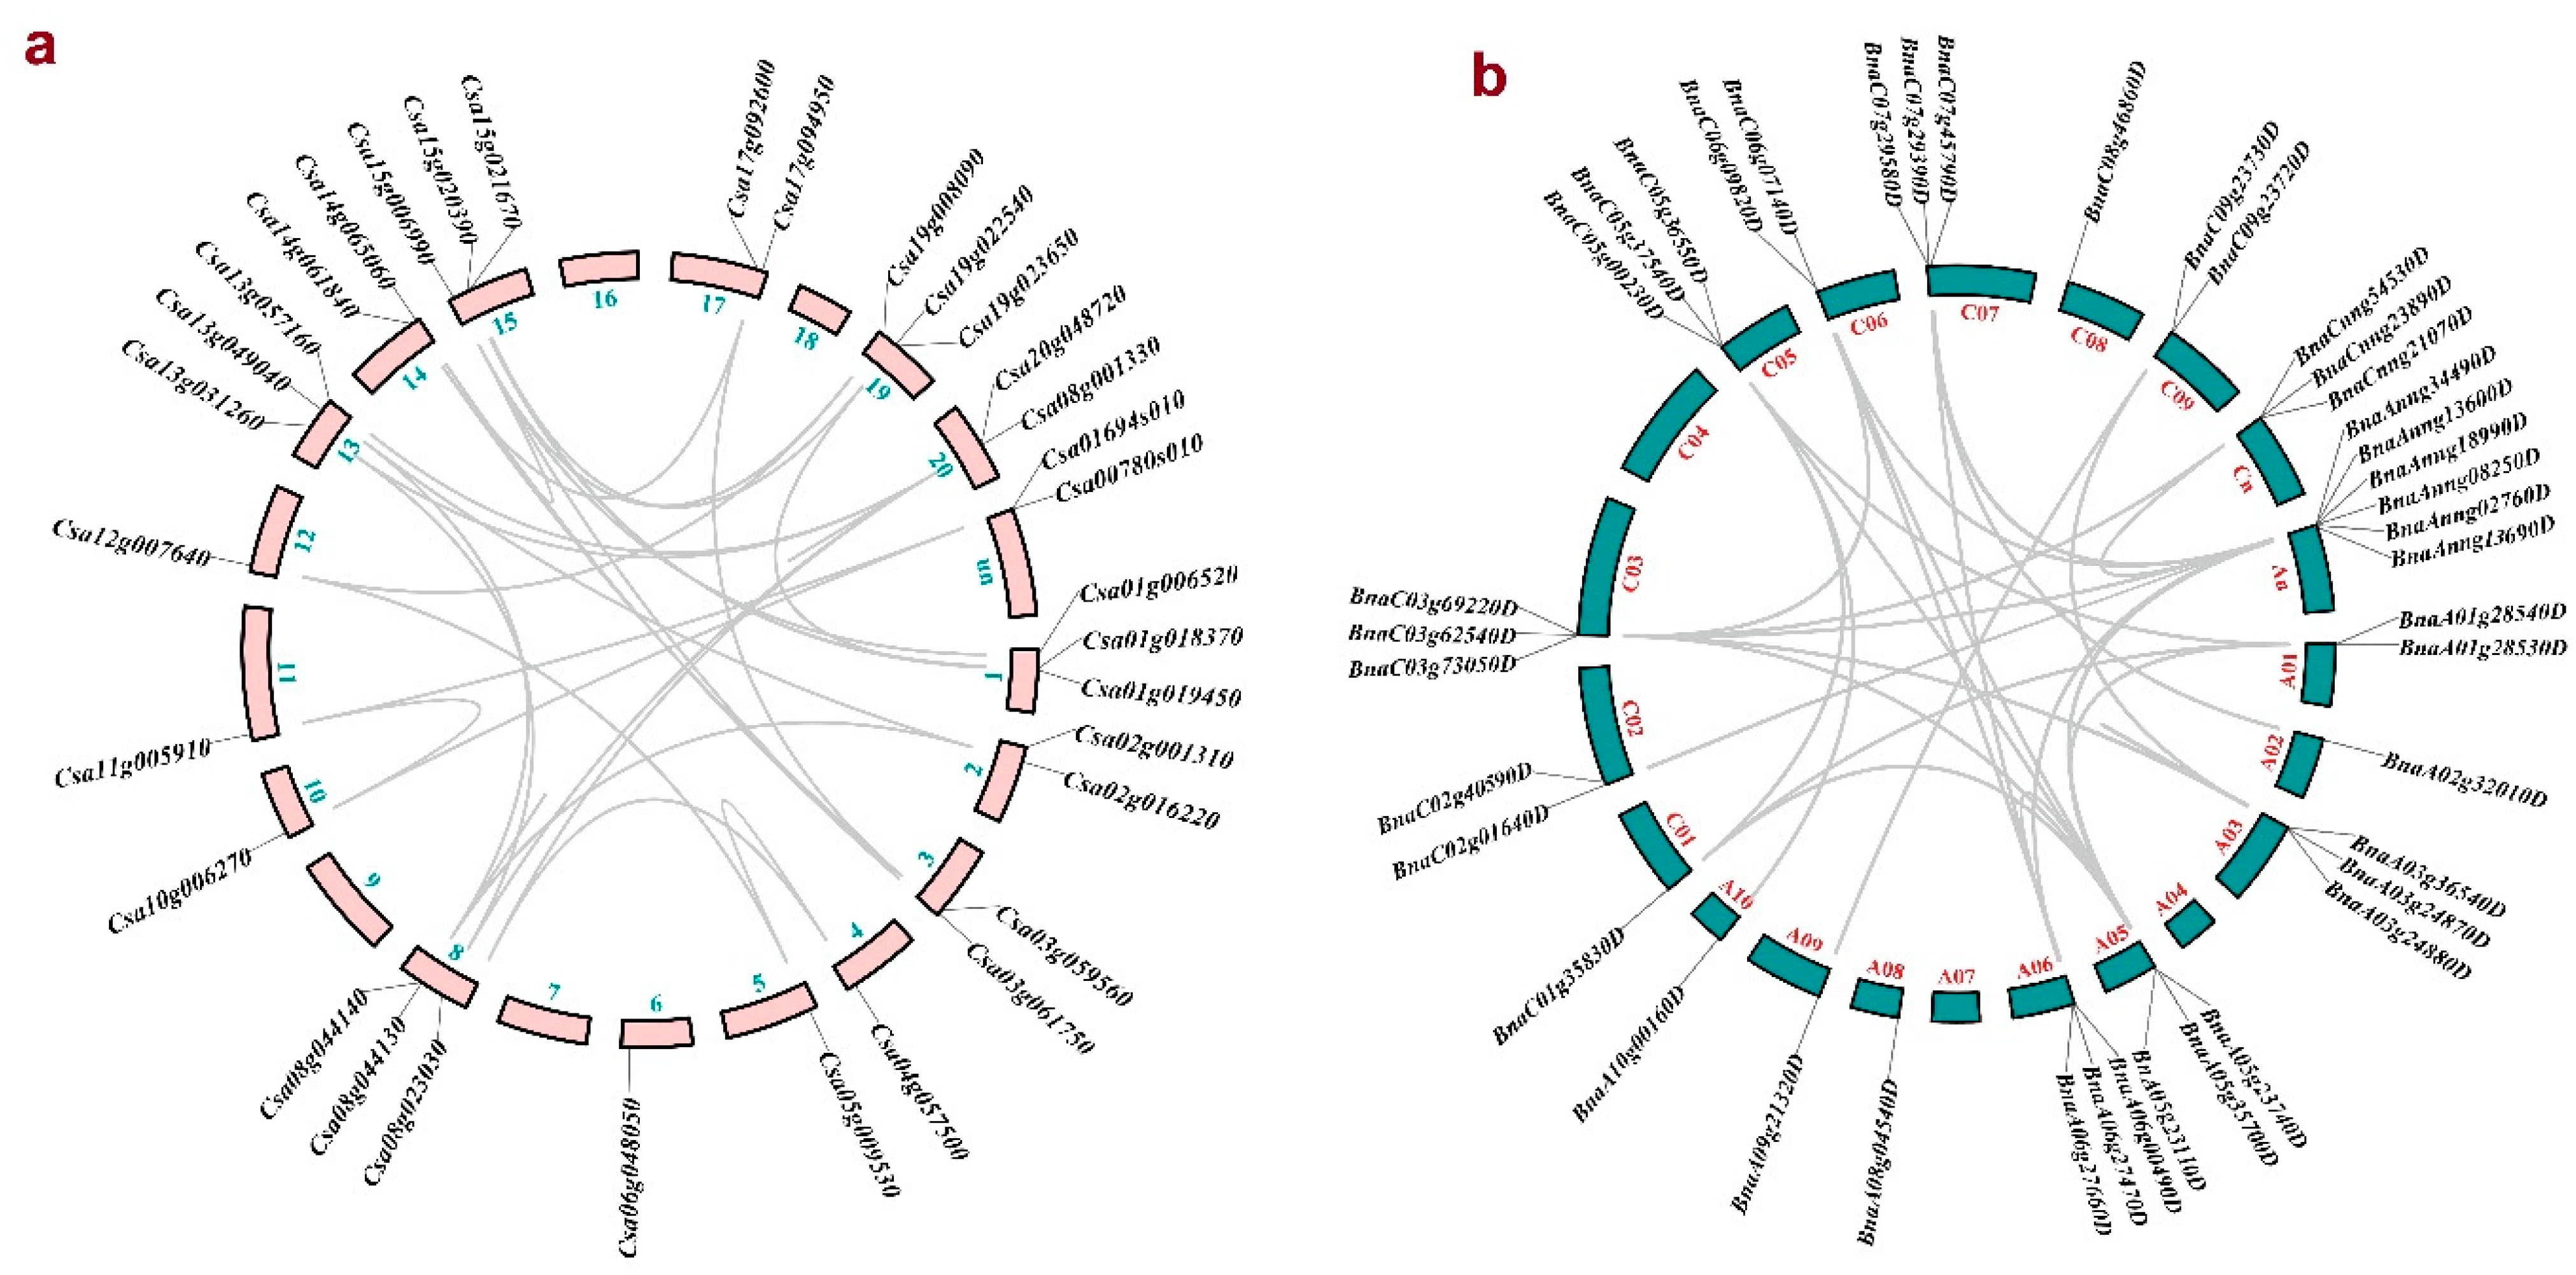
3.4. Duplication Events in PLD Gene Family

The CsPLDs and BnPLD genes were unevenly located on the chromosomes of C. sativa and B. napus (Figure 3 and Table S3). For the genome of C. sativa, the highest number of CsPLDs were distributed on chromosomes 1, 8, 13, 15, and 19 (Figure 3a). BnPLDs were mainly distributed on chromosomes A03, A05, A06, C03, and C07 (Figure 3b). However, the chromosomal location for 9 genes from B. napus is unknown, presented with An and Cn in Figure 3b. Duplication events between PLDs revealed that many duplication events have occurred in the PLD gene family from C. sativa and B. napus (Figure 3 and Table S3). In addition, the results disclose that all CsPLD genes have been segmentally duplicated, while in BnPLDs, three tandem duplications were observed. According to ka/ks index, the selective pressure of all studied PLDs was purifying. The divergence time of duplication events was estimated to range from 1.38 to 8.21 and 1.56 to 219.36 MYA in CsPLDs and BnPLDs, respectively. Overall, the results determine that a different evolutionary process has been followed in CsPLDs and BnPLD genes.

3.5. Promoter Analysis

The upstream sites of CsPLDs and BnPLDs were screened to identify the putative cis-regulatory elements which have roles in stress and defense responsiveness, hormone responsiveness, protein binding site, and plant growth and light responsiveness (Figure 4a,b; Table S4). Cis-regulatory elements related to hormones were observed more in the promoter region of CsPLDs, while in BnPLDs, cis-regulatory elements (about 44%) had roles in stress responses. The promoter elements related to ABA and auxin responsiveness were distributed more in CsPLDs, while elements linked with MeJA responsiveness were observed more in the promoter region of BnPLDs. This is suggestive of the participation of CsPLDs in response to ABA under abiotic stress and that BnPLDs are associated more with defense responses against biotic stresses by inducing the MeJA mechanism.

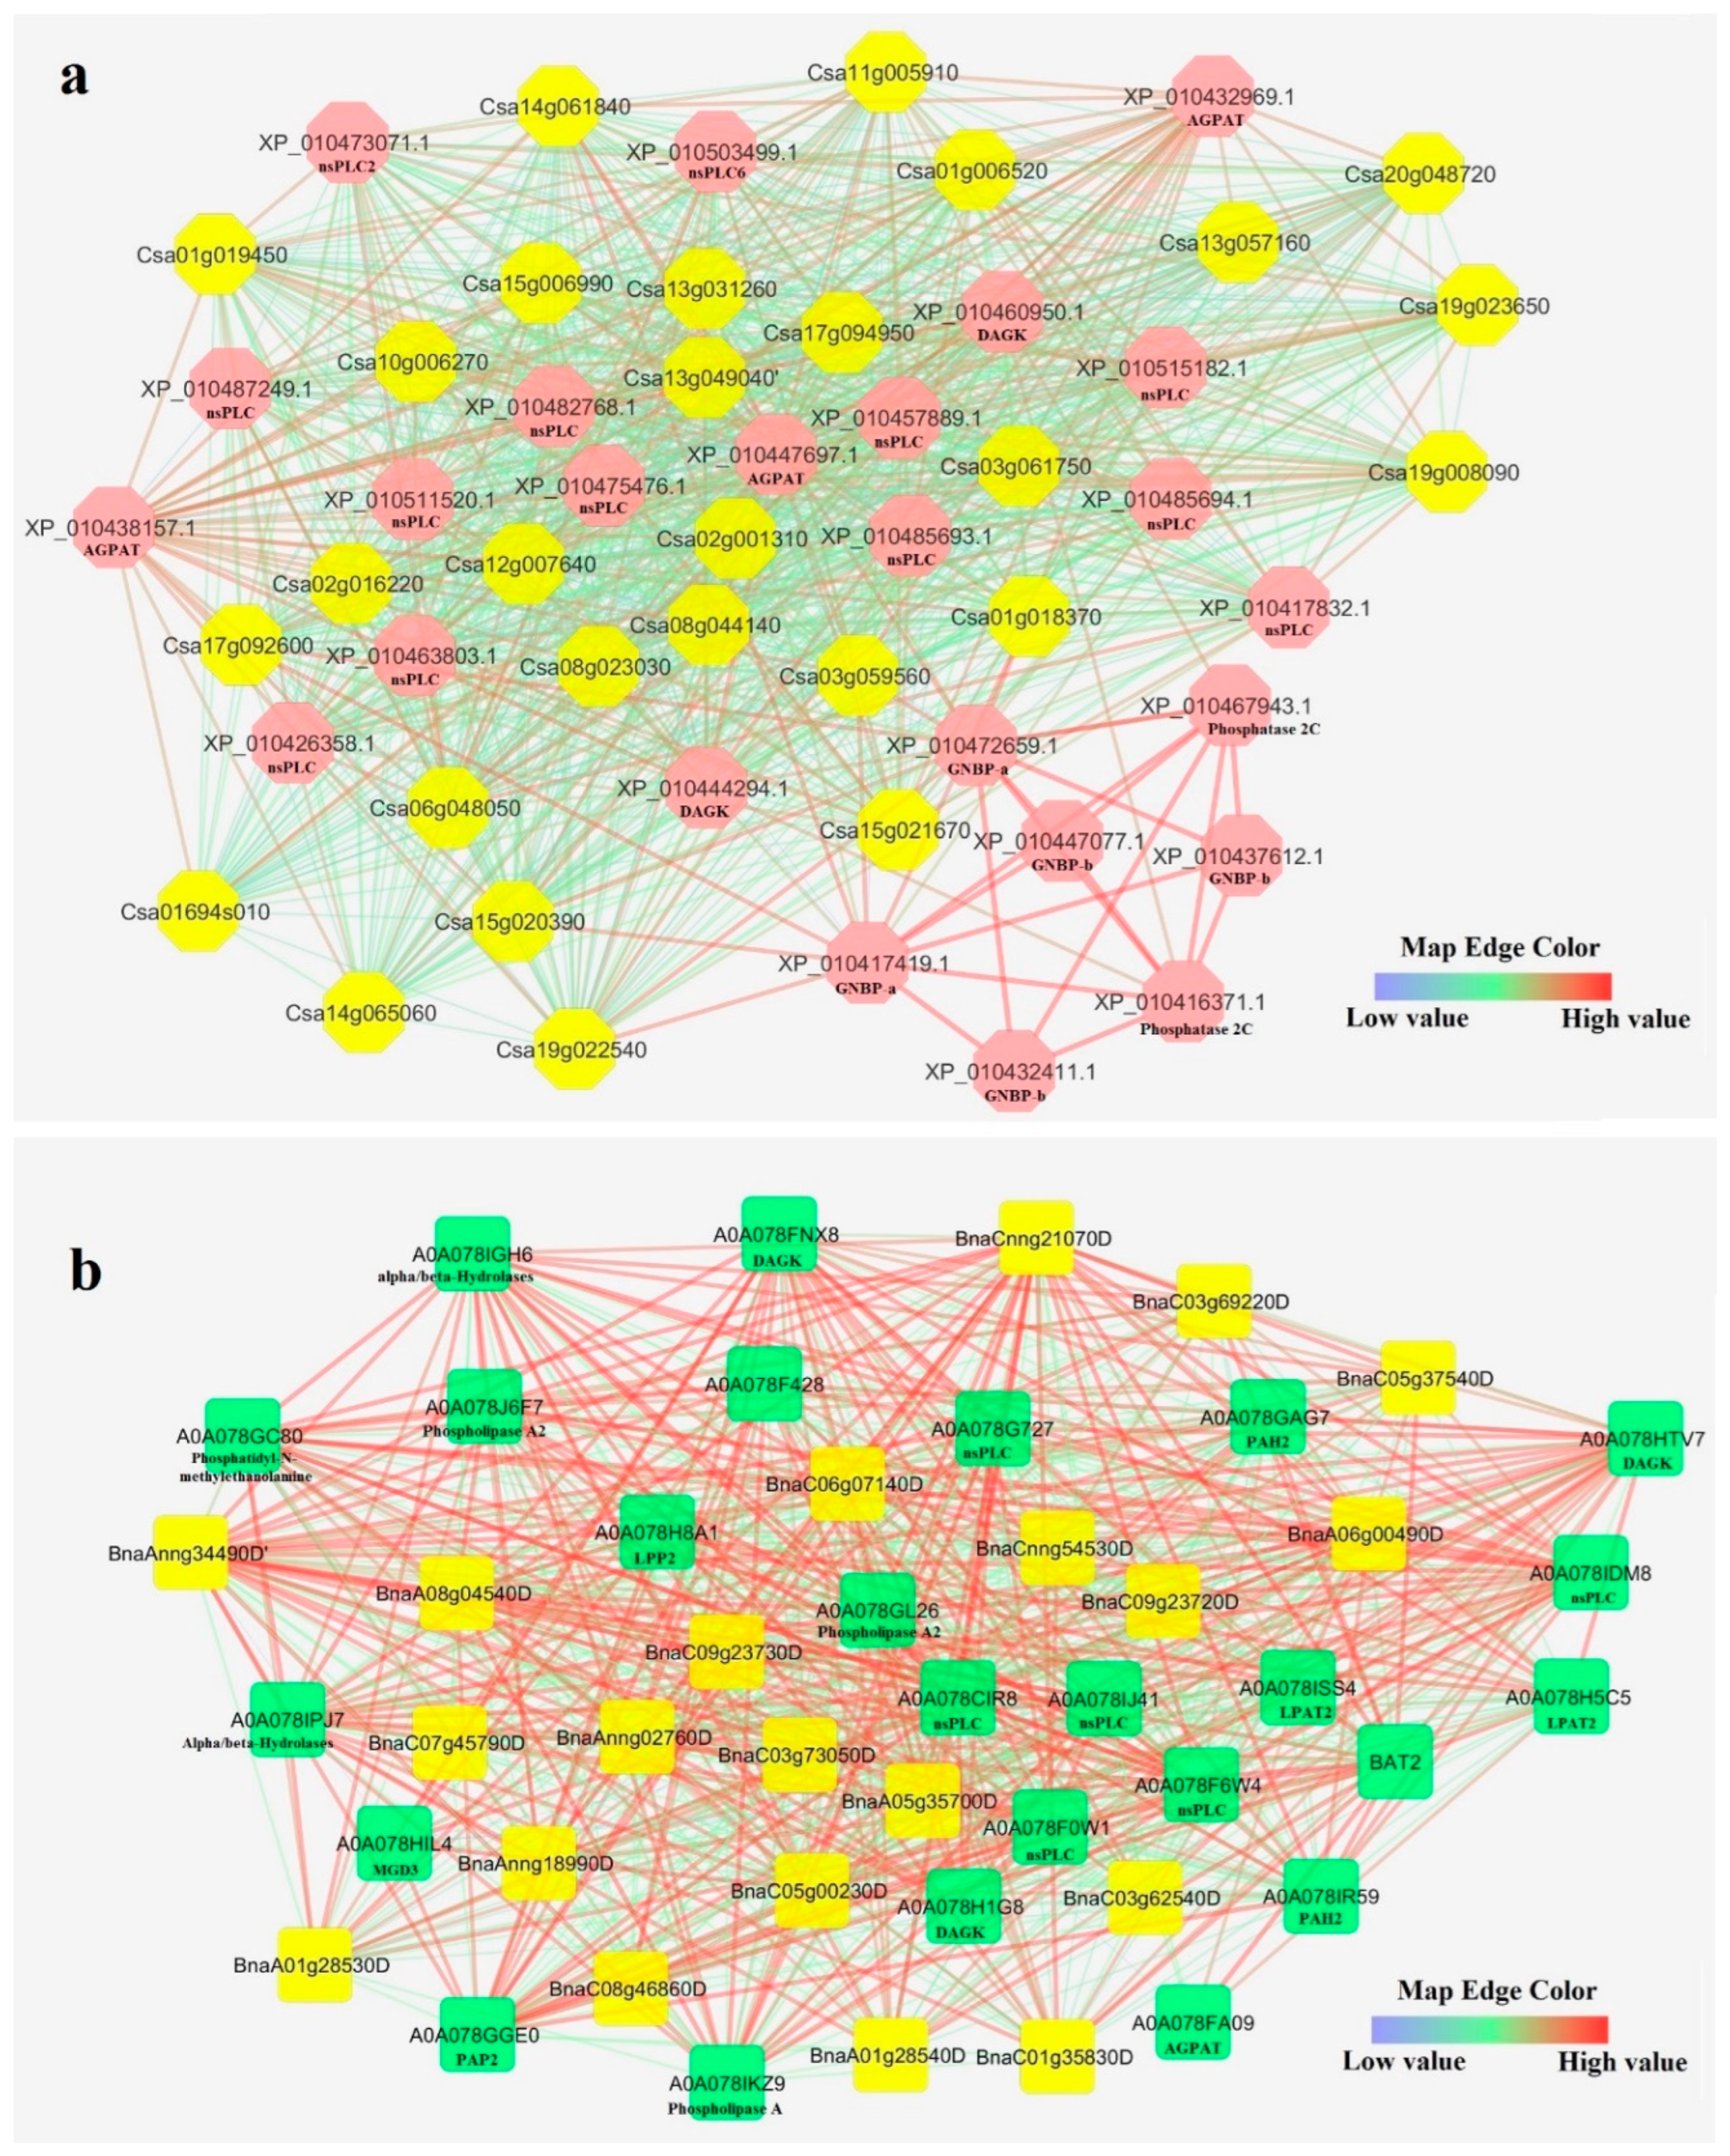
3.6. Interaction Network of CsPLDs and BnPLDS

In order to predict the interactions of PLDs with other proteins, an interaction network for PLDs in Camelina and B. napus was constructed based on the available data (Figure 5a,b). As presented in Figure 5a, CsPLDs showed interactions with non-specific phospholipase C (nsPLC), guanine nucleotide-binding protein (GNBP), 1-acyl-sn-glycerol-3-phosphate acyltransferase (AGPAT), diacylglycerol kinase (DAGK), and phosphatase 2C. In addition, BnPLDs interacted with nsPLC, phosphatidic acid phosphohydrolase 2 (PAH2), AGPAT, lipid phosphate phosphatase 2 (LPP2), lysophosphatidyl acyltransferase 2 (LPAT2), monogalactosyldiacylglycerol synthase type C (MGD3), phosphatidic acid phosphatase (PAP2), alpha/beta-Hydrolases, and phosphatidyl-N-methylethanolamine (Figure 3b). PLDs strongly showed interactions with proteins that are involved in phosphonate and phosphinate metabolism, ether lipid metabolism, phosphatidic acid metabolic, and inositol phosphate metabolism. These results disclose that PLDs can be involved in various pathways in response to upstream signals. However, the interaction network of CsPLDs and BnPLDs was somewhat different.

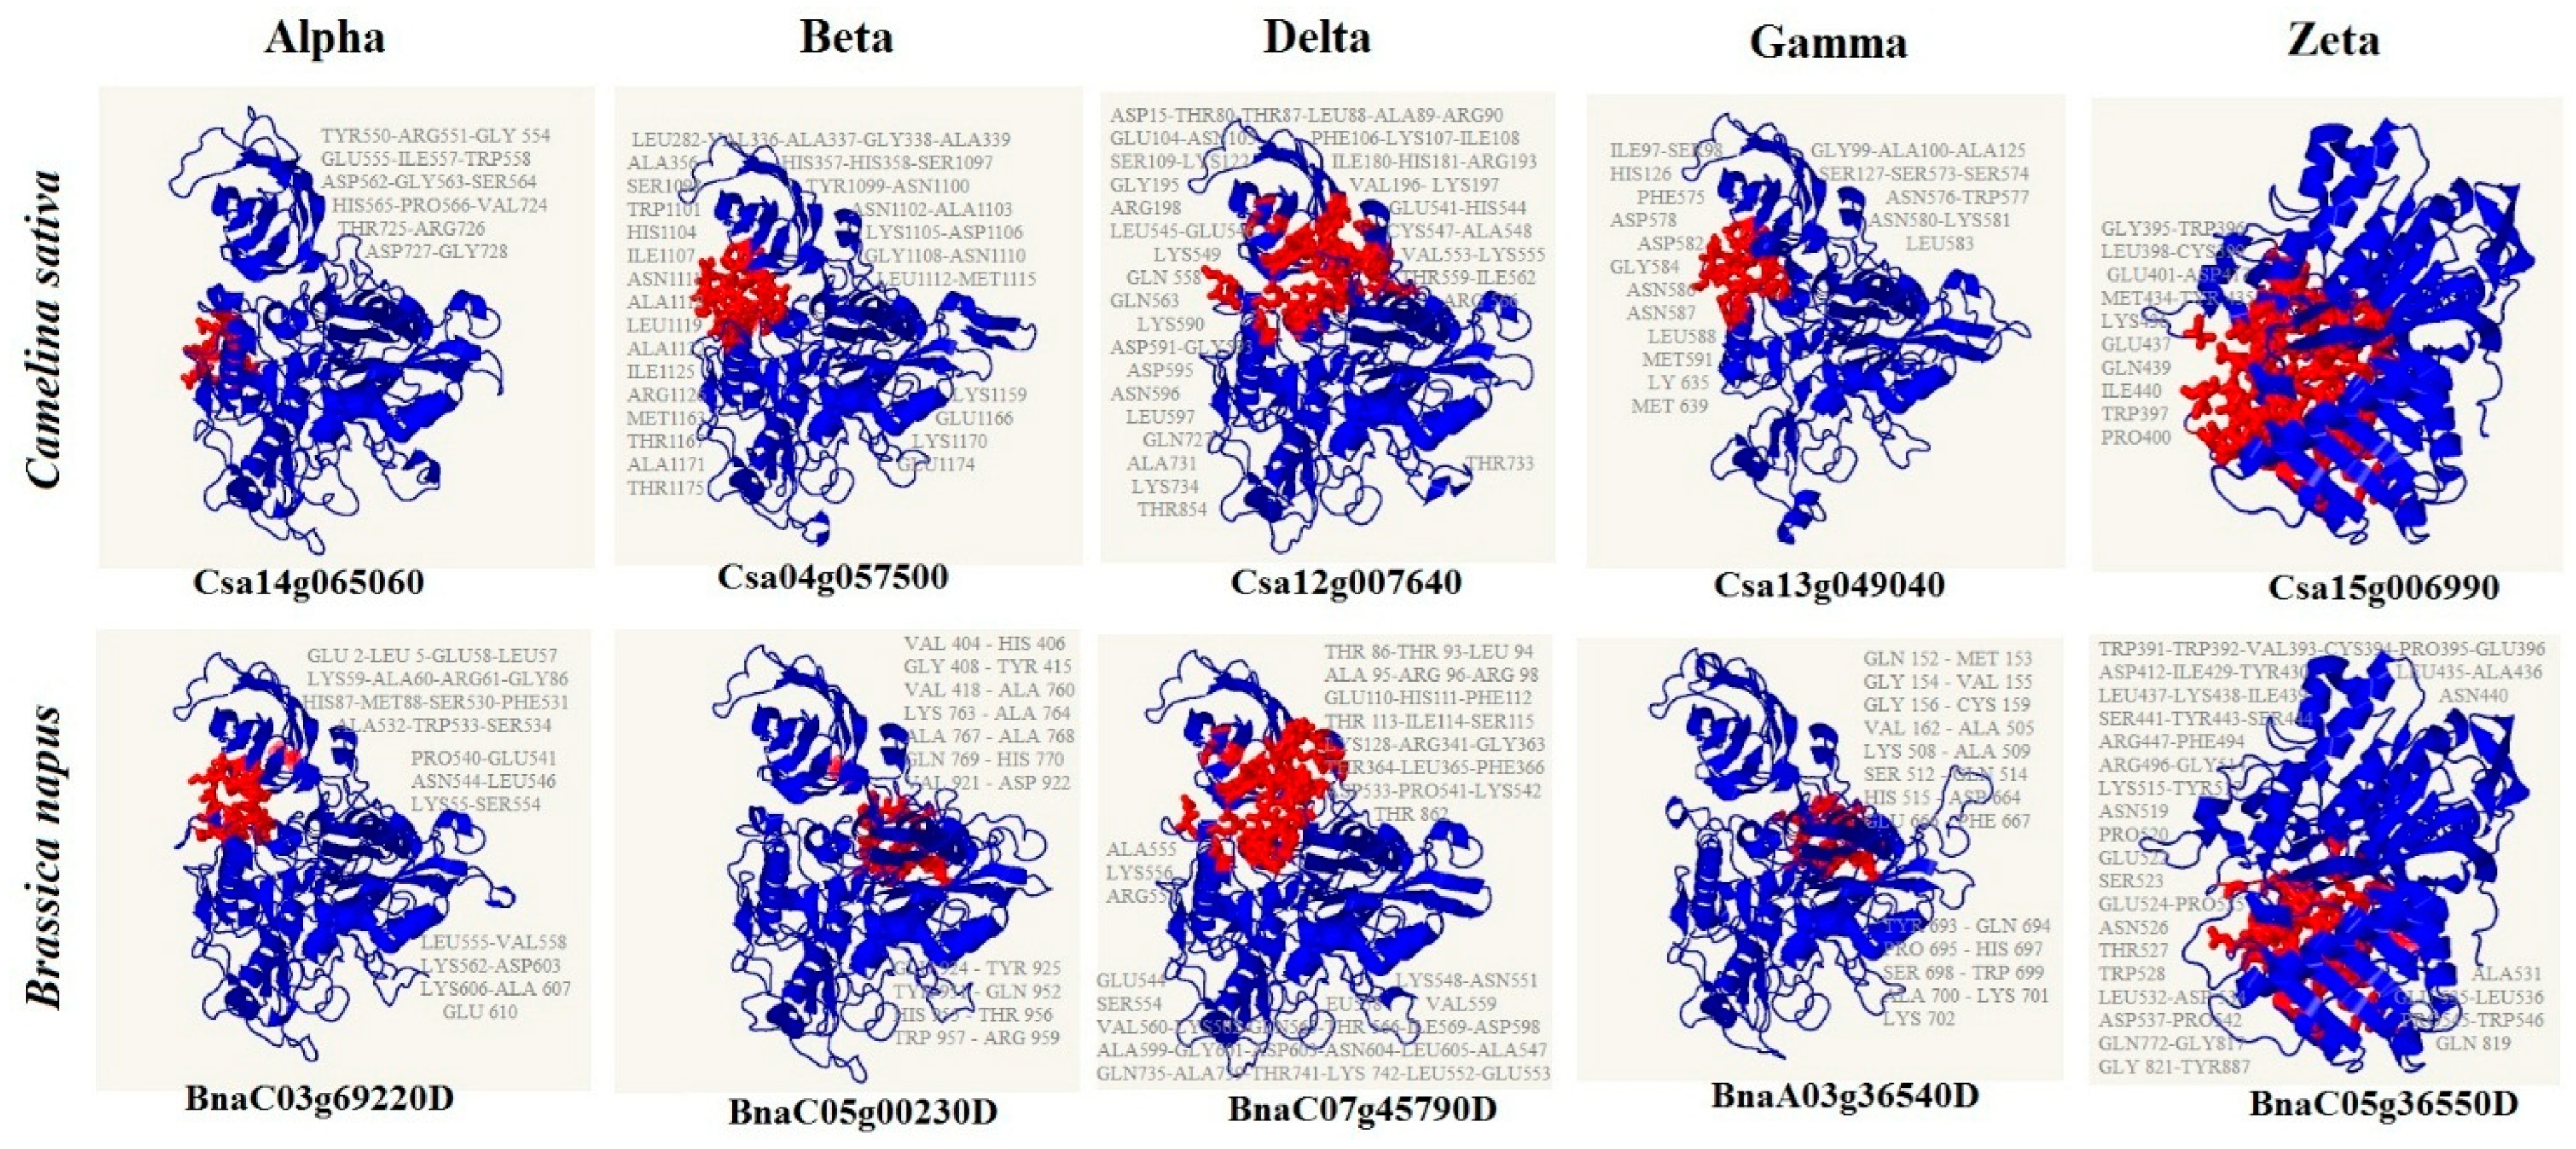
3.7. 3D Structure and Pocket Sites of Candidate PLD Subfamilies

The three-dimensional structure of each subfamily of the PLD gene family was predicted based on homology. The results revealed that PLDs in C. sativa and B. napus have a similar 3D structure, while they showed different binding points according to the location and type of sequence in the pocket region (Figure 6). Based on the abundance of amino acids in the pocket region, PRO, TRP, LEU, and GLU were more present in the zeta subfamily of BnPLD, while TRP and GLU observed more in CsPLD zeta. Moreover, LEU and GLU in BnPLD alpha and GLY in CsPLD alpha were more present in the pocket site. Interestingly, ALA was frequently distributed in the pocket site of the beta subfamily of both BnPLD and CsPLD. In candidate gamma subfamily proteins, LYS, GLN, and ALA in BnPLD and SER, and ASN in CsPLD were observed more. LYS and THR were highly distributed in BnPLD delta and CsPLD delta, respectively.

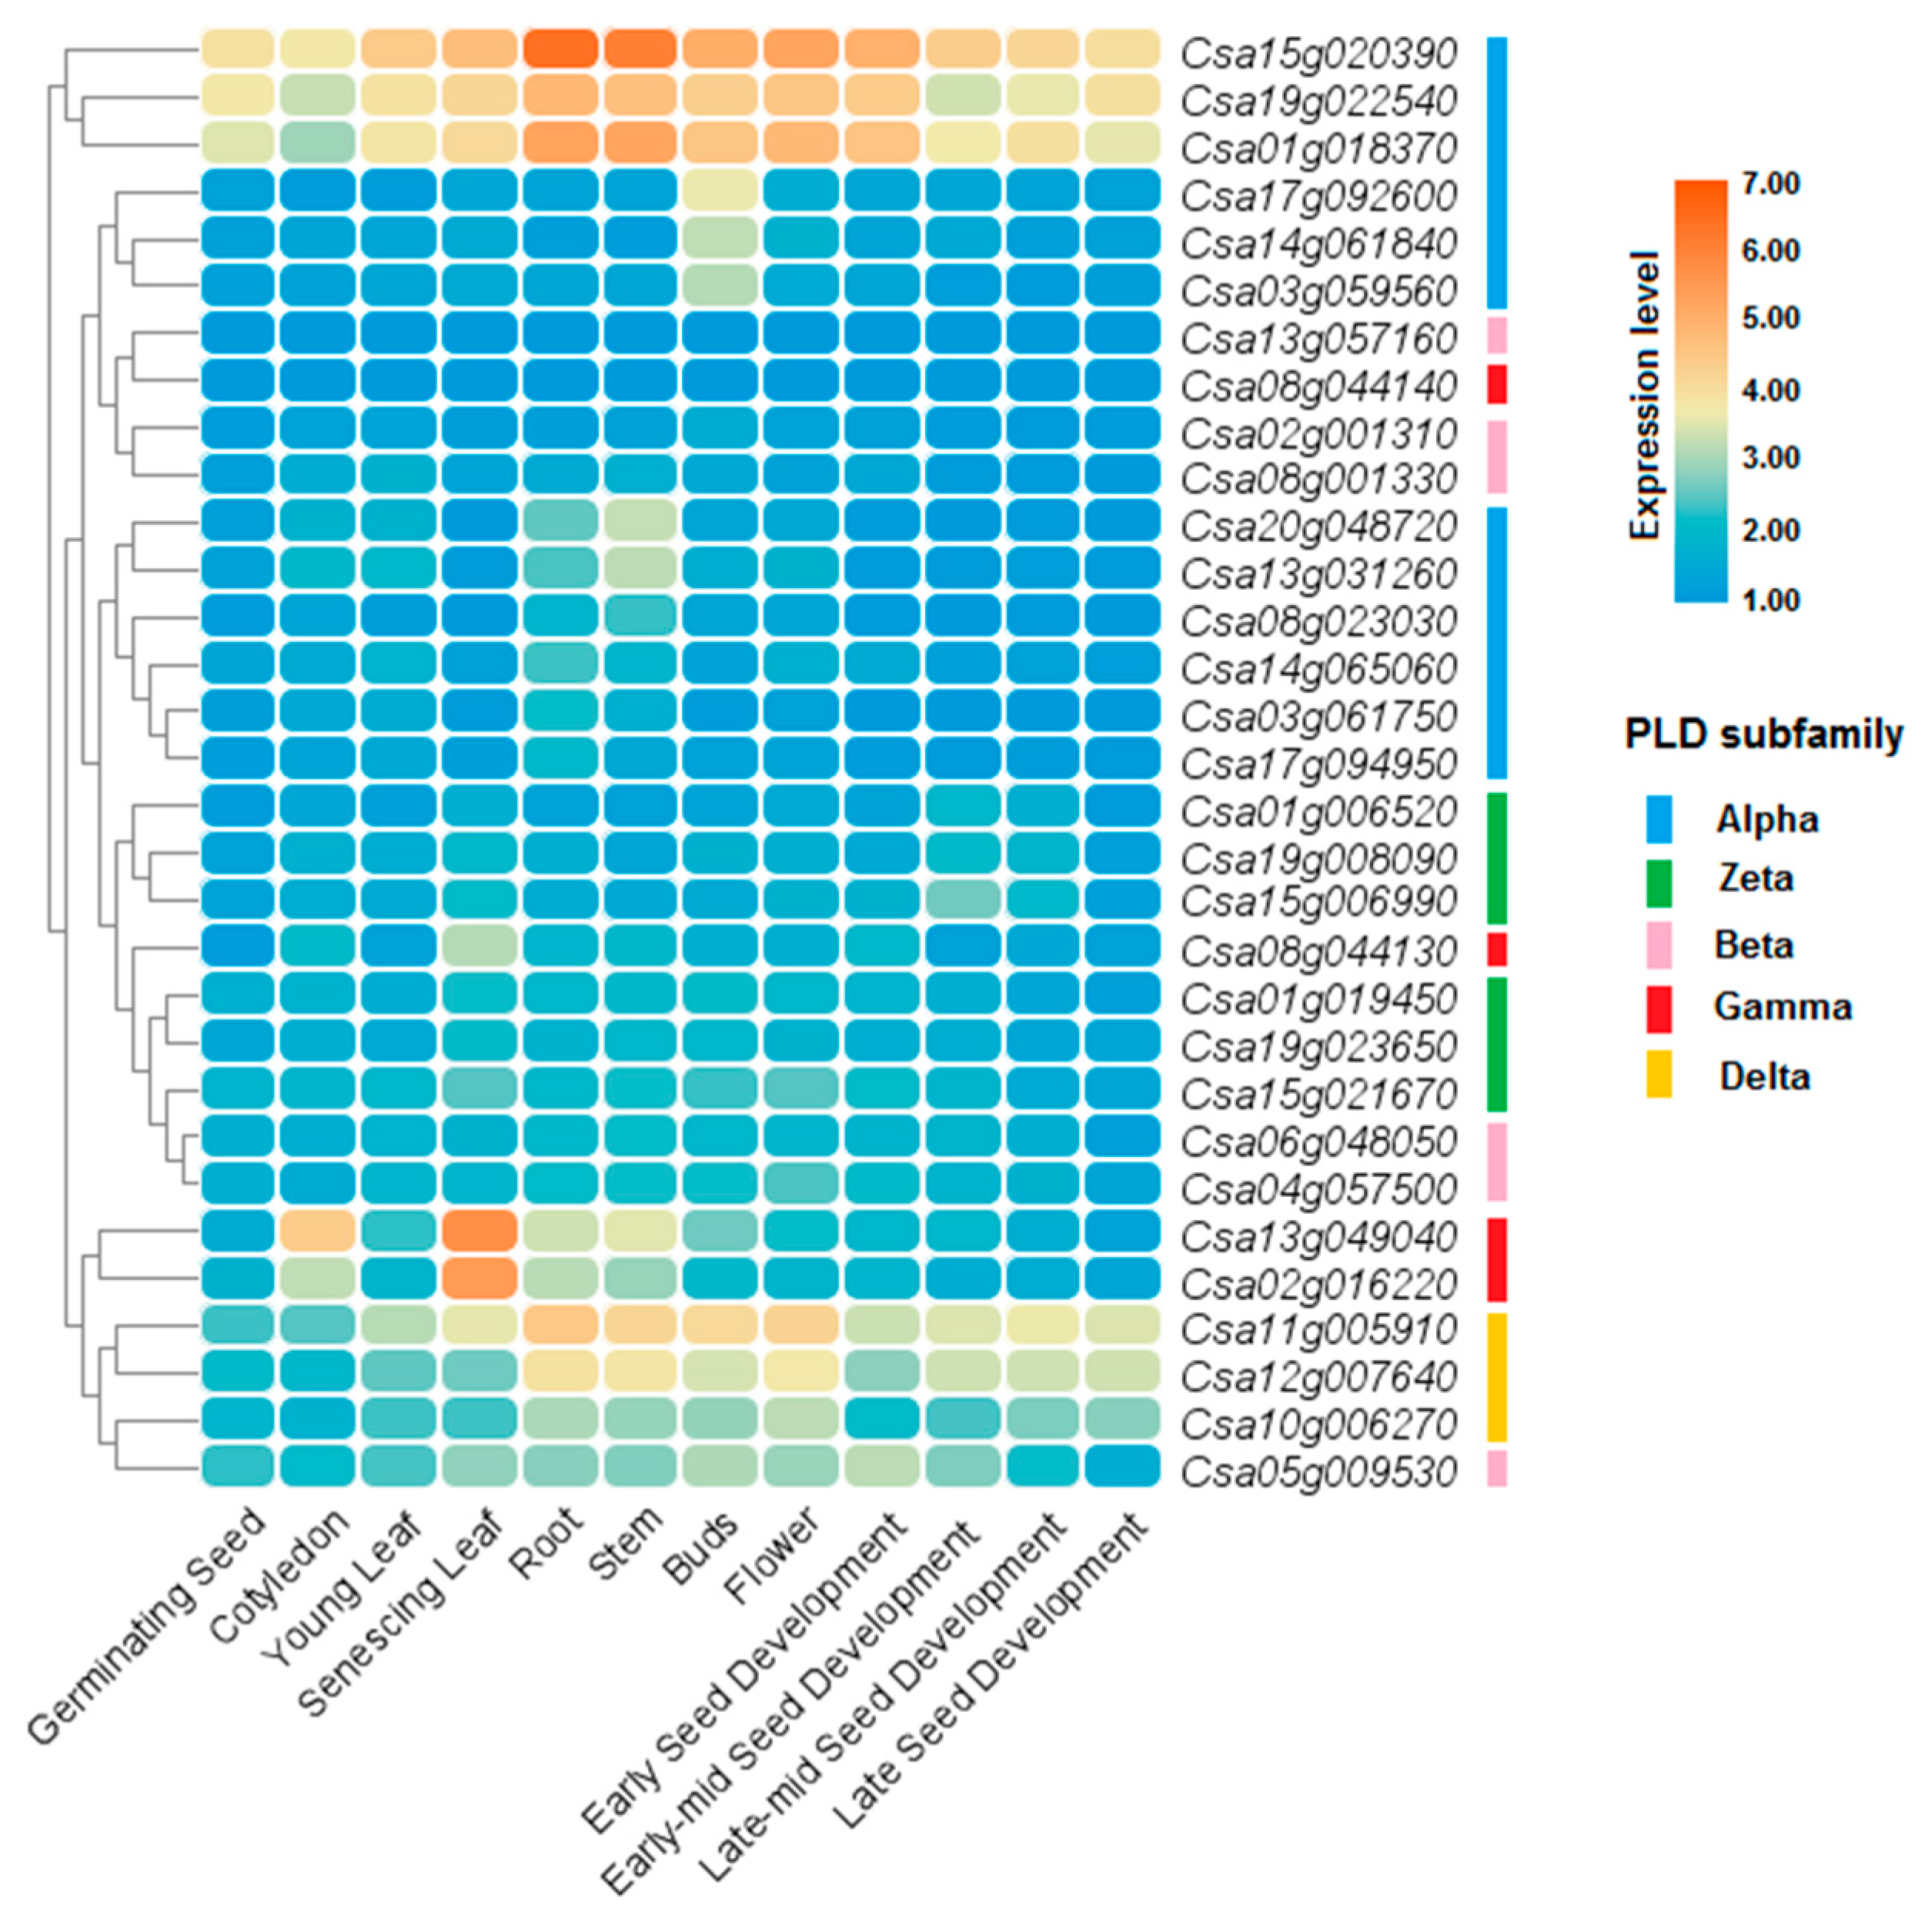
3.8. Expression Profile of PLDs in Different Tissues and Organs

Expression levels of PLDs were investigated in different tissues and organs of C. sativa and B. napus (Figure 7 and Figure 8). In C. sativa, three CsPLD genes from the alpha subfamily, including Csa15g020390, Csa19g022540, and Csa01g018370, showed high expression in all tissues and organs (Figure 7). In addition, two genes, Csa13g049040 and Csa02g016220, from the gamma subfamily were more expressed in senescing leaf tissues of Camelina. In B. napus, five genes from the alpha subfamily, including BnaC01g35830D, BnaA01g28530D, BnaA01g28540D, BnaC05g37540D, and BnaA05g23740D, showed high expression in all studied tissues and organs, except for anther tissues (Figure 8). A delta subfamily gene, BnaA08g04540D, and two beta subfamily genes, BnaC05g00230D and BnaA10g00160D, were more expressed in anther. In bud tissues of B. napus, two genes from the alpha subfamily, BnaC03g69220D and BnaA05g35700D, were more induced. Based on expression patterns of PLD genes, we observed that the alpha subfamily genes in both studied plants are more expressed in organs and tissues.

3.9. Expression Profile of CsPLD in Response to Salt Stress

To better understand the potential roles of the PLDs in Camelina, the expression profile of six candidate CsPLD genes were investigated in response to 200 mM of NaCl as salinity stress. The results indicate that CsPLD candidate genes are involved in the response of Camelina seedlings to salt stress, although they had different expression patterns (Figure 9). PLD beta1 (Csa06g048050) and PLD delta (Csa10g006270) showed a similar expression pattern; their expression levels were upregulated after 24 h of salt stress and they showed the highest level of expression after 72 h of salt stress. The expression pattern of one PLD gamma gene (Csa13g049040) was significantly downregulated after 6 h and its expression level was not significantly induced by salinity. In addition, the expression level of Csa01g006520 (which is a PLD zeta) was reduced sharply in the early stages of salt stress (after 6 and 24 h), while its expression was increased after 72 h. Two members of the alpha subfamily presented a different expression pattern after 6 h of salt stress; alpha 4 (Csa03g061750) increased expression and alpha 1 (Csa15g020390) decreased expression, while their expression levels of both genes were increased after 72 h.

4. Discussion

Oilseed plants such as rapeseed play an important role in the production of healthy oils in the food basket. Camelina, as an almost new agricultural plant, also has a good percentage of healthy oil and a high resistance to adverse environmental conditions. In addition to this, phospholipases have a key role in regulating cellular signaling pathways in response to stresses. PLD, as a key element linked in lipid-mediated signaling, is involved in various physiological and developmental processes [6,41]. In this study, two oilseed plants were compared based on the PLD gene family to gain a better understanding of their structures and functions. The results show that the PLD family has 41 members in B. napus and 33 members in C. sativa, more members than in other plants such as rice, 17 PLDs, [15] Arabidopsis, 12 PLDs [42], 13 in maize [43], and 19 in potato [41]. Ploidy level and genome size can have an effect on the number of gene family members in the plant species [44]. Evolutionary analysis was able to separate the subfamilies (gamma, delta, beta, alpha, and zeta) well. These findings suggest that PLDs in the same group share conserved sequences, disclosing that they can have similar functions. However, less of a relationship was observed between CsPLDs and BnPLDs. These results indicate that the evolutionary process of the PLD gene family has been somewhat different in C. sativa and B. napus. Moreover, it seems that the ancestral gene of the PLD family was formed before C. sativa and B. napus, and after the separation of the species, a different evolutionary process was passed in each species [45]. In addition, the Ka/Ks value of all duplicated CsPLD and BnPLD pairs was estimated to be less than 1.0, revealing that the CsPLD and BnPLD family members survived under strong selection pressure of purification [46,47]. However, it was stated that purifying selection can generate pseudogenes and/or genes with conserved functions [48,49]. In addition, it seems that the expansion in CsPLDs happened much earlier than BnPLDs, and the evolution process of PLD was different in CsPLD and BnPLD family.
Signaling of phospholipases activates pathways related to growth and development and response to stresses [14,50]. Direct and indirect interactions can be effective in expanding the effect of phospholipases. By examining the interaction network, it was determined that the members of the CsPLD and BnPLD family interact more with other elements of lipid-dependent cell signaling such as non-specific phospholipase, diacylglycerol kinase, 1-acyl-sn-glycerol-3-phosphate acyltransferase, phosphatidic acid phosphohydrolase, lipid phosphate phosphatase, lysophosphatidyl acyltransferase, and phosphatase. However, the interaction network of BnPLDs was estimated to be different from CsPLDs. It was previously reported that the interaction of PLD alpha1 with GPA is effective in increasing resistance to osmotic stress by affecting the opening and closing of stomata through ABA signaling pathway [51]. Moreover, it was stated that PLDs can participate in the response to abiotic and biotic stresses by cooperating with abscisic acid and jasmonic acid-dependent pathways [15,16,52]. The presence of cis-regulatory elements in the upstream region of PLD genes can strengthen this hypothesis, although additional studies are needed. In addition, based on the interaction network and the analysis of the upstream regions, the hypothesis is proposed that the members of the PLD gene family in camellia and rapeseed plants are involved in different pathways which may be due to changes in their regulatory regions during evolutionary processes. Post-translational modifications such as phosphorylation are effective in activating or deactivating target proteins [53]. The evaluation of post-translational changes in BnPLDs and CsPLDs showed that they have different potentials and thus can contribute in different ways. For example, fewer phosphorylation sites were predicted in PLD alpha proteins, suggesting that this subfamily is less affected by upstream signaling elements.
The results of the expression profile of CsPLD and BnPLD genes in different tissues indicate that the members of this gene family are expressed in all tissues and developmental stages. A comparison between subfamilies revealed that the alpha subfamily has a greater range of activity. Also, the analysis of the structure of CsPLD and BnPLD genes discloses that the members of the alpha subfamily have fewer introns/exons. It has been reported that genes with fewer exons/introns are induced faster [49,54]. It seems that the smaller number of introns has an effect on the duration of the mRNA splicing process before leaving the nucleus, and as a result, they are translated earlier [47,55]. The quantitative findings under salt stress revealed that candidate CsPLDs were significantly induced. It was reported that PLDs are affected by abiotic stresses such as drought, high and low temperature, and salt stress [41,50,56,57]. CsPLD gamma1, CsPLD zeta2, CsPLD alpha1, and CsPLD alpha4 are recognized as early elements in response to salt stress. With the persistence of salinity stress, all studied CsPLD genes, except for CsPLD gamma1 gene, showed upregulation, suggesting that CsPLDs are probably involved in both the initial responses to activate the downstream pathways and in the resistance response to reduce the damages of the salinity stress.

5. Conclusions

Phospholipases D (PLD) is an enzyme that plays a crucial role in cell signaling, lipid metabolism, and membrane dynamics. In the current study, the PLD gene family is characterized in Brassica napus and Camelina sativa. CsPLD and BnPLD have had different evolutionary processes, although both of them have been under almost similar evolutionary pressures, which has caused their structure to be conserved. Among the PLD subfamilies, members of the alpha subfamily have more obvious differences from the others, which can be considered more in future functional works. According to the expression data, PLDs were identified as widely expressed genes that can be involved in most of the developmental stages of plants. Our findings revealed that CsPLDs are involved in the response to high salinity stress and are probably active in a multi-branched interaction network in increasing resistance and reducing stress damages.

Supplementary Materials

The following supporting information can be downloaded at: https://www.mdpi.com/article/10.3390/agronomy13102616/s1, Table S1: List of CsPLD primers used in qPCR analysis. Table S2: List of the identified PLDs and their physiochemical properties in Camelina sativa and Brassica napus. Table S3: List of the duplicated CsPLDs and BnPLDs along with Ka and Ks values. Table S4: List of putative cis-regulatory elements related to various developmental, hormonal, and stress responsive pathways in CsPLDs and BnPLDs.

Author Contributions

Conceptualization, P.H. and F.P.; methodology, P.H., M.A. and F.P.; software, Y.V., F.P., M.E. and H.A.; writing—original draft preparation, P.H., Y.V. and M.A.; writing—review and editing, P.H. and Y.V. All authors have read and agreed to the published version of the manuscript.

Funding

This research received no external funding.

Data Availability Statement

The data that support the findings of this study are available from the corresponding author, Parviz Heidari, upon reasonable request.

Conflicts of Interest

The authors declare no conflict of interest.

References

  1. Sadat, M.A.; Ullah, M.W.; Hossain, M.S.; Ahmed, B.; Bashar, K.K. Genome-wide in silico identification of phospholipase D (PLD) gene family from Corchorus capsularis and Corchorus olitorius: Reveals their responses to plant stress. J. Genet. Eng. Biotechnol. 2022, 20, 28. [Google Scholar] [CrossRef] [PubMed]
  2. Takáč, T.; Novák, D.; Šamaj, J. Recent advances in the cellular and developmental biology of phospholipases in plants. Front. Plant Sci. 2019, 10, 432553. [Google Scholar] [CrossRef] [PubMed]
  3. Yuan, Y.; Yu, J.; Kong, L.; Zhang, W.; Hou, X.; Cui, G. Genome-wide investigation of the PLD gene family in alfalfa (Medicago sativa L.): Identification, analysis and expression. BMC Genom. 2022, 23, 243. [Google Scholar] [CrossRef] [PubMed]
  4. Su, W.; Raza, A.; Gao, A.; Zeng, L.; Lv, Y.; Ding, X.; Cheng, Y.; Zou, X. Plant lipid phosphate phosphatases: Current advances and future outlooks. Crit. Rev. Biotechnol. 2023, 43, 384–392. [Google Scholar] [CrossRef]
  5. Sagar, S.; Singh, A. Emerging role of phospholipase C mediated lipid signaling in abiotic stress tolerance and development in plants. Plant Cell Rep. 2021, 40, 2123–2133. [Google Scholar] [CrossRef]
  6. Hong, Y.; Zhao, J.; Guo, L.; Kim, S.C.; Deng, X.; Wang, G.; Zhang, G.; Li, M.; Wang, X. Plant phospholipases D and C and their diverse functions in stress responses. Prog. Lipid Res. 2016, 62, 55–74. [Google Scholar] [CrossRef]
  7. Raza, A.; Tabassum, J.; Fakhar, A.Z.; Sharif, R.; Chen, H.; Zhang, C.; Ju, L.; Fotopoulos, V.; Siddique, K.H.M.; Singh, R.K. Smart reprograming of plants against salinity stress using modern biotechnological tools. Crit. Rev. Biotechnol. 2022, 12, 1–28. [Google Scholar] [CrossRef]
  8. Tang, K.; Dong, C.; Liu, J. Genome-wide analysis and expression profiling of the phospholipase D gene family in Gossypium arboreum. Sci. China Life Sci. 2016, 59, 130–141. [Google Scholar] [CrossRef]
  9. Deepika, D.; Singh, A. Plant phospholipase D: Novel structure, regulatory mechanism, and multifaceted functions with biotechnological application. Crit. Rev. Biotechnol. 2022, 42, 106–124. [Google Scholar] [CrossRef]
  10. Iakimova, E.T.; Michaeli, R.; Woltering, E.J. Involvement of phospholipase D-related signal transduction in chemical-induced programmed cell death in tomato cell cultures. Protoplasma 2013, 250, 1169–1183. [Google Scholar] [CrossRef]
  11. Pleskot, R.; Li, J.; Žárský, V.; Potocký, M.; Staiger, C.J. Regulation of cytoskeletal dynamics by phospholipase D and phosphatidic acid. Trends Plant Sci. 2013, 18, 496–504. [Google Scholar] [CrossRef] [PubMed]
  12. Pejchar, P.; Sekereš, J.; Novotný, O.; Žárský, V.; Potocký, M. Functional analysis of phospholipase Dδ family in tobacco pollen tubes. Plant J. 2020, 103, 212–226. [Google Scholar] [CrossRef]
  13. Mancuso, S.; Marras, A.M.; Mugnai, S.; Schlicht, M.; Žársky, V.; Li, G.; Song, L.; Xue, H.W.; Baluška, F. Phospholipase Dζ2 Drives Vesicular Secretion of Auxin for Its Polar Cell-Cell Transport in the Transition Zone of the Root Apex. Plant Signal. Behav. 2007, 2, 240. [Google Scholar] [CrossRef] [PubMed]
  14. Distéfano, A.M.; Scuffi, D.; García-Mata, C.; Lamattina, L.; Laxalt, A.M. Phospholipase Dδ is involved in nitric oxide-induced stomatal closure. Planta 2012, 236, 1899–1907. [Google Scholar] [CrossRef] [PubMed]
  15. Li, G.; Lin, F.; Xue, H.W. Genome-wide analysis of the phospholipase D family in Oryza sativa and functional characterization of PLDβ1 in seed germination. Cell Res. 2007, 17, 881–894. [Google Scholar] [CrossRef] [PubMed]
  16. Wang, C.; Zien, C.A.; Afitlhile, M.; Welti, R.; Hildebrand, D.F.; Wang, X. Involvement of Phospholipase D in Wound-Induced Accumulation of Jasmonic Acid in Arabidopsis. Plant Cell 2000, 12, 2237. [Google Scholar] [CrossRef]
  17. Wang, X. Regulatory Functions of Phospholipase D and Phosphatidic Acid in Plant Growth, Development, and Stress Responses. Plant Physiol. 2005, 139, 566–573. [Google Scholar] [CrossRef]
  18. Wang, X. Plant phospholipases. Annu. Rev. Plant Biol. 2001, 52, 211–231. [Google Scholar] [CrossRef]
  19. Liu, Q.; Zhang, C.; Yang, Y.; Hu, X. Genome-wide and molecular evolution analyses of the phospholipase D gene family in Poplar and Grape. BMC Plant Biol. 2010, 10, 117. [Google Scholar] [CrossRef]
  20. Wang, X.; Xu, L.; Zheng, L. Cloning and expression of phosphatidylcholine-hydrolyzing phospholipase D from Ricinus communis L. J. Biol. Chem. 1994, 269, 20312–20317. [Google Scholar] [CrossRef]
  21. Du, D.; Cheng, T.; Pan, H.; Yang, W.; Wang, J.; Zhang, Q. Genome-wide identification, molecular evolution and expression analyses of the phospholipase D gene family in three Rosaceae species. Sci. Hortic. 2013, 153, 13–21. [Google Scholar] [CrossRef]
  22. Raza, A. Eco-physiological and biochemical responses of rapeseed (Brassica napus L.) to abiotic stresses: Consequences and mitigation strategies. J. Plant Growth Regul. 2021, 40, 1368–1388. [Google Scholar] [CrossRef]
  23. Bolser, D.; Staines, D.M.; Pritchard, E.; Kersey, P. Ensembl Plants: Integrating Tools for Visualizing, Mining, and Analyzing Plant Genomics Data. Methods Mol. Biol. 2016, 1374, 115–140. [Google Scholar]
  24. Marchler-Bauer, A.; Derbyshire, M.K.; Gonzales, N.R.; Lu, S.; Chitsaz, F.; Geer, L.Y.; Geer, R.C.; He, J.; Gwadz, M.; Hurwitz, D.I.; et al. CDD: NCBI’s conserved domain database. Nucleic Acids Res. 2015, 43, D222–D226. [Google Scholar] [CrossRef]
  25. Gasteiger, E.; Hoogland, C.; Gattiker, A.; Duvaud, S.; Wilkins, M.R.; Appel, R.D.; Bairoch, A. Protein identification and analysis tools on the ExPASy server. In The Proteomics Protocols Handbook; Humana Press: Totowa, NJ, USA, 2005; pp. 571–607. [Google Scholar]
  26. Sievers, F.; Wilm, A.; Dineen, D.; Gibson, T.J.; Karplus, K.; Li, W.; Lopez, R.; McWilliam, H.; Remmert, M.; Söding, J.; et al. Fast, scalable generation of high-quality protein multiple sequence alignments using Clustal Omega. Mol. Syst. Biol. 2011, 7, 539. [Google Scholar] [CrossRef] [PubMed]
  27. Nguyen, L.-T.; Schmidt, H.A.; von Haeseler, A.; Minh, B.Q. IQ-TREE: A fast and effective stochastic algorithm for estimating Maximum-likelihood phylogenies. Mol. Biol. Evol. 2015, 32, 268–274. [Google Scholar] [CrossRef]
  28. Hoang, D.T.; Chernomor, O.; von Haeseler, A.; Minh, B.Q.; Vinh, L.S. UFBoot2: Improving the ultrafast bootstrap approximation. Mol. Biol. Evol. 2018, 35, 518–522. [Google Scholar] [CrossRef]
  29. Letunic, I.; Bork, P. Interactive Tree of Life (iTOL) v4: Recent updates and new developments. Nucleic Acids Res. 2019, 47, W256–W259. [Google Scholar] [CrossRef]
  30. Blom, N.; Sicheritz-Pontén, T.; Gupta, R.; Gammeltoft, S.; Brunak, S. Prediction of post-translational glycosylation and phosphorylation of proteins from the amino acid sequence. Proteomics 2004, 4, 1633–1649. [Google Scholar] [CrossRef] [PubMed]
  31. Musavizadeh, Z.; Najafi-Zarrini, H.; Kazemitabar, S.K.; Hashemi, S.H.; Faraji, S.; Barcaccia, G.; Heidari, P. Genome-Wide Analysis of Potassium Channel Genes in Rice: Expression of the OsAKT and OsKAT Genes under Salt Stress. Genes 2021, 12, 784. [Google Scholar] [CrossRef] [PubMed]
  32. Puresmaeli, F.; Heidari, P.; Lawson, S. Insights into the Sulfate Transporter Gene Family and Its Expression Patterns in Durum Wheat Seedlings under Salinity. Genes 2023, 14, 333. [Google Scholar] [CrossRef] [PubMed]
  33. Chen, C.; Chen, H.; Zhang, Y.; Thomas, H.R.; Frank, M.H.; He, Y.; Xia, R. TBtools: An Integrative Toolkit Developed for Interactive Analyses of Big Biological Data. Mol. Plant 2020, 13, 1194–1202. [Google Scholar] [CrossRef] [PubMed]
  34. Bailey, T.L.; Boden, M.; Buske, F.A.; Frith, M.; Grant, C.E.; Clementi, L.; Ren, J.; Li, W.W.; Noble, W.S. MEME SUITE: Tools for motif discovery and searching. Nucleic Acids Res. 2009, 37, W202–W208. [Google Scholar] [CrossRef] [PubMed]
  35. Lescot, M.; Déhais, P.; Thijs, G.; Marchal, K.; Moreau, Y.; Van de Peer, Y.; Rouzé, P.; Rombauts, S. PlantCARE, a database of plant cis-acting regulatory elements and a portal to tools for in silico analysis of promoter sequences. Nucleic Acids Res. 2002, 30, 325–327. [Google Scholar] [CrossRef] [PubMed]
  36. Szklarczyk, D.; Gable, A.L.; Lyon, D.; Junge, A.; Wyder, S.; Huerta-Cepas, J.; Simonovic, M.; Doncheva, N.T.; Morris, J.H.; Bork, P.; et al. STRING v11: Protein–protein association networks with increased coverage, supporting functional discovery in genome-wide experimental datasets. Nucleic Acids Res. 2019, 47, D607–D613. [Google Scholar] [CrossRef] [PubMed]
  37. Shannon, P.; Markiel, A.; Ozier, O.; Baliga, N.S.; Wang, J.T.; Ramage, D.; Amin, N.; Schwikowski, B.; Ideker, T. Cytoscape: A software environment for integrated models of biomolecular interaction networks. Genome Res. 2003, 13, 2498–2504. [Google Scholar] [CrossRef]
  38. Kelley, L.A.; Mezulis, S.; Yates, C.M.; Wass, M.N.; Sternberg, M.J.E. The Phyre2 web portal for protein modeling, prediction and analysis. Nat. Protoc. 2015, 10, 845–858. [Google Scholar] [CrossRef]
  39. Untergasser, A.; Cutcutache, I.; Koressaar, T.; Ye, J.; Faircloth, B.C.; Remm, M.; Rozen, S.G. Primer3--new capabilities and interfaces. Nucleic Acids Res. 2012, 40, e115. [Google Scholar] [CrossRef]
  40. Livak, K.J.; Schmittgen, T.D. Analysis of relative gene expression data using real-time quantitative PCR and the 2(-Delta Delta C(T)) Method. Methods 2001, 25, 402–408. [Google Scholar] [CrossRef]
  41. Li, L.; Zhang, C.; Zhang, M.; Yang, C.; Bao, Y.; Wang, D.; Chen, Y.; Chen, Q. Genome-Wide Analysis and Expression Profiling of the Phospholipase D Gene Family in Solanum tuberosum. Biology 2021, 10, 741. [Google Scholar] [CrossRef]
  42. Qin, C.; Wang, X. The Arabidopsis Phospholipase D Family. Characterization of a Calcium-Independent and Phosphatidylcholine-Selective PLDζ1 with Distinct Regulatory Domains. Plant Physiol. 2002, 128, 1057. [Google Scholar] [CrossRef] [PubMed]
  43. Chen, L.; Cao, B.; Han, N.; Tao, Y.; Zhou, S.F.; Li, W.C.; Fu, F.L. Phospholipase D family and its expression in response to abiotic stress in maize. Plant Growth Regul. 2017, 81, 197–207. [Google Scholar] [CrossRef]
  44. Faraji, S.; Ahmadizadeh, M.; Heidari, P. Genome-wide comparative analysis of Mg transporter gene family between Triticum turgidum and Camelina sativa. BioMetals 2021, 4, 639–660. [Google Scholar] [CrossRef] [PubMed]
  45. Gao, X.; Liu, J.; Yu, L.; Yuan, B.; Wang, X.; Zhang, X. Genome-wide identification and expression analysis of APX gene family in Taraxacum kok-saghyz. Acta Bot.-Boreali-Occident. Sin. 2019, 39, 1935–1942. [Google Scholar]
  46. Juretic, N.; Hoen, D.R.; Huynh, M.L.; Harrison, P.M.; Bureau, T.E. The evolutionary fate of MULE-mediated duplications of host gene fragments in rice. Genome Res. 2005, 15, 1292–1297. [Google Scholar] [CrossRef] [PubMed]
  47. Faraji, S.; Filiz, E.; Kazemitabar, S.K.; Vannozzi, A.; Palumbo, F.; Barcaccia, G.; Heidari, P. The AP2/ERF Gene Family in Triticum durum: Genome-Wide Identification and Expression Analysis under Drought and Salinity Stresses. Genes 2020, 11, 1464. [Google Scholar] [CrossRef]
  48. Wang, Y.; Tang, H.; DeBarry, J.D.; Tan, X.; Li, J.; Wang, X.; Lee, T.; Jin, H.; Marler, B.; Guo, H. MCScanX: A toolkit for detection and evolutionary analysis of gene synteny and collinearity. Nucleic Acids Res. 2012, 40, e49. [Google Scholar] [CrossRef]
  49. Heidari, P.; Hasanzadeh, S.; Faraji, S.; Ercisli, S.; Mora-Poblete, F. Genome-Wide Characterization of the Sulfate Transporter Gene Family in Oilseed Crops: Camelina sativa and Brassica napus. Plants 2023, 12, 628. [Google Scholar] [CrossRef]
  50. Liu, B.; Yao, L.; Wang, W.; Gao, J.; Chen, F.; Wang, S.; Xu, Y.; Tang, L.; Jia, Y. Molecular cloning and characterization of phospholipase D from Jatropha curcas. Mol. Biol. Rep. 2010, 37, 939–946. [Google Scholar] [CrossRef]
  51. McDermott, M.I.; McDermott, M.; Wakelam, M.J.; Morris, A.J. Phospholipase D. Biochem. Cell Biol. 2004, 82, 225–253. [Google Scholar] [CrossRef]
  52. Ben Othman, A.; Ellouzi, H.; Planchais, S.; De Vos, D.; Faiyue, B. Phospholipases Df1 and Df2 have distinct roles in growth and antioxidant systems in Arabidopsis thaliana responding to salt stress. Planta 2017, 246, 721–735. [Google Scholar] [CrossRef]
  53. Ahmadizadeh, M.; Rezaee, S.; Heidari, P. Genome-wide characterization and expression analysis of fatty acid desaturase gene family in Camelina sativa. Gene Rep. 2020, 21, 100894. [Google Scholar] [CrossRef]
  54. Yaghobi, M.; Heidari, P. Genome-Wide Analysis of Aquaporin Gene Family in Triticum turgidum and Its Expression Profile in Response to Salt Stress. Genes 2023, 14, 202. [Google Scholar] [CrossRef] [PubMed]
  55. Arab, M.; Najafi Zarrini, H.; Nematzadeh, G.; Heidari, P.; Hashemipetroudi, S.H.; Kuhlmann, M. Comprehensive Analysis of Calcium Sensor Families, CBL and CIPK, in Aeluropus littoralis and Their Expression Profile in Response to Salinity. Genes 2023, 14, 753. [Google Scholar] [CrossRef]
  56. Darwish, E.; Testerink, C.; Khalil, M.; El-Shihy, O.; Munnik, T. Phospholipid Signaling Responses in Salt-Stressed Rice Leaves. Plant Cell Physiol. 2009, 50, 986–997. [Google Scholar] [CrossRef] [PubMed]
  57. Li, W.; Li, M.; Zhang, W.; Welti, R.; Wang, X. The plasma membrane-bound phospholipase Ddelta enhances freezing tolerance in Arabidopsis thaliana. Nat. Biotechnol. 2004, 22, 427–433. [Google Scholar] [CrossRef] [PubMed]
Figure 1. Phylogenetic tree of PLD gene family in five plant species. The potential phosphorylation sites in PLD proteins. Subfamilies of PLD including gamma, delta, beta, alpha, and zeta are highlighted around phylogenetic tree. PLDs from C. sativa (started with Csa), Arabidopsis (started with AT), B. napus (started with Bna), O. sativa (started with Os), and G. max (started with GLY) are studied.
Agronomy 13 02616 g001
Figure 2. Distribution of the conserved motifs into protein sequence of PLD gene family. Subfamilies of PLD including gamma, delta, beta, alpha, and zeta are highlighted according to phylogeny analysis.
Agronomy 13 02616 g002
Figure 3. Distribution of PLD family members in chromosomes of Camelina sativa (a) and Brassica napus (b). Gray lines show the duplicated genes. More details are presented in Table S3.
Agronomy 13 02616 g003
Figure 4. Frequency of the putative cis-regulatory elements based on their function in the upstream region of CsPLDs (a) and BnPLDs (b). More details are presented in Table S4.
Agronomy 13 02616 g004
Figure 5. Interaction network of CsPLDs (a) and BnPLDs (b). The yellow background is for PLD proteins. nsPLD: non-specific phospholipase; AGPAT: 1-acyl-sn-glycerol-3-phosphate acyltransferase; DAGK: diacylglycerol kinase; GNBP-a: guanine nucleotide-binding protein subunit alpha; GNBP-b: guanine nucleotide-binding protein subunit beta; PAH2: phosphatidic acid phosphohydrolase 2; LPP2: lipid phosphate phosphatase 2; LPAT2: lysophosphatidyl acyltransferase 2; MGD3: monogalactosyldiacylglycerol synthase type C; PAP2: phosphatidic acid phosphatase.
Agronomy 13 02616 g005
Figure 6. 3D structure and pocket sites of candidate PLD subfamilies. The binding residues are shown on protein structure.
Agronomy 13 02616 g006
Figure 7. Expression profile of CsPLDs in different tissues and developmental stages of C. sativa. Data were collected based on the available RNA-seq information.
Agronomy 13 02616 g007
Figure 8. Expression profile of BnPLDs in different tissues and developmental stages of B. napus. Data were collected based on the available RNA-seq information.
Agronomy 13 02616 g008
Figure 9. Expression analysis of six CsPLDs in response to salinity stress. Asterisks, * and **, show significant differences p < 0.05 and p < 0.01, respectively, based on Student’s t-tests.
Agronomy 13 02616 g009
Table 1. Summary of physiochemical properties of PLD family members in five plant species. Full details for CsPLDs and BnPLDs are presented in Table S2.
PlantProtein LengthExon NumberMW (KDa)pIGRAVYStability
Camelina sativa350–15963–2740.02–181.625.57–9.09−0.655, −0.31633%
Brassica napus213–14652–2224.66–164.785.10–10.30−0.682, −0.24761%
Glycine max711–11263–2281.22–127.635.48–7.65−0.532, −0.37425%
Arabidopsis thaliana762–11084–2086.99–124.735.53–8.36−0.555, −0.34375%
Oryza sativa355–10461–1239.31–116.935.56–11.23−0.622, −0.14767%
Disclaimer/Publisher’s Note: The statements, opinions and data contained in all publications are solely those of the individual author(s) and contributor(s) and not of MDPI and/or the editor(s). MDPI and/or the editor(s) disclaim responsibility for any injury to people or property resulting from any ideas, methods, instructions or products referred to in the content.

