

Effects of Organic Liquid Waste Derived from Bioethanol Fermentation on Corn Production

1
Kochi Prefectural Agricultural Research Center, 1100 Hataeda, Nankoku 783-0023, Kochi, Japan
2
Research Faculty of Agriculture, Hokkaido University, Kita-9, Nishi-9, Kita-ku, Sapporo 060-8589, Hokkaido, Japan
3
Nippon Steel & Sumikin Engineering Co., Ltd., 1-5-1, Oosaki, Shinagawa, Tokyo 141-8604, Japan
4
Graduate School of Agriculture, Ehime University, 3-5-7 Tarumi, Matsuyama 790-8566, Ehime, Japan
*
Author to whom correspondence should be addressed.
Agronomy 2023, 13(12), 2904; https://doi.org/10.3390/agronomy13122904
Submission received: 28 September 2023
/
Revised: 13 November 2023
/
Accepted: 23 November 2023
/
Published: 26 November 2023
(This article belongs to the Special Issue Bio-Based Fertilizers in Agriculture: New Opportunities and Challenges)
Abstract
:The liquid waste (LW) discharged during bioethanol production needs treatment. In this study, LW was applied to corn, and its effects on corn growth, yield, and nitrogen (N) content, as well as on soil chemical properties, were evaluated. Five treatments were applied during corn cultivation: no fertilizer (NF), chemical fertilizer (CF), LW at a standard application rate (LW1.0), LW at 1.7 times the rate of LW1.0 (LW1.7), and split application of LW1.7 (S-LW1.7) in six replications. The amount of N applied was 30 kg 10a−1 for CF and LW1.0, and 51 kg 10a−1 for LW1.7 and S-LW1.7. N was applied separately three times in CF, LW1.0, and LW1.7 and six times in S-LW1.7. A higher corn yield, corn ear weight, and number of leaves was observed in LW treatments than in CF. N content of the corn plant top was higher in S-LW1.7 than in LW1.7; N availability was 56.9% and 40.5% higher, respectively, indicating that split application improved N availability. Soil total N content increased significantly in LW treatments, and soil total carbon content tended to increase in S-LW1.7. Therefore, application of LW could increase corn yield and soil fertility, and its effect could be enhanced by split application.
1. Introduction
There is a growing interest in sustainable agricultural development, and research on energy production from biomass and the effective use of waste as a fertilizer and soil improvement material has attracted attention. Bioethanol, which is produced from sugar and starch crops, can potentially contribute to sustainable agriculture because it is an energy source that does not require easily depletable resources, but it is also problematic because the final byproduct of bioethanol production is a liquid waste (LW), known as vinasse. LW has a low pH and a high salinity, chemical oxygen demand, and biochemical oxygen demand, and the indiscriminate disposal of this LW in soil or waterbodies causes environmental pollution [1,2]. However, LW may be beneficial for plant cultivation owing to its high content of poly-elements and organic matter, mainly nitrogen (N) and potassium (K) [3,4]. For every 1 L of bioethanol produced, 9–14 L of LW is discharged, depending on the distillery equipment, and it was estimated that approximately six trillion liters would need to be managed worldwide in 2023 [5]. Since the demand for energy from biomass is expected to increase in the future, research on the effective use of LW is required.
The effective use of LW after bioethanol distillation has been investigated in various research fields, including conversion to biogas [6,7,8], application to animal and fish feed [9,10,11], and extraction of protein, pectin, and flavor compounds [12,13,14]. In agriculture, the potential use of LW from bioethanol distillation as a fertilizer has attracted much attention, and studies on the effects of its application on plants and soil have been conducted using LW from sugarcane [15,16,17] and beets [18,19,20]. Some studies have evaluated the possibility of using LW as fertilizer; however, LW must be diluted below a certain concentration level at the laboratory or pot level [21,22,23,24,25]. Some studies based on field trials suggest that LW application increased crop growth and yield. Huda and Elmasry (2021) [26] reported that LW application improved parameters such as plant height, leaf area, and N and phosphorus (P) contents in the corn ear and leaf and increased yield compared to chemical fertilizers. In some cases, LW application increased sugarcane yield by more than 10% [27]. Other cases used mixtures of LW with other materials. The application of composted LW increased the yields of corn, sugar beet, and sunflower [20]. Fertilizers that were formulated by mixing LW with industrial and agricultural wastes had a favorable effect on tomato growth [28,29]. LW has also been suggested to improve soil properties; acidifying C, humic acid C, and Kjeldahl N contents increased in soils treated with LW compost [20]. The application of LW compost, LW, and sugar beet plant lime, in that order, increased soil organic matter, N, P, and K contents, and water-holding capacity and decreased soil bulk density and hydraulic conductivity [30]. However, a few studies suggest that its application may degrade crop yield and soil properties [31,32,33,34]. This indicates that the use of distillate wastewater may be beneficial to cultivated crops and soils, but to be effective, the type of feedstock, type of crop grown, soil type, and weather conditions, as well as the amount and method of the LW application must be considered.
Ehime Prefecture in Japan is a leading citrus production area, and some of the harvested fruits are processed for juice and other purposes. Since citrus fruits contain a large amount of sugar, a bioethanol production technology has been developed to effectively use citrus molasses derived from their juice residue. During bioethanol production from citrus molasses, nitric acid is added to prevent bacterial growth under acidic conditions, and the LW after distillation is also rich in N. In addition, because LW contains organic matter derived from citrus fruits, it can be used as a fertilizer in the same manner as LW from other crops, as previously reported [35]. However, there are few examples of cultivation using LW from citrus-derived bioethanol distillation, necessitating further research in this regard.
Therefore, in this study, we aimed to examine the effects of citrus-derived bioethanol LW as a fertilizer in corn cultivation; specifically, we assessed corn growth and yield, and soil chemistry. In addition, because it was anticipated that N utilization would be low with liquid fertilizers such as LW, we also established split application and evaluated the improvement in N availability and N use efficiency (NUE) of corn. We verified the effectiveness of LW, after citrus-derived bioethanol distillation, as a liquid fertilizer.
2. Materials and Methods
2.1. Study Site
This study was conducted at Ehime University Farm from 18 May to 6 August 2013. Sweet corn (Zea mays cv. Canberra 90, TAKII & Co., Ltd., Kyoto, Japan) was used as the test plant. Soil pH was 6.4, 20 days before corn sowing. The soil type according to Soil Taxonomy (2nd ed., 1999) belonged to Typic Dystropepts. The texture of the topsoil (0–24 cm) was sandy loam. Carbon (C) and N contents and C/N ratio were 19.4 g kg−1, 2.21 g kg−1, and 9.04, respectively. Soil bulk density and cation exchange capacity were 1.17 g cm−3 and 11.1 cmolc kg−1, respectively. Soil physicochemical properties are listed in Table 1. Daily temperature and precipitation during the corn cultivation period (18 May to 6 August 2013) are shown in Figure 1, and are according to the records of the Matsuyama District Weather Station (33°50.6′ N, 132°46.6′ E; 32.2 m above sea level). Precipitation was heavy during the rainy season in June, and daily mean air temperatures were around 30 °C from early July. At the study site, compared to the average of the past 30 years (1991–2020), precipitation in June was 90 mm higher, while in May and July, it was 75 mm lower. Temperatures in May and June were similar to the average, while those in July and August were more than 1 °C above the average.
2.2. Treatments and Fertilizer Management
Five treatments were established for this study: no fertilizer (NF), chemical fertilizer (CF), LW at a standard application rate (LW1.0), LW at 1.7 times the rate of LW1.0 (LW1.7), and split application of LW1.7 (S-LW1.7). Chemical fertilizer 14–14–14 (containing 14% each of N, P2O5, and K2O) (Shomi Sangyo Co., Ltd., Chiba, Japan) was applied. The LW used in this study was the same as that used by Toma et al. [35] in 2013 with the following physicochemical properties: water 69.4%, total C (TC) 149 g L−1, total N (TN) 17.3 g L−1, C/N ratio 8.62, ammonium N (NH4-N) 0.13 g L−1, nitrate N (NO3-N) 12.9 g L−1, total P 0.81 g L−1, total K 18.6 g L−1, total calcium 20.4 g L−1, and total sodium 0.52 g L−1.
The N input in LW1.0 was the same as that in CF and 1.7 times higher in the LW1.7 and S-LW1.7 treatments than that in CF. The fertilizer was applied separately three times in CF, LW1.0, and LW1.7 and six times in S-LW1.7. CF was applied during rotary tillage (up to ~20 cm in depth) on May 16 as basal fertilizer and applied for topdressing. LW treatments were adjusted to pH 6.5 with calcium hydroxide and applied at LW1.0, LW1.7, and S-LW1.7 diluted 20, 11.8, and 23.5 times with tap water, respectively. The same amount of water was added to NF and CF, the amount of water applied in each treatment was 11.6 L m−2 at 20, 29, 36, 47, 58, and 65 days after sowing (DAS). The test plots were allocated by a completely randomized method, with six replications per treatment (area of plot = 6 m2 per replication) (Table 2).
2.3. Corn Growth and Yield Surveys
Growth was measured in terms of plant height, number of leaves, and soil plant analysis development (SPAD) value in leaves. Leaf counts only considered fully expanded leaves and did not include dead leaves. SPAD value was measured at the base, middle, and tip of the leaf blade using a SPAD-502 leaf color meter (Konica Minolta Sensing Inc., Osaka, Japan). In total, 60 plants in each treatment were evaluated on 3 and 16 June, 1 and 15 July, and 5 August (16, 29, 44, 58, and 79 DAS, respectively). The yield survey was conducted on 6 August. Corn ears from each treatment were harvested, and the fresh weight and number of corn ears were measured.
2.4. Measurement of Soil Chemical Properties and Nitrogen Content in Corn
Soil was sampled from a depth of 0–30 cm in the corn plant lines. Sampling was conducted on 26 May, 23 June, 14 July, and 5 August (8, 36, 57, and 79 DAS, respectively), approximately once per month. Soil pH and NO3-N and NH4-N contents were measured in all samples. Soil TN, TC, and available phosphate (P2O5) contents were measured on 26 May and 5 August. Soil pH was measured by mixing soil with distilled water (soil:water = 1:2.5) and using a pH meter (Twin pH-B-212, HORIBA, Kyoto, Japan). A 10% KCl solution (soil:water = 1:10) was used to extract NO3-N and NH4-N. NO3-N was measured with a colorimetric method using vanadium (III) chloride on a spectrophotometer at 540 nm. NH4-N was measured using the indophenol blue colorimetric method on a spectrophotometer at 630 nm. The sum of the NO3-N and NH4-N concentrations was used as the inorganic N content. A 2.5 M sulfuric acid solution (soil:water = 1:200) was used to extract available P2O5, which was measured via a molybdenum blue colorimetric determination method, using a spectrophotometer at 710 nm. Soil TN and TC contents were measured by grinding air-dried fine soil into fine powder samples using a high-speed vibrating sample mill (VIBRATING SAMPLE MILL, CMT Co., Ltd., Tokyo, Japan) and then analyzed using the dry combustion method [36] with an automatic C-N analyzer (Sumigraph NC-80 auto, Sumika Chemical Analysis Service, Osaka, Japan) and gas chromatograph (GC-8A, Shimadzu Co., Ltd., Kyoto, Japan).
Samples for corn N content were collected on 5 August from three plants from each plot for a total of 90 plants. Samples were separated into stems, leaves, tassels, and ears, dried in a dryer oven (Drying Oven-DX41, Yamato Scientific Co., Tokyo, Japan) or a draft dryer (Forced air drier MOV-212F-PJ/150L, Panasonic Co., Tokyo, Japan) at 70–80 °C for 48 h, and then weighed. Dried samples were first coarsely ground (Repulsion Start Single Phase Induction Motor, Hitachi Co., Ltd., Tokyo, Japan) and then finely ground with a high-speed vibratory sample mill; N content was determined in the same manner as for soil samples.
2.5. Analysis of Nitrogen Availability and Use Efficiency
In a simplified linear equation created for NF and CF, Y = aX + b, where Y in each treatment corresponds to N content in the corn (kg 10a−1), the value of Y − b is the N uptake from fertilizer (kg 10a−1), and X is N input based on CF, which was determined from N content in LW treatments, using the linear equation. N availability was calculated for LW treatments using the following Formula (1):
where N availability refers to the relative N uptake efficiency when the N input in CF is regarded as 100%. In this study, we compared N availability between CF and LW treatments. NUE was also calculated for each treatment except for NF, using the following Formula (2):
where NUE was calculated by dividing the plant dry weight of each treatment by the N input. The dry weight is usually obtained by subtracting from NF [37]; however, as the dry weight of the root was uncertain, this could not be performed. A higher NUE value indicates that the N input contributed to the dry matter production, and it can be used for relative evaluation.
N availability (%) = N input based on CF (kg 10a−1)/N input (kg 10a−1) × 100
NUE (kg DW kg N−1) = dry weight of plant top (kg DW 10a−1)/N input (kg 10a−1)
2.6. Statistical Analysis
All statistical analyses were performed using R (ver. 4.3.1, R Core Team, Vienna, Austria). Comparisons between treatments for corn growth, yield, N content, and soil chemical properties were evaluated using one-way analysis of variance (ANOVA) and post hoc tests (Tukey’s method), at the 5% level of significance.
3. Results
3.1. Corn Growth and Yield
The corn growth and yield results are shown in Table 3 and Figure 2, respectively. Plant height was similar in each treatment until approximately 30 DAS, with NF significantly lower than that in the other treatments at 44 DAS; at 58 DAS, plant height in the CF treatment was significantly higher than that in other treatments. The number of leaves was similar in each treatment until approximately 30 DAS, but the number of leaves in LW1.7 and S-LW1.7 was significantly higher than that in the NF and LW1.0 treatments at 44 DAS. At 58 DAS, the number of leaves in LW1.7 and S-LW1.7 decreased because the lower leaves died and disappeared, and there were no significant differences among the treatments. SPAD value was significantly higher in the CF treatment than in LW1.0 and LW1.7 at 29 DAS and significantly higher than that in the other treatments at 44 and 58 DAS. At 44 and 58 DAS of LW application, similar SPAD values were observed; however, SPAD value in LW1.0 was significantly higher than that in LW1.7 at 44 DAS, and S-LW1.7 at 58 DAS. SPAD value in the NF treatment was significantly lower than that in the other treatments after 44 DAS, and this was maintained until pre-harvest. Measurements at 79 DAS (the day before harvest) showed a decreasing trend in all treatments, with a particularly large decrease in CF and higher SPAD value in S-LW1.7, followed by LW1.7, LW1.0, CF, and NF.
Corn yields were significantly higher in the LW1.0, LW1.7, and S-LW1.7 treatments than in the NF treatment (Figure 2a). In 2021, the average yield of sweet corn in Japan was 1020 kg/ha [38], and in this study, the yield in the four treatments, except for NF, exceeded the average yield. When the ears harvested from each treatment were divided by weight into <100, 100–200, 200–300, and >300 g FW, the weight range in CF had more ears at 100–200 g than that in the other treatments, while that in LW treatments had more ears at >200 g than that in NF and CF (Figure 2b). The number of ears in LW treatments was higher than that observed in NF and CF.
3.2. Nitrogen Content, Availability, and Use Efficiency of Corn
The N content of corn is shown in Figure 3. The N content of corn in the plant top was significantly lower in NF and LW1.0 than in the other treatments. N content in the LW1.7 was significantly lower than that in CF, and N content in S-LW1.7 was similar to that in CF. The N content trends of parts of corn such as stems, leaves and tassels, and ears were similar to those of the plant tops, but there were significant differences between LW1.7 and S-LW1.7. In contrast, N content in the corn ears was similar in CF, LW1.7, and S-LW1.7 and significantly lower in NF and LW1.0. There was no significant difference in N content between NF and LW1.0, but the N content of corn ears in LW1.0 (0.77 g plant−1) tended to be higher than that in NF (0.71 g plant−1).
The N availability and NUE of the corn is shown in Table 4. When the linear equation was obtained based on corn N content and N input in NF and CF, the N availability values were 45.1%, 40.5%, and 56.9% in the LW1.0, LW1.7, and S-LW1.7, respectively, when the N input in CF was regarded as 100%. NUE was 40.3, 32.2, 23.5, and 25.1 g DW g N−1 in CF, LW1.0, LW1.7, and S-LW1.7, respectively. The NUE in LW1.0 was approximately 20% lower than that in CF. The NUE in S-LW1.7 was approximately 7% higher than that in LW1.7.
3.3. Soil Chemical Properties
Soil pH and inorganic N content in the soil are shown in Figure 4. Soil pH was significantly lower in CF than in the other treatments except at 36 DAS, and at 79 DAS, when it was 5.7, confirming soil acidification (Figure 4a). In LW1.0, LW1.7, and S-LW1.7, no decrease in pH was observed, and the pH was similar to or higher than that in NF. Soil inorganic N content was significantly higher in CF than in NF at 8 and 79 DAS (Figure 4b). In contrast, LW1.0, LW1.7, and S-LW1.7 showed no significant differences compared to NF throughout the growing season and the pH values tended to be similar to those in NF.
Soil TN, TC, and available P2O5 contents at the initial stage and harvest are shown in Figure 5. Post-cultivation soil TN content in LW treatments ranged from 1.94 to 2.16 g kg−1 and was significantly higher than that in the test soil (1.57 g kg−1) (Figure 5a). The post-cultivation soil TC content was not significantly different among the treatments (Figure 5b). However, soil TC content in LW treatments was 17.0–17.7 g kg−1 compared to that in the pre-cultivation soil (16.2 g kg−1), and an increasing trend in soil TC was observed with LW application. Soil-available P2O5 content did not change significantly before or after cultivation, ranging from 81.2 to 92.6 mg 100 g−1 (Figure 5c). Soil-available P2O5 content was high in all treatments in this study.
4. Discussion
This study evaluated the effects of LW application on corn growth, yield, N content, and soil chemical properties. LW application can contribute to sustainable agriculture by reducing the amount of waste and providing organic matter in the soil. However, if LW has a negative impact on corn growth and yield, its use is not practical. Previous studies have reported improved corn growth and yield when liquid fertilizer was applied instead of N [26] and K fertilizers [25]. In this study, the application of LW showed that corn growth was similar to that in CF, while corn yield and weight per ear tended to be higher than in CF. In general, corn yield increased with increased P2O5 uptake [39]. Interestingly, higher corn yields were obtained in LW treatments, even though P2O5 input in LW treatments was approximately 10–20% of that in CF. A possible explanation for P2O5 supply to corn is that either soil enzymes made organic P available or soil-available P2O5 contributed to the process. Many studies have shown that soil phosphatase activity is maintained or decreased after LW application [15,19,31]. In contrast, soil-available P2O5 content was high in all treatments, suggesting that soil-available P2O5 was likely taken by the corn in this study. The reason for the higher yield in LW treatments than that in CF could be related to the increased organic matter content and soil microorganisms. LW application increases bacterial and actinomycete abundance in the soil and increases bacterial diversity [15,32,40,41]. Plant-growth-promoting bacteria increase corn yield by solubilizing organic P [39]. This suggests that LW application may alter soil microbial biomass and community structure to solubilize organic P, but additional research is needed in this regard. In some cases, yields increased following the application of organic matter. Although LW is rich in organic matter, Xu [42] showed that the application of effective microorganisms, along with organic matter, promotes the growth and activity of sweet corn roots and increases grain yield by improving photosynthetic capacity. Overall, these results indicate that the application of LW altered microbial biomass and community structure, promoted soil enzyme and corn root activity, and contributed to favorable conditions for growth and yield.
When LW was applied, the N availability was lower than that in CF at 40.5–56.9%. The NUE in LW treatments (23.4–32.2 kg DW kg N−1) was also lower than that in CF (40.2 kg DW kg N−1). These results may have been due to the difference in N forms. The predominant N form in LW was NO3-N (74.5%), whereas that in CF was NH4-N (100%). NO3-N is an N form that is less easily retained in the soil than NH4-N and more likely leached from the soil surface; hence, LW may be more prone to N leaching. In fact, N leaching rates have been reported to be higher for NO3-N-dominated LW (27.0%) than for NH4-N-dominated synthetic organic fertilizers (10.5%) [35]. Therefore, the difference in N availability and NUE between LW treatments and CF was suggested to be due to the difference in N forms in this study. The split application such as S-LW1.7 may be an effective application to increase N availability and NUE because it can reduce N losses due to NO3-N leaching. Kheir and Kamara [30] reported that to effectively use LW in sandy soils, a mixture of lime and LW from the sugar beet must be applied. The application of a combination of mixed lime compost and LW increased soil organic matter content, soil effective multiple elements, and water-retention capacity. Cerri et al. [43] reported that combining sugarcane vinasse with pectin and chitosan could decrease the water evaporation rate in sandy soil under water-stress conditions. In the future, in sandy soils with low nutrient-retention and water-retention capacity, it will be necessary to devise ways to reduce water loss and supply water to plants more efficiently by using these combined materials. There are more examples of these combinations; for example, the use of press-mud and filter cake, which are byproducts in the sugar industry, combined with LW, has favorable effects on crop growth and yield, soil N and C contents, and soil biomass N and C contents [15,28,29]. Furthermore, research has been conducted to prepare solid fertilizers from LW [28,29] and to develop organic mineral fertilizers [44,45]. N availability and NUE in this study could be improved by applying these technologies. Notably, Tejada and Gonzalez [32,46] reported adverse effects on soil physicochemical properties, crop nutrient uptake, and yield when beet-derived LW was applied at high doses due to high input of sodium ions. The sodium concentration of beet-derived LW was 26 g L−1 [46], whereas that of citrus-derived LW used in this study was 0.52 g L−1 [35], indicating the sodium concentration of citrus-derived LW was approximately 1/50th of that of beet-derived LW. This suggests that citrus-derived LW is unlikely to have the adverse effects reported for beet-derived LW, even when applied at high doses. In fact, no adverse effect in soil or crop was observed for LW1.7 or S-LW1.7, corresponding to the high application of LW in this study. This indicates that it is possible to increase the application amount of citrus-derived LW, considering its low N availability and NUE.
Soil pH during corn cultivation decreased in CF, but it did not decrease when LW was applied. In general, soil acidification is due to the release of protons by nitrification and the discharge of accompanying ions by NO3-N leaching [47]. The N form of CF was mostly NH4-N, whereas that of LW had a large proportion of NO3-N (74.5%) and a small proportion of NH4-N (0.736%). Therefore, it can be inferred that most of the fertilized N in CF acidified the soil due to nitrification, whereas that in LW caused little nitrification and did not acidify the soil. This suggests that the difference in soil pH between LW treatments and CF was due to the difference in N forms and that the soil in CF may have been acidified mainly by the release of protons associated with nitrification. However, since NO3-N-dominated LW is more prone to N leaching than NH4-N-dominated fertilizers [36], NO3-N leaching may have caused soil acidification in LW treatments. Nevertheless, the soil in the LW treatments was probably not acidified because the pH was adjusted with calcium hydroxide during LW application and the pH buffering capacity in the soil was enhanced by the addition of organic matter. Jiang et al. [3] reported that when LW was continuously applied to sugarcane fields for 2–3 years, no acidification of the soil was observed. Mattiazzo and Glória [48] reported that the application of LW to agricultural fields increased the pH due to the oxidation of organic matter caused by microbial activity, and this finding corresponds to the results of the current study.
Moreover, it was suggested that the application of LW could increase soil TN and TC contents after cultivation, which may contribute to the maintenance and improvement of soil fertility. Madejón et al. [20] reported that a combination of concentrated beet vinasse and solid waste applied to soil for two years increased acidifying C, humic C, and N contents in soil. Tejada and Gonzalez [32] reported that applying the appropriate amount of beet vinasse increased soil microbial biomass and NO3-N content in the soil due to the mineralization of its organic matter. In this study, soil NO3-N content was low throughout the corn growing season, and the presence or absence of N mineralization could not be determined. However, the increase in soil N and C contents was consistent with that observed in previous studies [15,20]. This suggests that the application of LW may contribute to an increase in N and C contents through the input of organic matter and increased microbial biomass in the soil. N release from organic matter applied to the soil is generally slow; therefore, it rarely affects crop growth in the short term [49]. However, although the current study was a short-term (one-year) one, corn growth and yield, as well as soil N and C contents, were found to be enhanced by the application of LW. This may be because the N form of LW was mainly NO3-N, which is easily available to corn and soil microorganisms. In addition, LW contained approximately 25% organic N and high organic matter. Since N derived from organic matter fixed in soil contributes to crop growth and soil fertility in the long term [49], long-term application of LW may enhance soil fertility. A study conducted by Huang et al. [50] on corn yield and soil properties in a long-term inorganic fertilizer and compost application series reported that compost application treatments increased soil organic C and N contents. This suggests that long-term application of LW rich in organic matter may increase soil C and N contents and improve fertility.
5. Conclusions
In this study, the use of LW derived from citrus bioethanol distillation as liquid fertilizer had positive effects on corn growth and yield. However, N availability and NUE of the LW treatment was lower than that of CF, which was improved by split application of LW but was still lower than that of CF. Since low N availability and NUE may lead to environmental impact as well as fertilizer loss, the N availability and NUE of LW may be improved by considering the use of LW in combination with other materials or the development of solid fertilizers, as in other studies. LW application was also found to improve soil chemical properties. LW treatments tended to reduce soil acidification and increase soil TN and TC contents more than NF and CF, suggesting that long-term application of LW may contribute to improving and maintaining soil fertility. Therefore, the use of LW is highly valuable not only for reducing waste but also for providing fertilizer to plants and improving soil fertility, and further improvement of N availability and NUE should be considered in the future. Furthermore, because this study was only a one-year trial, a long-term study should be the potential next step.
Author Contributions
All the authors conceived and designed the experiments; N.M., Y.T. and H.U. performed the experiments and analyzed the data; all authors contributed reagents/materials/analysis tools and wrote the paper. All authors have read and agreed to the published version of the manuscript.
Funding
This study was supported by Nippon Steel & Sumikin Engineering Co., Ltd. and Grant-in-Aid for Scientific Research (C), JSPS KAKENHI Grant Number JP23510008.
Data Availability Statement
Data are contained within the article.
Acknowledgments
We would like to thank Yoichi Yamashita, Masataka Adachi, and Keiji Ishikake at the University Farm, Faculty of Agriculture, Ehime University for their technical assistance.
Conflicts of Interest
Author Yasuhiko Kato and Tooru Izumiya was employed by Nippon Steel & Sumikin Engineering Co., Ltd. The remaining authors declare no conflict of interest. The authors declare that this study received funding from Nippon Steel & Sumikin Engineering Co., Ltd. The funder was not involved in the study design, collection, analysis, interpretation of data, the writing of this article or the decision to submit it for publication.
References
- Fuess, L.T.; Rodrigues, I.J.; Garcia, M.L. Fertirrigation with sugarcane vinasse: Foreseeing potential impacts on soil and water resources through vinasse characterization. J. Environ. Sci. Health A Tox. Hazard. Subst. Environ. Eng. 2017, 52, 1063–1072. [Google Scholar] [CrossRef] [PubMed]
- Christofoletti, C.A.; Escher, J.P.; Correia, J.E.; Marinho, J.F.U.; Fontanetti, C.S. Sugarcane vinasse: Environmental implications of its use. Waste Manag. 2013, 33, 2752–2761. [Google Scholar] [CrossRef]
- Jiang, Z.P.; Li, Y.R.; Wei, G.P.; Liao, Q.; Su, T.M.; Meng, Y.C.; Zhang, H.Y.; Lu, C.Y. Effect of long-term vinasse application on physico-chemical properties of sugarcane field soils. Sugar Tech. 2012, 14, 412–417. [Google Scholar] [CrossRef]
- Carpanez, T.G.; Moreira, V.R.; Assis, I.R.; Amaral, M.C.S. Sugarcane vinasse as organo-mineral fertilizers feedstock: Opportunities and environmental risks. Sci. Total Environ. 2022, 832, 154998. [Google Scholar] [CrossRef] [PubMed]
- Rachman, L.M.; Hartono, A.; Hazra, F.; Noorwicaksono, T.; Wasono, K.B.; Adityasari, A.D.; Prabowo, B.; Putri, N.; Davik. Essence, principle, and technique in utilization and converting vinasse waste to bio-organic fertilizer. IOP Conf. Ser. Earth Environ. Sci. 2023, 1133, 012023. [Google Scholar] [CrossRef]
- Kulichkova, G. Comparative characteristics of native (liquid) and concentrated up to 40% vinasse as a raw material for anaerobic fermentation. Eureka LS 2022, 6, 25–35. [Google Scholar] [CrossRef]
- Moraes, B.S.; Triolo, J.M.; Lecona, V.P.; Zaiat, M.; Sommer, S.G. Biogas production within the bioethanol production chain: Use of co-substrates for anaerobic digestion of sugar beet vinasse. Bioresour. Technol. 2015, 190, 227–234. [Google Scholar] [CrossRef]
- Nunes Ferraz Junior, A.D.N.F.; Etchebehere, C.; Perecin, D.; Teixeira, S.; Woods, J. Advancing anaerobic digestion of sugarcane vinasse: Current development, struggles and future trends on production and end-uses of biogas in Brazil. Renew. Sustain. Energy Rev. 2022, 157, 112045. [Google Scholar] [CrossRef]
- Ahmed, O.; Sulieman, A.M.E.; Elhardallou, S.B. Physicochemical, chemical and microbiological characteristics of vinasse, A by-product from ethanol industry. Am. J. Biochem. Biotechnol. 2013, 3, 80–83. [Google Scholar] [CrossRef]
- Karimi, S.; Mahboobi Soofiani, N.M.; Lundh, T.; Mahboubi, A.; Kiessling, A.; Taherzadeh, M.J. Evaluation of filamentous fungal biomass cultivated on vinasse as an alternative nutrient source of fish feed: Protein, lipid, and mineral composition. Fermentation 2019, 5, 99. [Google Scholar] [CrossRef]
- dos Reis, K.C.; Coimbra, J.M.; Duarte, W.F.; Schwan, R.F.; Silva, C.F. Biological treatment of vinasse with yeast and simultaneous production of single-cell protein for feed supplementation. Int. J. Environ. Sci. Technol. 2019, 16, 763–774. [Google Scholar] [CrossRef]
- Peng, L.; Kong, X.; Wang, Z.; Ai-lati, A.; Ji, Z.; Mao, J. Baijiu vinasse as a new source of bioactive peptides with antioxidant and anti-inflammatory activity. Food Chem. 2021, 339, 128159. [Google Scholar] [CrossRef] [PubMed]
- Kaishev, A.S.; Kaisheva, N.S.; Larsky, M.V.; Karpenko, V.A. Processing of after-alcohol vinasse for environmentally friendly environment. IOP Conf. Ser. Earth Environ. Sci. 2022, 1052, 012118. [Google Scholar] [CrossRef]
- Xu, H.; Xu, X.; Tao, Y.; Yuan, F.; Gao, Y. Optimization by response surface methodology of supercritical carbon dioxide extraction of flavour compounds from Chinese liquor vinasse. Flavour Fragr. J. 2015, 30, 275–281. [Google Scholar] [CrossRef]
- Yang, S.D.; Liu, J.X.; Wu, J.; Tan, H.W.; Li, Y.R. Effects of vinasse and press mud application on the biological properties of soils and productivity of sugarcane. Sugar Tech. 2013, 15, 152–158. [Google Scholar] [CrossRef]
- Gallucci, A.D.; Natera, M.; Moreira, L.A.; Nardi, K.T.; Altarugio, L.M.; de Mira, A.B.; de Almeida, R.F.; Otto, R. Nitrogen-enriched vinasse as a means of supplying nitrogen to sugarcane fields: Testing the effectiveness of N source and application rate. Sugar Tech. 2019, 21, 20–28. [Google Scholar] [CrossRef]
- Otto, R.; de Freitas Júnior, J.C.M.; Zavaschi, E.; de Faria, I.K.P.; Paiva, L.A.; Bazani, J.H.; de Mira, A.B.; Kamogawa, M.Y. Combined application of concentrated vinasse and nitrogen fertilizers in sugarcane: Strategies to reduce ammonia volatilization losses. Sugar Tech. 2017, 19, 248–257. [Google Scholar] [CrossRef]
- Assimakopoulos, J.H. Effect of sodium-vinasse application on seed germination and growth of three species differing in salt tolerance. Commun. Soil Sci. Plant Anal. 2000, 31, 2803–2818. [Google Scholar] [CrossRef]
- Tejada, M.; Gonzalez, J.L.; García-Martínez, A.M.; Parrado, J. Application of a green manure and green manure composted with beet vinasse on soil restoration: Effects on soil properties. Bioresour. Technol. 2008, 99, 4949–4957. [Google Scholar] [CrossRef]
- Madejón, E.; López, R.; Murillo, J.M.; Cabrera, F. Agricultural use of three (sugar-beet) vinasse composts: Effect on crops and chemical properties of a cambisol soil in the Guadalquivir River valley (SW Spain). Agric. Ecosyst. Environ. 2001, 84, 55–65. [Google Scholar] [CrossRef]
- Sahai, R.; Shukla, N.; Jabeen, S.; Saxena, P.K. Pollution effect of distillery waste on the growth behaviour of Phaseolus radiatus L. Environ. Pollut. Ser. A Ecol. Biol. 1985, 37, 245–253. [Google Scholar] [CrossRef]
- Srivastava, N.; Sahai, R. Effects of distillery waste on the performance of Cicer arietinum L. Environ. Pollut. 1987, 43, 91–102. [Google Scholar] [CrossRef] [PubMed]
- Kannan, A.; Upreti, R.K. Influence of distillery effluent on germination and growth of mung bean (Vigna radiata) seeds. J. Hazard. Mater. 2008, 153, 609–615. [Google Scholar] [CrossRef] [PubMed]
- Algur, Ö.F.; Kadioǧlu, A. The effects of vinasse on the growth, biomass and primary productivity in pea (Pisum sativum) and sunflower (Helianthus annuus). Agric. Ecosyst. Environ. 1992, 39, 139–144. [Google Scholar] [CrossRef]
- Bastos, A.V.S.; Teixeira, M.B.; Soares, F.A.L.; da Silva, E.C.; dos Santos, L.N.S.; Gomes, F.H.F. Immediate and residual effects of mineral and organomineral nitrogen sources associated with concentrated vinasse on maize. J. Soil Sci. Plant Nutr. 2021, 21, 1382–1396. [Google Scholar] [CrossRef]
- Elmasry, H.M.M. Partial substitution of maize mineral fertilization with some organic and bio-fertilizers. IJAAS 2021, 2, 103–113. [Google Scholar] [CrossRef]
- de Resende, A.S.; Xavier, R.P.; de Oliveira, O.C.; Urquiaga, S.; Alves, B.J.R.; Boddey, R.M. Long-term effects of pre-harvest burning and nitrogen and vinasse applications on yield of sugar cane and soil carbon and nitrogen stocks on a plantation in Pernambuco, N.E. Brazil. Plant Soil 2006, 281, 339–351. [Google Scholar] [CrossRef]
- Kusumaningtyas, R.D.; Oktafiani, O.; Hartanto, D.; Handayani, P.A. Effects of solid vinasse-based organic fertilizer on some growth indices of tomato plant. J. Bahan Alam Terbarukan 2017, 6, 190–197. [Google Scholar] [CrossRef]
- Kusumaningtyas, R.D.; Hartanto, D.; Rohman, H.A.; Mitamaytawati; Qudus, N.; Daniyanto. Valorization of sugarcane-based bioethanol industry waste (vinasse) to organic fertilizer. Valoris. Agro-Ind. Resid. 2020, 2, 203–223. [Google Scholar] [CrossRef]
- Kheir, A.; Kamara, M. Effects of sugar beet factory lime, vinasse, and compost mixed with vinasse application on sandy soil properties and canola productivity. J. Soil Sci. Agric. Eng. 2019, 10, 69–77. [Google Scholar] [CrossRef]
- Tejada, M.; Moreno, J.L.; Hernandez, M.T.; Garcia, C. Application of two beet vinasse forms in soil restoration: Effects on soil properties in an arid environment in southern Spain. Agric. Ecosyst. Environ. 2007, 119, 289–298. [Google Scholar] [CrossRef]
- Tejada, M.; Gonzalez, J.L. Beet vinasse applied to wheat under dryland conditions affects soil properties and yield. Eur. J. Agron. 2005, 23, 336–347. [Google Scholar] [CrossRef]
- Tejada, M.; Garcia, C.; Gonzalez, J.L.; Hernandez, M.T. Organic amendment based on fresh and composted beet vinasse. Soil Sci. Soc. Am. J. 2006, 70, 900–908. [Google Scholar] [CrossRef]
- Tejada, M.; Gonzalez, J.L. Application of different organic wastes on soil properties and wheat yield. Agron. J. 2007, 99, 1597–1606. [Google Scholar] [CrossRef]
- Toma, Y.; Higuchi, T.; Nagata, O.; Kato, Y.; Izumiya, T.; Oomori, S.; Ueno, H. Efflux of Soil nitrous oxide from Applied Fertilizer Containing Organic Materials in Citrus unshiu Field in Southwestern Japan. Agriculture 2017, 7, 10. [Google Scholar] [CrossRef]
- Charles, M.J.; Simmons, M.S. Methods for the determination of carbon in soils and sediments. A review. Analyst 1986, 111, 385–390. [Google Scholar] [CrossRef]
- Fageria, N.K.; Baligar, V.C. Methodology for evaluation of lowland rice genotypes for nitrogen use efficiency. J. Plant Nutr. 2003, 26, 1315–1333. [Google Scholar] [CrossRef]
- Japan CROPs. Available online: https://japancrops.com/en/crops/sweet-corn (accessed on 20 October 2023).
- Pereira, N.C.M.; Galindo, F.S.; Gazola, R.P.D.; Dupas, E.; Rosa, P.A.L.; Mortinho, E.S.; Filho, M.C.M.T. Corn yield and phosphorus use efficiency response to phosphorus rates associated with plant growth promoting bacteria. Front. Environ. Sci. 2020, 8, 40. [Google Scholar] [CrossRef]
- Prado, R.M.; Caione, G.; Campos, C.N.S. Filter cake and vinasse as fertilizers contributing to conservation agriculture. Appl. Environ. Soil Sci. 2013, 2013, 581984. [Google Scholar] [CrossRef]
- Omori, W.P.; de Camargo, A.F.; Goulart, K.C.; Lemos, E.G.; de Souza, J.A. Influence of vinasse application in the structure and composition of the bacterial community of the soil under sugarcane cultivation. Int. J. Microbiol. 2016, 7, 2349514. [Google Scholar] [CrossRef] [PubMed]
- Xu, H.L. Effects of a microbial inoculant and organic fertilizers on the growth, photosynthesis and yield of sweet corn. J. Crop Prod. 2001, 3, 183–214. [Google Scholar] [CrossRef]
- Cerri, B.C.; Borelli, L.M.; Stelutti, I.M.; Soares, M.R.; da Silva, M.A. Evaluation of new environmental friendly particulate soil fertilizers based on agroindustry wastes biopolymers and sugarcane vinasse. Waste Manag. 2020, 108, 144–153. [Google Scholar] [CrossRef] [PubMed]
- Carpanez, T.G.; Moreira, V.R.; Magalhães, N.C.; Assis, I.R.; Lange, L.C.; Amaral, M.C.S. Integrated membrane-based processes to obtain organo-mineral fertilizer, water, and energy from sugarcane vinasse. Sep. Purif. Technol. 2022, 302, 122180. [Google Scholar] [CrossRef]
- Andrade, L.C.L.; Putti, F.F.; Cremasco, C.P.; Gabriel Filho, L.R.A.G. New paradigm for vinasse use as fertilizer in hydroponics. Sugar Tech. 2022, 24, 1260–1271. [Google Scholar] [CrossRef]
- Tejada, M.; Gonzalez, J.L. Effects of two beet vinasse forms on soil physical properties and soil loss. CATENA 2006, 68, 41–50. [Google Scholar] [CrossRef]
- Bolan, N.S.; Hedley, M.J.; White, R.E. Processes of soil acidification during nitrogen cycling with emphasis on legume based pastures. Plant Soil 1991, 134, 53–63. [Google Scholar] [CrossRef]
- Mattiazzo, M.E.; da Glória, N.A. Effect of vinasse on soil acidity. Water Sci. Technol. 1987, 19, 1293–1296. [Google Scholar] [CrossRef]
- Gutser, R.; Ebertseder, T.; Weber, A.; Schraml, M.; Schmidhalter, U. Short-term and residual availability of nitrogen after long-term application of organic fertilizers on arable land. J. Plant Nutr. Soil Sci. 2005, 168, 439–446. [Google Scholar] [CrossRef]
- Huang, S.; Zhang, W.; Yu, X.; Huang, Q. Effects of long-term fertilization on corn productivity and its sustainability in an ultisol of southern China. Agric. Ecosyst. Environ. 2010, 138, 44–50. [Google Scholar] [CrossRef]
Figure 1.
Air temperature and precipitation during the corn cultivation period.

Figure 2.
Corn yield (a) and the number of ears harvested by weight (b) in the no fertilizer (NF), chemical fertilizer (CF), liquid waste 1.0 (LW1.0), liquid waste 1.7 (LW1.7), and split application of liquid waste 1.7 (S-LW1.7) treatments during corn cultivation. Values in panel (a) are presented as the mean ± standard error (n = 6). Values in panel (b) represent the total number of corn ears by weight in each treatment. Lowercase letters indicate significant differences (p < 0.05) between different treatments according to Tukey’s test.

Figure 3.
Nitrogen content in corn and its component to stems, leaves and tassels, and ears in the no fertilizer (NF), chemical fertilizer (CF), liquid waste 1.0 (LW1.0), liquid waste 1.7 (LW1.7), and split application of liquid waste 1.7 (S-LW1.7) treatments during corn cultivation. Values are presented as the mean ± standard error (n = 18). Uppercase letters within bars indicate significant differences (p < 0.05) between different treatments according to Tukey’s test for N content in corn ears. Lowercase letters on bars and within bars indicate significant differences (p < 0.05) between different treatments according to Tukey’s test for N content in top of corn plant, and corn stems, leaves and tassels.

Figure 4.
Changes in soil pH (a) and inorganic nitrogen content in the soil (b) in the no fertilizer (NF), chemical fertilizer (CF), liquid waste 1.0 (LW1.0), liquid waste 1.7 (LW1.7), and split application of liquid waste 1.7 (S-LW1.7) treatments during corn cultivation. Values are presented as the mean ± standard error (n = 6). Lowercase letters indicate significant differences (p < 0.05) between different treatments according to Tukey’s test.
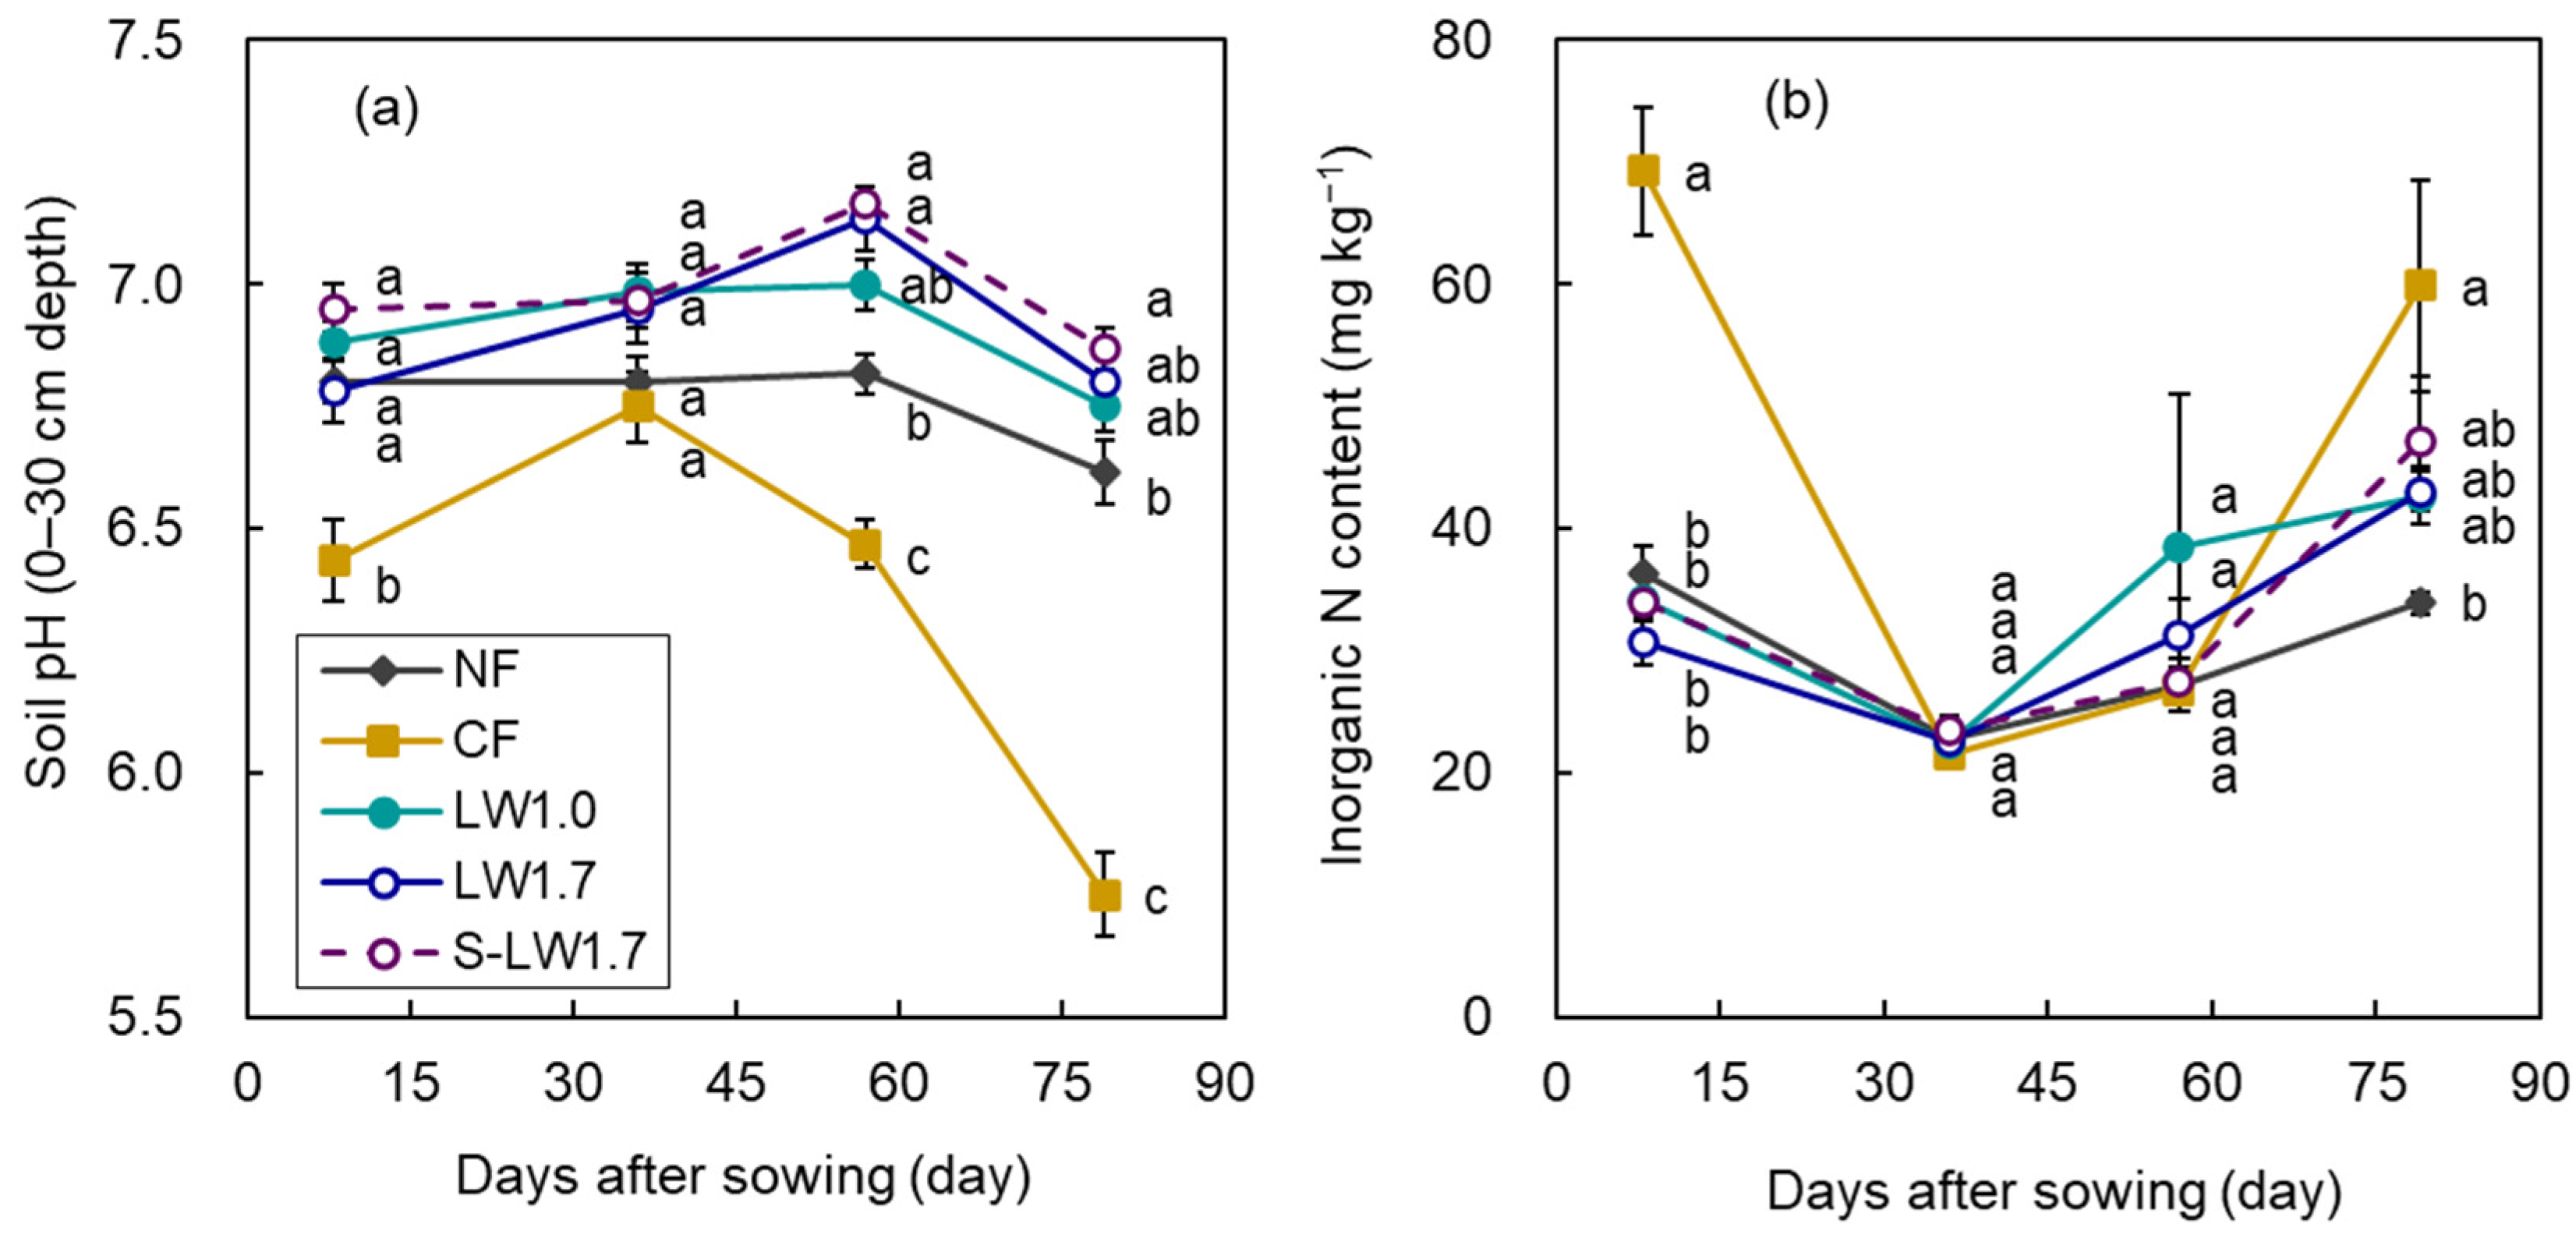
Figure 5.
Soil TN (a), TC (b), and available P2O5 (c) contents at initial stage (8 DAS) and harvest (79 DAS) in no fertilizer (NF), chemical fertilizer (CF), liquid waste 1.0 (LW1.0), liquid waste 1.7 (LW1.7), and split application of liquid waste (S-LW1.7) treatments during corn cultivation. Values are presented as the mean ± standard error (n = 6; however, n = 24 for “before” except for CF). Lowercase letters indicate significant differences (p < 0.05) between different treatments according to Tukey’s test.


Table 1.
Soil physicochemical properties.
| Depth (cm) | Bulk Density (g cm−3) | Soil Texture (IUSS) | Total C (g kg−1) | Total N (g kg−1) | C/N Ratio | CEC a (cmolc kg−1) | ||
|---|---|---|---|---|---|---|---|---|
| Sand (%) | Silt (%) | Clay (%) | ||||||
| 0–24 | 1.17 | 76.3 | 10.1 | 13.6 | 19.4 | 2.21 | 9.04 | 11.1 |
| 24–35 | 1.61 | 82.7 | 7.04 | 10.3 | 3.21 | 1.56 | 2.09 | 7.97 |
| 35–40 | 1.73 | 78.6 | 7.70 | 13.7 | 3.31 | 0.94 | 3.56 | 7.40 |
| 40–75 | 1.54 | 78.5 | 8.37 | 13.1 | 3.74 | 1.52 | 2.48 | 7.50 |
| 75–93 | 1.47 | 68.7 | 6.78 | 24.6 | 3.17 | 1.15 | 2.76 | 9.19 |
| 93–102 | 1.61 | 76.4 | 9.75 | 13.8 | 4.28 | 0.97 | 4.50 | 6.24 |
a Cation exchange capacity; IUSS: International Union of Soil Science.
Table 2.
Amount of fertilizer applied in each treatment.
| Treatment | Abbreviation | Nutrients | Amount of Fertilizer (kg 10a−1) | |||||||
|---|---|---|---|---|---|---|---|---|---|---|
| Days after Sowing (Day) | Total | |||||||||
| −2 | 20 | 29 | 36 | 47 | 58 | 65 | ||||
| No fertilizer | NF | N | 0 | |||||||
| P2O5 | 0 | |||||||||
| K2O | 0 | |||||||||
| Chemical fertilizer | CF | N | 10.0 | 10.0 | 10.0 | 30.0 | ||||
| P2O5 | 10.0 | 10.0 | 10.0 | 30.0 | ||||||
| K2O | 10.0 | 10.0 | 10.0 | 30.0 | ||||||
| Liquid waste 1.0 | LW1.0 | N | 10.0 | 10.0 | 10.0 | 30.0 | ||||
| P2O5 | 1.07 | 1.07 | 1.07 | 3.21 | ||||||
| K2O | 12.9 | 12.9 | 12.9 | 38.7 | ||||||
| Liquid waste 1.7 | LW1.7 | N | 17.0 | 17.0 | 17.0 | 51.0 | ||||
| P2O5 | 1.82 | 1.82 | 1.82 | 5.46 | ||||||
| K2O | 22.0 | 22.0 | 22.0 | 66.0 | ||||||
| Split-application liquid waste 1.7 | S-LW1.7 | N | 8.50 | 8.50 | 8.50 | 8.50 | 8.50 | 8.50 | 51.0 | |
| P2O5 | 0.911 | 0.911 | 0.911 | 0.911 | 0.911 | 0.911 | 5.46 | |||
| K2O | 11.0 | 11.0 | 11.0 | 11.0 | 11.0 | 11.0 | 66.0 | |||
Table 3.
Changes in plant height, number of leaves, and SPAD value in the no fertilizer (NF), chemical fertilizer (CF), liquid waste 1.0 (LW1.0), liquid waste 1.7 (LW1.7), and split application of liquid waste 1.7 (S-LW1.7) treatments during corn cultivation.
Table 3.
Changes in plant height, number of leaves, and SPAD value in the no fertilizer (NF), chemical fertilizer (CF), liquid waste 1.0 (LW1.0), liquid waste 1.7 (LW1.7), and split application of liquid waste 1.7 (S-LW1.7) treatments during corn cultivation.
| Measurement Items | Treatments | Days after Sowing (Day) | ||||
|---|---|---|---|---|---|---|
| 16 | 29 | 44 | 58 | 79 | ||
| Plant height (cm) | N | 19.2 ± 0.24 a | 67.1 ± 0.94 a | 122 ± 1.3 b | 168 ± 1.8 c | N/A |
| CF | 19.6 ± 0.30 a | 63.0 ± 0.84 a | 133 ± 1.4 a | 184 ± 1.4 a | N/A | |
| LW1.0 | 20.1 ± 0.26 a | 62.7 ± 0.90 a | 128 ± 1.5 a | 176 ± 1.4 b | N/A | |
| LW1.7 | 19.5 ± 0.31 a | 62.4 ± 1.02 a | 132 ± 1.0 a | 180 ± 1.0 ab | N/A | |
| S-LW1.7 | 19.7 ± 0.22 a | 62.9 ± 0.88 a | 129 ± 1.2 a | 178 ± 1.0 b | N/A | |
| Number of leaves (number plant−1) | N | 3.8 ± 0.06 a | 7.8 ± 0.13 a | 8.8 ± 0.18 b | 8.8 ± 0.12 a | N/A |
| CF | 3.9 ± 0.05 a | 7.6 ± 0.10 a | 9.0 ± 0.12 ab | 9.1 ± 0.09 a | N/A | |
| LW1.0 | 4.0 ± 0.05 a | 7.8 ± 0.13 a | 8.8 ± 0.16 b | 9.0 ± 0.09 a | N/A | |
| LW1.7 | 3.9 ± 0.04 a | 7.7 ± 0.12 a | 9.4 ± 0.11 a | 9.1 ± 0.09 a | N/A | |
| S-LW1.7 | 3.7 ± 0.06 a | 8.0 ± 0.12 a | 9.4 ± 0.13 a | 9.0 ± 0.08 a | N/A | |
| SPAD value (SPAD) | N | 32.2 ± 0.41 a | 41.2 ± 0.46 ab | 39.4 ± 0.58 d | 37.5 ± 0.78 d | 30.1 ± 1.10 c |
| CF | 32.8 ± 0.43 a | 42.3 ± 0.43 a | 48.4 ± 0.54 a | 48.9 ± 0.69 a | 31.7 ± 1.21 bc | |
| LW1.0 | 32.4 ± 0.40 a | 40.3 ± 0.44 b | 43.6 ± 0.47 c | 41.8 ± 0.72 c | 34.6 ± 1.16 bc | |
| LW1.7 | 32.4 ± 0.46 a | 40.0 ± 0.45 b | 45.7 ± 0.43 b | 43.9 ± 0.70 bc | 34.9 ± 1.19 ab | |
| S-LW1.7 | 32.3 ± 0.38 a | 40.8 ± 0.43 ab | 44.7 ± 0.55 bc | 44.8 ± 0.77 b | 37.0 ± 1.18 a | |
Values are presented as the mean ± standard error (n = 30). Lowercase letters indicate significant differences (p < 0.05) between different treatments according to Tukey’s test. N/A: not available.
Table 4.
Nitrogen availability and use efficiency of corn.
| Treatment | N Input (kg 10a−1) | N Content (kg 10a−1) | N Availability (%) | NUE (kg DW kg N−1) | ||
|---|---|---|---|---|---|---|
| Stems, Leaves and Tassels | Ears | Total | ||||
| NF | 0 | 11.9 | N/A | N/A | N/A | N/A |
| CF | 30 | 16.6 | 100.0 | 29.4 | 10.9 | 40.3 |
| LW1.0 | 30 | 14.1 a | 45.1 a | 21.4 | 10.8 | 32.2 |
| LW1.7 | 51 | 15.2 | 40.5 | 16.6 | 6.9 | 23.5 |
| S-LW1.7 | 51 | 16.5 | 56.9 | 18.2 | 6.9 | 25.1 |
a N availability was calculated using the dry weight obtained from the average of all treatments except LW1.0, because some of the stems, leaves, and tassels of LW1.0 were missing. N/A: not available.
Disclaimer/Publisher’s Note: The statements, opinions and data contained in all publications are solely those of the individual author(s) and contributor(s) and not of MDPI and/or the editor(s). MDPI and/or the editor(s) disclaim responsibility for any injury to people or property resulting from any ideas, methods, instructions or products referred to in the content. |
© 2023 by the authors. Licensee MDPI, Basel, Switzerland. This article is an open access article distributed under the terms and conditions of the Creative Commons Attribution (CC BY) license (https://creativecommons.org/licenses/by/4.0/).
Share and Cite
MDPI and ACS Style
Morita, N.; Toma, Y.; Kato, Y.; Izumiya, T.; Ueno, H. Effects of Organic Liquid Waste Derived from Bioethanol Fermentation on Corn Production. Agronomy 2023, 13, 2904. https://doi.org/10.3390/agronomy13122904
AMA Style
Morita N, Toma Y, Kato Y, Izumiya T, Ueno H. Effects of Organic Liquid Waste Derived from Bioethanol Fermentation on Corn Production. Agronomy. 2023; 13(12):2904. https://doi.org/10.3390/agronomy13122904
Chicago/Turabian StyleMorita, Nobuki, Yo Toma, Yasuhiko Kato, Tooru Izumiya, and Hideto Ueno. 2023. "Effects of Organic Liquid Waste Derived from Bioethanol Fermentation on Corn Production" Agronomy 13, no. 12: 2904. https://doi.org/10.3390/agronomy13122904
Note that from the first issue of 2016, this journal uses article numbers instead of page numbers. See further details here.